Tag: decentralization

  • Commuter tax on Suburbanites Working in Indianapolis?

    According to the Indianapolis Star, Mayor Greg Ballard of Indianapolis is poised to improve the slowing growing city’s competitive position relative to the suburbs.  The Star  noted:

    "Indianapolis may be a bigger draw than surrounding areas in attracting young residents, but it’s got a problem."

    "Right as they begin raising families, many in their 30s split for the suburbs — taking their growing incomes, and the local taxes they pay, to bedroom communities in Hamilton, Johnson, Hendricks and other counties."

    Mayoral Chief of Staff Ryan Vaughn told The Star that initiatives would include a focus on improving schools, and public safety, both of which had much to do with the decades long declines of US central cities. Vaughn told the newspaper that "Ballard wants to focus on strategies to compete more fiercely with suburban counties that draw — and keep — middle- and higher-income residents."

    Certainly, the fact that central cities are far safer today than they were when New York’s Mayor Rudolph Giuliani implemented his much copied policy of intolerance toward crime in the early 1990s. Even so, Mayor Ballard has it right. Long term, sustainable recovery of cities as livable environments within the metropolitan economy requires both good public schools and an environment in which parents feel that they and their children are safe.

    There is a cautionary note however. While the Mayor’s office is on the right track in wanting to solve the endemic problems that have so weakened core cities such as Indianapolis, he has yet to take a position on a proposed commuter tax that would be levied against employees who live in suburban counties and work in the city. This would make the suburbs more attractive for employers who are presently located in the city. Further, it would make the suburbs more competitive to businesses that choose the Indianapolis area for relocation. Trying to attract and keep middle income households, while repelling business makes little sense.

  • Detroit Bankruptcy: Missing the Point

    Nobel Laureate Paul Krugman tells us that “sprawl killed Detroit” in his The New York Times column.
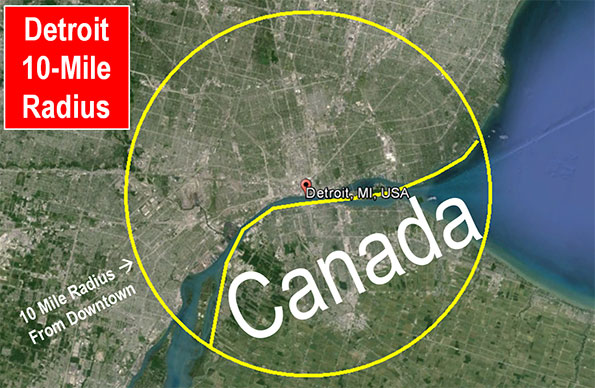
    The evidence is characterized as “job sprawl” – that a smaller share of metropolitan area jobs are located within 10 miles of downtown Detroit than in the same radius from downtown Pittsburgh (see Note on Decentralization and “Job Sprawl”). It is suggested that this kept the city of Pittsburgh out of bankruptcy.

    Not so. The subject is not urban form; it is rather financial management that was not up to par. State intervention may have been the only thing that saved the city of Pittsburgh from sharing Detroit’s fate.

    Detroit and Pittsburgh: Birds of a Financial Feather

    The city of Pittsburgh had been teetering on bankruptcy for some time. In 2004, the city’s financial affairs were placed under Act 47 administration (the Financially Distressed Municipalities Act“) by the state of Pennsylvania. One of Act 47’s purposes is to assist municipalities in avoiding bankruptcy. A 2004 state ordered recovery plan summarized the situation:

    The City of Pittsburgh, already in fiscal distress, now stands on the precipice of full-blown crisis. In August 2003, the City laid off 446 employees, including nearly 100 police officers. City recreation centers and public swimming pools were closed, and services from police mounted patrol to salt boxes were eliminated. In October and November 2003, the City’s credit ratings were downgraded repeatedly, leaving Pittsburgh as the nation’s only major city to hold below-investment-grade “junk bond” ratings. With the City’s most recent independent audit questioning the City’s ability to continue as a going concern, a looming cash shortfall now threatens pension payments and payroll later this year. (emphasis added)

    The good news is that Act 47 has worked so well that the city could soon be released from state control. It may have helped that all of this was overseen by former Democratic Governor Ed Rendell, whose tough administration saved another abysmally-managed municipality when he was mayor of Philadelphia more than a decade before.

    Not everyone, however, is willing to grant that Pittsburgh has solved all its problems. Democratic candidate for mayor of Pittsburgh, Bill Peduto, recently urged Harrisburg to not release the city from Act 47 control. According to Peduto, “the city is not out of the financial woods,” and “we’re still in the middle of it, and in fact we have an opportunity in the next five years to build a sustainable budget for at least a decade.” Given the strong Democratic majority in the city, Peduto will probably be the next mayor.

    The Key: Strong Management

    In Detroit’s case, the state dithered for years, jumping in only when it was too late. Maybe the “tough love” of a Michigan-style Act 47 could have saved Detroit.

    Meanwhile, best of luck to the Detroit bankruptcy court and Pittsburgh’s next mayor. Both were dealt a bad hand by predecessors who said yes to spending interests too often, to the detriment of residents and taxpayers.

    ——–

    Note on Decentralization and “Job Sprawl”

    The dispersed American metropolitan area has performed better than its mono-centric (downtown oriented) urban form of the past. American metropolitan areas are the most affluent in the world, and they are also the most decentralized. Decentralization of employment facilitates mobility, as economists Peter Gordon and Harry W. Richardson found 15 years ago. Work trip travel times are shorter and traffic congestion is less intense in US metropolitan areas than in similar sized metropolitan areas in Western Europe, Japan, Canada and Australia. At the same time, metropolitan areas around the world are themselves becoming more decentralized. The bottom line is that better mobility facilitates greater economic growth, which also reduces poverty.

    Comparing the “job sprawl” of Detroit and Pittsburgh not only misses the point; it also glosses over differences that render any comparison virtually meaningless.

    Detroit is Larger: The Detroit metropolitan area has nearly 60 percent more jobs than the Pittsburgh metropolitan area. Other things being equal, this would mean that Detroit would cover more area than Pittsburgh. As a result, even if the employment densities were equal, a smaller percentage of the jobs would be within 10 miles of downtown Detroit and within 10 miles of downtown Pittsburgh.

    Nearly Half of Detroit’s 10 Mile Radius is in Canada and a Lake:But other things are not equal. Approximately 40 percent of the area within 10 miles of downtown Detroit is in Canada or in Lake St. Clair. Canadian jobs are appropriately excluded from the Detroit “job sprawl” numbers developed by the Brookings Institution (Figure), and no 10 mile radius comparison can thus be made to Pittsburgh.  None of the 10 mile radius from downtown Pittsburgh is in Canada and none of it is in a large lake.

    See Also: Peter Gordon’s Blog: Detroit

  • OECD Cites Shorter US Work Trip Travel Times

    Catherine Rampell of The New York Times describes a new Organization for Economic Cooperation and Development report concluding that Americans have among the shortest work trip travel times in the developed world (Link to chart in The New York Times).

    Out of 23 OECD nations, only three have shorter one way work trip travel times than in the United States. These are Sweden, Denmark and Ireland. These are nations without the larger metropolitan regions that characterize the United States and some other nations. For example, the largest metropolitan area in these three nations, Stockholm, with barely rate among the top 30 in the United States.

    The OECD report confirms similar earlier data, such as from Eurostat on the relative ease of commuting in the United States.

    The US average of 28 minutes to and from work was 10 minutes less than the OECD average and 9 minutes less than Canada. South Korea, with the highest urban densities in the high income world, had an average one-way commute time approximately double that of the United States.

    Among the nations in the survey, the United States has the lowest urban population densities. This reality is at odds with the contentions of some analysts who have associated longer travel times and greater traffic congestion with lower urban population densities.

    But shorter commute times are about more than density. This is illustrated by comparing the Los Angeles and Toronto urban areas. The two urban areas have almost identical population densities, at 7068 and 7040 persons per square mile respectively (2,729 and 2,718 per square kilometer). The density of the core areas is similar with proportions of land areas at above 10,000 persons per square mile (4,000 per square kilometer). The most important differences are that in Los Angeles, the transit commuting share is one third that of Toronto, and automobile commuting is more prevalent. Employment in Los Angeles is much more dispersed, with less than 5% of jobs being in the downtown area (central business district), compared to approximately 15% in Toronto.

    Each of these factors might be thought to contribute to longer commuter times for those in Los Angeles. However, one way commute times in Los Angeles are nearly one-third less than in Toronto. The latest data indicates that the work trip averages 28 minutes in Los Angeles and 40 minutes in Toronto.

    This illustrates important dynamics of commuting and mobility. The keys to shorter commutes in the US are adequate roads, personal mobility (the US has the highest share of travel by automobile) and decentralization (lower density) of both jobs and housing.

    ——
    Addendum:

    Commenting on the same report, the Washington Post’s Brad Plumer stumbled into fantasyland:

    The Department of Transportation found that, in 2009, commutes by private car took, on average, 23 minutes. Public transportation, by contrast, took an average of 53 minutes. You could read that as an argument that more people should drive so that their commutes are shorter or as an argument that we need to bolster public transportation.

    The idea of bolstering transit to equal car travel times is empty romanticism. Today, only 7 percent of metropolitan area workers can reach their jobs in 45 minutes by transit, according to the Brookings Institution (see Transit: The 4 Percent Solution). To cut transit travel times in half, and making it available to all of the metropolitan area is unrealistic.

  • How Cities Grow: Dispersion, not Densification

    Analysts occasionally note that urban areas ("cities") are becoming larger and denser. This is only half right. It is true that most of the world’s urban areas are becoming larger, with megacities like Delhi, Jakarta, Shanghai, Beijing and Manila adding more than five million people in the last decade and most other urban areas are growing, but not as fast.

    Understanding Urban Areas: However almost without exception, urban areas are getting less dense. Because there is so much confusion about city "definitions," a clarification is required. The only geography for which overall urban density can be measured is the urban area, which is the area of continuous development. The urban area is not constrained by municipal or other jurisdictional boundaries and does not include rural (undeveloped) territory, even if it is in a "central city" (such as Rome, Ho Chi Minh or Marseille, with their expansive boundaries). An urban area is also different from a metropolitan area, because metropolitan areas (as labor markets) always include rural territory, which is by definition not urban.

    1960-1990 Data: Historical urban population density is not readily available. Kenworthy and Laube were pioneers in this area, publishing estimates from 1960 to 1990 for a number of urban areas. That data indicates density losses in the more than urban areas for which they were able to develop comparable data. The world average decline was 20 percent, ranging from 15 percent in the United States to 29 percent in Europe and 33 percent in Australia. While Tokyo was doubling in population, its population density was dropping 17 percent between 1960 and 1990. While Zurich was adding 21 percent to its population, it was becoming 13 percent less dense.

    Recent Data: The dispersion continues, which is indicated by these high-income world cases:

    Today, the ville de Paris has 700,000 fewer people than at its peak, and inner London (generally the former London County Council area) has lost more than 1,500,000 people since its peak. All growth has been in lower density suburban areas in both the London and Paris urban areas.

    In the United States, urban areas with more than 1,000,000 population more than doubled in population from 1950 to 2000 (2010 data not yet available), while the population density dropped by nearly one-third. Detailed analysis indicates that this trend has continued over the past decade in New York, Los Angeles, Chicago, Dallas-Fort Worth, Seattle, St. Louis and other major US urban areas.

    The dense core city of Seoul has been losing population and all growth has been in the suburbs, which are lower density.

    The dense urban core of Milan has experience substantial population losses, while the less dense suburbs have captured all the growth.

    Dispersion is not limited to high income urban areas, with declining densities in evidence across lower and middle income nations as well. For example:

    Nearly all of the growth in Jakarta has been in the suburbs for the last 20 years, while the core has gained little in population. The net effect is a less dense, but much larger urban area, because the suburbs are not as dense.

    Nearly all of the growth for 30 years in Manila has been in the suburbs, while the core city. Again, the urban area has become much larger, but much less dense because the suburbs are much less dense.

    The dense core of Shanghai has lost population and all growth has been in the suburbs, which are lower density.

    The population in the dense core of Beijing has nearly stopped growing, with nearly all population in the suburbs, which are lower density.

    The core of Mumbai has lost population in two of the last three census periods, while all growth has been in the suburbs, which are lower density.

    The urban core of Mexico City has been declining in population since 1960 and all of the growth has been in the suburbs, which are less dense.

    The dense core city of Buenos Aires has fewer people today than in 1947, while at least 8 million people have been added to nearly 1,000 square miles of lower density suburbs.

    Urban growth continues to be overwhelmingly in less dense suburban areas, rather than in the more dense urban cores, and as a result even as urban areas grow, they become less dense. This is how cities grow.

  • Final Census Results: Core Cities Do Worse in 2000s than 1990s

    Based upon complete census counts for 2010, historical core municipalities of the nation’s major metropolitan areas (over 1,000,000 population) captured a smaller share of growth in the 2000s than in the 1990s.

    The results for the 50 metropolitan areas (New Orleans excluded due to Hurricane Katrina and Tucson unexpectedly failed to reach 1,000,000 population) indicate that historical core municipalities accounted for 9 percent of metropolitan area growth between 2000 and 2010, compared to 15 percent in the 1990-2000 period. Overall, suburban areas captured 91 percent of metropolitan area population growth between 2000 and 2010, compared to 85 percent between 1990 and 2000.

    Total population growth in the historical core municipalities was 1.4 million, nearly all of it in municipalities with a largely suburban form (such as Phoenix, San Antonio and Charlotte). This compares to an increase of 2.9 million during the 1990s.

    Suburban areas (areas in metropolitan areas outside the historical core municipalities) grew 15.0 million, down from 16.1million.

    Overall, the major metropolitan areas added 14 percent to their populations in the 2000s, down from 19 percent growth in the 1990s. The historical core municipalities grew 4 percent, compared to the 1990s rate of 7 percent. Suburban areas grew 18 percent, compared to the 1990s rate of 26 percent (all data unweighted).


  • Major Metropolitan Areas: Summary of the First 20

    Data is now available for 20 of the nation’s 52 metropolitan areas with more than 1,000,000 population. The early results indicate a pattern of accelerating dispersion of the population to the suburbs as is indicated in the table below. Thus far, historic core municipality growth has been approximately one-half the 1990s rate. During the 2000s, the historic cores have accounted for 8.8 percent of metropolitan growth, down nearly one-half from the 1990s rate.

    Summary of 2010 Census Results
    Major Metropolitan Areas (Over 1,000,000 Population)
    Historical Core Municipalities
    Suburbs
    Metropolitan Areas
    2000-2010
    Population Gain 682,000 7,047,000 7,729,000
    Percentage Increase 6.7% 23.7% 17.7%
    Share of Growth 8.8% 91.2% 100.0%
    1990-2000
    Population Gain 1,229,000 6,718,000 7,948,000
    Percentage Increase 10.8% 30.5% 23.7%
    Share of Growth 15.5% 84.5% 100.0%
    Includes 20 of 52 metropolitan areas released by 3-3-2010

  • Chicago, Portland: Employment Dispersion from Downtown Continues

    New data shows that the downtown areas of both Chicago and Portland (Oregon) are modestly dispersing and losing market share in relation to metropolitan area employment.

    Chicago: The Chicago Loop Alliance reports that private sector employment in the Loop, the core of the Chicago downtown area, fell from 338,000 to 275,000 between 2000 and 2010. An additional 30,000 government workers are employed in the Loop, however 2000 data was not provided for the government sector. As a result of the loss, the Loop private sector share of total Chicago metropolitan area employment fell 13 percent, from 7.7 percent in 2000 to 6.7 percent in 2010.

    The larger downtown area, including areas to the north (North Michigan Avenue area) and to the south had total private sector employment of 480,000. Chicago had the second largest downtown (central business district) in the nation in 2000, with an employment density of more than 160,000 per square mile and a transit work trip market share of 55 percent, trailing only the Manhattan business district (south of 59 Street) and the Brooklyn central business district).

    Portland: The Portland Business Alliance reported that downtown Portland employment had fallen from 86,800 in 2001 to 83,400 in 2009. This represents a four percent market share loss in comparison to the metropolitan area over the period. All of Portland’s growth over the period has been in suburban Clark and Skamania counties in Washington, which added 12,700 jobs, while the Oregon portion of the metropolitan area was losing 4,500 jobs.

    In 2000, Portland had the nation’s 22nd largest central business district, and the 12th highest transit work trip market share, at 30 percent (Brooklyn included).

  • Surprise, Frisco and Beaumont Among Fastest Growing

    The Bureau of the Census has updated its city (municipality or local government area) population estimates for 2009. Predictably, anti-suburban interests saw more indication of the elusive (read non-existent) exodus from the suburbs to the central cities. One analyst even suggested that a “high quality” of life in one central city (Washington, DC) might have kept people from moving to the suburbs. In fact, since 2000, nearly 40,000 people (domestic migrants) have moved out of the city of Washington and in the last year, the city gained 4,500 residents while the suburbs gained 13,700.

    In contrast, Buffalo News reporter Jack Ray looked at the data and noted that some cities in that metropolitan area were growing rather quickly, while others were losing population. Generally, he found that outer suburban communities were growing more quickly. Ray’s analysis was reflective of trends around the nation.

    There are nearly 20,000 incorporated cities, towns and villages in the United States. Population trends in these cities show that urban areas are growing most strongly on their suburban fringes or even in their exurbs. For example, two-thirds of the fastest growing 100 municipalities in the nation were suburbs or exurbs in the nation’s major metropolitan areas (those with more than 1,000,000 population). The other third were all municipalities in smaller metropolitan areas or outside metropolitan areas.

    The extent of this growth on the edge is illustrated by an examination of the nation’s municipalities of 25,000 or greater population that grew more than 25% between 2000 and 2009.

    • Among the 89 municipalities that grew 50% or more, 59 were in major metropolitan areas and all were suburbs (nearly all near the urban fringe) or exurbs. The total population growth among these suburbs and exurbs was 2.2 million from 2000 to 2009, for an average growth rate of 91%. These major metropolitan suburbs and exurbs grew 1.8 million, while the municipalities outside the major metropolitan areas added 400,000.
    • Among the 119 municipalities that grew between 25% and 50%, 69 were in major metropolitan areas. This included 67 suburbs and exurbs. It also included 2 central cities, Raleigh (39%) and Atlanta (28%). These major metropolitan area suburbs and exurbs gained 1.7 million residents, while the two central cities gained a total of 200,000. The municipalities outside the major metropolitan areas grew 1,000,000.

    Combined, the fastest growing suburbs and exurbs with more than 25,000 population grew more than 3.5 million, while the municipalities outside the major metropolitan areas grew 1.5 million, for a combined growth of more than 5.0 million. The smaller high growth municipalities (under 25,000), nearly 1,200 of them, both major metropolitan and outside, grew another 2.5 million.

    The fastest growing municipalities, excluding the two central cities of Raleigh and Atlanta, accounted for nearly one-third of the nation’s growth between 2000 and 20009.

    Most of the fast growing suburbs and exurbs have names that are simply not recognizable. Yet, a half-dozen added nearly as many or more new residents than all of the 20-plus central cities combined in the major metropolitan areas that do not have large swaths of suburbanization inside their borders. These include such places as Phoenix suburb, Surprise, Dallas-Fort Worth suburb Frisco and Riverside-San Bernardino suburb Beaumont.

    In Crabgrass Frontier: The Suburbanization of the United States, Kenneth Jackson noted that central Philadelphia began losing population in the early 19th century. The dispersion of America continues.

    Photograph: Exurbs of New York: Pike County, Pennsylvania

  • Jobs Continue to Decentralize Within America’s Metropolitan Regions

    Since 1998, most major American metropolitan areas have seen a decline in employment located close to the city center as jobs have moved farther into the suburbs.

    A recent report by the Brookings Institution determined that this “job sprawl” threatens to undermine the long-term regional and national prosperity.

    The report analyzes the spatial distribution of jobs in large metropolitan regions and how these trends differ across major industries, in addition to ranking cities according to their amount of job sprawl.

    The report found that only 21 percent of employees work within three miles of downtown. Using the period before the current recession, the report found that while the number of jobs has increased, 95 of 98 metro areas analyzed saw a shift of jobs away from the central core.

    The Brookings Institute argues that “allowing jobs to shift away from city centers hurts economic productivity, creates unsustainable and energy inefficient development and limits access to underemployed workers.” Yet this may be more a matter of Brookings ideology than a likely far more complex reality.

    Job sprawl is greatest both in areas that have clearly declined – such as Detroit – as well as growing regions like Dallas-Fort Worth. Nor does concentration guarantee success, as can be seen by the mediocore performance of the more concentrated New York region. Yet virtually everywhere jobs continue to sprawl, in many cases faster than even population. Maybe it’s time to learn how to adjust to the emerging future rather than yearn for a return to the economic and geographic structure of the last century.