Tag: density

  • OECD Cites Shorter US Work Trip Travel Times

    Catherine Rampell of The New York Times describes a new Organization for Economic Cooperation and Development report concluding that Americans have among the shortest work trip travel times in the developed world (Link to chart in The New York Times).

    Out of 23 OECD nations, only three have shorter one way work trip travel times than in the United States. These are Sweden, Denmark and Ireland. These are nations without the larger metropolitan regions that characterize the United States and some other nations. For example, the largest metropolitan area in these three nations, Stockholm, with barely rate among the top 30 in the United States.

    The OECD report confirms similar earlier data, such as from Eurostat on the relative ease of commuting in the United States.

    The US average of 28 minutes to and from work was 10 minutes less than the OECD average and 9 minutes less than Canada. South Korea, with the highest urban densities in the high income world, had an average one-way commute time approximately double that of the United States.

    Among the nations in the survey, the United States has the lowest urban population densities. This reality is at odds with the contentions of some analysts who have associated longer travel times and greater traffic congestion with lower urban population densities.

    But shorter commute times are about more than density. This is illustrated by comparing the Los Angeles and Toronto urban areas. The two urban areas have almost identical population densities, at 7068 and 7040 persons per square mile respectively (2,729 and 2,718 per square kilometer). The density of the core areas is similar with proportions of land areas at above 10,000 persons per square mile (4,000 per square kilometer). The most important differences are that in Los Angeles, the transit commuting share is one third that of Toronto, and automobile commuting is more prevalent. Employment in Los Angeles is much more dispersed, with less than 5% of jobs being in the downtown area (central business district), compared to approximately 15% in Toronto.

    Each of these factors might be thought to contribute to longer commuter times for those in Los Angeles. However, one way commute times in Los Angeles are nearly one-third less than in Toronto. The latest data indicates that the work trip averages 28 minutes in Los Angeles and 40 minutes in Toronto.

    This illustrates important dynamics of commuting and mobility. The keys to shorter commutes in the US are adequate roads, personal mobility (the US has the highest share of travel by automobile) and decentralization (lower density) of both jobs and housing.

    ——
    Addendum:

    Commenting on the same report, the Washington Post’s Brad Plumer stumbled into fantasyland:

    The Department of Transportation found that, in 2009, commutes by private car took, on average, 23 minutes. Public transportation, by contrast, took an average of 53 minutes. You could read that as an argument that more people should drive so that their commutes are shorter or as an argument that we need to bolster public transportation.

    The idea of bolstering transit to equal car travel times is empty romanticism. Today, only 7 percent of metropolitan area workers can reach their jobs in 45 minutes by transit, according to the Brookings Institution (see Transit: The 4 Percent Solution). To cut transit travel times in half, and making it available to all of the metropolitan area is unrealistic.

  • How Cities Grow: Dispersion, not Densification

    Analysts occasionally note that urban areas ("cities") are becoming larger and denser. This is only half right. It is true that most of the world’s urban areas are becoming larger, with megacities like Delhi, Jakarta, Shanghai, Beijing and Manila adding more than five million people in the last decade and most other urban areas are growing, but not as fast.

    Understanding Urban Areas: However almost without exception, urban areas are getting less dense. Because there is so much confusion about city "definitions," a clarification is required. The only geography for which overall urban density can be measured is the urban area, which is the area of continuous development. The urban area is not constrained by municipal or other jurisdictional boundaries and does not include rural (undeveloped) territory, even if it is in a "central city" (such as Rome, Ho Chi Minh or Marseille, with their expansive boundaries). An urban area is also different from a metropolitan area, because metropolitan areas (as labor markets) always include rural territory, which is by definition not urban.

    1960-1990 Data: Historical urban population density is not readily available. Kenworthy and Laube were pioneers in this area, publishing estimates from 1960 to 1990 for a number of urban areas. That data indicates density losses in the more than urban areas for which they were able to develop comparable data. The world average decline was 20 percent, ranging from 15 percent in the United States to 29 percent in Europe and 33 percent in Australia. While Tokyo was doubling in population, its population density was dropping 17 percent between 1960 and 1990. While Zurich was adding 21 percent to its population, it was becoming 13 percent less dense.

    Recent Data: The dispersion continues, which is indicated by these high-income world cases:

    Today, the ville de Paris has 700,000 fewer people than at its peak, and inner London (generally the former London County Council area) has lost more than 1,500,000 people since its peak. All growth has been in lower density suburban areas in both the London and Paris urban areas.

    In the United States, urban areas with more than 1,000,000 population more than doubled in population from 1950 to 2000 (2010 data not yet available), while the population density dropped by nearly one-third. Detailed analysis indicates that this trend has continued over the past decade in New York, Los Angeles, Chicago, Dallas-Fort Worth, Seattle, St. Louis and other major US urban areas.

    The dense core city of Seoul has been losing population and all growth has been in the suburbs, which are lower density.

    The dense urban core of Milan has experience substantial population losses, while the less dense suburbs have captured all the growth.

    Dispersion is not limited to high income urban areas, with declining densities in evidence across lower and middle income nations as well. For example:

    Nearly all of the growth in Jakarta has been in the suburbs for the last 20 years, while the core has gained little in population. The net effect is a less dense, but much larger urban area, because the suburbs are not as dense.

    Nearly all of the growth for 30 years in Manila has been in the suburbs, while the core city. Again, the urban area has become much larger, but much less dense because the suburbs are much less dense.

    The dense core of Shanghai has lost population and all growth has been in the suburbs, which are lower density.

    The population in the dense core of Beijing has nearly stopped growing, with nearly all population in the suburbs, which are lower density.

    The core of Mumbai has lost population in two of the last three census periods, while all growth has been in the suburbs, which are lower density.

    The urban core of Mexico City has been declining in population since 1960 and all of the growth has been in the suburbs, which are less dense.

    The dense core city of Buenos Aires has fewer people today than in 1947, while at least 8 million people have been added to nearly 1,000 square miles of lower density suburbs.

    Urban growth continues to be overwhelmingly in less dense suburban areas, rather than in the more dense urban cores, and as a result even as urban areas grow, they become less dense. This is how cities grow.

  • Urban Densities Exclude Rural Areas: Avent Postscript

    We recently noted that Ryan Avent was one third right in his recent Sunday New York Times article on urban density. Avent has posted a response suggesting that it is inappropriate to use average urban densities in urban productivity analyses, as we had done, but that "weighted average densities" should be used instead. Weighted average density was not mentioned in his New York Times article.

    In the interim, we were able to find the studies on urban density and productivity that seem to match those Avent refers to in his New York Times article. There are two studies concluding that doubling employment (not population) density increases productivity by six percent (Ciccone & Hall, 1996 and Harris & Ioannides, 2000), as Avent noted.  Another study (Davis, Fisher & Whited, 2007) indicates that doubling employment densities could increase productivity by as much as 28 percent, also as Avent noted.

    Urban and Rural Density Combined Are Not Urban Density: In contrast to Avent’s preference for weighted average density, each of the studies uses average density, like with our analysis. More importantly the econometric formulas in the studies do not include an urban density variable. The density variables in all three studies include rural areas.

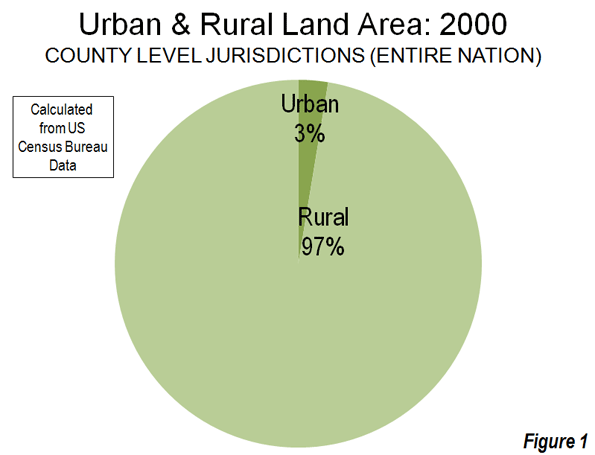
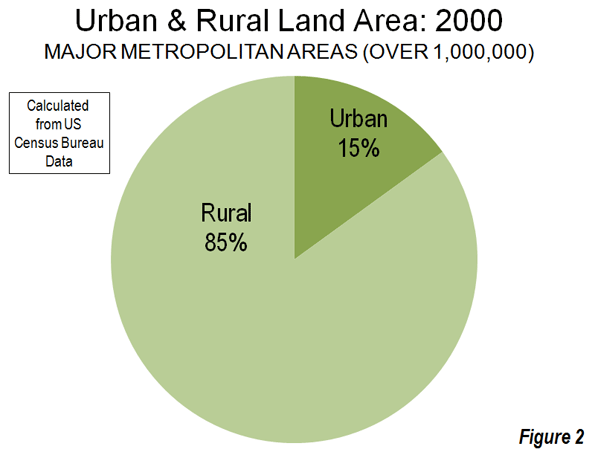
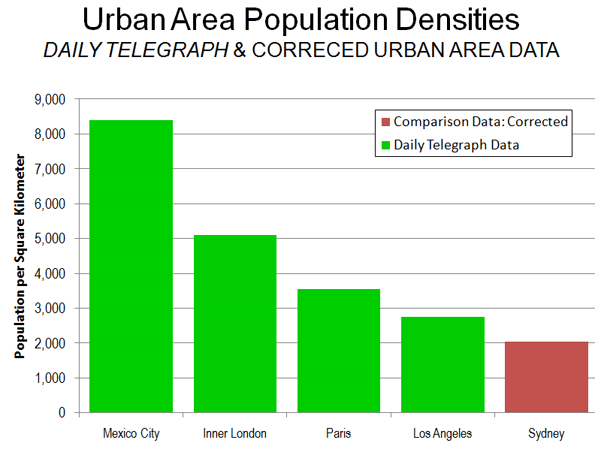
    The studies use county, metropolitan area and sub-metropolitan area densities, each of which contain far more rural land than urban land. By definition, urban areas exclude rural areas and, as a result, the moment rural areas become a part of the calculation, the result cannot be urban densities. In 2000, Census Bureau data showed counties (county equivalent level jurisdictions), which comprise the entire nation, to be less than three percent urban and more than 97 percent rural (Figure 1). Metropolitan areas also have a similar predominance of rural land (Figure 1). Among major metropolitan areas (those with more than 1,000,000 population) in 2000, approximately 85 percent of the land was rural and 15 percent of the land was urban (Figure 2).

    Ciccone & Hall use employment density at the county level and thus mix urban and rural densities. Harris & Ioannides use employment densities at the metropolitan statistical area or the primary metropolitan statistical area level (a sub-metropolitan designation since replaced by the more appropriately titled "metropolitan division"). Davis, Fisher & Whited use employment densities at the metropolitan statistical area level. The two studies using metropolitan areas or parts of metropolitan areas also mix urban and rural densities.

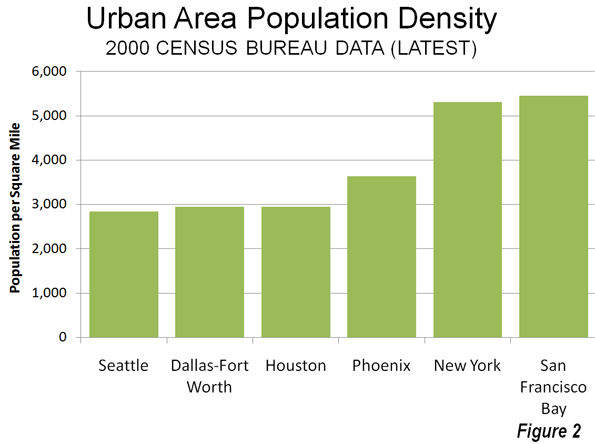
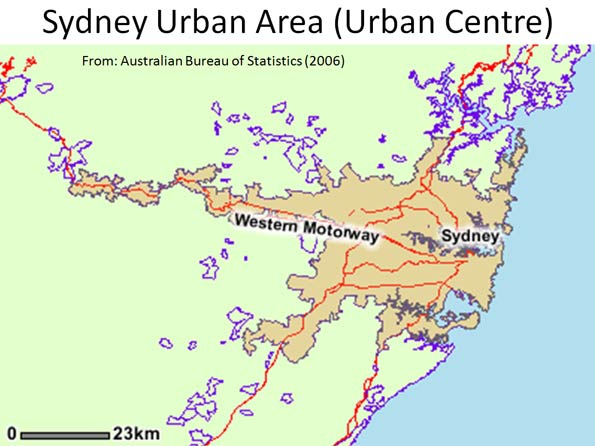
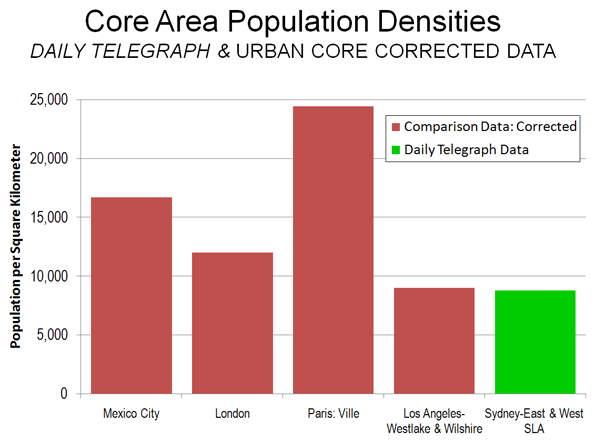
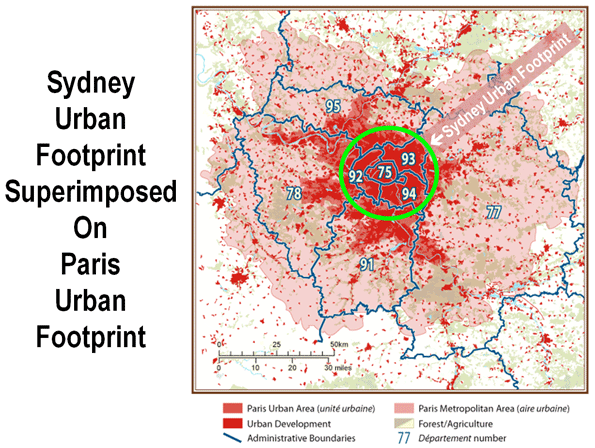
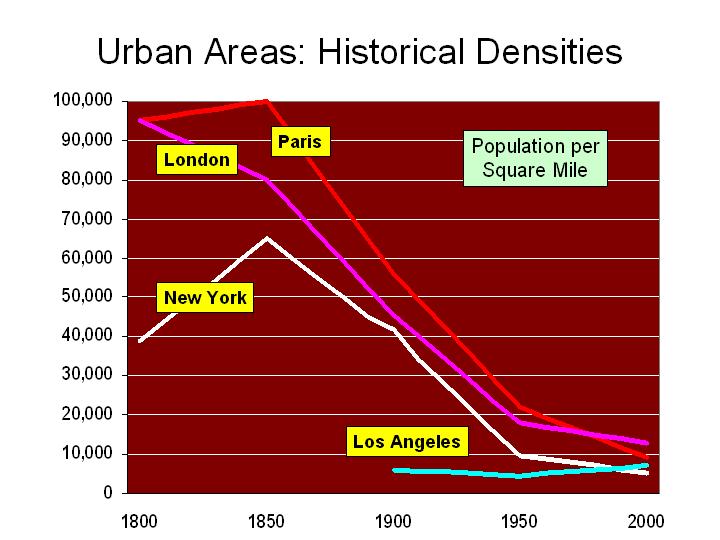
    Urban Area Densities: Urban density is calculated at the urban area level, which is the area of continuous urban development. This is also called the urban footprint, which is generally indicated by the lights of the city one would see from an airplane on a clear night. Urban areas are delineated using the smallest census geographical units ("census blocks," which are smaller than census tracts) each ten years. The 2010 data will be released next year. Among urban areas, the highest density core urban area in a major metropolitan area (Los Angeles) is approximately four times the lowest (Birmingham).

    Nonsensical Metropolitan Area Densities: Theoretically, metropolitan areas are labor market areas, which include a core urban area (and sometimes more than one urban area) and nearby rural areas from which people commute to work in the urban area (can be called the "commuter shed"). However, in the United States, metropolitan areas are too coarsely defined for density comparisons with one another. US metropolitan areas are composed of complete counties or, in the six New England states, complete towns. This jurisdictionally based criteria can produce metropolitan areas that are much larger than genuine labor markets in a number of cases and some that are smaller. American metropolitan areas are not spatially consistent by any functional labor market definition. Metropolitan densities are thus nonsensical, no matter what density is being measured (such as population or employment density). Among major metropolitan areas, the highest density metropolitan area (New York) is 24 times that of the lowest density (Salt Lake City), six times the maximum difference in urban area density.

    Metropolitan Ireland and Happenstance: In the similarly sized San Francisco (as used by Davis, Fisher and Whited) and Riverside-San Bernardino metropolitan areas, San Francisco has 1,700 square miles of rural land, while Riverside-San Bernardino has 26,000, approximately 15 times as much. At more than 27,000 square miles, Riverside-San Bernardino covers more land area than the Republic of Ireland. The difference in population densities between metropolitan areas is determined in considerable measure by the size (land area) of the included counties, not by the number of people in cities.

    If the state of California were to carve out a new county composed of western Riverside and San Bernardino counties (as Colorado created Bloomfield County in the early 2000s), the land area of the metropolitan area could be reduced 95 percent, because the remainder would not meet the criteria for inclusion in Riverside-San Bernardino. The importance of the density variable for Riverside-San Bernardino in econometric formulas would be increased many times. With only 3,100 county level jurisdictions of varying sizes, this kind of incomparability cannot help but occur. The boundaries of metropolitan areas are defined by political happenstance.

    On the other hand, the nation’s urban areas are built up from 7,000,000 census blocks. This permits a fine grained definition that makes urban areas appropriate for density comparisons. The definition of urban areas is beyond political fiat.

    Metropolitan areas in the United States could be readily defined at the census block level, just like urban areas. Regrettably, the Office of Management and Budget missed another opportunity in the 2010 census to make the necessary criteria change. U.S. metropolitan area data is of great value for most analysis, but misleading for spatial or density analysis.

    Low-Density Productivity: Subregionalizing the density and productivity analysis would pose problems. Avent uses household incomes as his standard (and we agree that cost of living differentials are important). The San Jose metropolitan area has the highest household incomes of any major metropolitan area and would therefore be among the most productive. Yet, San Jose’s automobile-oriented Silicon Valley, to which much of the productivity is attributable, has a far lower employment density than the transit and pedestrian oriented cores of Manhattan and San Francisco (and yes, even not-so-transit oriented downtown Phoenix). In low-density Seattle, Microsoft’s automobile oriented Redmond campus probably ranks among the most productive real estate in the country, yet its employment density (like that of Silicon Valley) pales by comparison to the higher density cores of Seattle, Phoenix, Nashville, Oklahoma City and virtually every other downtown core of a major metropolitan area.

    At the End, Agreement: Avent concludes, "I just want to make sure we stop costing ourselves easy opportunities for growth." I could not agree more. It is time to abandon regulations that artificially raise housing prices, deprive households of a better standard of living, and drive them to places they would rather not live. For centuries, people have flocked to urban areas for better economic opportunities. Urban areas should be places where people can realize their aspirations, not places that repel them because it doesn’t suit the interests of those already there.

  • Avent on Cities: Understanding Part of the Equation

    Ryan Avent hits a home run, strikes out and earns a "yes, but," all in the same article ("One Path to Better Jobs: More Density in Cities") in The New York Times.

    A Home Run on Housing Regulation: Avent rightly notes that the land-use and housing regulations of metropolitan areas like San Francisco have not only driven housing prices higher, but also negatively impacted economic growth. Studies in the UK, the US and the Netherlands have demonstrated that significant restrictions on land use (called smart growth or urban containment) lead to reduced employment and economic growth in metropolitan areas. His comparison to OPEC is "right on" – that metropolitan areas like San Francisco have squeezed the supply of housing, which, of course, drives up house prices, just as restricting the supply of any good or service in demand will tend to do. Avent is also right in noting that high housing prices have driven huge numbers of people out of the San Francisco Bay Area to places like Phoenix. According to the Census Bureau, nearly 2,100,000 people moved from Los Angeles, San Francisco, San Diego and San Jose between 2000 and 2009 to other parts of the country.

    Striking Out on Density: The strikeout results from assumptions that are patently wrong. Cities (urban areas) do not get more dense as they add population. They actually become less dense. For example, the New York urban area has added 50 percent to its population since 1950, yet its population density has dropped by 45 percent (Figure 1). Between 2000 and 2010, most metropolitan population growth, whether in San Francisco, New York, Phoenix, Portland or Houston, was in the lower density suburbs (see: http://www.city-journal.org/2011/eon0406jkwc.html ). The same dispersion is occurring virtually around the world (see: http://www.demographia.com/db-evolveix.htm), from Seoul, to Shanghai, Manila and Mumbai. Rapid urban growth would mean even further dispersion and lower densities, not the higher density neighborhoods Avent imagines. Nonetheless, allowing the more affordable detached housing that people prefer would likely lead to stronger economic growth and more affluent residents in the San Francisco and other over-regulated metropolitan areas.

    A "Yes, But" on Productivity: Any comparison of incomes between metropolitan areas needs to take into consideration the cost of living. For example, the San Francisco Bay Area (San Francisco/San Jose) is one of the most expensive places to live in the country. The median house price is more than 2.5 times that of Phoenix, after accounting for income differentials. Avent does not control for the difference in the cost of living, which is largely driven by the higher cost of housing. The lower cost of living neutralizes much of the impact of lower incomes (such as in Houston) in metropolitan areas like Houston, Dallas-Fort Worth, Indianapolis, etc., where the OPEC model has not been applied to land use regulation.

    Finally, even controlling for the cost of living, there are substantial exceptions to any density-productivity thesis. For example, some of the greatest productivity gains information technology have come out of the Seattle area, which is the least dense major urban area in the 13 Western states, less dense than Houston, Dallas-Fort Worth and Phoenix. Even more impressively, Seattle’s urban density is barely one-half that of New York or San Francisco (Figure 2), yet its gross domestic product per capita is higher than New York and within 2 percent of San Francisco/San Jose. Seattle’s substantial contribution to the nation’s productivity has occurred while its population density was declining nearly 15 percent (since 1980).  

    Avent, like many analysts before appears to presume that population growth means higher densities. In fact, urban areas grow by dispersing, not densifying.

  • Planning Decisions Must be Based on Facts

    While the misreporting of city population density comparisons commented on by  Wendell Cox was probably inadvertent, it is indicative of a general problem relating to contemporary planning – misrepresentation of facts.

    We are repeatedly told of the wonderful results of infill high density policies in locations such as Portland, USA or Vancouver, Canada which on investigation are found to be non-existent or applicable only to a small locality instead of to the city as a whole.

    Quantitative data is frequently misrepresented. To give one example, a 2008 Canadian study is often quoted as proving high-density reduces greenhouse gas emissions. Inspection and interpretation of the data provided reveals this to be negligible.  Without any evidence to the contrary, it seems reasonable to assume that the Canadian fraction of total household emissions that relate to transport is similar to that shown on the Australian Conservation Foundation’s website, being 10.5%. Applying this value to the data in Chart 2 of this Canadian study one finds that for those living within 5 km of the city centre there would be a transport difference attributable to increased density of only 1% in total annual emissions per person. For people living 20 km or more from the city centre the difference would be much less at 0.2%.

    We are told that high-density imposed on areas originally designed for low density is good for the environment; that it provides greater housing choice, that it reduces housing cost, that it encourages people on to public transport; that it leads to a reduction in motor vehicle use and that it saves on infrastructure costs for government. Not only do none of these claims stand up to scrutiny in any significant way, the contrary mostly prevails.

    Movements advocating high-density show characteristics of an ideology, their members’ enthusiasm resulting in a less than objective approach. The desire by these individuals to be socially and environmentally responsible and to identify with a group marketing these imagined benefits is understandable. Some may even benefit professionally. However the result is policies for which no objective favorable justification can be provided and which are not wanted by the greater community who have to live with the consequences.

  • Misunderstanding the Geography of Sydney, Paris, Mexico City, Etc.

    Sydney’s Daily Telegraph announced on April 20 that Sydney is more dense than Mexico City, London, Los Angeles and Paris. Of course, anyone who has been to Mexico City or London knows that this is untrue and it may surprise some that Sydney is not even as dense as Los Angeles.

    The article never indicates, quite for sure, what it means by Sydney, the Sydney city council area (the urban area’s core local government authority, or LGA) or the Sydney urban area. Nor does the article provide an overall density, instead only indicating that there are 8,800 persons per square kilometer in "Sydney’s east" and 7,900 per square kilometer in "Sydney City’s west."

    In fact, the figures are from the latest statistical local area estimates of the Australian Bureau of Statistics (ABS) for 2010, and dated March 31, 2011. A "statistical local area" is a part of an LGA (See map: Sydney Local Government Area). The statistical local areas cited by The Daily Telegraph are Sydney-East and Sydney-West, which have a combined density of 8,300 per square kilometer. The small size of the Sydney-East and Sydney-West statistical local areas is illustrated by the fact that each is about the same size as the Sydney Olympic Park.

    Comparing Urban Area Densities: The Daily Telegraph’s contention results from a profound misunderstanding of urban geography. The result was a comparison of urban geographies that are not comparable.

    The Daily Telegraph compares the density of these two small areas of the Sydney LGA, with the urban area densities of Mexico City (which the Daily Telegraph places at 8,400), London (5,100), Los Angeles (2,750) and Paris (3,250). These figures were taken from an earlier edition of Demographia World Urban Area. (Our latest Demographia World Urban Area data, including estimated population densities for all urban areas in the world of more than 500,000 population is here). Urban areas are areas of continuous urban development.

    The appropriate Sydney geography for comparison to the urban area populations of Mexico City, London, Los Angeles and Paris is the urban area (the international term), which is called the urban centre by ABS (See map: Sydney Urban Area).

    The Sydney urban centre covers an area extending south to Campbelltown, north to Palm Beach and well into the Blue Mountains on the Great Western Highway. According to the ABS, the Sydney urban area (urban centre) had a population of 3.641 million in 2006 (latest available data), and covered a land area of 1,788 square kilometers. This means that the population density of the Sydney urban area was 2,037 in 2006. Thus, the Sydney urban area has a lower density than all four international urban areas used in The Daily Telegraph comparison (Figure 1).

    If the Sydney urban center were as dense as the Los Angeles urban area, the population would be 5 million, instead of 3.6 million. If the Sydney urban centre were as dense as the Mexico City urban area, the population would be 15 million.

    Comparing Core Densities: The small area densities that The Daily Telegraph cites are also smaller than those that exist in the core areas of the cited international urban areas (Figure 2).

    • In Mexico City, the delegation (district) of Ixtacalco has a population density double that of the Sydney-East and Sydney West statistical local areas (approximately 17,000), in an area nearly twice as large.
    • The 2001 census placed the inner London borough of Kensington and Chelsea at 12,000 persons per square kilometer, in an area approximately the same size as Sydney-East and Sydney-West combined.
    • The ville de Paris has a population density of more than 24,000 per square kilometer, nearly three times that of the combined Sydney-East and Sydney-West statistical local areas. The ville de Paris covers approximately eight times as much land area and smaller area densities are even higher.
    • The 2000 census placed the adjacent Wilshire and Westlake Community Districts of Los Angeles at 9,000 per square kilometer. This is slightly higher than the density of the combined Sydney-East and Sydney-West statistical local areas, in an area nearly four times as large.

    The Sydney urban center and statistical local area data is summarized in the table.

    The Australian Population Debate: An important public policy debate is under way in Australia on the issue of population growth. As Ross Elliot indicated (Malthusian Delusions Grip Australia), some interests believe that the nation is running out of land. In fact, only 0.3 percent of Australia’s land area is urban, a figure one-tenth that of the United States. The starting point for these discussions needs to be valid data and an understanding of the terms involved.

    SYDNEY URBAN CENTER & DENSE STATISTICAL LOCAL AREAS
    Areas Cited by The Daily Telegraph
      2006 Population Land Area (Square Kilometers) Density 2010 Density
    Sydney-East Statistical Local Area         46,738                6.0       7,790          8,799
    Sydney-East Statistical Local Area         38,382                5.7       6,734          7,852
    Combined         85,120               11.7       7,275          8,338
    Share of Sydney Urban Area (Urban Centre) 2.3% 0.7%
    Balance of Urban Area (Urban Centre)     3,556,301          1,776.4       2,002 Not Available
    Total Sydney Urban Area (Urban Centre)     3,641,421          1,788.1       2,036 Not Available
    Notes: 
    Data from Australian Bureau of Statistics
    Urban centre data available only for census years
  • Special from Sydney: Misunderstanding Paris

    Reporters, columnists and even consultants often misunderstand urban areas and urban terms. The result can be absurd statements that compare the area in which the writer lives to somewhere else where the grass is inevitably greener, bringing to mind an expensive competitiveness report that suggested St. Louis should look to Cleveland as a model. Sometimes this is the result of just not understanding and other times it results from listening to itinerant missionaries from idealized areas who have no sense of the reality.

    A most recent example is from the Sydney Morning Herald, one of Australia’s largest and most respected newspapers.

    Columnist Elizabeth Farrelly told her readers that Paris covers one-quarter the land area (urban footprint) of Sydney and has a population of 5.5 million. In fact, the urban footprint of Paris is at least five times larger and the population nearly double.

    According to the Institut national de la statistique et des études économiques (INSEE), the statistics bureau of France, the urban footprint of Paris was 2,723 square kilometers in 1999 and the population in that area was 10,143,000 in 2006 (both figures are the latest data available).

    In contrast, according to the Australian Bureau of Statistics (ABS), the statistics bureau of Australia, the urban footprint of Sydney was 1,788 square kilometers in 2006. However, even the 50 percent larger urban footprint of Paris may actually understate the difference, because ABS uses a lower population density threshold than INSEE for urban versus rural classification. The difference between the two urban footprints is shown in the figure below.

    Ms. Farrelly also decried the continuing sprawl that she perceives in Sydney, despite the fact that no urban area in the new world, except perhaps Vancouver, has shut down home construction on its fringe to a greater degree (nor even has Paris). The effect of Sydney’s development Berlin Wall is housing affordability so bad that it is second only behind Vancouver out of nearly 275 metropolitan areas in the 6 nations we cover in the Demographia International Housing Affordability Survey.

  • Sydney: Choking in its Own Density

    The Daily Telegraph reports that air pollution is getting worse in Sydney, with one in ten days rating “poor” in 2009. Critics of the ruling Labor state government claim that increasing air pollution and the lack of public transport are the cause. They are half right.

    Sydney’s Densification is Intensifying Traffic Congestion: Sydney’s intensifying traffic congestion contributes substantially to rising air pollution.

    The increasing traffic congestion is an inevitable consequence of the state government’ s “metropolitan strategy” which is “jamming” high rise residential buildings into suburban detached housing neighborhoods. The mathematics of traffic and densification is that unless each additional resident drives minus kilometers and minus hours, there will be more traffic, even before considering the impacts of intensifying commercial and heavy vehicle traffic.

    The road system was not built for higher densities and neither was other infrastructure such as sewers or the water system, as Tony Recsei has noted in his preface to the 6th Annual Demographia International Housing Survey.

    The fact is that higher densities are strongly associated with more traffic, which means greater traffic congestion. The additional stop and go traffic produces greater pollution on the roads adjacent to which people and their children live. It also means more greenhouse gas emissions, because fuel consumption increases as traffic congestion intensifies.

    The association between higher densities and greater traffic congestion is also indicated by the ICLEI-Local Governments for Sustainability Density-VMT Calculator, based upon Sierra Club research. According to the Calculator, under the urban consolidation (“smart growth”) scenario, residential housing would be 37 housing units per hectare, as opposed to its “business as usual” scenario at a density of 10 housing units per hectare. The density of traffic (vehicle kilometers per square kilometer) under the higher density “urban consolidation” strategy would be 2.5 times as high as under the “business as usual” scenario.

    According to federal Bureau of Transport and Regional Economics, Sydney’s total traffic volume is projected to increase nearly 20% over the next decade. Nearly half of the increase will come from commercial and heavy vehicles. With little or no expansion of the urban footprint, there will be nowhere for the new traffic to go except onto the existing already over-crowded roadways.

    Stuck in Sydney’s Traffic: Already, the average one-way trip to work in Sydney is longer than in all but one of the 52 metropolitan areas in the United States with more than 1,000,000 population. Only New York takes as long as Sydney, because so many people use public transport, which is inherently slower for nearly all trips.

    Of Blind Faith: Public Transport: Public transport serves as an article of faith to which officials cling in the innocent or cynical hope that it can reduce traffic congestion. There is no doubt of the good that public transport can do to get people to the central city (CBD), with its highly concentrated employment. However, Sydney’s CBD oriented system is over-crowded. A succession of state governments have been incapable of providing sufficient service to make the trip comfortable for the less than 20% of Sydney employees who work there. Proposals to centralize more of Sydney’s employment in the CBD could not be more wrong-headed.

    Transit is about the CBD, whether in Sydney, Toronto, Portland or Atlanta. The public transport system capable of attracting a significant number of commuters to the smaller concentrated centers like Chatswood, Parramatta, or Norwest (much less the dispersed employment throughout the rest of the metropolitan area) has never been conceived, much less seriously proposed or built.

    Why We Regulate Air Pollution: Public health was the very justification for regulating air pollution. Air pollution’s negative impacts are principally local. The consequences are measured reduce the quality of life of people intimately exposed to the more intense air pollution from nearby roads.

    Higher densities come with a price. Higher densities are producing greater traffic congestion, higher levels of air pollution and greater public health risks. This is just the beginning.

    Photograph: Strathfied, Sydney: Densification of detached housing neighborhood.