Tag: Detroit

  • Can the Winnipeg Model Save Detroit?

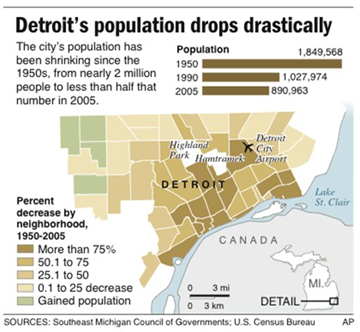
    Detroit, not only in the US but across the globe, has become the poster child for urban decay.  The city lost 25% of its population between 2000-2010, and over half its population since 1950.  Over 90,000 houses stand empty, and many neighborhoods have been completely abandoned. 

    The burden of maintaining infrastructure and law enforcement in a city with an eroding tax base and sparse population has lead to attempts to “shrink” the city.  This means bulldozing several areas of the city, and relocating existing residents.  Current Mayor Dave Bing realizes this, and has pledged to knock down a staggering 10,000 structures during his first term.  In the past such slum clearances lead to vigorous opposition from urbanists like Jane Jacobs, who argued that top down approaches to urban redevelopment would cause a great deal of pain, for little to no benefit.  Yet despite the fact that Jacobs is widely admired by planners, the plan to shrink the city has met with little opposition in Detroit.  Frankly, unless Detroit sees a major population surge, shrinking the city may sadly be necessary.  

    Last week, New York Mayor Michael Bloomberg appeared on NBC’s Meet the Press, and at one point mused about using immigration policy to repopulate the city.   Bloomberg didn’t offer a substantive policy proposal, but the premise makes perfect sense.  Most of Detroit’s problems stem from the fact that fewer and fewer people are working and paying taxes in the city.  There is more infrastructure than people need or the city can afford. 

    Ultimately the issue then is getting people to live in Detroit. But the biggest problem, even with a mild resurgence in the auto sector, is that Americans, and even most Michiganders, don’t want to live in Detroit, even with jobs.

    But for many immigrants, Detroit would seem like a major upgrade over their current living situation. This is not as far-fetched a notion as some may believe. Here’s a proposal for Detroit based on an unlikely Canadian immigration success story: Winnipeg.

    Learning from Winnipeg

    When Americans think of Winnipeg, they think of white guys wearing earmuffs in July, speaking with the kind of Canadian accents typically ridiculed on American sitcoms.  When Canadians from outside of Manitoba think of Winnipeg, they think of a former industrial city that is hardly a draw to the much sought after “creative class” even though  the city has the nation’s lowest housing cost.  What no one from outside the city associates with Winnipeg is immigration.

    Winnipeg’s immigration success is not well known outside of the province, but it is hard to dispute the facts.  Smart immigration policies have helped Winnipeg stabilize its population and reverse the city’s decline.

    Between 1971-1996, the city of Winnipeg grew by just under 16%, or roughly 0.6% per year.  Like many North American cities, all of the growth was taking place in the suburbs.  In fact, the population of Downtown Winnipeg shrunk by 23.25% during that period.  Though the rate of decline is nowhere near that of Detroit, the causes and effects are similar.  Manufacturing declined; people moved to the suburbs, aided by highway expansions and low cost automobiles; residents moved to more entrepreneurial cities, such as Calgary; ensuing job and population decline lead to a decline in safety.  The most notable difference is that racial tensions in Detroit exacerbated suburban flight.  But the similarities are sufficient to use Winnipeg as a model.

    Using immigration to reverse population decline in Manitoba

    In 1998, the Province of Manitoba introduced the Provincial Nominee Program, which gave the province the ability to recruit immigrants over and above federal immigration quotas.  Since Manitoba was not seen as the most attractive place for new immigrants to settle, only 1.8% of immigrants to Canada settled in the province between 1996-2000 (Note 1).  Since the introduction of the nominee program, immigration to the province has increased by 250%.  The increase in the City of Winnipeg has been staggering.  In the years 1996-2000, the city saw 15,809 new immigrants.  In just one year, 2007-2008, the city attracted 16,585 immigrants.  Equally as important, 78% of Manitoba immigrants stay in the province, which is a significant improvement over the 1980s, when they had a retention rate of less than 50%.  Increased immigration ended Manitoba’s population stagnation, and the province now enjoys consistently positive net migration.

    Economic outcomes of Manitoba immigrants

    A survey of immigrants who migrated to Manitoba through the provincial nominee program shows promising results.  Three quarters of participants surveyed have never experienced involuntary unemployment.  Of those surveyed, 85% were employed, and 7% were in school.  While the average annual household income of $49,066 for participants is lower than the provincial average of $60,242, they are generally making enough money to live reasonably well, contributing to the provincial and municipal tax bases. 

    Reasons for the program’s success

    Of course, mass immigration often creates challenges for recipient regions.  Aside from the need for immigrants to find jobs, they also often require language training, and educational upgrading to meet certification levels for their professions. However, the success of the program shows that participants were by and large able to overcome these difficulties.  Some of this can likely be attributed to the fact that immigrants of similar backgrounds tended to cluster together, some integrating into communities with existing settlers of similar backgrounds.  The primary examples of these two patterns are the concentration of Filipino immigrants in Winnipeg, and the large number of Mennonites from Germany, Mexico, and South America who integrated into existing Mennonite communities.  This can be important, since it allows for them to develop, or take advantage of informal support networks.  Living in a community with speakers of the same language makes it easier for immigrants whose first language is not English to integrate into the community, and can help with finding employment. 

    Benefits of targeted immigration to Detroit

    Immigration is often a source of innovation and entrepreneurship.  Recent studies have shown that immigrant entrepreneurs in America have created more jobs for existing Americans than  for other    immigrants.  More people moving to Detroit would also mean more customers for the service industry in the city.  And by paying property taxes, they would help to keep the city government afloat.  Perhaps the most important benefit would be that more people generally would make the city safer.  Criminals, after all, hate witnesses. 

    Hopeful signs from recent immigration to Detroit

    Recently, Detroit has experienced an influx of Latino and Muslim immigration.  Despite the stigma attached to these groups by many Americans, anecdotal evidence suggests that these newcomers have been a boon to the city.  According to the Immigration Policy Center, Arab American employment now contributes $7.7 billion to the Detroit metro economy, and provides $544 million in tax revenue to the state.  They now support over 140,000 jobs in the city.  Latino immigrants are being credited with helping to revitalize Southwest Detroit, which saw $200 million of investments between 1993-2008, and the area’s population grew by nearly 7% between 1990-2000 even as most of the city declined.  The City is now home to nearly 50,000 Latinos, up from under 20,000 in 1990.    

    And for those who claim immigrants take American jobs, the evidence suggests the opposite.  Despite the fact that immigrants have lower average wages than non-immigrants, they manage to have a disproportionate economic impact in many cities, Detroit being one of the best examples.  According to the Fiscal Policy Institute, immigrants contribute 1.3 times as much to the economy per capita as non-immigrants in Detroit.  This means, among other things, they disproportionately create jobs and contribute to the tax base.    

    Policy recommendations

    Creating a targeted immigration program would require co-operation between municipal, state and federal governments.  The policies recommended here are one set of options among many.

    • The federal government should create an ”urban revitalization” visa category to allow for municipalities with severe demographic declines to accept immigrants without counting them towards immigration quotas.
    • The state of Michigan, or other similarly challenged states, should create a specific program modeled on Manitoba’s provincial nominee program.
    • Immigrants should be required to prove that they have the financial means to support themselves for a specified amount of time in the absence of income.  This would ensure that they didn’t burden the existing welfare system.
    • Participants in the program could be required to undertake language training at their own expense, or to prove a basic competence in English. 
    • The City of Detroit should move more aggressively towards allocating abandoned buildings to provide housing or places for businesses of immigrants, or anyone else who wants to occupy them for that matter.  Filling buildings means more property taxes.
    • The City should concentrate on settling new immigrants of similar ethno-linguistic backgrounds into specific underpopulated areas.  Rather than simply allowing a certain number of immigrants into the city, they could create zones with high vacancy levels, and allow immigrants who apply to the program to move into these zones initially.  The aim should be to populate one neighborhood every two years to fill current vacancies.
    • Instead of punitive measures to force immigrants to stay in Detroit, the city should provide incentives to stay.  This could include requiring immigrants under this program to sign long term leases with large deposits, or to purchase property.  This is preferable to attempting to monitor the movement of immigrants. 
    • The city and state should attempt to partner with businesses, who may be interested in opening operations in the city due to the influx of immigrant labor.  This could help to give further incentives for new immigrants to stay, and create jobs for existing unemployed residents.

    Many of these recommendations require more micromanagement than I’d personally prefer, but address political and economic realities.  Simply allowing anyone and everyone to immigrate to Detroit or anywhere else in America is a political non-starter.  Also, the dire budgetary situation facing the City of Detroit and the state of Michigan means that neither can afford to allow new immigrants to become economic liabilities.  After all, the justification for this program is to replace the tax base and reduce crime, not to create a new underclass.  Though there would certainly be some hiccups, evidence in Winnipeg and Manitoba could help to revitalize both Detroit and much of the state of Michigan.  Failure to undertake an aggressive revitalization strategy will make an aggressive shrinking strategy inevitable.  Given the two choices, revitalization seems vastly preferable.

    Note 1: Unless otherwise noted, data on the Manitoba Provincial Nominees Program is based on http://www2.immigratemanitoba.com/asset_library/en/resources/pdf/pnp-manitoba-provincial-nominee-program-tom-carter-report-2009.pdf


    Steve Lafleur is a public policy analyst and political consultant based out of Calgary, Alberta. For more detail, see his blog.

    Photo by Arlo Bates

  • Manufacturing Stages A Comeback

    This year’s survey of the best cities for jobs contains one particularly promising piece of news: the revival of the country’s long distressed industrial sector and those regions most dependent on it. Manufacturing has grown consistently over the past 21 months, and now, for the first time in years, according to data mined by Pepperdine University’s Michael Shires, manufacturing regions are beginning to move up on our list of best cities for jobs.

    The fastest-growing industrial areas include four long-suffering Rust Belt cities Anderson, Ind. (No. 4), Youngstown, Ohio (No. 5), Lansing, Mich. (No. 9) and Elkhart-Goshen, Ind. (No. 10). The growth in these and other industrial areas influenced, often dramatically, their overall job rankings. Elkhart, for example, rose 137 places, on our best cities for jobs list; and Lansing moved up 155. Other industrial areas showing huge gains include Niles-Benton Harbor, Mich., up 242 places, Holland-Grand Haven, Mich., (up 172),  Grand Rapids, Mich., (up 167)   Kokomo Ind., (up 177) ; and Sandusky, Ohio, (up 128).

    Industrial growth also affected some of the largest metros, whose economies in other areas, such as business services, often depend on customers from the industrial sector. Economist Hank Robison, co-founder of the forecasting firm EMSI, points out that manufacturing jobs — along with those in the information sector — are unique in creating high levels of value and jobs across other sectors in the economy.  They constitute a foundation upon which other sectors, like retail and government, depend on.

    Take the case of Milwaukee. The Wisconsin city rode a nearly 3% boost in industrial employment to increase its ranking among the best large metros for jobs: It rose from a near-bottom No. 49 (out of 65) to a healthy No. 23. As manufacturing employment surged, others sectors, notably business services, warehousing and hospitality, showed solid increases after years of slow or even negative growth.

    Milwaukee’s growth reflects some of the greater trends affecting the industrial sector, whose overall income is up 21% since mid-2009.  The Fed’s monetary policy, combined with deficit-related concerns, has certainly helped by depressing the value of the dollar, keeping American prices more competitive with foreign producers. Low prices have helped U.S. industrial exporters gain sales, much as it has boosted agricultural commodity producers to sell their goods to growing countries like China, India and Brazil. Exports now account for 12.8% of all U.S. output, the largest percentage since the Commerce Department starting tracking in 1929.

    These new markets are particularly strategic to regions like Milwaukee and other parts of the Great Lakes. Despite the industry’s massive shrinkage of the past decade, these areas retain significant specialized skills in fields like machine tools, automotive parts and temperature controls, which are all in demand in the developing world as well as at locally based firms, many of which are enjoying high profits. Allen-Edmunds, a high-end shoe maker based in the region, has seen export business surge.

    Similarly Peoria, Ill., has benefited from a boom in overseas orders for heavy equipment from Caterpillar, its dominant industrial company. Caterpillar sells the kind of heavy moving and mining machinery now in great demand, particularly in developing countries.

    One big driver of industrial growth has come from the source of so much pain in the past: the auto industry. Although production remains 25% below its 2007 peak, the industry, which accounts for roughly one-fifth of the nation’s industrial output, is on the rebound.  Ford Motor is achieving its best profits in over a decade, and both Chrysler and General Motors are officially in the black.

    Long-depressed industry center Warren-Troy-Farmington Hills, Mich., topped our list of manufacturing job-creators, with an impressive 8.2% increase. Second place went to the Detroit-Livonia-Dearborn area, which experienced 3.5% growth. Of course this recent expansion hardly makes up for decades of decline — auto industry employment, for example, is still down over 34% from its 2005 peak. But industrial expansion has clearly improved job prospects across the board; over the past year, for example, Warren experienced healthy growth in its information, business services and wholesale trade sectors.

    Of course, not all the big gainers in the industrial sphere are located in Great Lakes. The movement of manufacturing to other parts of the country, particularly to Texas and the Southeast means a better industrial climate helps those regions as well.  The list of fastest-growing industrial areas among our big metros includes San Antonio, Texas (No. 3); Atlanta (No. 7); Oklahoma City (No. 8) and Austin-Roundrock, Texas (No. 10) — all of which did very well in our overall jobs survey. Many of these areas are business-friendly, have low housing costs, reasonable taxation and business-friendly regulatory environments that induce industrial expansions.

    Another contributing factor to industrial growth in places like Austin is high-tech manufacturing. Covering everything from servers to specialized production equipments, the expansion of this sector accounts for a healthy 1.7% upturn in San Jose, No. 6 among our large metro regions, a welcome turnaround for an area that shed some 17% of its industrial jobs over the past decade.

    But some of the best progress took place in smaller communities spread across the country. Take Yakima, Wash., which came out first on our manufacturing job growth list with a heady 19% growth in industrial jobs.  Metal fabrication plants companies such as Canam Steel have led the way, with some of the new demand coming from Canadian sources.

    Other strong performers included Midland, Texas, which ranked sixth in our industrial rankings — fifth  among the smaller cities. Here an expanding oil and gas sector has sparked a strong revival not only in manufacturing but also in business services and finance.

    If manufacturing growth has become a new shaper of overall job growth, some regions may need to move beyond the post-industrial mindset that dominates so much of regional e development orthodoxy. Take the coastal areas in California: Los Angeles-Long Beach, which has the nation’s largest industrial base and high unemployment, continues to lose manufacturing jobs – over 28% gone over the past decade — in part due to strict regulatory controls and a basic inattention to this sector by government officials.

    In contrast, some hard-hit economic regions like Modesto, in California’s Central Valley, have promoted industrial growth. Last year, a nearly 14% increase in manufacturing jobs — much of it food related — helped the area gain some 92 places on our survey . They have not exactly won a gold medal, but certainly the improvement amount to  more than chopped liver.

    To be sure, cities can grow without robust manufacturing. Take financial centers like New York, university towns or Washington, D.C., where paper-pushing remains the core competency. But for many areas, particularly those beyond the urban “glamour zone,” getting down and dirty at the factory represents a solid economic strategy. In fact, it may be one of the best way to nurture your region back to health.

    Top Cities for Manufacturing Job Growth, 2009-2010
    Yakima, WA 19.0%
    Sebastian-Vero Beach, FL 17.4%
    Palm Coast, FL 16.7%
    Anderson, IN 14.3%
    Youngstown-Warren-Boardman, OH-PA 13.2%
    Midland, TX 13.0%
    Modesto, CA 12.0%
    Yuma, AZ 9.8%
    Lansing-East Lansing, MI 9.3%
    Elkhart-Goshen, IN 9.3%
    Top Big Cities for Manufacturing Job Growth, 2009-2010
    Warren-Troy-Farmington Hills, MI 8.2%
    Detroit-Livonia-Dearborn, MI  3.5%
    San Antonio-New Braunfels, TX 3.2%
    Milwaukee-Waukesha-West Allis, WI 2.9%
    Louisville-Jefferson County, KY-IN 2.0%
    San Jose-Sunnyvale-Santa Clara, CA 1.7%
    Atlanta-Sandy Springs-Marietta, GA 1.7%
    Oklahoma City, OK 1.6%
    Pittsburgh, PA 1.6%
    Austin-Round Rock-San Marcos, TX 1.5%

    This piece originally appeared in Forbes.com

    Joel Kotkin is executive editor of NewGeography.com and is a distinguished presidential fellow in urban futures at Chapman University, and an adjunct fellow of the Legatum Institute in London. He is author of The City: A Global History. His newest book is The Next Hundred Million: America in 2050, released in February, 2010.

    Photo by bobengland

  • Rethinking Urban Dynamics: Lessons from the Census

    Much has been made of the vaunted “back to the city” movement by “the young and restless,” young professionals, the creative class, empty nesters and others were voting with their feet in favor of cities over suburbs.  Although there were bright spots, the Census 2010 results show that the trend was very overblown, affecting mostly downtown and near downtown areas, while outlying ones bled population.  One culprit for this discrepancy seems to be that the intra-census estimates supplied by the Census Bureau were inflated – in some cases very inflated.

    Looking at selected core cities for major US metropolitan areas, many of them were materially over-estimated:


    One particularly egregious case relates to Atlanta. Its huge projected population increase in the 2000s led me to describe it as “one of America’s top urban success stories.”  The reality proved to be quite different. Rather than strong population growth in the city, the population growth turned out to be basically flat, quite a different story.  Other declines might be more predictable, such as Detroit, or those who had previously challenged estimates like Cincinnati and St. Louis.  Still, even urban cores in rapidly growing regions like Dallas and Houston were not immune from this trend.

    There were some exceptions. Cities like Indianapolis, Columbus, and Oklahoma City came in slightly ahead of expectations, but the number of cities with misses and the sizes of the positive and negative misses tilted towards the down direction.

    It seems clear now that the justification for much of the “back to the city” story reflected bad estimates. People can’t be faulted for relying on the official government numbers – I did. But the reality of the 2010 Census, as demonstrated by Wendell Cox and others, is that the 1990s were actually better for urban population growth in America than the 2000s in many respects.

    One legitimate bright spot for cities lay in the growth of downtown and near downtown areas.  Though often starting from low bases, these areas often showed impressive increases.  For example, St. Louis showed good growth downtown despite a very disappointing decline in total city population:

    The poster child for this phenomenon was Chicago, where a fairly expansive area in the greater core showed large population growth.  Areas that were formerly almost all commercial, such as the Loop, added significant residential population, while areas that were nearly derelict like the near South Side have blossomed into thriving upscale neighborhoods.


    The problem, from places ranging from Chicago to Cleveland, is that the gains in the “core of the core” have been more than offset by losses elsewhere, especially the flight of blacks and other minorities – many of them immigrants – to the increasingly diverse suburbs.

    Cities across America have invested enormous sums into downtown redevelopment and major projects in selected districts.  The good news: these investments have shown some ability to move the needle in terms of attracting young professionals downtown.  The bad news lies with the fact that these developments have been extremely costly, and have not transformed the overall demographic or economic climates of the cities that tried them.  This demonstrates the limits of the policies.  Those who aren’t in the young professional, empty nester, or creative class demographic have rightly figured out that they are no longer the target market of city leadership. No surprise then that many of them    have decided to vote with their feet.

    Given the resulting overall negative swings, cities may want to revisit their strategy of putting all their chips in the downtown redevelopment basket in favor of less glamorous improvements in basic neighborhood safety, services, schools and other critical elements.  A handful of elite enclaves and talent hubs may be able to thrive on a “favored demographic quarter” strategy, but for most places there just aren’t enough young professionals and artists to go around.

    Aaron M. Renn is an independent writer on urban affairs based in the Midwest. His writings appear at The Urbanophile.

    * Actual population minus projected population as of 4/1/2010 using a run rate projection based on the 2008-2009 estimated population growth.
    ** Base is the projected 4/1/2010 population above.

    Photo by Ian Freimuth

  • China, Detroit, and Houston: How Ghost Properties Compare

    Learning about China’s property boom and its “ghost” cities has given me a whole new perspective on my four decades in the building, land development and consulting fields. During these periods our economy has had various ups and downs. In ‘up’ times, the rise in construction of new housing and growth in commercial developments has been quite obvious. What I have always had a problem understanding is why there seemed to be new housing projects and commercial projects that sprouted up during the bad times.

    Unlike this current recession — and I do believe that it is still current, despite the rhetoric that it’s over — past economic downturns were localized. As an example, I lived in Detroit in 1973 during the first gas crunch, when there were long lines to fill up. Unemployment in Detroit was a huge problem, and there was no work for a young ‘planner’ for new suburban developments, nor the prospect of anything turning around soon.

    I eventually decided to move to the south, where it was thought to be better. As I crossed into Texas, there weren’t any more gas lines. It seemed the entire State was booming. I drove through to Houston, picked up a phone book, and made a phone call to Paul Lederer Land Surveying and Engineering, which had a display ad that stuck out. Paul answered, and when I explained that I wanted to work as an apprentice to expand my knowledge into his field he hired me over the phone. I settled down, and after a year was ready to buy a home of my own.

    Detroit was still in economic hardship, with housing requiring a 20% down payment for a mortgage. At the same time, in Houston, homes were so much in demand that we had only minutes to make an offer once a home we wanted came on the market. Financing required only a 5% down payment.

    When a wealthy Detroit businessman heard that I could buy homes with only 5% down in a market that was escalating in sales and pricing I was offered a business proposition. I was asked to buy 50 homes at 5% down, and then resell them to a shell company for at least 10% more than our original purchase price. The homes would then be re-financed elsewhere with 5% down. The shell company would then default on the loans, and we would split the profits.

    In other words, if we paid an average of $30,000 each for 50 homes, we would have $1,500,000 in real estate, for which we had put $75,000 down. In theory, if I sold the homes to a shell company for $2,000,0000 with a $100,000 down payment, we would each walk away with $200,000 profit (roughly $790,000 in today’s dollars after inflation) if we defaulted on the loans. I was not interested in something that I considered fraud for a quick dollar, but it would not have been difficult to do this in real estate at that time.

    A few years later, Detroit was still in an economic downturn, and another person I knew was building large residential and commercial projects. These were new developments with hundreds of units and high-rise office towers.

    I mentioned to someone close to this developer that I was unimpressed with a venture to build at a time when there was not a market for either condominium buyers or office tenants, and curious as to why it was being pursued. A 20 story office tower would impress me if it were leased out; one sitting empty would not be so impressive.

    The answer was a lesson in economics. It was explained to me that the office tower was built for $10 million, but financed for $20 million, made possible by some inventive appraisals. Yet the bank needed only $1 million down. In other words, if the developments failed spectacularly there were still millions to be made, even if the properties went back to the banks. Ironically, Detroit in the late 1970’s and early 1980’s recovered somewhat, and the developments in question became financially viable and successful.

    I have no doubt that every industry, not just the development of land, has stories of financial shenanigans, but these are two examples of only a few that I have been exposed to during my 43 years in the development business.

    So today, whenever I see areas with aggressive construction that exceeds market potential, it makes me wonder…

    In light of this history, see what you think about development in China. Check out this 15 minute video from a major Australian broadcaster on China’s ghost cities.

    Rick Harrison is President of Rick Harrison Site Design Studio and Neighborhood Innovations, LLC. He is author of Prefurbia: Reinventing The Suburbs From Disdainable To Sustainable and creator of Performance Planning System. His websites are rhsdplanning.com and performanceplanningsystem.com.

    Photo: Expensive waterside apartments in Shekou Shenzhen by DC Master.

  • The Deconstruction of Barack Obama

    The first two years of the Obama Administration have been historic and eventful. The first openly liberal president in a generation has dramatically increased government spending and intervention in the nation’s economy. The federal deficit soared to $1.65 trillion dollars and 35% of Americans now receive some type of government assistance.

    The President seems to view the American economy through the prism of an academician. His vision of America held that his New Economy would be supported by the troika of plentiful Green jobs, new federal employment, and a revitalized and robust union based economy.

    Give him credit. President Obama has held true to his vision even if the economy, and the American people, did not.

    The “Green Jobs” of Mr. Obama’s new economy have not materialized despite huge government incentives. The president’s New Energy for America plan called for a federal investment of $150 billion over the next decade to catalyze the private sector to build a clean energy future.

    Obama’s plan is to:

    • Provide short-term relief to American families facing pain at the pump
    • Help create five million new jobs by strategically investing $150 billion over the next ten years to catalyze private efforts to build a clean energy future.          
    • Within 10 years save more oil than we currently import from the Middle East and Venezuela combined    
    • Put 1 million Plug-In Hybrid cars – cars that can get up to 150 miles per gallon – on the road by 2015, cars that we will work to make sure are built here in America
    • Ensure 10 percent of our electricity comes from renewable sources by 2012, and 25 percent by 2025
    • Implement an economy-wide cap‐and‐trade program to reduce greenhouse gas emissions 80 percent by 2050

    The President’s plan called for renewable energy to supply 10% of the nation’s electricity by 2012, rising to 25% by 2025. The problem with his vision was that America was already generating 11.4% of its electricity from renewable sources when he delivered his speech. Ironically, most renewable energy comes from hydro-power, a source disdained by many greens. (US Energy Information Administration, Electric Power Monthly, June 2010.). T. Boone Pickens’s plan to build wind farms across the Great Plains was the most publicized private response to Obama’s vision never materialized. The U.S. Chamber of Commerce reported on March 10th that 351 “shovel ready” energy projects were stalled nationally due to “a tangle of state and local regulations”. These 351 projects were to create 1.9 million jobs and infuse the economy with “a $1.1 trillion short-term shot in the arm”. William Kovacs, senior vice-president of the chamber said, “In fact, there weren’t any shovel ready projects.”

    In the end, the outpouring of new technologies and jobs in the new “green” economy simply never materialized. 

    Indeed, despite the grand vision of a Green economy, America remains deeply dependent on others for its energy.

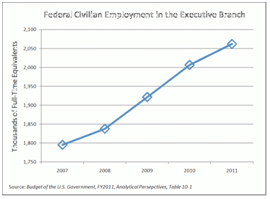
    The second leg of Obama’s troika was new government employment. He was successful in signing his health care reform into law but delayed implementation to 2014. The 2010 election that changed 63 House seats to the Republicans, has acted to unwind much of this legislation. If not repealed outright, Obamacare will likely face starvation from Republican cuts in funding necessary to implement the 2,900 page law with its hundreds of new federal regulations. Federal civilian employment in the president’s 2012 budget, will be 15 percent higher in 2011 than it was in 2007. This effort is also likely to be stymied.

    Union workers, the third leg of Obama’s troika, were well served in the first two years of the Obama Administration. The United Auto Workers inherited ownership in General Motors and Chrysler, and obtained federal protection of their relatively high wages and Cadillac health care benefits.  Had GM and Chrysler been allowed to enter Chapter 11 bankruptcy, it’s likely both would have been drastically reduced. Under the health reform act, union workers received exemptions from taxation for their Cadillac health care plans – unlike those of private companies.

    According to the most recent Employer Costs for Employee Compensation survey from the U.S. Bureau of Labor Statistics, as of December 2009, state and local government employees earned total compensation of $39.60 an hour, compared to $27.42 an hour for private industry workers – a difference of over 44 percent. This includes 35 percent higher wages and nearly 69 percent greater benefits. (Adam Summers Reason Foundation – Comparing Private Sector and Government Worker Salaries May 10, 2010).

    Will union members be able to hold their ground or be forced into major concessions during the coming deconstruction? State governors like Christie (NJ), Daniels (IN), Kasich (OH), and now Governor Walker of Wisconsin are taking on the unions head-on for the first time in generations. New conservative majorities in state house around the country are deconstructing collective bargaining agreements, above market wage gains, and Cadillac fringe benefits. Labor’s gains, and political clout, may have peaked in 2008. 

    Will President Obama adhere to his academician’s vision of the New Economy or will he be forced to succumb to the realities of the coming Great Deconstruction? Congress is arguing whether it can afford $4 billion in cuts to a $3 trillion budget in order to avoid an imminent government shutdown.

    Overlooked and more momentous is that for the first time since World War II, both houses of Congress – and some in both parties – are debating how to enact massive cuts in government spending. This is the beginning of the Great Deconstruction. Like the proverbial snowball rolling downhill, the $4 billion cuts of March 2011 could eventually canonball into hundreds of billions of actual spending reductions as the federal government deconstructs.

    The Government Accounting Office released a report on March 1st entitled ‘Opportunities to Reduce Potential Duplication in Government Programs, Save Tax Dollars, and Enhance Revenue.’ The report identified $200 billion in annual waste from duplicative federal programs. The agency found 82 federal programs to improve teacher quality; 80 to help disadvantaged people with transportation; 47 for job training and employment; and 56 to help people understand finances. Finding ways to cut billions in federal spending is not be the problem. Finding politicians with the political will to withstand the barrage of criticism from impacted constituents is another matter.

    The Great Deconstruction has already begun. Will President Obama, clearly a savvy politician, recognize this inexorable reality of this gathering force, leap in front of it, and claim ownership? Or will he stick to his academician’s vision and allow the snowball of deconstruction to roll over him? 

    Robert J Cristiano PhD is the Real Estate Professional in Residence at Chapman University in Orange, CA and Head of Real Estate for the international investment firm, L88 Investments LLC. He has been a successful real estate developer in Newport Beach California for thirty years.

    Other works in The Great Deconstruction series for New Geography
    Deconstruction: The Fate of America? – March 2010
    The Great Deconstruction – First in a New Series – April 11, 2010
    An Awakening: The Beginning of the Great Deconstruction – June 12, 2010
    The Great Deconstruction :An American History Post 2010 – June 1, 2010
    A Tsunami Approaches – Beginning of the Great Deconstruction – August 2010
    The Tea Party and the Great Deconstruction – September 2010
    The Great Deconstruction – Competing Visions of the Future – October 2010
    The Post Election Deconstructors – Mid-term Election Accelerates Federal Deconstruction – November 2010
    The State Government Deconstructors – November 2010

  • Declining Detroit

    The historical core municipality of the Detroit metropolitan area, the city of Detroit, continued its steep population decline between 2000 and 2010. The new census count indicates that the city dropped to 733,000 residents, from 951,000 in 2000. This drop of 25 percent was the largest in any census period since 1950, when the city peaked at a population of 1,850,000. Even so, the percentage decline from 1950 of 61.4 percent remains less than that of city of St. Louis, which has experienced the steepest population decline of any municipality that has reached 500,000 population in modern times (62.7 percent).

    The decline did not extend to the suburbs, which gained a modest 2.3 percent between 2000 and 2010. Suburban growth has also been substantial since 1950, with 2.2 million new residents added.

    However, the suburban growth was not enough to erase the impact of the city of Detroit decline. The Detroit metropolitan area fell from 4,452,000 in 2000 to 4,296,000 in 2010, a loss of 3.6 percent. The loss was the greatest among major metropolitan areas reporting up to this time. Nonetheless, even with the huge city of Detroit loss, the Detroit metropolitan area has grown more than 30 percent and more than 1,000,000 people.

  • Personal Income in the 2000s: Top and Bottom Ten Metropolitan Areas

    The first decade of the new millennium was particularly hard on the US economy. First, there was the recession that followed the attacks of 9/11. That was followed by the housing bust and the resulting Great Financial Crisis, which was the most severe economic decline since the Great Depression.

    Per capita personal incomes in America’s major metropolitan areas vary widely. Moreover, the changes in per capita incomes from 2000 to 2009 have also varied. The differences are particularly obvious when average incomes are adjusted for metropolitan area Consumer Price Indexes. The US Bureau of Labor statistics produces a Consumer Price Index for nearly 30 metropolitan areas. Among these, 28 metropolitan areas are covered by these local Consumer Price Indexes.

    While overall national inflation was approximately 25 percent between 2000 and 2009, the metropolitan area inflation indexes ranged from 16 percent in Phoenix to more than 32 percent in San Diego. Five additional metropolitan areas had 2000 to 2009 inflation of more than 30 percent, including Los Angeles, Riverside-San Bernardino, Miami, Tampa-St. Petersburg and San Diego. Four metropolitan areas experienced inflation of less than 20 percent, including Atlanta, Detroit and Cleveland and Phoenix.

    Overall, the 28 metropolitan areas covered by metropolitan inflation indexes averaged a per capita income decrease of 0.1 percent, after adjustment for inflation. Increases were achieved in 18 metropolitan areas, while decreases occurred in 10. The overall average declines occurred because the steepest loss (19 percent in San Jose), was far outside the plus 10 percent to minus 8 percent range of the other 27 metropolitan areas (Table).

    Metropolitan Area: Per Capita Income
    Metropolitan Areas Covered by Metropolitan Consumer Price Indexes
    Inflation Adjusted
    Rank Metropolitan Area
    2000 in 2009$
    2009
    Change
    1 Baltimore
    $    43,729
    $    47,962
    9.7%
    2 Pittsburgh
    $    39,024
    $    42,216
    8.2%
    3 Washington
    $    53,753
    $    56,442
    5.0%
    4 Philadelphia
    $    43,572
    $    45,565
    4.6%
    5 St. Louis
    $    38,636
    $    40,342
    4.4%
    6 Milwaukee
    $    40,028
    $    41,696
    4.2%
    7 Los Angeles
    $    41,382
    $    42,818
    3.5%
    8 Houston
    $    42,232
    $    43,568
    3.2%
    9 Cleveland
    $    38,396
    $    39,348
    2.5%
    10 Chicago
    $    42,761
    $    43,727
    2.3%
    11 Phoenix
    $    33,594
    $    34,282
    2.0%
    12 San Diego
    $    44,812
    $    45,630
    1.8%
    13 Kansas City
    $    39,020
    $    39,619
    1.5%
    14 New York
    $    51,638
    $    52,375
    1.4%
    15 Cincinnati
    $    37,852
    $    38,168
    0.8%
    16 Seattle
    $    48,651
    $    48,976
    0.7%
    17 Boston
    $    53,396
    $    53,713
    0.6%
    18 Minneapolis-St. Paul
    $    45,690
    $    45,750
    0.1%
    19 Denver
    $    46,205
    $    45,982
    -0.5%
    20 Miami-West Pallm Beach
    $    41,937
    $    41,352
    -1.4%
    21 Riverside-San Bernardino
    $    30,600
    $    29,930
    -2.2%
    22 Portland
    $    39,703
    $    38,728
    -2.5%
    23 Tampa-St. Petersburg
    $    38,048
    $    36,780
    -3.3%
    24 San Francico
    $    61,831
    $    59,696
    -3.5%
    25 Dallas-Fort Worth
    $    41,575
    $    39,514
    -5.0%
    26 Detroit
    $    40,412
    $    37,541
    -7.1%
    27 Atlanta
    $    39,775
    $    36,482
    -8.3%
    28 San Jose
    $    68,185
    $    55,404
    -18.7%
    Unweighted Average
    $    43,801
    $    43,700
    -0.2%

    The Top Ten: The strongest per capita personal income growth between 2000 and 2009 was in Baltimore, which had an inflation adjusted increase of 9.7 percent. This strong performance is not surprising due to Baltimore’s proximity to Washington and the federal government’s high paying jobs. It also receives spillover lucrative employment from federal contracts to health, defense and security companies. In fact, Baltimore did better than Washington. Washington, which extends from the District of Columbia and into Maryland, Virginia and West Virginia. Not that DC did badly; it boasted the third highest income growth, and 5.0 percent.

    However, perhaps the biggest surprise is the metropolitan area that slipped into the number two position between Baltimore and Washington. The Pittsburgh metropolitan area, which may have faced the most severe economic challenges of any major metropolitan area over the past 40 years, achieved per capita personal income growth of 8.2 percent. The Pittsburgh gain is all the more significant in view of the local financing difficulties which placed the city of Pittsburgh in the near equivalent of bankruptcy under Pennsylvania’s Act 47. However, as is the case in on number of metropolitan areas, the central city has become much less dominant and no longer seals the fate of the larger metropolitan area. Today, the city of Pittsburgh accounts for only 15 percent of the metropolitan area population.

    Philadelphia, the other long troubled region across the state, constitutes another surprise. Philadelphia placed fourth in per capita income growth at 4.6 percent only slightly behind Washington. The Philadelphia metropolitan area borders on that of Baltimore, stretching from Pennsylvania into New Jersey, Delaware and Maryland. Together with Washington and Baltimore, Philadelphia anchors the northern end of a corridor of comparative prosperity.

    Four of the next six positions are occupied by Midwest metropolitan areas. This may be unexpected because of the significant job losses sustained in this area since 2000. St. Louis, which stretches from Missouri into Illinois, ranked fifth in per capita income growth, at 4.4 percent. Milwaukee ranked sixth in its per capita income growth at 4.2 percent. Cleveland ranked ninth with per capita income growth of 2.5 percent, while Chicago placed 10th, with a gain of 2.3 percent in per capita personal income.

    Los Angeles was the only metropolitan area in the West to place in the top 10 in per capita income growth. Los Angeles ranked seventh growth of 3.5 percent. Houston replaced eighth with personal income growth of 3.2 percent.

    Overall, the East and Midwest captured six of the top ten income positions, while the South and West occupied four of the top ten positions.

    The Bottom 10: If the top 10 contained surprises, the bottom 10 could be even more surprising. Last place (28th) was occupied by San Jose, which experienced a stunning 18.7 percent decline in per capita inflation adjusted income between 2000 and 2009. This income loss is more than double that of the second-worst performing metropolitan area and more than triples that of all but two other metropolitan areas.

    The second worst position (27th) also contained a surprise, in Atlanta, which has enjoyed decades of unbridled growth. Yet, Atlanta experienced a per capita income loss of 8.3 percent. There was no surprise in the third to the last ranking (26th) of Detroit, with its automobile industry employment losses and the physical deterioration of its central city, which may be unprecedented in modern peace-time. Per capita incomes declined 7.1 percent in Detroit.

    Dallas-Fort Worth, which has also experienced strong growth in the past, posted a surprising fourth worst, with a per capita income decline of 5.0 percent. San Francisco, which has now replaced San Jose as the metropolitan area with the highest per capita income, ranked fifth worst and experienced a decline of 3.5 percent.

    All of the remaining bottom 10 positions were occupied by metropolitan areas that have developed a reputation for strong growth. Tampa St. Petersburg ranked 6th worst, with a per capita income loss of 3.3 percent. Portland (Oregon) ranked 7th worst with a personal income loss of 2.5 percent. Riverside San Bernardino, with the lowest per capita income ranking out of the 28 metropolitan areas, ranked 8th worst with a per capita income drop of 2.2 percent.

    The Miami (to West Palm Beach) metropolitan area ranked 9th in personal income growth with a loss of 1.4 percent from 2000 to 2009, while Denver topped out the bottom 10, ranking, with a per capita income loss of 0.5 percent

    Overall, the South and the West captured nine of the bottom ten positions, while only one Midwestern metropolitan area, Detroit, broke into the bottom ten.

    Of course, the 2000s certainly were an unusual time. But it does suggest that the dogma about the geography of regional prosperity needs to be challenged and perhaps thoroughly revised.

    Photo: Pittsburgh: Second Fastest Growing Income per Capita 2000-2009 (photo by author)

    Wendell Cox is a Visiting Professor, Conservatoire National des Arts et Metiers, Paris and the author of “War on the Dream: How Anti-Sprawl Policy Threatens the Quality of Life

  • Time to Dismantle the American Dream?

    For some time, theorists have been suggesting that it is time to redefine the American Dream of home ownership. Households, we are told, should live in smaller houses, in more crowded neighborhoods and more should rent. This thinking has been heightened by the mortgage crisis in some parts of the country, particularly in areas where prices rose most extravagantly in the past decade. And to be sure, many of the irrational attempts – many of them government sponsored – to expand ownership to those not financially prepared to bear the costs need to curbed.

    But now the anti-homeowner interests have expanded beyond reigning in dodgy practices and expanded into an argument essentially against the very idea of widespread dispersion of property ownership. Social theorist Richard Florida recently took on this argument, in a Wall Street Journal article entitled “Home Ownership is Overvalued.”

    In particular, he notes that:

    The cities and regions with the lowest levels of homeownership—in the range of 55% to 60% like L.A., N.Y., San Francisco and Boulder—had healthier economies and higher incomes. They also had more highly skilled and professional work forces, more high-tech industry, and according to Gallup surveys, higher levels of happiness and well-being. (Note)

    Florida expresses concern that today’s economy requires a more mobile work force and is worried that people may be unable to sell their houses to move to where jobs can be found. Those who would reduce home ownership to ensure mobility need lose little sleep.

    The Relationship Between Household Incomes and House Prices

    It is true, as Florida indicates, that house prices are generally higher where household incomes are higher. But, all things being equal, there are limits to that relationship, as a comparison of median house prices to median house prices (the Median Multiple) indicates. From 1950 to 1970 the Median Multiple averaged three times median household incomes in the nation’s largest metropolitan areas. In the 1950, 1960 and 1970 censuses, the most unaffordable major metropolitan areas reached no higher than a multiple of 3.6 (Figure).

    This changed, however, in some areas after 1970, spurred by higher Median Multiples occuring in California.

    William Fischel of Dartmouth has shown how the implementation of land use controls in California metropolitan areas coincided with the rise of house prices beyond historic national levels. The more restrictive land use regulations rationed land for development, placed substantial fees on new housing, lengthened the time required for project approval and made the approval process more expensive. At the same time, smaller developers and house builders were forced out of the market. All of these factors (generally associated with “smart growth”) propelled housing costs higher in California and in the areas that subsequently adopted more restrictive regulations (see summary of economic research).

    During the bubble years, house prices rose far more strongly in the more highly regulated metropolitan areas than in those with more traditional land use regulation. Ironically many of the more regulated regions experienced both slower job and income growth compared to more liberally regulated areas, notably in the Midwest, the southeast, and Texas.

    Home Ownership and Metropolitan Economies

    The major metropolitan areas Florida uses to demonstrate a relationship between higher house prices and “healthier economies” are, in fact, reflective of the opposite. Between August 2001 and August 2008 (chosen as the last month before 911 and the last month before the Lehman Brothers collapse), Bureau of Labor Statistics data indicates that in the New York and Los Angeles metropolitan areas, the net job creation rate trailed the national average by one percent. The San Francisco area did even worse, trailing the national net job creation rate by 6 percent, and losing jobs faster than Rust Belt Pittsburgh, St. Louis, and Milwaukee.

    Further, pre-housing bubble Bureau of Economic Analysis data from the 1990s suggests little or no relationship between stronger economies and housing affordability as measured by net job creation. The bottom 10 out of the 50 largest metropolitan areas had slightly less than average home ownership (this bottom 10 included “healthy” New York and Los Angeles). The highest growth 10 had slightly above average home ownership (measured by net job creation). Incidentally, “healthy” San Francisco also experienced below average net job creation, ranking in the fourth 10.

    Moreover, housing affordability varied little across the categories of economic growth (Table).

    Net Job Creation, Housing Affordability & Home Ownership
    Pre-Housing Bubble Decade: Top 50 Metropolitan Areas (2000)
    Net Job Creation: 1990-2000 Housing Affordability: Median Multiple (2000) Home Ownership: Rate 2000
    Lowest Growth 10  7.4%                                2.8 62%
    Lower Growth 10 14.9%                                3.1 63%
    Middle 10 22.8%                                3.2 64%
    Higher Growth 10 30.9%                                2.6 61%
    Highest Growth 10 46.9%                                2.9 63%
    Average 24.7%                                2.9 62%
    Calculated from Bureau of the Census, Bureau of Economic Analysis and Harvard Joint Housing Center data.
    Metropolitan areas as defined in 2003
    Home ownership from urbanized areas within the metropolitan areas.

    Home Ownership and Happiness

    If Gallup Polls on happiness were reliable, it would be expected that the metropolitan areas with happier people would be attracting people from elsewhere. In fact, people are fleeing with a vengeance. During this decade alone, approximately one in every 10 residents have left for other areas.

    • The New York metropolitan area lost nearly 2,000,000 domestic migrants (people who moved out of the metropolitan area to other parts of the nation). This is nearly as many people as live in the city of Paris.
    • The Los Angeles metropolitan area has lost a net 1.35 million domestic migrants. This is more people than live in the city of Dallas.
    • The San Francisco metropolitan area lost 350,000 domestic migrants. Overall, the Bay Area (including San Jose) lost 650,000, more people than live in the cities of Portland or Seattle.

    Why have all of these happy people left these “healthy economies?” One reason may be that so many middle income people find home ownership unattainable is due to the house prices that rose so much during the bubble and still remain well above the historic Median Multiple. People have been moving away from the more costly metropolitan areas. Between 2000 and 2007:

    • 2.6 million net domestic migrants left the major metropolitan areas (over 1,000,000 population) with higher housing costs (Median Multiple over 4.0).
    • 1.1 net domestic migrants moved to the major metropolitan areas with lower house prices (Median Multiple of 4.0 or below).
    • 1.6 million domestic migrants moved to small metropolitan areas and non-metropolitan areas (where house prices are generally lower).

    An Immobile Society?

    Florida’s perceived immobility of metropolitan residents is curious. Home ownership was not a material barrier to moving when tens of millions of households moved from the Frost Belt to the Sun Belt in the last half of the 20th century. During the 2000s, as shown above, millions of people moved to more affordable areas, at least in part to afford their own homes.

    Under normal circumstances (which will return), virtually any well-kept house can be sold in a reasonable period of time. More than 750,000 realtors stand ready to assist in that regard.

    Of course, one of the enduring legacies of the bubble is that many households owe more on their houses than they are worth (“under water”). This situation, fully the result of “drunken sailor” lending policies, is most severe in the overly regulated housing markets in which prices were driven up the most. Federal Reserve Bank of New York research indicates that the extent of home owners “under water” is far greater in the metropolitan markets that are more highly restricted (such as San Diego and Miami) and is generally modest where there is more traditional regulation, such as Charlotte and Dallas (the exception is Detroit, caught up in a virtual local recession, and where housing prices never rose above historic norms, even in the height of the housing bubble). Doubtless many of these home owners will find it difficult to move to other areas and buy homes, especially where excessive land use regulations drove prices to astronomical levels.

    Restoring the Dream

    There is no need to convince people that they should settle for less in the future, or that the American Dream should be redefined downward. Housing affordability has remained generally within historic norms in places that still welcome growth and foster aspiration, like Atlanta, Dallas-Fort Worth, Houston, Indianapolis, Kansas City, Columbus and elsewhere for the last 60 years, including every year of the housing bubble. Rather than taking away the dream, it would be more appropriate to roll back the regulations that are diluting the purchasing power and which promise a less livable and less affluent future for altogether too many households.

    Note. Among these examples, New York is the largest metropolitan area in the nation. Los Angeles ranks number 2 and San Francisco ranks number 13. The inclusion of Boulder, ranked 151st in 2009 seems a bit curious, not only because of its small size, but also because its advantage of being home to the main campus of the University of Colorado. Smaller metropolitan areas that host their principal state university campuses (such as Boulder, Eugene, Madison or Champaign-Urbana) will generally do well economically.

    Photograph: New house currently priced at $138,990 in suburban Indianapolis (4 bedroom, 2,760 square feet). From http://www.newhomesource.com/homedetail/market-112/planid-823343

    Wendell Cox is a Visiting Professor, Conservatoire National des Arts et Metiers, Paris. He was born in Los Angeles and was appointed to three terms on the Los Angeles County Transportation Commission by Mayor Tom Bradley. He is the author of “War on the Dream: How Anti-Sprawl Policy Threatens the Quality of Life.

  • Will a Dying City Finally Turn to Immigrants?

    Cuyahoga County Treasurer Jim Rokakis, who is based in Cleveland, estimates that new census numbers might show Cleveland’s population to be 325,000, a whopping 153,000 drop in 10 years! That would be an average of 15,000 people leaving Cleveland every year.

    That’s 1,250 people jumping ship every month,

    312 people fleeing the wreckage every week,

    45 people evacuating every day, or

    2 people running out of Cleveland every hour, 24/7, the whole year, for 10 straight years.

    Even conservative estimates have us losing 10 percent of our population this decade, the fastest rate of decline of any major American city (except New Orleans). And still, remarkably, we hear no alarm bells from City Hall, no calls of urgency, just a commitment to stay the course and manage the decline.

    While the extent of the exodus is debateable, it’s obvious that Cleveland, a city that once boasted 1 million residents, is not on the bright path to rebirth.

    Maybe we don’t really understand the problem.

    New York City and Chicago, like most major cities, see significant out-migration of their existing residents each year. What is atypical is that Cleveland does not enjoy the energy of new people moving in.

    Put simply, the city needs the fresh optimism and pluck of new immigrants, the most likely source of New Clevelanders.

    New immigrants are inherently mobile,and can move to Cleveland as part of secondary migration from New York City or other gateway cities. Many would be excited to pursue their American Dream right here on the shores of Lake Erie. In part due to the presence of immigrant language cable television and the internet, they can come to Cleveland and still retain ties to their native culture. Immigrants are moving to far more isolated places, such as Fargo, North Dakota.

    The great shame is that this was once proud city of immigrants (nearly 1/3 foreign-born in the early 20th century). But it now only 5% of its population is foreign-born, well-below the national average of 12%.

    But none of this impresses Mayor Frank Jackson who summarily dismisses immigrant-attraction initiatives like those in Philadelphia and those being discussed now in Detroit. Yet the basic reality is that immigration provides the only way for cities like Cleveland to generate the kind of numbers needed to make up for decades of mass out-migration.

    In numerous cities around the country, economic development professionals and foundations are looking at ways to tap the immigrant market. This will not only counter local depopulation and stabilize local the housing market, but will also attract a new wave of urban entrepreneurs, investors and consumers.

    They also realize that a globally diverse city would act as a magnet for the young, international and minority professionals leading the New Economy. These people could help catalyze a transformation to a more entrepreneurial, globally-connected and innovation-based local economy.

    Philadelphia Mayor Michael Nutter announced his plans to recruit 75,000 newcomers within five years to fill the city’s abandoned homes. And he’s targeting immigrant newcomers who have recently arrived in New York City.

    In Detroit, the New Economy Initiative (a $100 million regional fund for economic development), the Skillman Foundation, and the Greater Detroit Chamber of Commerce are conducting a community-wide discussion about ways to rebuild the city by attracting immigrants and international resources and promoting new intercultural partnerships for the benefit of all its citizens.

    Other cities consider immigrant-attraction strategies, but Cleveland City Hall ignores the very people most likely to move to Cleveland: immigrants looking to own their first homes and to start their new businesses.

    Pittsburgh-based PNC Financial Services Group conducted a study on Northeast Ohio’s economy and concluded that that the region is likely to suffer even after the rest of the country recovers from the recession. PNC’s Senior Economist and author of The Econosphere, Craig Thomas, found that attracting immigrants would help the region’s economy through investments in housing stock and start-ups.

    “As people leave, it really does take international folks to come in, open up stores and fill up neighborhoods,” Mr. Thomas told Crain’s Cleveland Business.

    But Mayor Jackson insists that efforts like those in Philadelphia and supported by economists like Mr. Thomas are not for Cleveland. As he began his second term, he said that he is positioning the City to compete in the global economy by building from within by using what he calls “self-help.”

    But not many are left to help. And by the time the policy is seen as a failure, even more will be gone.

    As people leave, so do businesses, from neighborhoods and many parts of downtown where vacancy rates have skyrocketed.

    As Cleveland’s downward spiral continues, the local leadership appears clueless on how to stop it.

    Richard Herman is the co-author of Immigrant, Inc.: Why Immigrant Entrepreneurs Are Driving the New Economy (and how they will save the American worker) (John Wiley & Sons, 2009). Herman is the founder of an immigration and business law firm in Cleveland, Ohio, which serves a global clientele in over 10 languages. He is the co-founder of a chapter of TiE, a global network of entrepreneurs started in 1992 in Silicon Valley by immigrants from India. For more information on immigrant entrepreneurship and rust belt revival, see www.ImmigrantInc.com ; www.youtube.com/user/Immigrantinc2010 ; www.ohio.tie.org . Contact Richard at richard.t.herman@gmail.com or 216-696-6170.

    Photo by ScallopHolden.com

  • Deconstruction: The Fate of America? – The Changing Landscape of America

    America is at a crossroads. Its current path is unsustainable. The deficit for fiscal year ending Sept. 30, 2009 was $1.42 trillion. The National Debt is $12.5 trillion with the debt ceiling just raised to $14.9 trillion. The National Debt has increased $4 billion per day since September 28, 2007. The Obama Administration projects trillion dollar deficits for years to come. It has bailed out GM and Chysler, the banks “too big to fail” , and state governments that cannot manage their budgets. They have given away billions for clunkers and caulkers, and rewarded homeowners who bit off more than they can chew. We owe China $894 billion, Japan $764 billion and the Oil Exporters another $207 billion. It is uncertain how long foreigners will continue to finance our debt.

    There comes a breaking point at which the financial model is unsustainable and can no longer continue. For you and I, it is called bankruptcy. If we screw up financially, we are forced to declare bankruptcy. The courts offer protection until we can get our house in order but we are forced to stop spending. We solve our problems under Chapter 7 (liquidation) or Chapter 11 (reorganization).

    DECONSTRUCTION

    Cities can also be forced into Chapter 9 municipal bankruptcy. The City of Vallejo, California, population 120,000, filed for bankruptcy in 2008 after its politicians went fiscally berserk, paying the city manager $400,000 per year and its fireman an average annual wage of $175,000. Cleveland, Ohio declared bankruptcy in 1979 after defaulting on $15 million of bonds. (Seems trivial in this era of trillion dollar deficts). New York City avoided bankruptcy in 1975 when the teachers union forked over $150 million at the eleventh hour. These cities were forced to remedy their reckless spending.

    States cannot declare bankruptcy. Nor can they print money like the federal government. The Legislative Analyst’s Office estimates California has unfunded pension obligations of $237 billion. California is flirting with junk bond status. If it loses its credit rating, it will no longer be able to fund its bloated operations. The Golden State then will become the first failed state. They will be forced to dismantle their regulatory bureacracy. California has over 500 agencies and many are overlapping. They have 250,000 state employees. Thousands will lose their jobs as the financial community imposes cuts the legislature will not make. Such down-sizing will become known as deconstruction. California may be the first state to deconstruct its government services but it will not be the last. The Pew Center for the States reported that state governments have more than a trillion dollars in unfunded pension obligations.


    There is no better example than the City of Detroit. Once the home of Henry Ford and the American automobile industry, Detroit has fallen on hard times. Its population has fallen from nearly 2 million residents to less than 900,000 today. With a budget deficit of $300 million per year, Detroit can no longer provide basic services to its own residents. There are 33,500 empty homes and 91,000 vacant residential lots. More than 300,000 buildings are vacant or in shambles. It is estimated that 40 square miles of Detroit lies abandoned.

    Twelve years ago, British urban historian Sir Peter Hall wrote in “Cities in Civilization” that Detroit “has become an astonishing case of industrial dereliction; perhaps, before long, the first major industrial city in history to revert to farmland.” Hall may have been prescient. This week, Mayor David Bing released the “Neighborhood Revitalization Strategic Framework,” a landmark document that suggests that vast sections of Detroit be razed and returned to farmland, open space and nature. The report suggests the first organized and orderly deconstruction of a major American city.

    The report envisons replacing entire neighborhoods with “Naturescapes” (meadows), “Green Thoroughfares” and “Village Hubs” that require fewer city services. But, it will require hundreds of millions of federal aid to finance such a major transformation, money the federal government no longer has to give.

    In an era of trillion dollar federal deficits, there are no longer easy solutions. The shift of tectonic plates caused by the Great Recession have exposed hopelessly unsustainable city and state budgets. Swollen payrolls, duplicative agencies and inefficient municipal services can no longer be afforded. The deconstruction of government services seems inevitable.

    In five years, will Detroit remain a cratered landscape of vacant buildings, broken promises, and smashed dreams? Or will a smaller, safer, more efficient city evolve out of its ruins? If deconstruction is successful in Detroit, it could serve as a model for many other governments as well, from City Hall to state capitols and all the way to the most bloated disaster of all, Washington, DC.

    ***********************************

    During the first ten days of October 2008, the Dow Jones dropped 2,399.47 points, losing 22.11% of its value and trillions of investor equity. The Federal Government pushed a $700 billion bail-out through Congress to rescue the beleaguered financial institutions. The collapse of the financial system in the fall of 2008 was likened to an earthquake. In reality, what happened was more like a shift of tectonic plates.

    ************************************

    This is the eighth ninth in a series on The Changing Landscape of America written exclusively for New Geography

    Robert J. Cristiano PhD is a successful real estate developer and the Real Estate Professional in Residence at Chapman University in Orange, CA.

    PART ONE – THE AUTOMOBILE INDUSTRY (May 2009)
    PART TWO – THE HOME BUILDING INDUSTRY (June 2009)
    PART THREE – THE ENERGY INDUSTRY (July 2009)
    PART FOUR – THE ROLLER COASTER RECESSION (September 2009)
    PART FIVE – THE STATE OF COMMERCIAL REAL ESTATE (October 2009)
    PART SIX – WHEN GRANNY COMES MARCHING HOME – MULTI-GENERATIONAL HOUSING (November 2009)
    PART SEVEN – THE FATE OF DETROIT: GREEN SHOOTS? (February 2010)
    PART EIGHT – THE FAILED STATE OF CALIFORNIA (March 2010)