Tag: dispersion

  • How Cities Grow: Dispersion, not Densification

    Analysts occasionally note that urban areas ("cities") are becoming larger and denser. This is only half right. It is true that most of the world’s urban areas are becoming larger, with megacities like Delhi, Jakarta, Shanghai, Beijing and Manila adding more than five million people in the last decade and most other urban areas are growing, but not as fast.

    Understanding Urban Areas: However almost without exception, urban areas are getting less dense. Because there is so much confusion about city "definitions," a clarification is required. The only geography for which overall urban density can be measured is the urban area, which is the area of continuous development. The urban area is not constrained by municipal or other jurisdictional boundaries and does not include rural (undeveloped) territory, even if it is in a "central city" (such as Rome, Ho Chi Minh or Marseille, with their expansive boundaries). An urban area is also different from a metropolitan area, because metropolitan areas (as labor markets) always include rural territory, which is by definition not urban.

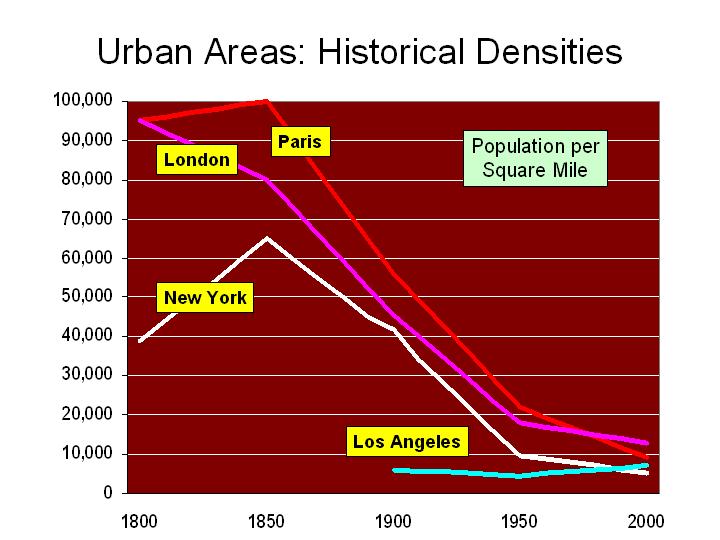
    1960-1990 Data: Historical urban population density is not readily available. Kenworthy and Laube were pioneers in this area, publishing estimates from 1960 to 1990 for a number of urban areas. That data indicates density losses in the more than urban areas for which they were able to develop comparable data. The world average decline was 20 percent, ranging from 15 percent in the United States to 29 percent in Europe and 33 percent in Australia. While Tokyo was doubling in population, its population density was dropping 17 percent between 1960 and 1990. While Zurich was adding 21 percent to its population, it was becoming 13 percent less dense.

    Recent Data: The dispersion continues, which is indicated by these high-income world cases:

    Today, the ville de Paris has 700,000 fewer people than at its peak, and inner London (generally the former London County Council area) has lost more than 1,500,000 people since its peak. All growth has been in lower density suburban areas in both the London and Paris urban areas.

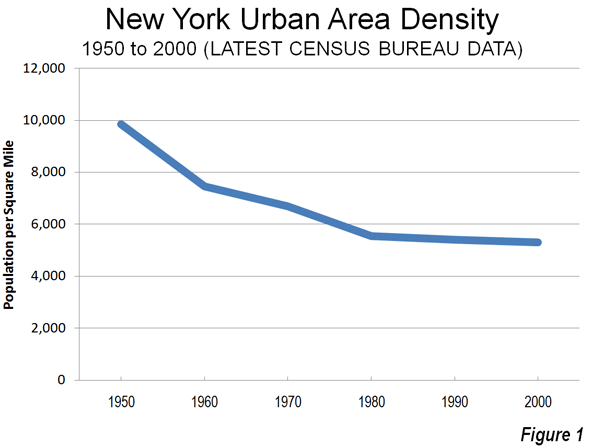
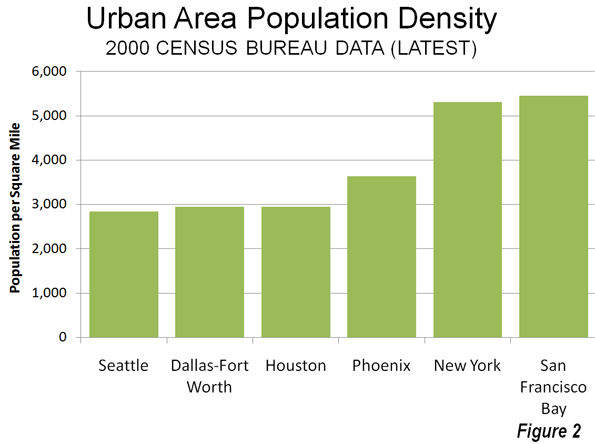
    In the United States, urban areas with more than 1,000,000 population more than doubled in population from 1950 to 2000 (2010 data not yet available), while the population density dropped by nearly one-third. Detailed analysis indicates that this trend has continued over the past decade in New York, Los Angeles, Chicago, Dallas-Fort Worth, Seattle, St. Louis and other major US urban areas.

    The dense core city of Seoul has been losing population and all growth has been in the suburbs, which are lower density.

    The dense urban core of Milan has experience substantial population losses, while the less dense suburbs have captured all the growth.

    Dispersion is not limited to high income urban areas, with declining densities in evidence across lower and middle income nations as well. For example:

    Nearly all of the growth in Jakarta has been in the suburbs for the last 20 years, while the core has gained little in population. The net effect is a less dense, but much larger urban area, because the suburbs are not as dense.

    Nearly all of the growth for 30 years in Manila has been in the suburbs, while the core city. Again, the urban area has become much larger, but much less dense because the suburbs are much less dense.

    The dense core of Shanghai has lost population and all growth has been in the suburbs, which are lower density.

    The population in the dense core of Beijing has nearly stopped growing, with nearly all population in the suburbs, which are lower density.

    The core of Mumbai has lost population in two of the last three census periods, while all growth has been in the suburbs, which are lower density.

    The urban core of Mexico City has been declining in population since 1960 and all of the growth has been in the suburbs, which are less dense.

    The dense core city of Buenos Aires has fewer people today than in 1947, while at least 8 million people have been added to nearly 1,000 square miles of lower density suburbs.

    Urban growth continues to be overwhelmingly in less dense suburban areas, rather than in the more dense urban cores, and as a result even as urban areas grow, they become less dense. This is how cities grow.

  • Avent on Cities: Understanding Part of the Equation

    Ryan Avent hits a home run, strikes out and earns a "yes, but," all in the same article ("One Path to Better Jobs: More Density in Cities") in The New York Times.

    A Home Run on Housing Regulation: Avent rightly notes that the land-use and housing regulations of metropolitan areas like San Francisco have not only driven housing prices higher, but also negatively impacted economic growth. Studies in the UK, the US and the Netherlands have demonstrated that significant restrictions on land use (called smart growth or urban containment) lead to reduced employment and economic growth in metropolitan areas. His comparison to OPEC is "right on" – that metropolitan areas like San Francisco have squeezed the supply of housing, which, of course, drives up house prices, just as restricting the supply of any good or service in demand will tend to do. Avent is also right in noting that high housing prices have driven huge numbers of people out of the San Francisco Bay Area to places like Phoenix. According to the Census Bureau, nearly 2,100,000 people moved from Los Angeles, San Francisco, San Diego and San Jose between 2000 and 2009 to other parts of the country.

    Striking Out on Density: The strikeout results from assumptions that are patently wrong. Cities (urban areas) do not get more dense as they add population. They actually become less dense. For example, the New York urban area has added 50 percent to its population since 1950, yet its population density has dropped by 45 percent (Figure 1). Between 2000 and 2010, most metropolitan population growth, whether in San Francisco, New York, Phoenix, Portland or Houston, was in the lower density suburbs (see: http://www.city-journal.org/2011/eon0406jkwc.html ). The same dispersion is occurring virtually around the world (see: http://www.demographia.com/db-evolveix.htm), from Seoul, to Shanghai, Manila and Mumbai. Rapid urban growth would mean even further dispersion and lower densities, not the higher density neighborhoods Avent imagines. Nonetheless, allowing the more affordable detached housing that people prefer would likely lead to stronger economic growth and more affluent residents in the San Francisco and other over-regulated metropolitan areas.

    A "Yes, But" on Productivity: Any comparison of incomes between metropolitan areas needs to take into consideration the cost of living. For example, the San Francisco Bay Area (San Francisco/San Jose) is one of the most expensive places to live in the country. The median house price is more than 2.5 times that of Phoenix, after accounting for income differentials. Avent does not control for the difference in the cost of living, which is largely driven by the higher cost of housing. The lower cost of living neutralizes much of the impact of lower incomes (such as in Houston) in metropolitan areas like Houston, Dallas-Fort Worth, Indianapolis, etc., where the OPEC model has not been applied to land use regulation.

    Finally, even controlling for the cost of living, there are substantial exceptions to any density-productivity thesis. For example, some of the greatest productivity gains information technology have come out of the Seattle area, which is the least dense major urban area in the 13 Western states, less dense than Houston, Dallas-Fort Worth and Phoenix. Even more impressively, Seattle’s urban density is barely one-half that of New York or San Francisco (Figure 2), yet its gross domestic product per capita is higher than New York and within 2 percent of San Francisco/San Jose. Seattle’s substantial contribution to the nation’s productivity has occurred while its population density was declining nearly 15 percent (since 1980).  

    Avent, like many analysts before appears to presume that population growth means higher densities. In fact, urban areas grow by dispersing, not densifying.

  • Despite Exhortations, San Antonio Suburbanizes

    "Despite years of effort by city leaders to revitalize San Antonio’s downtown neighborhoods, thousands of residents flocked to sprawling subdivisions on the far North and West sides in the past decade, while the inner city lost residents."

    That is how John Tedesco, Elaine Ayala and Brian Chasnoff of the San Antonio Express-News described the continuing dispersion of the San Antonio metropolitan area’s core Bexar County in an analysis of census tract population trends between 2000 and 2010 (we had reported more generally on the continuing dispersion of San Antonio a few months ago).

    Referring to the "siren song of the outlying suburbs," the authors note that the strongest growth in Bexar County occurred in suburban areas outside the outer beltway (the "Anderson Loop" or state route 1604). The growth, largely on the north and west sides of the county was nearly one-half of total county growth. At the same time, the inner city lost population.

    The Express-News analysis indicates that the population increased 233 percent in the northern and western areas outside the Anderson Loop. Inside the inner loop (Interstate 410), the population increased 7 percent. This includes the inner city area, where the population declined three percent. In the rest of the county (between the inner and outer loops and the outer suburbs of the east and south), the population increase was 24 percent.

    Outside core Bexar County, the metropolitan area added 34 percent to its population, more than any of the three major sectors of Bexar County.

    The reporters noted that "Every San Antonio mayor who served in the past decade preached the virtues of life in the inner city. For many people, it’s an appealing message — in theory. “Most people agree,” former Mayor Phil Hardberger said. “And then they drive out beyond 1604 to their houses.”

    Norman Dugas, a residential subdivision developer and past president of the Real Estate Council of San Antonio told the Express-News “The reality is, market forces are much more important than any planning emphasis or desire to shape development.” Put another way, "preaching" is not enough. People will likely follow their preferences unless forbidden to do so, which is regrettably a policy direction in some places.
    Subsidies to the core areas (often plentiful) and exhortations by public officials (few, if any of whom have themselves moved permanently to the inner city from the suburbs) are unlikely to change how people prefer to live.

  • Major Metropolitan Areas: Summary of the First 20

    Data is now available for 20 of the nation’s 52 metropolitan areas with more than 1,000,000 population. The early results indicate a pattern of accelerating dispersion of the population to the suburbs as is indicated in the table below. Thus far, historic core municipality growth has been approximately one-half the 1990s rate. During the 2000s, the historic cores have accounted for 8.8 percent of metropolitan growth, down nearly one-half from the 1990s rate.

    Summary of 2010 Census Results
    Major Metropolitan Areas (Over 1,000,000 Population)
    Historical Core Municipalities
    Suburbs
    Metropolitan Areas
    2000-2010
    Population Gain 682,000 7,047,000 7,729,000
    Percentage Increase 6.7% 23.7% 17.7%
    Share of Growth 8.8% 91.2% 100.0%
    1990-2000
    Population Gain 1,229,000 6,718,000 7,948,000
    Percentage Increase 10.8% 30.5% 23.7%
    Share of Growth 15.5% 84.5% 100.0%
    Includes 20 of 52 metropolitan areas released by 3-3-2010