Tag: driving

  • Suburban “End-Times” Reality Check

    The Atlantic’s Alex Madrigal announces "The Beginning of the End for Suburban America," a wish and hope long dressed-up as reality by a well-placed few who believe that the "be – all and end – all" is living anywhere but the suburbs. This is not to suggest that there is anything wrong with living in the core urban core if that is what one wants to do. I certainly have enjoyed living part-time in the inner core of the ville de Paris for some years. At the same time, however, the behavior of people has revealed an overwhelming preference for more space. From New York to Paris and Tokyo, some people choose to live in dense urban cores and a lot more choose to live in suburbs (and exurbs).

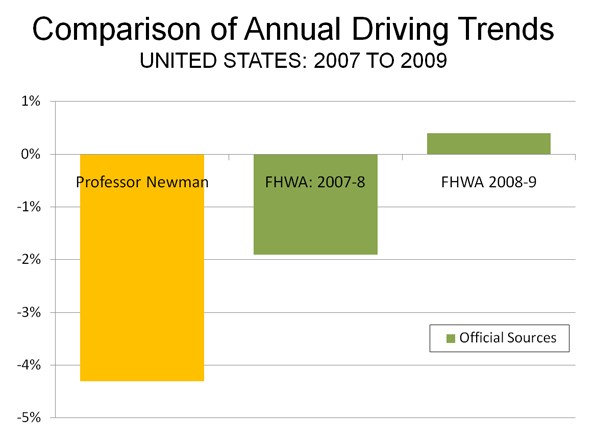
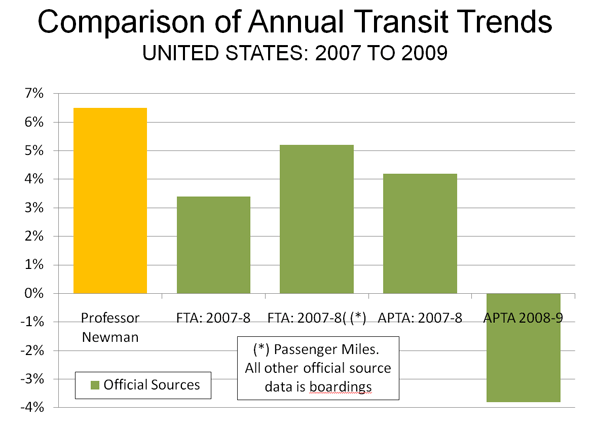
    What data does Madrigal cite to show "the beginning of the end for suburban America"? Driving is down from a peak in 2007, also the year that employment peaked. These are not disconnected events. With the total unemployed now about equal to the number of employed workers in the New York and Chicago metropolitan areas, work trips that are not made nearly equal the decline in driving. The higher gas prices appear to have induced people (in the suburbs and in the dense cores) to make modest reductions in discretionary trips or to more efficiently organize their shopping trips.

    Madrigal also points out that in 2010 new houses were smaller than their peak (also 2007). The median house size was still larger than any year before 2005 and 100 square feet larger than 2000. Madrigal cites declining rates of demand increase for electricity.
    The connection between these trends and the suburbs is unclear. Madrigal does not separate the trends by residential geography, the more dense cores of metropolitan areas, the suburbs and exurbs of metropolitan areas and the balance of the nation. Granted, the data is not immediately available for such analysis.

    Fortunately, there is more precise data that differentiates between dense core and suburban trends. It is the United States Census, conducted every 10 years and most recently in 2010. Between 2000 and 2010, the core municipalities of the 51 metropolitan areas with more than 1 million population captured 9% of the population growth, while the suburbs and exurbs captured 91%. The suburbs actually did better in the 2000s than in the 1990s, when they accounted for only 85 percent of the growth.

    True, the relative decline of the denser cores did not resemble the disastrous decade of the 1970s. Further, the gains made by very small areas of the core over the past 10 years have been an important advance. But to suggest that the 2000s represent "the beginning of the end for suburban America" is profoundly at odds with reality.

    So, the decade of the 2000s was another false start for the heralds of the suburban "end-times." The wishing and hoping has to be delayed yet again.

  • Federal Survey: Fewer Transit Commuters

    Results from the US Department of Transportation’s 2009 National Household Travel Survey indicate that transit’s work trip market share in the United States was only 3.7 percent in 2009. This is a full one quarter less than the 5.0 percent reported by the Bureau of the Census American Community Survey for 2009. Further, the NHTS data does not include people who work at home. If the work at home share of employment from the American Community Survey is assumed, the transit work tripĀ  market share would be 3.5 percent.

    Much of the difference is due the differing questions asked in the two surveys. The American Community Survey asks how people "usually" got to work last week, while the National Household Travel Survey (NTHS) data is based upon actual diaries of travel kept by respondents. The NHTS reports that among people who respond that transit is their "usual mode" of travel to work, transit is used only 68 percent of the time. In contrast, the daily trip diaries report that commuters who drive alone are a larger share of the market than those who indicate driving alone as their usual mode of travel. People who report their usual mode as "car pool" actually use a car pool to get to work only 55 percent of the time, an even lower rate relative to "usual" mode than transit.

    The daily trip diaries from the NHTS also a large difference in travel times between automobile commuters (including car pools) and transit. The average automobile commute time was 22.9 minutes, while the average transit commute time was more than double, at 53.0 minutes.

  • The Fifth Estate Clarifies US Driving and Transit Figures

    Late on July 26 (Washington time), The Fifth Estate corrected the attribution by Professor Peter Newman of Curtain University to the effect that driving was down 43% and transit up 65% in the United States. This issue had been the subject of my column on the same morning. It was a simple decimal error (in the reporting) and has now been corrected on the site. Driving is now reported as being down 4.3% and transit up 6.5%. Professor Newman provided slides with the data to Ms. Tina Perinotti, who forwarded them to me.

    While the new figures are less inconsistent with the official figures than the former, there are still material inconsistencies.

    Driving Trend: Official Data: The slides provided simply refer to the two figures as relating to the past year, without a source or specific period. The 4.3% driving decline is more than double the largest annual decline reported by the official source for such information, the Federal Highway Administration (Figure 1).

    Transit Trend: Official Data: We reviewed the data published from the official sources for transit data (the American Public Transportation Association and the Federal Transit Administration) and found no recent annual data indicating a 6.5% increase in ridership (either in boardings or in passenger miles). Much of the transit ridership gain from 2007 to the peak year of 2008 was lost in 2009, according to data posted by APTA in early March (Figure 2). A later first quarter report by APTA indicates further losses. Moreover, as we indicated in our article, the percentage decline in transit use since the peak year of 2008 is many times that of the decline in driving.

    Not All Percentages Are the Same: Care must also be used in comparing percentage changes between transit and driving, because so little travel is on transit. For example, a one percent increase in roadway urban travel converts to about one-third of a mile per person per day. A one percent increase in transit use converts to about 30 feet per person per day, about the same distance as walking from one side to the other of the average bedroom and back.


    Note: It is possible that the 4.3% driving decline was taken from an interim Federal Highway Administration report indicating that driving declined 4.3% in March 2008 compared to March 2007 (a monthly comparison, not a year on year comparison). This FHWA report, however, is subject to annual revision based upon the more comprehensive Highway Performance Monitoring System, which in 2009 revised the March 2008 such that the annual change became 2.7%.

  • Transit Captures Little of Driving Decline

    Over the past year, transit ridership has risen and that is a good thing. At the same time, driving has declined, due to both higher gasoline prices and the economic downturn. Some analysts have implied that people are giving up driving and using transit instead. An analysis of just released transit and urban roadway usage indicates no such thing. During the fourth quarter, the transit increase from a year earlier represented just 0.7 percent of the driving decline. This is even lower than the 2 to 3 percent figures registered in the first through third quarters. Of course, the principal reason why people do not substitute transit for driving is that it is not available for the overwhelming majority of urban trips.

    The latest data is available at: http://www.demographia.com/ut-hwytr2008f.pdf.