Tag: Energy

  • This Is America’s Moment, If Washington Doesn’t Blow It

    The vast majority of Americans believe the country is heading in the wrong direction, and, according to a 2011 Pew Survey, close to a majority feel that China has already surpassed the U.S. as an economic power.

    These views echo those of the punditry, right and left, who see the U.S. on the road to inevitable decline.  Yet the reality is quite different. A confluence of largely unnoticed economic, demographic and political trends has put the U.S. in a far more favorable position than its rivals. Rather than the end of preeminence, America may well be entering  a renaissance.

    Just survey the globe. The European Union’s prolonged crisis will likely end in further decline. Aging Japan has long passed its prime, its market share receding in everything from autos to high tech.  China’s impressive economic juggernaut has slowed down, and the Middle Kingdom faces increased social instability, environmental degradation and a creaky one-party dictatorship.

    While the U.S. has its challenges, it is positioned to achieve a more solid long-term   trajectory than its European and Asian rivals. What it lacks, however, is a strong political leadership capable of seizing this opportunity.

    Resources

    Energy constitutes the biggest ace in the hole for the U.S. For almost half a century, an enormous fossil fuel bill that still accounts for 40% of the nation’s trade deficit has hampered economic growth. Now that situation is changing rapidly.

    Due to vast new finds and improved technology to exploit them, the U.S. is now the world’s largest producer of natural gas and could emerge as the leading oil producer by 2017. Reserves of natural gas — a clean-burning fuel — are estimated at 100 years supply and could generate more than 1.5 million new jobs over the next two decades.

    The U.S. agricultural sector is also booming, with exports reaching a record $135.5 billion in 2011. With global demand increasing, sustained growth  will continue across America’s fertile agricultural regions.
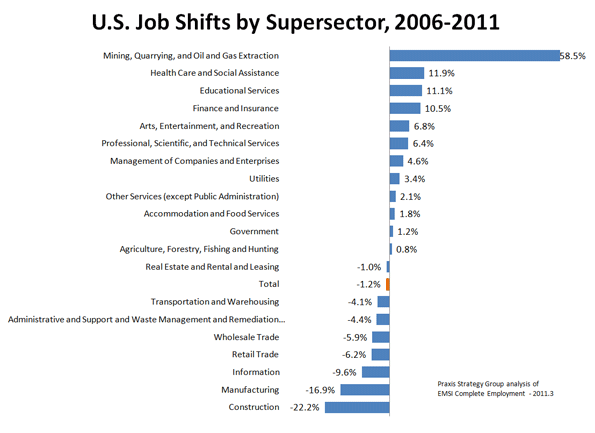
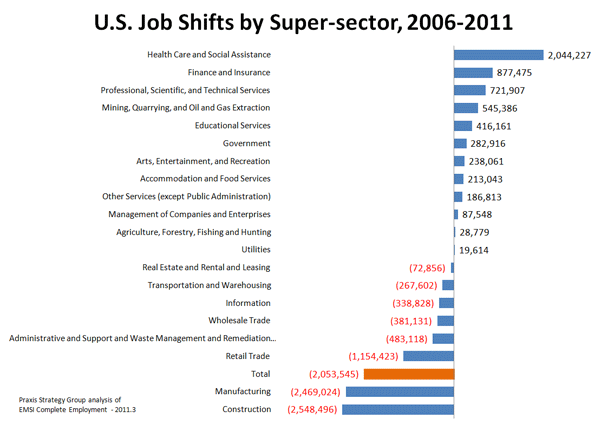
    Manufacturing

    The other big game changer is manufacturing. As President Barack Obama recently acknowledged, this is America’s “moment” to seize the industrial initiative. U.S. manufacturers have expanded their payrolls for two straight years, and they have increased production while Japan, Germany, China and Brazil have scaled back.

    A recent survey of manufacturing CEOs revealed that 85% believed production could shift soon from overseas. Both foreign and domestic manufacturers are alarmed about rising wages and labor unrest in China. Some important Japanese, German and Korean companies also have concerns about China’s policies that favor local firms and abscond with investor’s technology.

    Foreign Investment

    Rising foreign investment reflects the new American competitiveness. Since 2008 foreign direct investment to Germany, France, Japan and Korea has stagnated; in 2009 overall investment in the E.U. dropped 36%.

    In contrast, in 2010 foreign investment in the U.S. rose 49%, mostly coming from Canada, Europe, and Japan. Industrial investment rose $30 billion just between 2009 and 2010, while investment in the energy sector more than tripled to $20 billion.

    The Information Sector

    In the information sector, American domination continues to mount, contrary to predictions of decline over the past two decades. Although high-tech manufacturing has shifted largely to Asia, Americans rule the increasingly strategic software sector.   American-based companies, who constitute more than two-thirds of the world’s 500 largest software companies, including  nine of the top ten.

    Outside the U.S., there are no significant equivalents of Apple, Google, Microsoft, Amazon and Facebook. Hollywood, for its part, rules the entertainment world, producing 40% of world’s audiovisual exports, a dominion that troubles China’s President Hu Jintao, who recently complained  that the “cultural fields” represent “the focal area” for Western “infiltration”.

    Demographics

    The Great Recessionhas slowed population growth everywhere, but the U.S. maintains the   youngest and most vibrant demographic profile of any advanced country. Between 1980 and 2010, the U.S population expanded by 75 million to over 300 million. In contrast many European countries, including Germany, have suffered stagnant growth, while in Russia and Japan populations have already started declining.

    The disastrous fiscal implications of slow or negative population growth are evident in Greece, Spain and Italy, all of which suffer among the world’s lowest fertility rates. Rapid aging also will soon catch up with Germany. By 2030, Germany will have 48 retirees for every 100 workers — that’s barely two workers per retiree. The numbers are even worse in Japan: 53 retirees for every 100 workers by 2030.

    Political Factors

    Given the ineptitude of the last two administrations, enthusiasm about America’s political system is hard to justify. But our constitutional systems of laws and checks on central power remain a critical advantage. Immigration has declined with the recession, but the U.S. can expect to welcome religious and political exiles — such as Middle Eastern Christians displaced by   the “Arab Spring” — as well as Greeks and Irish fleeing Europe’s economic decline.

    Many from Russia and China are seeking to immigrate to the United States, Canada or Australia in order to protect property or just live a freer life. Indeed, among the 20,000 Chinese with incomes over 100 million Yuan ($15 million), 27% have already emigrated and another 47% have said they were considering it, according to a report by China Merchants Bank and U.S. consultants Bain & Co. published in April.

    Needed from Washington: A New American Strategy

    Sadly no leading politician or political party seems ready to   embrace the country’s new strategic advantages.  Many on the left may find the very notion distasteful, having    swallowed declinism with their academic mother’s milk. The president himself dislikes the notion of American “exceptionalism.” Many key Obama backers like SEIU boss Andy Stern and former auto czar Steven Rattner, embrace the superiority of China’s authoritarian system. Others embrace Europe and even Japan as models for an aging superpower.

    Worse still: Some Obama policies work against the well springs of national resurgence.   Threats to raise income taxes on families making over $250,000 directly threatens the aspiring entrepreneurial class more than the real “rich” whose fortunes are protected by low capital gains taxes and family trusts. Most critical: The administration’s hostility to fossil fuel represents a direct threat to the country’s greatest new source of advantage and threatens to strangle America’s recovery in its infancy.

    Not that the Republicans are any less clueless. Many reject the infrastructure needed by an expanding economy — ports, roads, bridges as well as worker training and support for basic research — as mere “pork.” Budget restraint and fiscal discipline are important, but preparing the country for more rapid economic growth requires an active, supportive government.

    Republicans also tend to view immigration as something akin to a hostile invasion. Yet many key industries — notably manufacturing and high tech — rely heavily on immigrant entrepreneurship, intelligence and work values. Running against immigration constitutes an assault on the nation’s increasingly diverse demographics.

    So this is where we now sit.  With all the essential elements for a strong, sustained recovery place, the big question is whether we will find political leaders capable of tapping this country’s phenomenal potential.

    This piece originally appeared at Forbes.com.

    Joel Kotkin is executive editor of NewGeography.com and is a distinguished presidential fellow in urban futures at Chapman University, and contributing editor to the City Journal in New York. He is author of The City: A Global History. His newest book is The Next Hundred Million: America in 2050, released in February, 2010.

    Photo from BigStockPhoto.com.

  • In Keystone XL Rejection, We See Two Americas At War With Each Other

    America has two basic economies, and the division increasingly defines its politics. One, concentrated on the coasts and in college towns, focuses on the business of images, digits and transactions. The other, located largely in the southeast, Texas and the Heartland, makes its living in more traditional industries, from agriculture and manufacturing to fossil fuel development.

    Traditionally these two economies coexisted without interfering with the progress of the other. Wealthier gentry-dominated regions generally eschewed getting their hands dirty so that they could maintain the amenities that draw the so-called creative class and affluent trustifarians. The more traditionally based regions focused, largely uninhibited, on their core businesses, and often used the income to diversify their economies into higher-value added fields.

    The Obama administration has altered this tolerant regime, generating intensifying conflict between the NIMBY America and its more blue-collar counterpart. The administration’s move to block the Keystone XL oil pipeline from Canada to the Gulf of Mexico represents a classic expression of this conflict. To appease largely urban environmentalists, the Obama team has squandered the potential for thousands of blue-collar jobs in the Heartland and the Gulf of Mexico.

    In this way, Obama differs from Bill Clinton, who after all recognized the need for basic industries as governor of poor and rural Arkansas. But the academic and urbanista-dominated Obama administration has little appreciation for those who do the nation’s economic dirty work.

    NIMBY America’s quasi-religious devotion to the cause of global warming is the current main reason for their hostility to the basic economy. But it is all a part of a concerted, decades-long jihad to limit the dreaded “human footprint,” particularly of those living outside the carefully protected littoral urban areas.

    Oddly, in their self-righteous narcissism, the urbanistas seem to forget that driving production from more regulated areas like California or New York to far less controlled areas like Texas or China, may in the end actually increase net greenhouse gas emissions. The hip, cool urbanistas won’t stop consuming iPads, but simply prefer that the pollution making them is generated far from home, and preferably outside the country.

    The perspective in the Heartland areas and Texas, of course, is quite different. They regard basic industries as central to their current prosperity. Oil and gas, along with agriculture and manufacturing, have made these areas the fastest growing in terms of jobs and income over the past decade.

    Of course, the apologists for the NIMBY regions can claim that they, too, create economic value. And to be sure, Silicon Valley — now in a midst of one of its periodic boom periods — Wall Street and Hollywood constitute some of the country’s prime economic assets. Similarly, highly regulated cities such as New York, San Francisco, Seattle, Boston and Chicago offer a quality of life, at least for the well-heeled, that draws talent and capital from the rest of the world.

    But the NIMBY model suffers severe limitations. For one thing, these high cost areas generally lag in creating middle-skilled jobs; New York and San Francisco, for example, have suffered the largest percentage declines in manufacturing employment of the nation’s 51 largest metropolitan areas. Indeed with the exception of Seattle, the NIMBY regions have all underperformed the national average in job creation for well over a decade.

    These areas are becoming increasingly toxic to the middle class, especially families who are now fleeing to places like Texas, Tennessee, North Carolina and even Oklahoma. NIMBY land use regulations — designed to limit single-family houses — usually end up creating housing costs that range up to six times annual income; in more basic regions, the ratio is around three or lower.

    Ironically, America’s most ardently “progressive” areas turn out to be the most socially regressive, with the largest gaps between rich and poor. Even the current tech bubble has not been of much help to heavily Latino working-class areas like San Jose, where unemployment ranges around 10%, nor across the Bay in devastated Oakland, where the jobless rate surpasses 15%.

    To succeed, America needs both of its economies to accommodate the aspirations not only of its current population but the roughly 100 million more Americans who will be here by 2050. If the regions that want to maintain NIMBY values want to do so, that should be their prerogative. But stomping on the potential of other, less fashionable areas seems neither morally nor socially justifiable.

  • Durban, Reducing Emissions and the Dimensions of Sustainability

    The Durban climate change conference has come to an end, with the nations of the world approving the "Durban Platform," (Note 1) an agreement to agree later on binding greenhouse gas (GHG) reduction targets by 2020. The New York Times reported: "Observers and delegates said that the actions taken at the meeting, while sufficient to keep the negotiating process alive, would not have a significant impact on climate change."

    Not surprisingly, not all are pleased by the largely toothless agreement. Nnimmo Bassey, chair of Friends of the Earth international, told The Guardian:"Delaying real action till 2020 is a crime of global proportions." Todd Stern, the United States representative, signed on to the deal but noted that "there is plenty the US is not thrilled about."

    There is general agreement that any program to reduce GHG emissions must do so in the most efficient (least expensive) manner. The United Nations Intergovernmental Panel on Climate Change (IPCC) has concluded that sufficient emissions reductions can be achieved for between $20 and $50 per ton. Any cost above that must be considered wasteful and likely to reduce economic growth, while increasing poverty.

    Yet, researchers often leap from identifying a strategy to reduce GHG emissions to recommending its implementation, without ever examining the cost.

    Often  missed for instance, is that reductions in some sectors may prove less expensive than in others. The European Conference of Ministers of Transport has noted that "It is important to achieve the required emissions reductions at the lowest overall cost to avoid damaging welfare and economic growth." Across-the-board targets would misallocate resources, unnecessarily reducing economic growth and increasing poverty. This is particularly important in transport, because IPCC data indicates the potential for cost effectively reducing GHG emissions from this sector is considerably less than its contribution to emissions.

    GHG Emissions from Automobiles: In the United States and other high income nations, however, mandates are being pursued that would impose far higher costs. Our new report, published by the Reason Foundation, Reducing Greenhouse Gas Emissions from Automobiles reviews two general approaches. The first is behavioral approaches, the favorite of policymakers, that would force people to leave the suburbs to live in higher densities ("compact city" or "smart growth" policies) and discourage personal mobility. The second is facilitative approaches, which would reduce GHG emissions through technological advances, minimizing the necessity for command and control mandates over people’s lives.

    Behavioral Approaches: In what passes for the conventional wisdom, current thinking would require densification for virtually all new development, while trying to force people out of cars to travel by transit, bicycle or walking, all characterized as "sustainable" transport modes. Further, these strategies would seriously impede personal mobility by increasing travel times and reducing access to employment. This reduction in accessibility to jobs would be a backward step for any nation interesting in longer term economic growth (Note 2).

    The behavioral strategies are described in two principal US reports: Driving and the Built Environment which was produced by the National Research Council and Moving Cooler, by a consortium of organizations led by the Urban Land Institute and Cambridge Systematics. Each of these reports provides detailed estimates of the GHG emission reductions to be expected from land-use and mass transit strategies by 2050 in the United States.

    The reductions are relatively modest, averaging less than 5% from the early 2000s to 2050 .  Driving and the Built Environment indicates that the drafters did not agree its most aggressive scenario was achievable. Moving Cooler was soundly criticized by the American Association of State Highway and Transportation Officials and on these pages by leading transport consultant Alan E. Pisarski (see: ULI Moving Cooler Report: Greenhouse Gases, Exaggerations and Misdirections).

    These proscriptive policies focus on housing and land use even thought nearly all of the improvement in GHG emissions would result from automobile fuel economy improvements, not compact city policies. Depending upon the scenario, between 89% and 99% of the reduction in GHG emissions from cars by 2050 (Figure 1) would be the result of fuel economy improvements, rather than from compact city policies (based on comparison base year, early 2000s, fuel economy).

    Moreover, even the modest 1% to 11% reduction (5% average) in GHG emissions due to compact city policies are likely high because of greater traffic congestion, which neither report considers. Higher density urban areas, such as compact city policies would require, would spark greater traffic congestion. This means that cars travel slower and in more erratic traffic conditions. This, ironically, increases fuel consumption and GHG emissions per mile or kilometer. Thus, as noted here before, under these policies, GHG emissions from cars could actually increase.

    Neither Driving and the Built Environment nor Moving Cooler report considers the economic impact of compact city land rationing, which drives up housing prices and could thus be expected to impose higher costs on households. The economic literature is virtually unanimous in associating higher land and thus house prices with smart growth type land rationing policies. The increased costs could be many times the IPCC $20 to $50 per ton of GHG emissions removed.

    Even the popular assumption that suburban housing produces materially greater GHG emissions is questionable. Most US research fails to capture the common GHG emissions from elevators, heating, air conditioning, lighting, etc. in larger multi-unit housing, which are costs attributed to the building itself (landlord or condominium building) as opposed to  household energy bills (simply because there are no data). Yet, research in Australia indicates that common GHG emissions render higher density multifamily housing more GHG intensive than either townhouses or detached housing. Also escaping many researchers is the fact that carbon neutral housing is being developed, which could remove any GHG emissions differences between housing types.

    Compact city or smart growth policies have little potential to reduce GHG emissions and would do so at exorbitant costs that are well beyond those identified by the IPCC. This is not surprising, since compact city and smart growth policies have been widely touted long before the general concern over climate change. Denser cities have been pushed as a means to improve “community,” spur economic efficiency,   reduce air pollution and deal with such ephemeral – given recent massive energy finds – notions of “peak oil”.

    Facilitative Approaches: Any achievable program to reduce GHG emissions must be multi-dimensional and focus primarily on achieving that goal in the most economically and socially beneficial manner and not be based upon tired policies designed long ago to serve other agendas. There is no need for expensive and draconian compact city approaches. A report by McKinsey and the Conference Board concluded that substantial and cost effective GHG emission reductions were possible, “while maintaining comparable levels of consumer utility,” which was defined as “no change in thermostat settings or appliance use, no downsizing of vehicles, home or commercial space and traveling the same mileage.” In other words, there is no need to interfere with people’s lives or preferences (Note 3).

    The most promising approaches involve improvements in fuel economy. For example, Volkswagen has developed a two-seater car that achieves 235 miles per gallon (US) of gasoline or petrol (1 liter per 100 kilometers). With current fuel economy averaging little over 20 miles per gallon (12 liters per 100 kilometers) in the United States, the frontiers of fuel economy improvement have barely been approached.

    Moreover, substantial GHG emissions reductions can be achieved at levels far below 235 miles per gallon. The United States Department of Energy, Energy Information Administration (EIA) forecasts that even if driving increases 29% from 2005 to 2025, GHG emissions from cars would be reduced by 7% (Note 4). If, as is demonstrably possible, the EIA forecast fuel efficiency improvements were to continue to 2050, the reduction would be 19%, despite an increase in driving of more than 60%. At a slower driving growth rate more consistent with more recent trends, the reduction could be 33% (Figure 2).

    Further, if the US light vehicle fleet (cars and sport utility vehicles) were to achieve the current fuel economy performance of the best hybrid vehicles, the reduction in GHG emissions would be between 55% and 64% by 2050. Matching European performance forecasts would reduce GHG emissions even more.

    A substantial increase in the fastest growing sector of commuting, working at home (often telecommuting), could also help. Nothing can cut emissions more thoroughly than working at home, which produces zero GHG emissions. Yet, this innovation – which already surpasses transit use in most American metropolitan areas – inexplicably receives little or no attention from planners intent on herding people into higher densities and travel modes that take longer.

    The great advantage of facilitative approaches is that, as the McKinsey-Conference Board report indicates, people are permitted to live their lives as they prefer even as emissions are reduced.

    The Dimensions of Sustainability: Perhaps the greatest problem with behavioral approaches is that they may not be sustainable at all. Sustainability is multi-dimensional. Compact city and smart growth policies lack financial sustainability because they spend far too much per ton of GHG emissions. They lack economic sustainability because they would impose substantially higher costs, especially on housing prices. Ultimately, unless humans radically change their demonstrated preferences, compact city and smart growth policies may not be politically sustainable because people are likely to resist them either at the ballot box, or by moving – as demonstrated in the latest census – even further out from the urban core or to smaller, less regulated and less dense regions. All three dimensions of sustainability, financial, economic and political, must be prerequisites to material GHG emissions reductions.

    Notes:

    (1) Reuters provides an early summary of the Durban Platform.

    (2) The strong connection between economic growth and minimizing urban travel times is identified in research such as by Prud’homme and Lee at the University of Paris and Hartgen and Fields at the University of North Carolina, Charlotte.

    (3) The McKinsey-Conference Board report was co-sponsored by Shell, National Grid, DTE Energy and Honeywell, as well as environmental advocacy organizations, the Environmental Defense Fund, the Natural Resources Defense Council (NRDC),

    (4) Proponents of compact city policies sometimes claim that fuel efficiency improvements cannot reduce GHG emissions because the increase in driving neutralizes their impact. EIA projections indicate otherwise, as is shown here.

    Wendell Cox is a Visiting Professor, Conservatoire National des Arts et Metiers, Paris and the author of “War on the Dream: How Anti-Sprawl Policy Threatens the Quality of Life

    Photograph from BigStockPhoto.com

  • The Secret of Where Good Energy Comes From

    In the wake of Solyndra’s failure, pundits have latched on to a simple, compelling narrative: government can’t do energy right.

    From synfuels to solar panels to "clean coal" (written, inevitably, with knowing quotation marks), demonstration projects funded by the Department of Energy are described as one failed white elephant after another. Today the DOE is the agency everyone loves to hate (and, at least in Texas Gov. Rick Perry’s case, the agency to forget).

    What gets left out (and forgotten) is that virtually every one of today’s major energy technologies exists thanks to sustained US government investments in research, development, and demonstration. Consider:

    To be sure, not every DOE investment has succeeded. But even the projects frequently named as failures were often secret successes.

    Take synfuels. After the oil shocks of the 1970s, the US government created the synthetic fuels program. The program worked to produce fuel competitive with oil at $60 a barrel — the program’s objective. But when the price of oil dropped to $10 a barrel in the early 1980s, Congress sensibly abandoned the program. The total amount spent by Congress on SynFuels ended up being just $2 billion — cheap insurance against future oil embargoes and price shocks, which had sent the United States into a costly recession.

    Most people are surprised to learn that the SynFuels program was a success in another way: it led to the development of the technologies today used for coal gasification and carbon capture and storage, which captures coal plant emissions.

    Clean coal is ridiculed by greens and libertarians alike as pie-in-the-sky. In fact, carbon capture and storage has been demonstrated around the world. One descendent of SynFuels, Dakota Gasification, is to this day still producing gas and sequestering several million tons of CO2 each year at Weyburn in Canada.

    Or consider the case of an abandoned next generation nuclear plant on the Clinch River. The Washington Post singled it out to make a sweeping case against all public investments in advanced energy. What the Post didn’t mention is that, since 1949, the U.S. government has successfully demonstrated and tested more than 50 experimental reactor designs at the National Reactor Testing Station (now Idaho National Labs). One of them — the EBR-II — ran for 30 years at the testing station and was the technological predecessor to the integral fast reactor (IFR), which is increasingly viewed by experts as promising since it is so efficient, burning conventional nuclear reactor waste as fuel.

    Sometimes pundits point to natural gas drawn from shale as an example of how the private sector does the job better. They claim fracking and horizontal drilling were developed by a solitary entrepreneur named George Mitchell in the 1980s. In fact, the key breakthroughs in the development of shale gas technologies occurred thanks to intensive DOE demonstration efforts pursued by President Jimmy Carter, the frequent butt of energy-related jokes, in response to the 1970s oil embargoes.

    Look at what industry and independent experts say. "The Department of Energy was there with research funding when no one else was interested," said the head of Julander Energy, a member of the National Petroleum Council, "and today we are all reaping the benefits." A Senior Director at Halliburton said, "In the early 1980s, the industry as a whole did not have a clear vision for producing gas from shales, and benefited from DOE involvement and funding of [electro-magnetic telemetry] EMT technology… there is a clear line of sight between the initial research project and the commercial EMT service available today." Dr. Terry Engelder of Penn State calls the DOE’s Eastern Gas Shales Research Program "one of the great examples of value-added work led by the DOE."

    In the case of the "shale gas revolution," as in so many examples of breakthrough American innovations, it is this key interplay between public sector research, demonstration, and testing and private sector ingenuity and entrepreneurship that drives major advances in technology.

    To be sure, US investments in energy must be reformed. We should stop bluntly subsidizing the deployment of more of the same energy technologies — whether current-generation wind, solar, biofuels, or nuclear — and retool energy incentives to demand steady and continual innovation and cost improvements. Firms that out-innovate their competitors with next-generation clean energy improvements should be rewarded, and clean tech industries should put themselves on a clear path to subsidy independence over time. The big story about energy innovation remains unwritten. For most insta-experts on energy, it’s easier to just recycle the old one.

    Shellenberger and Nordhaus are co-founders of the Breakthrough Institute, a leading environmental think tank in the United States. They are authors of Break Through: From the Death of Environmentalism to the Politics of Possibility.

    Image from BigStockPhoto.com

  • Does a Big Country Need to do Big Things? Yes. Do We Need a Big Government to do them? No.

    TV network MSNBC’s left-leaning commentator Rachel Maddow has opened herself up to ridicule by the conservative blogsophere over her advert featuring the Hoover Dam. The thrust of the spot is that “we don’t do big things anymore” but that we should. But critics say the dam couldn’t be built today due to environmental opposition to exactly these kinds of projects. Indeed many in the Administration and their green allies are more likely to crusade for the destruction of current dams than for the building of new ones.

    Both sides have their points.

    Building the Hoover Dam was not uncontroversial, to say the least. But it has proven to be beneficial to millions of Americans (flood control, hydroelectric power, recreation, and water for homes, farms and factories). Truly, it has allowed the desert to bloom.

    Public goods like dams are not excludable (their use is not limited to paying customers), so only government can provide them, right? Well, as economist Jodi Beggs points out, there is certainly a case to be made for private ownership of seemingly public goods. The questions to be asked are:

    • Do the benefits to society of these projects outweigh the costs?
    • Could private enterprise provide this good or service if the government did not undertake the project itself?
    • Is there a compelling reason to ensure that everyone have access to this good or service?
    • If so, is there a way to ensure access without wholly providing the good or service?

    In support of the case for private ownership Beggs cites Dingmans Bridge, which provides a crossing of the Delaware River between Pennsylvania and New Jersey, one of the last private toll bridges in America. Ironic she should mention it, because for the past 40 years Dingmans Bridge was supposed to be deep under the water behind the Tocks Island Dam.

    The Big Dam that Never Got Built

    Although Tocks Island Dam was never built, 72,000 acres of land were acquired by the U.S. government, often by condemnation, including farms, homes, and businesses. Whole towns disappeared when people had to move away, including many historic roads and structures that featured prominently in the Revolutionary War. This land now constitutes the Delaware Water Gap Recreation Area, which I visited last August on my summer vacation. It was eerie, haunting, beautiful and amazingly empty on a warm summer’s day within a 90-minute drive from Manhattan (okay, maybe two hours).

    Many of the condemned homes, farms and buildings still exist, abandoned. As I drove through the area I could not help but think something has gone terribly wrong here, but what? Is it a story of government incompetence or good intentions gone bad? Or perhaps a story of NIMBYism run amok to throttle progress, development and future opportunity for future generations?

    The Tocks Island Dam Project had been under consideration even before the 1955 flood, which caused several deaths and immeasurable damage to the Delaware River basin. In 1965 a proposal was made to Congress for the construction of the dam. The Tocks Island National Recreation Area was to be established around the lake, which would offer recreation activities such as hunting, hiking, fishing, and boating. In addition to flood control and recreation, the dam would be used to generate hydroelectric power and to supply water to the cities of New York and Philadelphia.

    There was much local opposition to the project. My sister and brother-in-law have been locals for over 40 years and I can tell you, it’s still a touchy subject. The dam was disapproved by a majority vote of the Delaware River Basin Commission in 1975. With the United States still funding the Vietnam War, financial considerations came to the fore. Also, the geology was questionable for what would have been the largest dam project east of the Mississippi River.

    In 1992, the project was reviewed again and rejected with the provision that it would be revisited ten years later. In 2002, after extensive research, the Tocks Island Dam Project was officially de-authorized. But the heartache of dislocation remains.

    What are the lessons of the Tocks Island Dam?

    Well, if we apply Beggs’ qualifications, we find that the project’s benefits did not outweigh its social, political and economic costs. It would have been nice to know this before all that land was acquired, causing those homes, farms and businesses to be condemned and abandoned by force. Would the dam have prevented the recent damaging floods in New Jersey and Pennsylvania? No, the recent floods were off the Passaic River, not the Delaware. Have New York and Philadelphia experienced major water and/or electricity shortages in the past 40 years that the dam would have ameliorated? Not apparently.

    So we are left with this: even with highest purposes, best intentions and smartest people, government tends to get things wrong. It is not just the law of unintended consequences, but the law of government efforts having the opposite effect of those intended.

    What ever happened to Reinventing Government?

    In 1992 the concerns over government debt, deficits and unfunded liabilities were national issues (sad, ironic and maddening, isn’t it?). So strong were these concerns that they drove a Presidential candidate, Ross Perot, to the largest vote ever received (nominally and percentage-wise) by a national third-party candidate since the Bull Moose Party of Teddy Roosevelt. After Bill Clinton won that election – largely because of the votes Perot took away from George Bush – the newly-elected President would famously say, “The era of big government is over.” Oh, would that it were so.

    That same year saw the publication of a book by David Osborne and Ted Gabler, Reinventing Government: How the Entrepreneurial Spirit is Transforming the Public Sector. Oh, would that it were so. The most compelling concepts in that book (to me) were the privatization and contracting-out of government services – the transformation of government from the entity that provides services to the entity that makes sure needed services are provided.

    What happened? The concept of reinventing government is still alive, at least on the local and state levels; David Osborne is still fighting the good fight with the Public Strategies Group, but as he writes, “Reinventing public institutions is Herculean work.” And at the federal level we have had orgies of spending, debt and deficits.

    Of course, we still need to do big things: Keystone pipeline, anyone? How ironic the opposition to building big things comes from the political left, the greens. In contrast, big Labor generally supports infrastructure projects, but not universally and often with prohibitively expensive terms. One big advantage that FDR enjoyed – something rarely cited by progressives – was the lack of public employee unions.

    Meanwhile, a whole generation of underemployed blue collar youth is coming up, with few prospects and little of the can-do ethic that once propelled us to do big things. The President recently bemoaned this too – citing the Hoover Dam and Golden Gate Bridge. What he does not realize is that, more times than not, big government is now more of a hindrance to, than an agent of, needed and desired change.

    Dr. Roger Selbert is a trend analyst, researcher, writer and speaker. Growth Strategies is his newsletter on economic, social and demographic trends. Roger is economic analyst, North American representative and Principal for the US Consumer Demand Index, a monthly survey of American households’ buying intentions.

    Dingmans Bridge photo by Charlie Anzman via Flickr.

  • Gas Against Wind

    Which would you rather have in the view from your house? A thing about the size of a domestic garage, or eight towers twice the height of Nelson’s column with blades noisily thrumming the air. The energy they can produce over ten years is similar: eight wind turbines of 2.5-megawatts (working at roughly 25% capacity) roughly equal the output of an average Pennsylvania shale gas well (converted to electricity at 50% efficiency) in its first ten years.

    Difficult choice? Let’s make it easier. The gas well can be hidden in a hollow, behind a hedge. The eight wind turbines must be on top of hills, because that is where the wind blows, visible for up to 40 miles. And they require the construction of new pylons marching to the towns; the gas well is connected by an underground pipe.

    Unpersuaded? Wind turbines slice thousands of birds of prey in half every year, including white-tailed eagles in Norway, golden eagles in California, wedge-tailed eagles in Tasmania. There’s a video on YouTube of one winging a griffon vulture in Crete. According to a study in Pennsylvania, a wind farm with eight turbines would kill about a 200 bats a year. The pressure wave from the passing blade just implodes the little creatures’ lungs. You and I can go to jail for harming bats or eagles; wind companies are immune.

    Still can’t make up your mind? The wind farm requires eight tonnes of an element called neodymium, which is produced only in Inner Mongolia, by boiling ores in acid leaving lakes of radioactive tailings so toxic no creature goes near them.

    Not convinced? The gas well requires no subsidy – in fact it pays a hefty tax to the government – whereas the wind turbines each cost you a substantial add-on to your electricity bill, part of which goes to the rich landowner whose land they stand on. Wind power costs three times as much as gas-fired power. Make that nine times if the wind farm is offshore. And that’s assuming the cost of decommissioning the wind farm is left to your children – few will last 25 years.

    Decided yet? I forgot to mention something. If you choose the gas well, that’s it, you can have it. If you choose the wind farm, you are going to need the gas well too. That’s because when the wind does not blow you will need a back-up power station running on something more reliable. But the bloke who builds gas turbines is not happy to build one that only operates when the wind drops, so he’s now demanding a subsidy, too.

    What’s that you say? Gas is running out? Have you not heard the news? It’s not. Till five years ago gas was the fuel everybody thought would run out first, before oil and coal. America was getting so worried even Alan Greenspan told it to start building gas import terminals, which it did. They are now being mothballed, or turned into export terminals.

    A chap called George Mitchell turned the gas industry on its head. Using just the right combination of horizontal drilling and hydraulic fracturing (fracking) – both well established technologies — he worked out how to get gas out of shale where most of it is, rather than just out of (conventional) porous rocks, where it sometimes pools. The Barnett shale in Texas, where Mitchell worked, turned into one of the biggest gas reserves in America. Then the Haynesville shale in Louisiana dwarfed it. The Marcellus shale mainly in Pennsylvania then trumped that with a barely believable 500 trillion cubic feet of gas, as big as any oil field ever found, on the doorstep of the biggest market in the world.

    The impact of shale gas in America is already huge. Gas prices have decoupled from oil prices and are half what they are in Europe. Chemical companies, which use gas as a feedstock, are rushing back from the Persian Gulf to the Gulf of Mexico. Cities are converting their bus fleets to gas. Coal projects are being shelved; nuclear ones abandoned.

    Rural Pennsylvania is being transformed by the royalties that shale gas pays (Lancashire take note). Drive around the hills near Pittsburgh and you see new fences, repainted barns and – in the local towns – thriving car dealerships and upmarket shops. The one thing you barely see is gas rigs. The one I visited was hidden in a hollow in the woods, invisible till I came round the last corner where a flock of wild turkeys was crossing the road. Drilling rigs are on site for about five weeks, fracking trucks a few weeks after that, and when they are gone all that is left is a “Christmas tree” wellhead and a few small storage tanks.

    The International Energy Agency reckons there is quarter of a millennium’s worth of cheap shale gas in the world. A company called Cuadrilla drilled a hole in Blackpool, hoping to find a few trillion cubic feet of gas. Last month it announced 200 trillion cubic feet, nearly half the size of the giant Marcellus field. That’s enough to keep the entire British economy going for many decades. And it’s just the first field to have been drilled.

    Jesse Ausubel is a soft-spoken academic ecologist at Rockefeller University in New York, not given to hyperbole. So when I asked him about the future of gas, I was surprised by the strength of his reply. “It’s unstoppable,” he says simply. Gas, he says, will be the world’s dominant fuel for most of the next century. Coal and renewables will have to give way, while oil is used mainly for transport. Even nuclear may have to wait in the wings.

    And he is not even talking mainly about shale gas. He reckons a still bigger story is waiting to be told about offshore gas from the so-called cold seeps around the continental margins. Israel has made a huge find and is planning a pipeline to Greece, to the irritation of the Turks. The Brazilians are striking rich. The Gulf of Guinea is hot. Even our own Rockall Bank looks promising. Ausubel thinks that much of this gas is not even “fossil” fuel, but ancient methane from the universe that was trapped deep in the earth’s rocks – like the methane that forms lakes on Titan, one of Saturn’s moons.

    The best thing about cheap gas is whom it annoys. The Russians and the Iranians hate it because they thought they were going to corner the gas market in the coming decades. The greens hate it because it destroys their argument that fossil fuels are going to get more and more costly till even wind and solar power are competitive. The nuclear industry ditto. The coal industry will be a big loser (incidentally, as somebody who gets some income from coal, I declare that writing this article is against my vested interest).

    Little wonder a furious attempt to blacken shale gas’s reputation is under way, driven by an unlikely alliance of big green, big coal, big nuclear and conventional gas producers. The environmental objections to shale gas are almost comically fabricated or exaggerated. Hydraulic fracturing or fracking uses 99.86% water and sand, the rest being a dilute solution of a few chemicals of the kind you find beneath your kitchen sink.

    State regulators in Alaska, Colorado, Indiana, Louisiana, Michigan, Oklahoma, Pennsylvania, South Dakota, Texas and Wyoming have all asserted in writing that there have been no verified or documented cases of groundwater contamination as a result of hydraulic fracking. Those flaming taps in the film “Gasland” were literally nothing to do with shale gas drilling and the film maker knew it before he wrote the script. The claim that gas production generates more greenhouse gases than coal is based on mistaken assumptions about gas leakage rates and cherry-picked time horizons for computing greenhouse impact.

    Like Japanese soldiers hiding in the jungle decades after the war was over, our political masters have apparently not heard the news. David Cameron and Chris Huhne are still insisting that the future belongs to renewables. They are still signing contracts on your behalf guaranteeing huge incomes to landowners and power companies, and guaranteeing thereby the destruction of landscapes and jobs. The government’s “green” subsidies are costing the average small business £250,000 a year. That’s ten jobs per firm. Making energy cheap is – as the industrial revolution proved – the quickest way to create jobs; making it expensive is the quickest way to lose them.

    Not only are renewables far more expensive, intermittent and resource-depleting (their demand for steel and concrete is gigantic) than gas; they are also hugely more damaging to the environment, because they are so land-hungry. Wind kills birds and spoils landscapes; solar paves deserts; tidal wipes out the ecosystems of migratory birds; biofuel starves the poor and devastates the rain forest; hydro interrupts fish migration. Next time you hear somebody call these “clean” energy, don’t let him get away with it.

    Wind cannot even help cut carbon emissions, because it needs carbon back-up, which is wastefully inefficient when powering up or down (nuclear cannot be turned on and off so fast). Even Germany and Denmark have failed to cut their carbon emissions by installing vast quantities of wind.

    Yet switching to gas would hasten decarbonisation. In a combined cycle turbine gas converts to electricity with higher efficiency than other fossil fuels. And when you burn gas, you oxidise four hydrogen atoms for every carbon atom. That’s a better ratio than oil, much better than coal and much, much better than wood. Ausubel calculates that, thanks to gas, we will accelerate a relentless shift from carbon to hydrogen as the source of our energy without touching renewables.

    To persist with a policy of pursuing subsidized renewable energy in the midst of a terrible recession, at a time when vast reserves of cheap low-carbon gas have suddenly become available is so perverse it borders on the insane. Nothing but bureaucratic inertia and vested interest can explain it.

    Matt Ridley’s is a journalist and author. His books have sold over 850,000 copies, been translated into 30 languages, been short-listed for seven literary prizes and won three. His latest book “The Rational Optimist: How Prosperity Evolves” argues that human beings are not only wealthier, but healthier, happier, cleaner, cleverer, kinder, freer, more peaceful and more equal than they have ever been.

    Photo “Natural Gas Well at Sunset” by Rich Anderson

  • HELP WANTED: The North Dakota Boom

    The nation’s unemployment rate has been hovering at nearly nine percent since 2009. But not every state is suffering an employment crisis. In the remote, windswept state of North Dakota, job fairs often bustle with more recruiters than potential workers. The North Dakota unemployment rate hasn’t risen above five percent since 1987.  In the state’s oil country, unemployment hovers at around two percent, and pretty much everyone who wants a job—as long as they are old enough and not incarcerated—is employed.  North Dakota has either tied for or had the lowest unemployment in the country since 2008.   

    The job base of the state (population 672,500) has grown five percent in the past two years. Even more astonishing, there are over 16,000 unfilled jobs, and projections indicate that 45,000 more workers will be needed in the next two years.  Of those jobs, one out of three will be in oil and gas.

    The Booming West

    If you are willing to endure the blazing hot summers and bitterly cold winters, come to western North Dakota, young (or not) man (or woman) and you can get a job. Michael Ziesch has worked with Job Service of North Dakota for the past 15 years and is currently a manager in the Labor Market Information Center. “The average wage in oil and gas is $80,000 plus overtime, and there will likely be plenty of that,” said Ziesch.  Development of the massive Bakken oil field in the western part of the state has tapped out the local workforce.

     If you are not interested in an energy job, consider retail. Employers are paying $15 an hour for convenience store employees and fast food workers. Drive through any community in the area and you will be hard pressed to find a store front devoid of a sign shouting “Help Wanted, Now!” It seems that everything in the state these days ends with an exclamation mark, and for a state filled with unassuming, hardworking, family-centered kind of folks, it’s a little disconcerting.

    New North Dakotans

    Job seekers from outside the state are flocking to Williston, the unofficial capital of the oil boom, located in the remote northwestern corner of North Dakota. The population here has grown from 12,500 to an estimated 22,000 in the past five years.

    Williston is home to 350 oil service companies. Willistonlife.com, an employment and informational website built with the objective of attracting workers to the area, boasts that at any given time, over 1,200 job openings are available in the Williston area alone. On its home page, the website beckons to the nation’s unemployed in large white letters brightly juxtaposed against a black background, “Make Your Move!”

    The wildcat oil culture that the newly arrived encounter, though, is distinctly different than the risk-averse culture of the state. One “New North Dakotan” noted that although long-time residents of the state are pleasant (we smile a lot), helpful (there’s no better place to have a flat tire), kind (we’ll bring you a hot dish if you are sick), and polite (we almost always hold the door open for the person behind us), we are not quite “friendly.” We are a little guarded with folks we didn’t grow up with. Ethnic to us means Norwegian or German. We’re not used to accents other than our own. (And, no, we don’t talk like the actors in the movie Fargo.) One more thing — and this is important — we talk about the weather a lot.

    What should you know before you throw your last $100 in your gas tank and head up to Williston to make cold calls for jobs? Don’t come without a housing plan, or you may find yourself among the hundreds of parking lot denizens, living out of your car.

    New North Dakotans need places to live, creating an enormous construction boom. Williston formerly saw about five new homes a year. So far this year, 2,000 new homes have sprouted up. In 2012, the expectation is for 4,000 more along with apartments, hotels and, outside of town, dormitory-style housing facilities known as ‘man camps’. According to the Williston Herald, since the boom began, the market price of rental housing in Williston has jumped from $300 to $2,000 per month for a modest apartment. Hotels are full and booked for months, charging $170 to $200 a night.  

    Service is hard to come by. Waits of 45 minutes or more are not uncommon at fast-food restaurants. The Dairy Queen closes at 5:00 pm because they can’t retain enough staff to stay open any later, and many small businesses have simply closed their doors for lack of employees. The town’s Wal-Mart doesn’t have enough employees to stock the shelves, so boxes are simply laid open in the middle of the aisles for customers to grab what they need. Locals have discovered a “secret route” into the store to avoid the worst of the incoming traffic, and even the local Luddites have managed to learn how to use the self-checkout lanes as a matter of self-preservation. A professor at Williston State College complained recently that she had to text her husband with a request to pick up clothes hangers while he was out of town visiting relatives because local stores were completely sold out. It’s not only hangers; long lines and low inventory have made running everyday errands a vexing challenge. “It sounds crazy,” this same professor says, “but I order laundry detergent online and have it delivered by UPS to my front door.”

    At Williston State College, faculty often take out their own garbage to help out the strapped maintenance staff.  The school is seeing lower enrollments as students are drawn away from post-secondary education by the lure of instant cash.

    The law of supply and demand has kicked in across all sectors of the community. A severe shortage of contractors, plumbers and electricians means that homeowners wait weeks or even months for simple home projects. The local community college is putting out a second bid for a parking lot because, the first time, they didn’t get any bids at all.

    Even more disturbing in Williston are rumors of impending electricity shortages. Worried about brownouts and blackouts during the long North Dakota winter, many townspeople have picked up generators in Fargo, where they sell for $700, compared to the “sale” price of $1300 in Williston.

    Officials are quick to point out that the state’s larger cities, Bismarck and Fargo, are also thriving. In the Governor’s most recent State of the State address, he posited his explanation of ‘The North Dakota Miracle’: “It is about an educated workforce, low taxation, a friendly regulatory climate.” And if your state happens to be sitting atop 400 billion barrels of oil … hey, it can’t hurt.

    Energy Economics: Boom and Bust

    Oilmen have known for fifty years that beneath North Dakota’s surface lay billions of barrels of oil, perhaps as much as 4 million barrels per square mile.

    In 1952, The Wall Street Journal reported that Williston was receiving a “cornucopia of riches.” Banks were setting new deposit records weekly, and the population had jumped from 7,500 to 10,000.  In the early 1980s, oil prices skyrocketed and the region again became an exploration target as its vast deposits became economically feasible to drill. When prices began to slip, hitting a low of $9 a barrel by 1986, the boom faltered and, even more quickly than it began, it was over. The state spent the later part of the 1990s trying to recover from a brutal bust.

    Today, a perfect storm of two 21st century technologies, hydraulic fracturing and horizontal drilling, along with high prices and unprecedented demand, have come together to make drilling profitable, triggering a new boom that some experts say will be the biggest and longest lasting in the cycle of boom and bust. Conventional wisdom is that this time around the oil boom will be steadier and longer, because oil prices are no longer being defined by the cartels that once controlled the world’s oil prices and, therefore, the economics of energy. In the meantime, the oil pump jacks that dot the skyline are nodding their heads in greeting. Welcome to North Dakota.

    Debora Dragseth, Ph.D. is professor of business at Dickinson State University in Dickinson, North Dakota.

    Photo of Williston, ND traffic jam courtesy of Williston Department of Economic Development.

  • Surprise: Higher Gas Prices, Data Shows More Solo Auto Commuting

    Despite higher prices and huge media hype over shifts to public transit, the big surprise out of the 2010 American Community Survey has been the continued growth over the last decade in driving alone to work. Between 2000 and 2010, driving alone to work increased by 7.8 million out of a total of 8.7 million increase in total jobs. As a result, this use of this mode reached 76.5% of the nation’s workers, up from 75.6% in 2000. This is the largest decadal share of commuting ever achieved for this mode of transport.

    In view of the much higher gasoline prices that prevailed in 2010, it might have been expected that driving alone would lose market share from 2000 (Figure 1). But this did not — despite many media and academic claims that would or was already taking place — occur.

    The Census Bureau began compiling data on commuting in the 1960 census. In each census through 2000, commuting data was obtained through the census "long form" questionnaire. During the last decade, however, the Census Bureau has begun an annual survey, the American Community Survey, which includes commuting data and a considerable amount of additional data, and the decennial census survey was discontinued.

    Cars Dominate: There have been substantial changes in how the nation travels since the first survey in 1960. In 1960, 64% of the nation’s workers traveled by car. Separate data was not obtained for driving alone and carpools until 1980. The 2010 data indicates that 86.2% of employees used cars for the work trip in 2010. This was a slight reduction from 87.9% in 2000. But the anti-automobile crowd should not celebrate; all of the loss was due to a substantial decline in carpooling. In 2000, 12.2% of workers traveled by car pool. This figure dropped to 9.7% in 2010. With the higher gas prices, it might have been expected that carpooling would have become more popular, because of the lower costs from sharing experiences with other workers. This simply did not occur.

    Working at Home: The big winner among the nation’s commuting modes was working at home, a large share of which is telecommuting. Working at home increased from 3.3% of the workforce in 2000 to 4.3% of the workforce in 2010, for a market share increase of 33%, Overall 1.7 million more people work at home in 2010 than in 2000. It seems likely that the high gas prices encouraged a more working at home as did the move by companies to offload work to freelancers to reduce their costs or boost efficiency. Over the decade, gas prices increased 46%, adjusted for inflation, while the work at home market share increased 33% (Figure 2).

    Further, working at home, as indicated in a previous article, is poised to become the third most popular method of accessing work before 2020, passing transit and trailing only driving alone and carpooling (see Decade of the Telecommute). Working at home might have been much more popular in 1960, when it accounted for 7.2% of employment. But as many home-based industries lost share to chains and malls,   this figure fell by more than one-half by 1970 and then fell to 2.2% in 1980. The doubling of the work at home market share since that time, on the other hand, is attributable to the advances in information technology.

    Transit: Transit experienced by far its best decade since the Census Bureau began tracking commuting. Transit’s long market share slide came to an end, rising from 4.6% in 2000 to 4.9% in 2010. Even so, it might have been expected that a more substantial increase in transit commuting would have occurred as a result of the high gasoline prices. However, only an 8% increase in the transit market share occurred at the same time as gasoline prices increased a real 46%, less in percentage terms than the shift to working at home (Figure 2).

    Part of the problem was revealed in a Brookings Institution report. The percentage of metropolitan area jobs that can be reached by transit for the average worker is very low, which seriously limits transit’s potential for commuting use. Brookings data indicates that less than 10% of the jobs in major metropolitan areas can be reached within 45 minutes by transit by the average worker in major metropolitan areas (see Transit: The 4 Percent Solution). This is not only because transit service is infrequent in many parts of metropolitan areas, but also because it operates so much more slowly, on average, than cars. By comparison, the median work trip travel time by people driving alone is 21 minutes.

    Transit carried 12.1% of the nation’s commuters in 1960 and had fallen to 5.3% by 1990. The results of the last three decades indicate that transit commuting may have stopped declining but has reached a plateau, with only small increase.

    Recent decades have seen establishment and substantial expansion of urban rail systems. A principal rationale for these systems has been reducing traffic congestion, especially during peak hours. The majority of commuting takes place during peak hour and is principally responsible for peak hour traffic congestion. Between 2000 and 2010, Metros (subways and elevated) accounted for 48% of the increase in transit commuting, while buses and a trolley buses accounted for 43%. Light rail (trolleys and streetcars) accounted for less than 2% of the additional transit commuting, despite the fact that light rail has been the dominant form of rail transit expansion (Figure 3).

    Bicycling: It was also a good decade for bicycle commuting. Bicycling added nearly 250,000 new commuters and rose from 0.4% of the market in 200 to 0.5% in 2010. The increase in bicycle commuting was 15 times that of light rail. Bicycling was first surveyed by the Census Bureau in the 1980s census, when its market share was also 0.5%.

    Walking: There was little change in walking as a form of commuting. In 2000, 2.9% of commuters walked to work, a figure that dropped to 2.8% in 2010. However, walking has suffered even greater losses than transit over the last 50 years. In 1960, 9.9% of commuters walked to work.

    The Future? One thing is clear from the data of the last decade. There has been no sea-change in commuting, even with the huge gasoline price increases. Few analysts would have predicted that single-occupant commuting would have increased at a time of both high gasoline prices and high joblessness. Further, as the shift to personal mobility continues, the largest percentage increases will like take place in telecommuting, arguably the most energy-efficient form of transport.

    Data from 1960: The table below summarizes work trip access market shares over the 50 years of data collection by the US Census Bureau.

    US Work Access by Mode: 1960-2010
    COMMUTERS 1960 1970 1980 1990 2000 2010
    Car, Truck or Van 41,368,062 59,722,550 81,258,496 99,592,932 112,736,101 118,123,873
    Drove Alone     62,193,449 84,215,298 97,102,050 104,857,517
    Car Pool     19,065,047 15,377,634 15,634,051 13,266,356
    Transit 7,806,932 6,514,012 6,007,728 5,890,155 5,867,559 6,768,661
    Bicycle     468,348 466,856 488,497 731,286
    Walk only 6,416,343 5,689,819 5,413,248 4,488,886 3,758,982 3,797,048
    Other or Unspecified 4401718 2240864 1289613 1225420 1243866 1,595,942
    Work at Home 4,662,750 2,685,144 2,179,863 3,406,025 4,184,223 5,924,200
    Total 64,655,805 76,852,389 96,617,296 115,070,274 128,279,228 136,941,010
               
    MARKET SHARE 1960 1970 1980 1990 2000 2010
    Car, Truck or Van 64.0% 77.7% 84.1% 86.5% 87.9% 86.3%
    Drove Alone     64.4% 73.2% 75.7% 76.6%
    Car Pool     19.7% 13.4% 12.2% 9.7%
    Transit 12.1% 8.5% 6.2% 5.1% 4.6% 4.9%
    Bicycle     0.5% 0.4% 0.4% 0.5%
    Walk only 9.9% 7.4% 5.6% 3.9% 2.9% 2.8%
    Other or Unspecified 6.8% 2.9% 1.3% 1.1% 1.0% 1.2%
    Work at Home 7.2% 3.5% 2.3% 3.0% 3.3% 4.3%
               
    Notes          
    Other includes taxicabs, motorcycles and other
    Blank cells indicate no data
    Taxicab included in transit in 1960
    Workers 14 and over, 1960 & 1970. Workers 16 & over, subsequent censuses
    US Census Bureau data


    Wendell Cox is a Visiting Professor, Conservatoire National des Arts et Metiers, Paris and the author of “War on the Dream: How Anti-Sprawl Policy Threatens the Quality of Life

    Photo: Junction of Interstates 110 (Harbor Freeway) and 105 (Glenn Anderson Freeway) in Los Angeles, which carry four varieties of passenger transport, cars, busway, high-occupancy vehicles and light rail (by author). 

  • Gassing Up: Why America’s Future Job Growth Lies In Traditional Energy Industries

    In his new book, The Coming Jobs War, Gallup CEO James Clifton defines what he calls an “all-out global war for good jobs.” Clifton envisions a world-wide struggle for new, steady employment, with the looming threat of “suffering, instability, chaos and eventually revolution” for those who fail to secure new economic opportunities.

    In the U.S., this conflict can be seen as a kind of new war battle the states, each fighting not only for employment but for jobs that pay enough to support a middle-class lifestyle.

    My colleagues at Praxis Strategy Group and I have looked over data for the period after the economy started to weaken in 2006. Using stats from EMSI, based on data from the Bureau of Labor Statistics, we compared sectors by growth, and then by average salary.

    Not surprisingly “recession-proof” fields such as health care and education expanded some 11% over the past five years. More inexplicably, given its role in detonating the Great Recession, the financial sector expanded some 10%.

    But the biggest growth by far has taken place in the mining, oil and natural gas industries, where jobs expanded by 60%, creating a total of 500,000 new jobs. While that number is not as large as those generated by health care or education, the quality of these jobs are far higher. The average job in conventional energy pays about $100,000 annually — about $20,000 more than finance or professional services pay. The wages are more than twice as high as those in either health or education.

    Nor is this expansion showing signs of slowing down. Contrary to expectations pushed by “peak oil” enthusiasts, overall U.S. oil production has grown by 10% since 2008; the import share of U.S. oil consumption has dropped to 47% from 60% in 2005.  Over the next year, according to one recent industry-funded study, oil and gas could create an additional 1.5 million new jobs.

    This, of course, violates the widespread notion that the future lies exclusively in the information and technology industries. While technology may well be ubiquitous, as a sector it is far from a reliable creator of high-wage jobs. Since 2006 the information sector has hemorrhaged over 330,000 jobs. And those who do have jobs make on average about $20,000 less than their oil-stained counterparts per year.

    How about those “green jobs” so widely touted as the way to recover the lost blue-collar positions from the recession? Since 2006, the critical waste management and remediation sector — a critical portion of the “green” economy — actually lost over 480,000 jobs, 4% of its total employment. Pay here is lower still, averaging something like $32,000 annually, about one-third that of the conventional energy sector.

    The future of the rest of the “green” sector seems dimmer than widely anticipated. One big problem lies in cost per kilowatt, where wind is roughly twice as expensive and solar at least three times as expensive as electricity produced with natural gas. Given the Solydra   bankruptcy  and their inevitable impact on the renewables industry, it’s also pretty certain that the U.S., at least in the near term, will not be powered by windmills and solar panels.

    So instead of tilting windmills or taking out the trash, what about joining the much ballyhooed “creative class”?  Not so great a bet for those limited in talent or nepotism. The arts, entertainment and recreation sector gained about half as many total jobs as energy, and the pay is nothing to write home about. The average salary for these creative souls is about $27,000, slightly higher than for food service workers, but barely a quarter of the average salary for the oil and gas-dominated sector.

    The relative strength of the energy sector can be seen in changes in income by region over the past decade. For the most part, the largest gains have been heavily concentrated in the energy belt between the Dakotas and the Gulf of Mexico. Energy-oriented metropolitan economies such as Houston, Dallas, Bismarck and Oklahoma City have also fared relatively well. In energy-rich North Dakota there’s actually a huge labor shortage, reaching over 17,000 — one likely to get worse if production expands, as now proposed, from 6000 to over 30,000 wells over the next decade.

    What message does this send to politicians seeking to turn around our moribund economy? Perhaps   they should target oil and gas development as a spur not only to new employment, but to the kind of “good jobs” that Gallup’s Clifton speaks about. With the proper environmental controls, these industries could provide a major jolt to the economy while cutting down on energy imports, reducing debts and bringing jobs back home. As long as Americans consume oil and gas, why not produce close to the market and with reasonable environmental controls?

    The monthly proliferation of new energy finds can provide a much brighter future than many have anticipated. Industry experts say that the shift in energy exploration is moving from the Middle East to the Americas, with rich deposits of oil and gas uncovered from Brazil to the Canadian oil sands.

    Much of the new action is on the U.S. mainland, including the Dakotas, Montana and Wyoming. Increasingly, there’s excitement about finds in long-challenged sections of the Midwest such as Ohio. The Utica shale formation, according to an estimate by Chesapeake Energy, could be worth roughly a half trillion dollars and be, in the words of CEO Aubrey McClendon, “the biggest to hit Ohio, since maybe the plow.”

    Ohio now has over 64,000 wells, with five hundred drilled just year. Recent and potential finds, particularly in the Appalachian basin, could transform the Buckeye State into something of a Midwest Abu Dhabi, creating more than 200,000 jobs over the next decade. The new finds could also help Ohio fund its depleted state coffers without imposing either debilitating budget cuts or economically self defeating new taxes.

    The energy boom also has sparked a spate of new factory expansions, including a $650 million new steel mill to make pipes for gas pipelines. Other local firms are gearing up to make up specialized equipment like compressors.

    Michigan, another perennially hard hit state, is also looking at new energy finds to turbocharge its gradually recovering industrial sector.  While risible former Gov. Jennifer Granholm pushed the notion that Michigan’s recovery lay in “cool cities” and green jobs, the state’s current leaders are focusing on more down-to-earth — and under-the-earth — solutions as part of a strategy to revive industrial production.

    Such growth anywhere is good news, particularly in Midwestern blue-collar towns that have borne the brunt of the recession. Since 2006 manufacturing and construction have shed some 5 million jobs combined — jobs that pay above-average wages, far better than those earned in growing fields such as health care, education or the lower-end service sector.

    The surest road to recovery does not lie in the chimera of “green jobs” or by magically harvesting riches from social networks. It’s in making America a more self-reliant and productive power. The new spate of energy in the Midwest and elsewhere in the country may be one way to do this, if we have the will to take full advantage.

    This piece originally appeared at Forbes.com.

    Joel Kotkin is executive editor of NewGeography.com and is a distinguished presidential fellow in urban futures at Chapman University, and an adjunct fellow of the Legatum Institute in London. He is author of The City: A Global History. His newest book is The Next Hundred Million: America in 2050, released in February, 2010.

    Analysis and charts by Mark Schill, Praxis Strategy Group.

    Photo by flickr user thorinside

  • The Explosion of Oil and Gas Extraction Jobs

    From Appalachia to Alaska, the growth is eye-popping. Thousands of new jobs have sprouted up, most well-paying and all boons to their regions. There’s no denying oil and gas extraction jobs are on the rise, and not just in Texas and Oklahoma.

    North Dakota is drilling oil at a blistering pace. Pennsylvania and West Virginia, along with parts of New York and Ohio, are seeing a natural gas boom with their Marcellus Shale reserves. And Colorado, Wyoming, Alaska, and other Western states are adding extraction jobs in droves.

    The six fastest-growing jobs for 2010-11, according to EMSI’s latest quarterly employment data, are related to oil and gas extraction. This includes service unit operators, derrick operators, rotary drill operators, and roustabouts. Each is expected to grow anywhere from 9% to 11% this year, in an otherwise stagnant economy.

    But that’s not all. A mixed bag of other extraction and petroleum-related jobs—wellhead pumpers, all other extraction workers, geological and petroleum technicians—are also expected to see healthy gains. In total, nine of the top 11 fast-growing jobs in the nation are tied in one way or another to oil and gas extraction.

    Occupation

    2010 Jobs

    2011 Jobs

    Change

    % Change

    Service unit operators, oil, gas, and mining

    42,110

    46,766

    4,656

    11%

    Derrick operators, oil and gas

    23,323

    25,747

    2,424

    10%

    Rotary drill operators, oil and gas

    28,116

    30,981

    2,865

    10%

    Roustabouts, oil and gas

    75,636

    82,678

    7,042

    9%

    Helpers, extraction workers

    44,303

    47,247

    2,944

    7%

    Petroleum engineers

    29,063

    30,917

    1,854

    6%

    Biomedical engineers

    16,065

    17,061

    996

    6%

    Wellhead pumpers

    24,186

    25,616

    1,430

    6%

    Extraction workers, all other

    23,423

    24,784

    1,361

    6%

    Geological and petroleum technicians

    35,304

    37,205

    1,901

    5%

    What’s driving this employment spike? A push for increased domestic oil production is certainly a factor, as are technology breakthroughs in collecting massive shale gas deposits. But more subtle shifts are also happening, including how federal and state agencies track the oil and gas extraction workforce.

    A Prime Example

    For a case study on the skyrocketing employment picture on the shale front, just look at Pennsylvania. Without a tax on natural gas extraction and perfectly located to take advantage of the Marcellus Shale formation, parts of the commonwealth have become a hotbed for drilling. More than 3,000 wells have been drilled in the last three years, and much more is expected in coming years.

    Since 2008, Pennsylvania has added more than 15,000 jobs in the mining, quarrying, and oil and gas extraction industry, a 41% jump. Only Texas and Oklahoma have added more of these jobs in the last three years. Meanwhile, North Dakota has seen an 80% jump in employment in this sector, second only to Delaware since 2008.

    Where are these well-performing oil and gas jobs located? We mapped the data for the four fastest-growing jobs — roustabouts, service unit operators, derrick operators, and rotary drill operators. Here’s what we found: Texas and Oklahoma of course have a large percentage of these jobs, but California, Alaska, and other Western states have a fair share, too.

    The map below shows 2-year job growth in these oil and gas extraction jobs for every county in the continental US. Williams County, North Dakota is No. 1 with 1,539 jobs added, which amounts to 80% growth.

    More Than a One-Year Trend

    Mining, quarrying, and oil and gas extraction is expected to grow 6% in the US from 2010-2011. That’s the fastest projected growth among the 20 broadest-level industries—twice the rate in fact, as the next fastest-growing industry (administrative and support and waste management and remediation services,).

    This is hardly a one-year bump, though. Over the last five years, the explosion in the sector has been than staggering—even with a minor employment dip from 2009-2010. The industry added more than 345,000 jobs nationally from 2007 to 2009, and is expected add another 85,000 this year, which equals 11% growth.

    It’s also helpful to break out mining and oil and gas extraction from the broad sector to more specific industries to locate the real driver of the growth. In this case, it’s easy to see: Of the 506,401 new jobs in the sector since 2006, more than 431,000 have been in the crude petroleum and natural gas extraction industry (NAICS 211111). This sub-sector has grown by a whopping 113% nationally in the last six years while mining (except oil and gas) remains at its ’06 employment level.

    Every state except for Maine has added jobs in crude petroleum and natural gas extraction since 2006, with Texas, Oklahoma, California, and Kansas leading the way.

    The Rise of Contract Oil and Gas Workers

    In last month’s GOVERNING Magazine, William Fulton wrote about the “1099 economy”—the shift by employers to hire temporary workers who file a 1099 form with the IRS rather than a W-2 and don’t receive benefits. No other industry has seen this move to 1099 workers more dramatically than mining, quarrying, and oil and gas extraction.

    A recent EMSI analysis revealed that the share of 1099 workers in this sector increased from 33% in 2005 to 53% in 2010, the biggest percentage jump among the 20 broadest-level industries. Mining, quarrying, and oil, and gas extraction now has the third-highest share of contract workers, behind real estate (74%) and agriculture, forestry, fishing and hunting (68%).

    At least part of this influx could be attributed to land owners cashing in on royalties after leasing their property for drilling. Through the quirks of how the Census’ Bureau of Economic Analysis* tracks the oil and gas extraction industry — and how the industry data is tied to occupations — some of these jobs could be counts of landowners who are claiming additional income from oil and gas royalties. If that’s the case, these jobs would be better placed in the real estate and leasing industry.

    Please note: For these reasons, EMSI “noncovered” data (i.e., data on 1099 workers plus more traditional state data, etc.) for oil and gas jobs should be treated with caution. Also, the jobs numbers for 2010 are estimates at this point, so it will take more time to see how these trends play out.

    *The Bureau of Labor Statistics measures only workers covered by unemployment insurance and who thereby file a W-2. EMSI’s “complete” dataset adds proprietors and other “noncovered” workers by combining BLS and state data with various Census datasets.

    Joshua Wright is an editor at EMSI, an Idaho-based economics firm that provides data and analysis to workforce boards, economic development agencies, higher education institutions, and the private sector. He manages the EMSI blog and is a freelance journalist. Contact him here.

    Lead illustration by Mark Beauchamp.