Tag: Environment

  • Vertical Urban Farming? Pull Your Head from the Clouds

    Dickson D. Desposmmier, in a recent op-ed in the New York Times, argues that the world, faced with increasing billions of mouths to feed, will soon run out of land. According to Mr. Despommier, “the traditional soil-based farming model developed over the last 12,000 years will no longer be a sustainable option.”

    Despommier’s answer to this ‘problem’: “move most farming into cities, and grow crops in tall, specially constructed buildings.” Such vertical farms, argues Despommier, would “revolutionize and improve urban life,” while also addressing issues such as agricultural runoff, air pollution, and carbon emissions.

    To sophisticated urbanites with little or no exposure to agriculture, vertical farming may seem to present a sort of utopian panacea. But first one must look at the underlying problem Mr. Despommier claims to address: land shortages.

    In this case, Despommier fails to show that land shortages will be a debilitating issue, rather than a manageable challenge. Desposmmier presents figures from the UN showing that the amount of arable land per person has dropped from one acre per person in 1970 to about half an acre in 2000, and may drop toward a third of an acre per person by 2050. This simply means that future generations will have less land available per person. But, does this necessarily translate into impending, persistent, worldwide food shortages?

    Even prior to the time of Thomas Malthus, there have been voices warning of disaster lying just around the bend with regards to food production and consumption. Yet, over the past two centuries, those tilling the soil (full disclosure: the author comes from a long line of family farmers, and has, from time to time, taken part in some ‘soil tilling’ of his own) have continued to keep pace with ever-increasing demands for food. True, the equitable distribution of this increased productivity sometimes leaves something to be desired (often for reasons of politics, not of production), but one cannot dispute the fact that farmers worldwide have made massive leaps and bounds in productivity.

    In the face of less acreage per human, the UN’s Food and Agriculture Organization continues to track increasing output per capita, and projections for the future show production levels able to meet increasing demand. One notable Dutch study showed the world’s farmers, using existing land resources, capable of feeding up to 10 billion people at least a “moderate diet,” if not an affluent one. Such projections have been supported by a “sizable literature,” some of which argues that future production of food will not be an overwhelming challenge, even at populations up to 12 billion. Between 1960 and 2000, the world’s farmers were able to increase food produced per capita, while the world’s population nearly doubled. We have now reached a point where Americans throw away around 14% of the food they buy.

    Making better use of the food we already produce, including gleaning of wasted food, and shifting land away from production of non-food crops, would be common-sense steps towards combating current and future food insecurity. Making better, more efficient use of our existing arable land makes more sense, both now, and in the future.

    High-rise urban farming, however, is not the solution. Even if we assume that the world will, as Despommier fears, face potential shortages of arable land in the future, the solution he proposes is far from the most feasible initial solution. In his piece, Mr. Despommier states that a prototype farm, covering one eighth of a city block and consisting of 5 stories, would cost around 20 to 30 million dollars to construct. A vertical farm of such size might mean around five acres of indoor production space (city blocks vary in size from place to place). Despommier states that one indoor acre might be able to replace 20 acres of outdoor farmland. So, giving the benefit of the doubt on cost to Despommier, for 20 million dollars his vertical farm might be able to match 100 acres of outdoor production: a cost per acre of around 200,000 dollars.

    For that same 20 million dollars, Despommier could purchase nearly 7,500 acres of productive, existing farmland in a state such as Minnesota or North Dakota, (the national average cost for an acre of farmland is about $2,600) and farm it with the latest in sustainable, organic, and/or low or no-till methods, already being implemented by many American farmers. Such practices can minimize or eliminate chemical use, reduce fossil fuel use, and help prevent erosion of valuable soil. In order to match his indoor production, financed at massive cost, Despommier would only need to find a way to increase the outdoor output by very small percentages, using land that is far less costly and readily available. As an added benefit, he’d have the opportunity to protect and preserve the very land he sees as under threat.

    Potentially more valuable still would be aiding farmers worldwide in the use of the most modern, sustainable, and environmentally-friendly practices in areas facing severe underutilization and degradation of valuable arable land resources. Since 1961 farmers in Asia have been able to increase their output by nearly threefold, while yields per acre in Africa have remained stagnant. Investing more resources in agricultural extension services to educate and empower local farmers in soil conservation, land stewardship and sustainable production techniques would be a common sense step towards addressing such challenges that would not require the construction of expensive towers, and would allow farmers to protect and preserve the world’s existing arable land while battling local food insecurity. In fact, according to one prominent soil scientist, protecting and restoring soil, the “most basic of resources,” offers “the chance not only to fight hunger but also to attack problems like water scarcity and even global warming.”

    Unfortunately, investing resources in such plans, using existing, tenable resources, might preclude Mr. Despommier from building a shiny new building in New York City, where “everyone” could see it. The more cynical observer might also point out that it could cut off a potential revenue stream for his new vertical farm business, which he envisions being financed by “venture-capital funds.”

    While vertical farms might be an interesting topic for light-hearted discussion, there is a reason we don’t farm intensively in urban areas: the land is too expensive, with costs that rise even higher building towering structures. That said, encouraging use of local agricultural products, even adjacent to or within urban areas, is a laudable goal. This supports the sort of family farmers that serve as good stewards of the land Despommier sees as under threat. Mr. Despommier need look no farther than his employer’s own Columbia University Greenmarket to find a farmer’s market supplying the very sort of agricultural product he extols and desires. Encouraging urban gardening is also a great idea, allowing people to take an active role in providing some of their own food, while making use of potentially underutilized spaces, at much less cost than “building up.”

    There are, to be sure, challenges to be faced moving forward: recent commodity price spikes (which have since abated) inflicted increased food insecurity on the world’s poor. However, such populations are the least likely to be able to afford the gleaming towers of Despommier’s dreams. Despommier and those interested in sustainable agriculture, including many farmers, will be better off trying to protect our existing farmland from urban sprawl, and supporting the use of the latest in sustainable agricultural practices worldwide, to better use and protect the farmland we already possess.

    On the other hand, promoting wildly expensive, Buckminster Fulleresque “leaps of faith”, while neglecting existing resources, is not the path towards long-term agricultural sustainability. Instead of pouring limited financial resources into building fields in the sky to serve as playthings for the urban elite and venture capitalists, farmers, governments and investors worldwide would be better served by plowing resources into making better, more sustainable use of the land that already exists, for the benefit of all.

    Matthew is a Research and Development Analyst for Praxis Strategy Group, and a native of Crary, ND.

  • The Costs of Climate Change Strategies, Who Will Tell People?

    Not for the first time, reality and politics may be on a collision course. This time it’s in respect to the costs of strategies intended to reduce greenhouse gas emissions. The Waxman-Markey “cap and trade” bill still awaits consideration by the US Senate, interest groups – mainly rapid transit, green groups and urban land owners – epitomized by the “Moving Cooler” coalition but they are already “low-balling” the costs of implementation.

    But this approach belies a bigger consideration: Americans seem to have limits to how much they will pay for radical greenhouse emissions reduction schemes. According to a recent poll by Rasmussen, slightly more than one-third of respondents (who provided an answer) are willing to spend $100 or more per year to reduce greenhouse gas emissions. About 2 percent would spend more than $1,000. Those may sound like big numbers, but they are a pittance compared to what is likely to be required to meet the more than 80 percent reduction in greenhouse gas emissions that the Waxman-Markey bill would require. Even more worryingly for politicians relying on voters to return them to office, nearly two-thirds of the respondents would pay nothing to reduce greenhouse gas emissions.

    If we do a rough, weighted average of the Rasmussen numbers, it appears that Americans are willing to spend about $100 per household per year (Note 1). This includes everyone, from the great majority, who would spend zero to the small percentage who would spend more than $1,000. At $100 per household, it appears that Americans are willing to spend on the order of $12 billion annually. This may look like a big number. But it is peanuts compared to market prices for greenhouse gas emissions. This is illustrated by the fact that the social engineers whose articles of faith requires building high speed rail to reduce greenhouse gas emissions would spend $12 billion to construct just 150 miles of California’s proposed 800 mile system.

    Comparing Consumer Tolerance to Expected Costs: At $100 per household, Americans are prepared to pay just $2 per greenhouse gas ton removed. All of this is in a policy context in which the United Nations Intergovernmental Panel on Climate Change suggests that $20-$50 per greenhouse gas ton is the maximum that should be spent per ton. The often quoted McKinsey/Conference Board study says that huge reductions in greenhouse gas emissions can be achieved at $50 or less, with an average cost per ton of $17. International markets now value a ton of greenhouse gas emissions at around $20. At $2 per ton, American households are simply not on the same “planet” with the radical climate change lobby as to how much they wish to spend on reducing greenhouse gases.

    International Comrades in Arms? This is not simply about Americans and their perceived differences from others who are so often considered more environmentally sensitive. France’s President Sarkozy has encountered serious opposition in proposing a carbon tax on consumers to discourage fossil fuel use. He is running into problems not only among members of the opposition, but concerns have also been expressed by members of his own party. It appears that many French consumers (like their American comrades) are more concerned about the economy than climate change at the moment.

    China, India and Beyond: If only a bit more than one-third of American households are willing to pay much of anything to reduce greenhouse gas emissions, it seems fair to ask what percentage of households in China, India and other developing nations are prepared to pay anything? A possible answer was provided recently by India’s environment minister, Jairam Ramesh, who released a report predicting that India’s greenhouse gas emissions would rise from the present 1.2 billion tons to between 4 and 7 billion tons in 2030. The minister said the “world should not worry about the threat posed by India’s carbon emissions, since its per-capita emissions would never exceed that of developed countries.” . At the higher end of the predicted range, India would add more greenhouse gas emissions than the United States would cut under even the proposed 80 percent reduction scheme. Suffice it to say that heroic actions to reduce greenhouse gas emissions seem unlikely in developing countries so long as their citizens live below the comfort levels of Americans and Europeans.

    Lower Standard of Living not an Option: I have been giving presentations on this and similar subjects for some years. I have yet to discern any seething undercurrent of desire on the part of Americans (or the vast majority anywhere else) to return to the living standards of 1980, much less 1950 or 1750. Neither Washington’s politicians nor those in Paris or any other high income world capital are going to tell the people that they must accept a lower standard of living. Nor is there any movement in Washington to let the people know that their tolerance for higher prices could well be insufficient to the task.

    For Washington, the dilemma is that every penny of the higher costs will hit consumers (read voters), whether directly or indirectly. There could be trouble when the higher utility bills begin to arrive and it could mean difficulty in delivering on the primary policy objective of virtually all governments, which is to remain in power. This is not to mention the unintended consequences of higher prices on many key industries, notably agriculture, manufacturing, and transportation.

    There is an even larger concern, however, and that is the stability of society. Harvard economist Benjamin Friedman, in The Moral Consequences of Economic Growth suggested from an economic review of history that economies that fail to grow lapse into instability.

    A Public Policy Collision Course? A potential collision between economic reality and public policy initiatives could be in the offing. Many “green” proposals are insufficiently sensitive – even disdainful – towards the concerns of everyday citizens. This suggests that politically there should be an emphasis only on the most cost effective strategies. In a democracy, you must confront to the reality that people are for the most part more concerned about the economy than about strategies meant to slow climate change.

    The imperative then is not to ignore the problem, but to focus on the most rational, low-cost and effective greenhouse gas emission reduction strategies. Regrettably, it does not appear that Washington is there yet. The special interests whose agendas are to cultivate and reap a bounteous harvest of “green” profits or to convert the “heathen” to behaviors – such as riding transit and living in densely packed neighborhoods – that they have been advocating long before the climate change issue emerged.

    Those concerned about the future of the environment also have to pay attention to reality. Reducing greenhouse gases is not a one-dimensional issue. Environmental sustainability cannot be achieved without both political and economic sustainability.


    Note 1: The Rasmussen question was asked of individuals. It is assumed here, however, that the answers related to households. One doubts, for example, that a queried mother answered with an assumption that she would pay $100, her husband would pay $100 and each of the kids would pay $100, but rather meant $100 for the household, since, to put it facetiously, few households devolve their budgeting to the individual members.


    Wendell Cox is a Visiting Professor, Conservatoire National des Arts et Metiers, Paris. He was born in Los Angeles and was appointed to three terms on the Los Angeles County Transportation Commission by Mayor Tom Bradley. He is the author of “War on the Dream: How Anti-Sprawl Policy Threatens the Quality of Life.

  • Alaska To Stimulus Funds: Yup, We’ll Take ‘Em

    Earlier this month the Alaska state legislature, in a special session, voted 44-14 to accept $28.6 million in stimulus funds that Sarah Palin had rejected in May. Sean Parnell, Alaska’s governor since Palin’s resignation, says the money will be used primarily for energy efficiency improvements in public buildings.

    The tale of the showdown between Palin, the state legislature, and the federal Department of Energy may ultimately reveal as much about state sovereignty under the current administration in Washington as it does about Alaska’s internal politics.

    Palin has more than once made her case for rejecting the stimulus money — or at least a portion of it — clear: her objection is that the American Recovery and Reinvestment Act calls for the adoption of the International Energy Conservation Code in exchange for the funds, which would set new standards for things like window fenestration and lighting equipment in new and remodeled commercial and residential buildings. Such codes, however, could be a logistical nightmare for some communities to adopt and for the state to enforce.

    Alaskan buildings are architecturally diverse, each constructed for a particular climate and geography. Homeowners in Ketchikan, for example, where it rains nearly every day of the year, have different concerns than those in Valdez, where the average yearly snowfall is 325 inches. Many communities in the state are only accessible by boat or plane, so the shipping of supplies is costly and inefficient. Economic hardship and subsistence are also the normal standard of living in many of the remote, rugged Alaskan towns and villages.

    Because of these circumstances, the state has always permitted local governments to set their own building codes. Most of the villages choose not to have building codes at all. All things considered, monitoring energy code compliance in perpetuity would easily cost the state more than $28.6 million. Palin also has noted that the state has hundreds of millions of dollars already budgeted for energy efficiency and renewable energy projects, so the less than $30 million in stimulus funds really aren’t a substantial addition to the state’s effort.

    Her rejection of the funds sparked a debate that was carried out in press releases, official letters, and Anchorage Daily News editorials. A legislator from Anchorage claimed in an op-ed piece that Palin was “denying” Alaskans much needed funds, and that rejecting money from the stimulus package brings to mind the old saying, “two wrongs don’t make a right.” The co-chairs of the state senate resources committee wrote a letter urging Palin to consider Missouri’s proposal (accepted by the Department of Energy) which would fulfill the mandate with a 90% compliance rate on the local level, exempting communities with populations under 2,500 and structures without plumbing and electricity. There are enough major Alaska communities that have already adopted energy codes, they said, that the state either already meets or could easily meet the federal requirements in the necessary time frame.

    Palin responded to these opponents with her own editorial and press releases, and an Anchorage architect agreed with her in another op-ed, suggesting that while Alaska has long built energy efficient buildings out of cold weather necessity, the two senators’ numbers for 90 percent compliance didn’t add up. The primary result of taking the money, he claimed, would be “a new regulatory requirement to verify compliance.”

    The disagreement hinged on everyone’s interpretation of the DOE’s language. The initial mandate required “assurances” from the governor that local communities with the authority to do so “will implement” the codes. Because there is no statewide energy code in Alaska and the state constitution supports local self-government, Palin took the stance that this requirement would put her outside of her jurisdiction as governor. She and her staff exchanged letters with the DOE in attempt to clarify the possibility of the Missouri option, and the degree to which the state would be required to oversee code implementation and compliance.

    The DOE admitted that the code mandate wasn’t appropriate for all states, but said the Missouri option was part of the Missouri governor’s “broader commitment” to “work proactively” with communities and the legislature to improve energy efficiency, implying, perhaps, that despite Alaska’s success in these areas, the governor’s personal involvement was non-negotiable. Revisions were offered, but Palin was still dissatisfied with the DOE’s language. Proponents of taking the money suggested that the DOE’s revisions required the governor to work “within the extent of her authority” to promote the building codes, not to actively enforce them. Palin didn’t agree with this interpretation, saying she didn’t want the role of dictating or influencing local policies.

    As a state with a cold climate and an economy vulnerable to volatile fuel prices, Alaska has indeed taken its own steps to improve energy efficiency in recent years. In addition to independently adopted energy codes in most of the major cities and hundreds of millions budgeted for state energy projects, there has been an admirable home energy rebate program in place for several years; homeowners can have their houses audited for energy efficiency and be reimbursed up to $10,000 for making recommended improvements.

    It’s hard to imagine, though, that the legislature’s motives in opposing Palin’s decision were entirely pure. Palin and the legislature had a combative relationship over budget issues for most of her tenure as governor, and this was an opportunity for them to demonstrate their clout. It’s telling, too, that the legislature rejected Parnell’s proposal to extend their special session (which was held primarily to overturn Palin’s veto) by one day in order to extend a year-long suspension of the state’s 8-cent gas tax, which will now be reinstated September 1. The legislature may choose to suspend the gas tax again when the regular session begins in January, but their lack of urgency to act on the issue undermines their claim that the stimulus funds are urgently necessary to help keep Alaskans’ energy costs down.

    Of course, Palin’s own stance has been calculated as well. She initially wanted to decline roughly half of Alaska’s $930 million allotment, and her vocal anti-stimulus statements garnered national attention, which helped establish her as a critic of the Obama administration in her own right, independent of her role in McCain’s presidential campaign. By the time the smoke cleared, however, she was rejecting only this $28.6 million. Critics have said that it looks like a token amount, chosen to make a strategic political statement.

    In her op-ed piece, she noted that during her time as a Wasilla city council member and then mayor, the city experienced a boom in growth that made building codes an issue of great contention. Wasilla is notably missing on the list of major communities that have independently adopted energy codes, which would suggest that it would be one of the key cities that would have problems with a statewide energy code.

    After the legislature’s vote, Sean Parnell wrote to the DOE accepting the funds, noting his own disapproval of the mandates. He quoted an August DOE statement that the state legislature “does not need to adopt, impose and enforce a statewide building code in order to qualify,” making clear that he was accepting the funds on the basis of that statement. He also provided the DOE with “assurances”, not that state or local codes would be adopted, but that the Regulatory Commission of Alaska “will seek to implement general policies to promote energy efficiency and maintain just and reasonable rates while protecting the public.”

    Ultimately, if Alaska holds its ground and does not adopt the IECC, Palin and the legislature may have unwittingly conspired to successfully challenge the federal government’s encroaching influence on the state’s affairs. Perhaps not coincidentally, the legislature unanimously passed a 10th amendment state sovereignty resolution while they were hashing out the stimulus funds controversy, and Palin signed it weeks before resigning as governor. It will be interesting to see how the DOE handles Alaska’s obstinance…and how the Alaska legislature responds if the DOE calls their bluff down the road and asks how the codes are coming along.

    Andrea Gregovich is a writer and translator living in Anchorage.

  • Do Home Energy Credits Need A Remodel?

    With the home building industry in peril, you would think that legislators would come up with immediate solutions to help foster new home construction. And there are now two well known Federal programs regarding housing: one is the $8,000 tax credit for first time home buyers, and the other is the 30% energy tax credit for a select few components of home remodeling.

    The $8,000 credit for first time home buyers is a good idea, and seems to have helped at least a few buyers purchase homes. Of course, it’ s not clear how many purchased bargains on previously owned homes and how many actually purchased new homes.

    The 30% energy tax credits are a different matter. I’m against the current incarnation of the program for a host of reasons:

    Problem No. 1: The 30% tax credit applies to only a few select items that somehow qualified, and there’s no (simple) way to get on the approved list. In addition, Energy Star certification assures that the “product” has gone through some scrutiny on performance and reliability. But what of the equally important installers?

    Problem No. 2: New construction gets very limited tax credits. When retrofitting existing houses, tax credits apply to the installation of efficient windows and insulation. But new construction (along with remodels) is not eligible unless it includes Geothermal, Solar Hot Water, or Solar Electricity. These benefits are meaningful only to those with enough income to make a credit of this size enticing. The middle and upper class homeowners who are willing to finance these upgrades hope that the after-tax benefits will make the investment worthwhile.

    In theory, of course, the ticky-tacky downtrodden neighborhoods built after World War II can also be upgraded…to become energy efficient ticky-tacky downtrodden neighborhoods. But the energy credit will not benefit those that need it the most: those in the lower income strata that find it difficult to survive from pay check to pay check. A 30% tax credit does them no good at all. Even if the tax credit made sense for downtrodden neighborhoods, none of the older homes would ever become nearly as energy efficient as new construction.

    As an example, let’s say 50 homes in a low income neighborhood did take advantage of the tax credits and upgraded their windows and insulation, and added geothermal design because that was the only option approved for the benefits. This would easily add up to well over $50,000 per home – at least $2,500,000 – of which almost a million dollars is funded by you, the tax payer.

    As an alternative, the 50 houses could be leveled, and excess streets abandoned to create a large developable contiguous tract of land. New home builders on the verge of bankruptcy, and even corporate national builders, could easily reinvent their business to build new urban neighborhoods using more efficient development patterns. To upgrade a new affordable home with more energy efficient windows would cost $2,000, an inch of foam insulation added to exterior walls would be another $2,000, and a high efficiency heating and cooling design just another $2,000. This highly efficient new home would use a fraction of the energy of an upgraded old home, and would add only $300,000 for all 50 homes. New neighborhoods could also have a fraction of the environmental impact of older ones, if planned using newer techniques. Low income families can live in new green neighborhoods, and the home building industry can find a new market while curbing sprawl at the same time…

    Any politicians reading this? (see study).

    Problem No. 3: The current tax credits promote overkill. Almost all the recent Green Certified Homes sold in the Minneapolis area had geothermal design as part of their package. Certainly a home builder increases profits by including a complex geothermal system instead of a simple, highly efficient and low cost conventional heating and cooling system. Building a new, well insulated home results in a significant reduction of heating and cooling energy needs, and the upgrade to a highly efficient system on a new home costs as little as $3,000 extra. But if the home design is not geothermal it will not get tax credits. A passive solar designed home gets free heat on sunny days — also not eligible for tax credits — but a $50,000 geothermal system is.

    Problem No. 4: The current tax credits are creating a false economy for the very few businesses that manufacture approved items. Without the tax credits, these suppliers and manufacturers would need to come in at a reasonable price point/payback ratio to generate the volume of sales necessary to be profitable. In other words, they would have to invent, innovate, and deliver systems that make sense or fail in the marketplace. As soon as the tax credit ends many will not survive. An article on energy tax programs of the 1980s and the “tin men” that sold under-performing systems shows how 95% of the manufacturers of that era went out of business when the Carter era tax benefits ended. What happens to the warranty and guarantees when the company is no longer around?

    So what’s the solution to the problems? Either fix the tax credit program, or do away with it.

    Make the program flexible enough so that new innovations can be accommodated, and make the system itself easy to access. This would encourage companies to be competitive, and give hope to start-ups that cannot right now get financing. The current application system favors well-funded, big corporations, and is far too restrictive in its scope. Have the tax credit apply to window and insulation upgrades above the “standard for code”, and include all heating and cooling systems that are above the 90% efficiency typically included in new construction. Even a tax credit limited to the price difference created by the upgrade would jump start both the green industry and new home construction.

    And while we’re jumpstarting…let’s not forget a little history. During the dot-com crash earlier this decade, unscrupulous promoters bilked investors out of billions of dollars on false promises. These promoters did not disappear, they simply moved to the next opportunity: mortgage and real estate. Quick profits from flipping real estate created an economy that was un-policed and unsustainable. Let’s not permit energy upgrades supported with a 30% tax credit to become the next unsustainable wave.

    Rick Harrison is President of Rick Harrison Site Design Studio and author of Prefurbia: Reinventing The Suburbs From Disdainable To Sustainable. His website is rhsdplanning.com.

  • Vetting the Volt: Toward Meaningful Electric Car Fuel Consumption Ratings

    The 230 Miles per Gallon Claim: The General Motors (GM) announcement last week that the Chevrolet Volt would achieve 230 miles per gallon in city driving and a rating of more than 100 miles per gallon with combined city and highway driving sadly contains more hype than reality. The Chevrolet Volt is a plug-in hybrid vehicle that GM intends to begin marketing in 2010. GM has indicated that the car will be able without gasoline for 40 miles, on its rechargeable battery. After the battery is depleted, the car would begin to use gasoline. The 230 mile per gallon figure, according to GM, was calculated using a proposed but yet not revealed Environmental Protection Agency fuel economy testing procedure. Similarly, the details of the GM calculation were not revealed.

    Criticisms: Rather than the expected praise, the GM claim was met by a barrage of questions and criticism. Consumer Reports said that the 230 miles per gallon claim might be the exaggeration of the century. Automaker Nissan, facetiously responded with a claim that its forthcoming all electric (not hybrid) “Leaf,” would achieve 367 miles per gallon in a Twitter post. Nissan, unlike GM can be excused for not providing the details of its calculation, since it was “making fun.” EPA distanced itself from the GM announcement, indicating that it had not yet tested the Volt.

    The criticisms and questions revolved around a single issue: How had General Motors calculated the 230 miles per gallon figure. Regrettably, General Motors has yet to provide a complete answer.

    From the sketchy details released, it appears that the 230 mile per gallon rating was based upon the assumption that a driver would travel less than 40 miles each day and recharge the battery at night. Using this methodology, there would never be a reason for the car to use gasoline, so long as the daily mileage is less than the battery capacity.

    A New EPA Rating System: Reportedly, the EPA’s fuel economy testing procedure for plug-in electric vehicles (whether hybrid or not) will report kilowatt hours (KWH) of electricity consumed per 100 miles. Presumably, this rating will be placed on the fuel economy window sticker on new cars, perhaps alongside some miles per gallon conversion. GM indicates that the Volt will consume 25 kilowatt hours per 100 miles in city driving.

    Policy Imperative for Improving Fuel Efficiency: The impetus for improving automobile fuel economy is being driven by public policy objectives to reduce greenhouse gas emissions, especially carbon dioxide (Note 1), and away from the consumption of petroleum .

    Even though the Volt will produce no greenhouse gas emissions from its tailpipe when operating in the electric mode, the electricity that drives its battery would come from power plants, many of them relying on fuels like coal, which produce high amounts of greenhouse gas emissions. In fact, coal accounts for roughly 30 percent of all electricity production in the country; other fossil fuels another 35 percent.

    A Flawed EPA Fuel Economy Rating System? Neither the GM calculation nor apparently the proposed EPA rating system include greenhouse gas emissions from electricity generation. A greenhouse gas gram emitted from an electric power plant smokestack has the same impact as one from an auto tailpipe. Any EPA fuel efficiency rating system that does not take into consideration power generation emissions would be shockingly incomplete and misleading. Consumers would not be given reliable information on the greenhouse gas emissions from cars they might purchase. One would expect that a government committed to greenhouse gas emission reduction would task its implementing agency with ensuring the availability of relevant and reliable information.

    Power Generation and Plug-In Cars: On average in the United States, the generation of each KWH produces 610 grams of carbon dioxide (1.35 pounds). By comparison, combustion of a gallon of gasoline emits nearly 8,900 grams of carbon dioxide. Thus, nearly one gallon of gasoline is the equivalent of approximately 15 KWH of electric power in its greenhouse gas emissions (Note 2).

    Thus, if the Volt uses 25 KWH to travel 100 miles in an urban area, then the greenhouse gas emissions from generating its power will be somewhat over 15,000 grams (Note 2), or the same as 1.7 gallons of gasoline (Note 3). Under these average operating conditions, the Volt would achieve approximately 60 miles per gallon (Note 4).

    Exaggeration Doesn’t Help: Now there is nothing to be ashamed about 60 miles per gallon, unless, that is, you have claimed 230 miles per gallon. Regrettably, General Motors, which could have claimed a great environmental advance, has diminished it by failing to “level” with the public. This kind of public relations will not help a company whose performance has cost it market share for well over a generation. .

    The Volt (and the Leaf) Will Get Better: Of course the equivalent miles per gallon would be much higher if US power generation were more efficient. And, it will be. For example, it has been proposed that electric power generation needs to become at least 80 percent less greenhouse gas intensive by 2050. If this is accomplished, the Chevrolet Volt could indeed achieve 230 equivalent miles per gallon and perhaps the Leaf 367. But neither car will reach these plateaus in the short term.

    A Better Fuel Economy Rating System: Since the EPA fuel economy rating system has not been finalized, its potential defects can be corrected. Any EPA fuel economy rating system should include a greenhouse gas emissions indicator. This should be provided for city driving, for highway driving and a combined overall figure. Moreover, such a rating must include the very real emissions that occur at the power plant. It would be appropriate for EPA to continue reporting miles per gallon and adding KWH per 100 miles, so that the cost impacts are clear to purchasers.

    Regional Variations: There is another complicating factor – regions. For example, in North Dakota fuel economy would be approximately 35 miles per gallon equivalent with full electric operation, well below the average 60 equivalent miles per gallon. On the other hand, in the state of Washington, the Volt would achieve its 230 miles per gallon equivalent, nearly 7 times the North Dakota fuel efficiency. This is not because people in Washington are more environmentally sensitive than North Dakotans. The difference is in type of power generation. Nearly 80 percent of Washington’s power is generated by hydro-electric and nuclear plants, which produce virtually no carbon dioxide emissions. On the other hand, nearly 80 percent of North Dakota’s electric power is produced with fossil fuels. These differences will be moderated as electric power production becomes less greenhouse gas intensive.

    The Bottom Line: Despite the exaggeration and misleading information, this story is far more positive than negative. Congratulations to General Motors (and Nissan) on the strong advances they have apparently made in vehicle technology. This is just further evidence of the potential of human ingenuity. From the 150 mile per gallon cars to which President Obama is committed to the zero emission petroleum car system demonstrated by a Georgia Tech team, the good news is that people can continue to live as they like, while admirably reducing their greenhouse gas emissions to meet whatever objectives are ultimately adopted.


    Notes
    1: Carbon dioxide accounts for the overwhelming share of greenhouse gas emissions from motor vehicles.
    2: Calculation: 8,900 (divided by) 610
    3: Calculation: 25 KWH (times) 610
    4: Calculation: 15,000 grams (divided by) 8,900 grams
    5: Calculation: 100 (divided by) 1.7
    6: A grams per mile rating system should include “upstream” activities, such as the greenhouse gas emissions required to produce and distribute petroleum, which by various estimates increases the emissions by 20 to 25 percent. Similarly, upstream electric power production emissions should be included.


    Wendell Cox is a Visiting Professor, Conservatoire National des Arts et Metiers, Paris. He was born in Los Angeles and was appointed to three terms on the Los Angeles County Transportation Commission by Mayor Tom Bradley. He is the author of “War on the Dream: How Anti-Sprawl Policy Threatens the Quality of Life.

  • Immigrants Are ‘Greening’ our Cities, How About Giving them a Break?

    Debate about immigration and the more than 38 million foreign born residents who have arrived since 1980 has become something of a national pastime. Although the positive impact of this population on the economy has been questioned in many quarters, self-employment and new labor growth statistics illustrate the increasingly important role immigrants play in our national economy.

    There has also been an intense debate within the environmental community about the impact of immigrants. Yet there has been relatively little research done about how immigrants get to work and where most immigrants live. As the ‘green’ movement in the U.S. has increasingly pushed for higher-density housing and transit-oriented development in order to improve public transportation (specifically rail), few have considered how immigrants use transit and what might be the best way to accommodate their needs. In fact, all too often, “green” policies advocate transit choices – favoring such things as light rail over buses – that may work against the interests of immigrant transit riders.

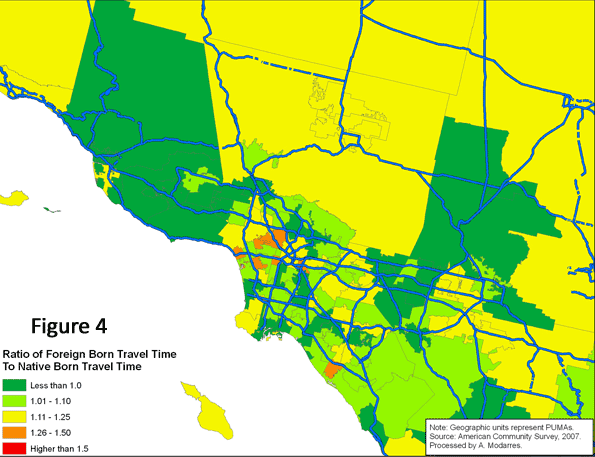
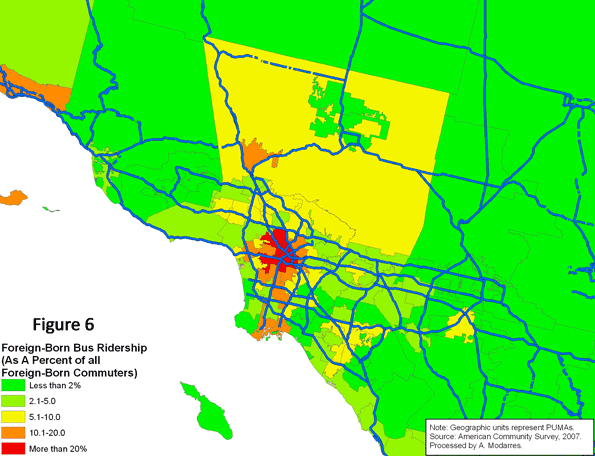
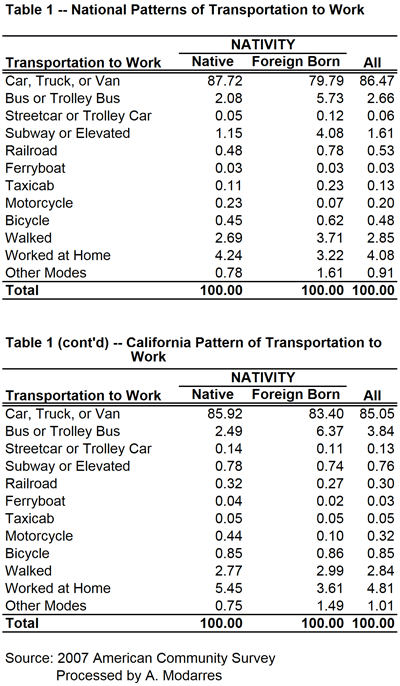
    Based on the 2007 American Community Survey, 117.3 million native-born and 21.9 million foreign-born individuals commuted to work. As Table (1) illustrates, a higher percentage of immigrants rode buses (5.7% vs. 2.1%) and subways (4.1% vs. 1.2%) and many walked to work (3.7% vs. 2.7%). A much smaller percentage drove to work (79.8% vs. 87.7%). Unfortunately, despite their higher usage of alternate means of transportation to work, or perhaps because of it, the commute to work time was on average longer for the foreign-born commuters than their native-born counterparts (28.8 minutes versus 24.7).

    Clearly in terms of using public transportation, immigrants are a bit greener than those born here. But why? Is this habit formed elsewhere? In that case, are recent immigrants even more likely to use public transportation than those who immigrated earlier? Or is it their income that affects their transportation choices?

    Table (2) provides the answer to the first question. Recent arrivals are clearly less likely to drive to work and have a higher propensity toward using public transportation, compared to all foreign-born individuals (and significantly more than the native-born). Additionally, over 6% of the immigrants who have arrived since 2000 walk to work.

    Overall, more than a quarter of the immigrants who have arrived since 2000 use an alternative mode of transportation to work. If the rest of America could do the same, we’d be a bit ‘greener’ already. However, it seems that as immigrants stay longer, they eventually tend to use cars more often because automobile usage allows for access to better jobs, better shops, and better schools. For example, immigrants who arrived in the U.S. in the 1970s (which means they have been here over three decades) drive a bit more and use public transportation less.

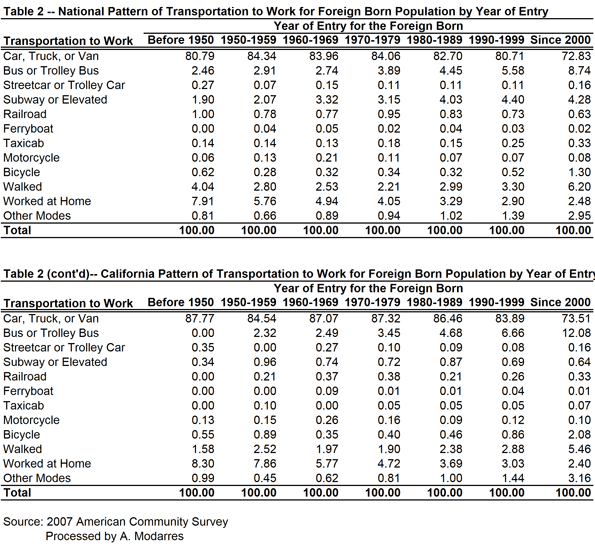
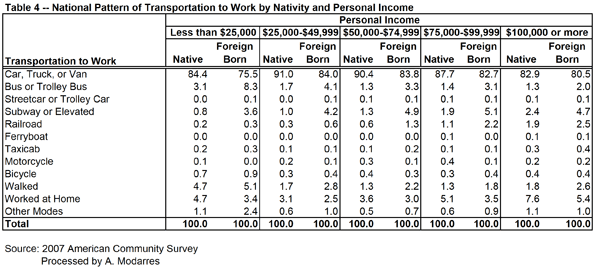
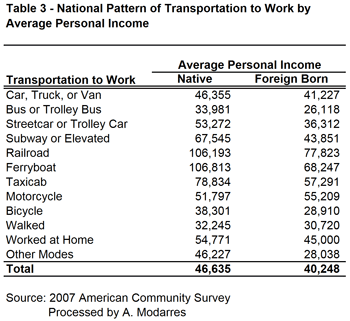
    Even so, their rates are still slightly better than the native-born (compare Tables 1 and 2). This may be in part because of their lower incomes (see Table 3) yet at every level of income they are still more likely to take transit. Table (4) illustrates this point by grouping commuters into income categories and their nativity. In every income category, immigrants use their cars less and are more likely to use public transportation, even though their car ridership increases with income.

    The message from these statistics is loud and clear. Immigrants are more likely to ride public transportation than those born in the U.S., regardless of their income. The ones arriving more recently are even more likely to do so. Overall, this suggests that familiarity with public transportation, combined with the effects of income and place of residence, has made the immigrants’ lives in the U.S. a bit ‘greener’ than those of the native-born. In fact, one factor that may contribute to their higher usage of public transportation stems from their living in neighborhoods whose densities are, on average, 2.5 times higher than those of the native-born. Immigrants, in essence, are doing precisely what planners want the rest of us to do.

    Moving to Southern California

    Southern California still stands as the icon of immigration and multiculturalism and is home to a large number of immigrants in the urban region that extends from eastern Ventura County to the southern tip of Orange County and the Inland Empire. As Figure (1) illustrates, in a number of neighborhoods in Southern California, the foreign-born population outnumbers the native-born by large margins. For example, in areas west and south of downtown Los Angeles, immigrants are more than three times as numerous as the native-born.

    A comparison of Figures (2) and (3) suggests a wide geographic difference between the native-born and the foreign-born and how long it takes them to get to work. The foreign-born population experiences much longer commutes in highly urbanized areas around downtown Los Angeles and the San Gabriel Valley. Conversely, in the more rural areas, such as northern Ventura County, the foreign-born population experiences shorter commutes compared to their native-born counterparts.

    Figure (4) provides a clear comparison of average travel time to work for both populations (visually comparing Figures 2 and 3). In all areas appearing in the darkest shade of green, the foreign-born population experienced shorter commutes compared to the native-born. These shorter commutes, however rarely occur in high density areas (compare with Figure 5). Conversely, in areas such as Santa Monica, the Wilshire corridor, East Los Angeles, and southern sections of downtown Los Angeles, the foreign-born population experiences much longer commutes than the native-born.


    Statistically speaking, there is a positive relationship between average travel time and density – i.e., the higher the density, the higher the reported average travel time. For the foreign-born population who live in higher density areas, this means much longer commutes, a problem caused by a number of factors, including their dependency on slower public transportation systems and the long distances they have to travel to reach job centers outside the city center.

    Figure (6) illustrates the geographic pattern of bus ridership among the foreign-born commuters. As with national patterns, immigrants in Southern California are more likely to settle in high density areas and use public transportation to work, but unfortunately, they also suffer much longer commutes.

    What should the policy responses be? One may be to promote increased car ownership among immigrants and low-income populations in the U.S. This may be objectionable to some environmentalists and planners, but it’s clear that those people who live by the principles of higher density and public transportation use are not rewarded and indeed suffer longer commutes.

    An even more relevant question is why advocates for public transportation focus disproportionately on rail, when buses are so frequently used by low income populations, including immigrants. In California, these riders outnumber the native-born on buses. The situation is reversed on rail and subways. An intelligent policy response to public transportation planning would suggest that buses should receive much more attention. Major metropolitan areas have become polycentric in their employment patterns, and most major employment centers are located at long distances from the central city. Specially-designed buses for reverse commutes could help alleviate transportation problems while helping working immigrants reach their destinations more quickly.

    This challenges the priorities of some public transport advocates, who tend to focus on very expensive rail projects designed primarily to draw more middle class, largely native-born riders who commute to places like downtown Los Angeles. Meanwhile those ‘new’ Americans who already live by a number of ‘green’ standards suffer from the misallocation of transit resources. Those who are already doing what we hope the middle class will do deserve better.

    Ali Modarres is an urban geographer in Los Angeles and co-author of City and Environment.

  • One Step for Short-term Economic Stimulus, and One Giant Leap (backward) for U.S. Energy Sustainability

    The “cash for clunkers” (or CARS) program that was widely predicted to be extended by the Congress has been, if nothing else, a clear public relations win for the Obama Administration. It may also be, at least for the short-term, a shot in the arm for the beleaguered American auto industry (including domestic dealerships of foreign car companies, like Honda and Toyota). But the program’s extension may also be bad news for anyone who was hoping that candidate Obama’s campaign promises to fix our domestic energy policy would translate into something resembling a robust make-over.

    Don’t get me wrong; I am a huge fan of President Obama. And I am generally very supportive about what the Administration is trying to do. The President’s agenda is nothing if not ambitious, or may be better described as audacious. In no particular order, President Obama is seeking to fix the environment, reform the healthcare system, overhaul banking and financial services regulations, reverse a downwardly spiraling national and global economy, repair race relations in America, and get drivers to cease texting and talking on their cell phones while driving.

    And yet, one of President Obama’s greatest strengths may also be his greatest weakness: The willingness and ability to compromise, as it is the fundamental nature of compromise that the outcome will inevitably be less than ideal. This consequence of compromise can be seen clearly in the President’s efforts to secure Congressional approval of an additional $2 billion in funding for the CARS program.

    The initial concept behind CARS was elegant in its simplicity: give owners of “gas-guzzlers” (i.e. automobiles with highly inefficient internal combustion engines) a monetary incentive to trade their fuel inefficient vehicles for highly fuel-efficient replacements. The auto industry – albeit more centered in Tokyo than Detroit on this point – clearly is producing numerous passenger vehicles capable of achieving a combined city/highway rating of 30 miles-per-gallon (mpg) or more. Yet there remain a number of registered motor vehicles in the U.S. with substantially less than 18 mpg ratings under the program (any vehicle with a mpg rating above that is not worthy of the “clunker” moniker).

    If this was the Administration’s original goal for the CARS program, the $1 billion authorization could have had a considerable impact on fuel consumption. Assuming the maximum rebate of $4,500 on every trade-in, almost a quarter of a million (222,222 to be exact) fuel-inefficient vehicles would have been voluntarily taken off America’s roads. Great idea! Triple that program funding amount to $3 billion, coupled with the same lofty goal, and two-thirds of a million fuel inefficient cars would have been swapped out for highly fuel efficient cars. If the average driver puts 12,000 miles per year on a car, and the average improvement in fuel efficiency is 12 mpg (i.e. from 18 mpg to 30 mpg) the program would save 1,000 gallons of gas per car, per year, or 666,666,000 gallons of gas annually.

    If only this purpose – to incentivize drivers to purchase only the most fuel efficient vehicles – had remained the thrust of the CARS program. However, it seems that the elegant simplicity behind the CARS concept became intertwined in the “since the government now owns GM and Chrysler don’t you think we should do something to spur domestic car sales” debate. All of a sudden, light trucks (the product type on which the Big Three hung their hats and, subsequently, on which they were hung by their collective petard) became eligible provided they are more fuel-efficient than the millions of light trucks already registered and on domestic highways. So, instead of a rising fleet of truly efficient cars we now see sales of new SUVs of all sizes and dimensions, and not just the recently introduced hybrid versions, being allowed a “cash-for-clunkers” rebate. All that is necessary is for the trade-in vehicle to qualify under CARS and the newly purchased SUV achieve a paltry 18 combined mpg.

    In other words, the concept behind the initial legislation appears to have quickly devolved from “let’s incentivize the best consumer behavior possible when it comes to fuel efficiency” to “let’s get people to buy passenger cars, SUVs, and light trucks.” The Hummer H3, for example, with an MSRP of less than $45,000 (the maximum MSRP allowed under CARS), and a combined city/highway mpg of 18, could qualify for the rebate program (hoping the irony is not lost on anyone that a vehicle, the Humvee, that was the exclusive product of a publicly owned entity, the Defense Department, ended up being the product of another publicly owned entity, GM).

    There’s no doubt that CARS was wildly successful in its public debut, so much so that the $1 billion in federal rebate funds were projected to run out within the first 30 days of the program’s roll-out. Car dealerships and automakers were as ecstatic in their praise for the program as they were vociferous in their clamor to seek the additional $2 billion in Congressional funding. However, the pace at which the CARS rebates were utilized strongly suggests that the cash-for-clunkers program would have been equally successful even if Congress had stuck to the original premise of the program: To get car owners to trade in the worst mpg offenders for the exemplars of fuel efficiency. Instead, Congress and the Administration have botched the chance to make a real, lasting difference, while spending $3 billion in the process.

    So here are the “outcomes” of CARS thus far: According to cars.com, the top ten fuel-efficient cars sold in the U.S. range from the Honda Fit (32 combined mpg) to the Toyota Prius (46 combined mpg). However, based on statistics tracked by jalopnik.com, of the top ten new vehicles purchased using CARS rebates only two, the Toyota Prius (#1 in fuel efficiency and #4 in most-purchased) and the Honda Fit (#10 in fuel efficiency and #9 in most-purchased), are on both lists (see the table below). In fact the list of the most-purchased vehicles using CARS rebates appears to be comprised of more lower-priced cars (e.g. the Chevy Cobalt and Hyundai Elantra) and cars that were already very high-volume sellers before the economic downturn (e.g. Toyota Camry and Corolla).

    Ten Most-Purchased Vehicles Using CARS Rebate*

    Ten Most Fuel-Efficient Vehicles Sold in the U.S.**

    1

    Toyota Corolla

    1

    Toyota Prius 48/45/46 mpg

    2

    Ford Focus FWD

    2

    Honda Civic Hybrid 40/45/42 mpg

    3

    Honda Civic

    3

    Smart Fortwo 33/42/36 mpg

    4

    Toyota Prius

    4

    Nissan Altima Hybrid 35/33/34 mpg

    5

    Toyota Camry

    5

    Toyota Camry Hybrid 33/34/34 mpg

    6

    Hyundai Elantra

    6

    Volkswagen Jetta TDI 30/41/34 mpg

    7

    Ford Escape FWD

    7

    Ford Escape Hybrid*** 34/31/32 mpg         

    8

    Dodge Caliber

    8

    Toyota Yaris 29/36/32 mpg

    9

    Honda Fit

    9

    MINI Cooper/Clubman 28/37/32 mpg

    10

    Chevrolet Cobalt

    10

    Honda Fit 28/35/31 mpg

    *as posted on jalopnik.com Aug. 7th

    **as posted on cars.com Aug. 7th, city/hwy/combined mpg                             

    *** also includes Mercury Mariner/Mazda Tribute Hybrid

    Inasmuch as Congress has already approved the additional $2 billion for the CARS program – without improving the fuel efficiency goals the program incentivizes – then why don’t we at least be honest about it and just add the $3 billion CARS price tag to the federal auto industry bailout. Sadly, as it stacks up now, claiming that this program is all about fuel efficiency or domestic energy policy is a sham.

    Peter Smirniotopoulos, Vice President – Development of UniDev, LLC, is based in the company’s headquarters in Bethesda, Maryland, and works throughout the U.S. He is on the faculty of the Masters in Science in Real Estate program at Johns Hopkins University. The views expressed herein are solely his own.

  • Reducing Vehicle Miles Traveled Produces Meager Greenhouse Gas Emission Reduction Returns

    Senators Jay Rockefeller (D-West Virginia) and Frank Lautenberg (D-New Jersey) have introduced legislation that would require annual per capita reductions in driving each year. Another bill, the National Transportation Objectives Act, introduced by Representative Rush Holt (D-Indiana), Representative Russ Carnahan (D-Missouri) and Representative Jay Inslee (D-Washington.) would require a 16 percent reduction in driving in 20 years.

    Last week, a highly publicized report by the Urban Land Institute (Moving Cooler) also called for policies that would reduce the vehicle miles traveled (VMT) by people in their cars. This report was analyzed here by Alan Pisarski). The reductions in driving would be achieved by highly intrusive land use policies that would make it impossible for most Americans to live where they want, allow for only minor expansion of roadway capacity and force almost all new development to be within existing urban footprints. It would employ such radical strategies as forcing people to pay $400 per year to park their cars in front of their own homes.

    The assumption behind these initiatives is that reducing driving will produce substantial reductions in greenhouse gas emissions. It sounds like a simple enough proposition, since cars emit greenhouse gases in direct proportion to the gasoline they consume. It would seem logical that reducing their use would lower their emissions by a similar percentage. Moving Cooler assumes that for every 10 percent reduction in driving miles, there will be a 9 percent reduction in greenhouse gas emissions.

    Meager GHG Emission Reductions from Reducing Driving: But things are not nearly so simple. It appears that reducing vehicle miles would not produce a similar reduction in greenhouse gases from cars.

    It is well known that at the slower speeds of vehicle operation in cities, fuel economy tends to decline with speed. Further, as congestion increases, so does fuel consumption, due to longer idling periods (such as at signals or in stopped traffic), more acceleration and more deceleration. Thus, not only does fuel economy drop when average speeds drop, but it drops even further when traffic congestion intensifies. The extent to which any reduction in urban driving would reduce greenhouse gas emissions is not at all well known, simply because there has been insufficient research on the subject.

    Perhaps the best indication is a comparison of Environmental Protection Agency (EPA) “driving cycles,” which are tests used to estimate some emissions (although not greenhouse gases) and fuel economy. There is considerable data for the normal urban cycle, which replicates driving conditions in most of the nation’s urban areas. There is much less information available for the “New York City Cycle,” which replicates the congested traffic conditions in New York City, which is far more congested than any of the nation’s urban areas (Note).

    Under the New York City Cycle average speeds are two-thirds less than under the average urban cycle. This reduction in speed and increase in congestion results in a 50 percent loss in fuel economy, according to an Argonne National Laboratory Study. Thus, between New York City and the average urban area, fuel efficiency drops at a rate 80 percent of the lower driving rate in New York City.

    On average, vehicle travel in New York City is approximately 8 miles per capita daily. In the average large urban area outside New York City (such as the Phoenix urban area, or for that matter the suburbs of New York City), vehicle travel is approximately 24 miles per day per capita. Thus, per capita driving in New York City is 67 percent less than in Phoenix. However, because of the loss in fuel consumption, the greenhouse gas emissions from cars per capita is only 31 percent less (Figure 1). Thus, the limited data indicates that nearly one-half of the greenhouse gas emissions difference between New York City driving rates and Phoenix driving rates are cancelled out by the impacts of slower speeds and increased congestion.

    Shortcomings of Policies to Reduce Driving: UCLA’s Lewis Center for Regional Policy Studies Program on Local Government Climate Action Policies raised concerns about relying on VMT reduction policies in a submittal to the California Air Resources Board:

    Especially in congested areas of California, VMT is an inadequate proxy for vehicle greenhouse gas emissions.

    Yet it is precisely more intense traffic congestion that we can expect if federal laws and policies should force most development into present urban footprints. Between 2010 and 2030, nearly 70,000,000 residents will be added to US urban areas, an increase of more than 25 percent. This increase would mean that the legislation introduced by Congressmen Hold, Carnahan and Inslee would require a one-third reduction in per capita driving to achieve its overall 16 percent reduction. Per capita driving declines such as those envisioned by the Congressmen or Moving Cooler have never occurred before in any American (or international) urban area. By comparison, charging people $400 to park their cars in front of their houses seems utterly reasonable.

    Further, higher population densities are associated with more intense traffic, both at the national and international level. Policies such as recommended by Moving Cooler would produce little additional highway capacity to handle the far higher levels of driving produced by a larger population. We could expect traffic congestion to increase markedly. It would take longer to get to work and local air pollution would be more intense (a health impact largely ignored by proponents of higher densities).

    The Economic Cost: A serious economic toll would be produced by more grid-locked urban areas, because of the positive relationship between personal mobility and economic performance. Remy Prud’homme and Chang-Woon Lee of the University of Paris have shown that greater economic mobility is associated with greater economic growth. Greater personal mobility also alleviates poverty, according to a Progressive Policy Institute study):

    In most cases, the shortest distance between a poor person and a job is along a line driven in a car. Prosperity in America has always been strongly related to mobility and poor people work hard for access to opportunities. For both the rural and inner-city poor, access means being able to reach the prosperous suburbs of our booming metropolitan economies, and mobility means having the private automobile necessary for the trip. The most important response to the policy challenge of job access for those leaving welfare is the continued and expanded use of cars by low-income workers.

    The UCLA submission further notes that policies aimed at reducing driving could damage the economy:

    … policies which seek to reduce VMT may hinder economic growth without reducing emissions.

    The relationship between greater mobility and economic prosperity is also demonstrated at the national level. This is vividly illustrated in the chart from the United States Department of Energy (Figure 2).

    The significant improvements in fuel economy from higher mileage cars and less carbon intensive fuels will do far more to reduce greenhouse gas emissions from cars than the meager results that can be achieved by heavy handed policies to “coerce” people out of their cars (as Secretary of Transportation Ray LaHood put it). And, critically, it would do so with far less impact on both economic and physical mobility.

    Both the Economy and Greenhouse Gas Emissions at Stake: With the economic challenges facing the nation, policy makers need to steer clear of strategies that hobble the economy, like forcing people to drive less (or pay $400 to park in front of their houses) and make only minor improvements in reducing emissions. Indeed, a society with less money will have less to spend on reducing emissions through the adoption of new technologies that offer greater hope for creating a more prosperous as well as more environmentally sustainable society.


    Note: The New York City refers to the City of New York, not the metropolitan area or the urban area.


    Wendell Cox is a Visiting Professor, Conservatoire National des Arts et Metiers, Paris. He was born in Los Angeles and was appointed to three terms on the Los Angeles County Transportation Commission by Mayor Tom Bradley. He is the author of “War on the Dream: How Anti-Sprawl Policy Threatens the Quality of Life.

  • People, Planet, Prefurbia

    The term “sustainable” relates to a concept called the “Triple Bottom Line” (TBL): People, Planet, and Profit (the three P’s), endorsed by the United Nations in 2007 for urban and community accounting.

    American suburban land planning is about the SBL (Single Bottom Line): Profit. In city after city, mindless cookie cutter subdivisions, with characterless architecture, serve cars more than people. This dysfunction is caused by the boiler-plate regulations; engineers adhere to the minimum dimensions mandated by city ordinances to gain density, which maximizes developer’s profits. City council and planning commission members are appalled by the monotonous plans developers submit. Subdivisions that meet the minimums must be eventually approved. Developers are judged as evil, but they rely on the engineer who simply follows the city rules. Everyone mistakenly trusts that the consultant whose business card says “Land Planner” is the expert who will lay out the best development. However, “Land Planning” is not a regulated profession.

    What? Astonishingly there are no regulatory requirements to prevent anyone from representing him or herself as a land planner… you too can become one by simply printing the title on your business card, and everyone will assume that you, too are an expert. The suburbs have been ripe for a preferable system, one that we call ‘Prefurbia’. The concept was recently featured in Environmental Protection because of its potential for urban renewal. In terms of what it can do for suburbs, compare Conventional development to Prefurbia in terms of the three P’s of sustainability:

    People: Conventional Subdivision

    The land planner subdivides lots into ordinance minimums. If the city requires that a percentage of the site be set aside for open space, the area likely to be chosen is one that would not be fit for construction, rather than the best open space location for residents. Streets are designed first, then lots. No attention is given to the home or townhome unit other than a “pad” size to fit the structure. The main design focus is always the street layout (also true in Smart Growth plans). If there are any walkways, they parallel the street edge. The typical suburban maze-like street pattern is often difficult to drive through, and even more difficult for pedestrians, which further encourages a drive over a stroll. Suburban Land Use Transitions (zoning) place the lowest income (highest densities) in the most undesirable places. Positioning a high concentration of families overlooking loading docks along the rear of strip retail centers is not just acceptable, it’s encouraged.

    People: Prefurbia

    In Prefurbia, the Neighborhood Planner designs the pedestrian system first. Destinations for the walks are targeted as a basis for the open space “system,” assuring convenient pedestrian connectivity through the developers land. This is called a Pedestrian Oriented Design (POD). In Prefurbia, the suburban desire for space reigns supreme. Each home, attached or detached, is designed to assure that living areas are placed along the best views, giving the illusion of low density. The consultants who design the Prefurbia neighborhood (architects, planners and engineers) must do something that is foreign to them: they need to actually talk to each other! The architectural floor layouts, interior walls and window locations are an integrated component of the overall neighborhood, a first for land planning. Housing is situated so that each home sculpts a unique streetscape, eliminating monotony while embracing individualism (even if the architecture is somewhat repetitive).

    Prefurbia land use places higher density along the most desired site amenities without regard to residents income. In the design process, all income levels are treated as upper class. This new land use theory is called Connective Neighborhood Design (CND).

    Retail in Prefurbia is called the Neighborhood Marketplace. Neighborhood congregation areas such as patios, boardwalks, decks, ponds, etc., are placed along the rear of retail centers, which are also main pedestrian destinations. Since the Prefurbia pedestrian systems are separate from streets, there are few conflict points with vehicles. When walks are situated along streets they meander gracefully as far from the street edge as possible.

    Planet: Conventional

    Subdivision planning sets homes parallel to the edge of the street at the exact minimum distance allowed by regulations. The land planner must stretch the street as much as possible through the site to gain density (also true with Smart Growth design). The developer is burdened with constructing enormous street and utility main lengths to achieve the greatest density. Traffic flow is an afterthought.

    Planet: Prefurbia

    The Prefurbia Neighborhood Planner designs something very unnatural… a plan with dimensions greater than the minimums. Using entirely new geometric theory made practical by new technologies, the Neighborhood Planner separates the street pattern from the positioning of the homes, which results in lesser street length, but maintains density. This creates more organic (non-paved) space – lots of it! It’s more art than science to create independent, meandering shapes that open up the streetscape. In this scenario, it’s possible to maintain density by reducing the length of street by (typically) 25% compared to conventional planning and up to 50% compared to Smart Growth principals.

    The extra landscaped area allows the Prefurbia Neighborhood Engineer to design with much lower environmental impact, and to reduce development costs. The flowing vehicular pattern reduces both time and energy when driving through the neighborhood. All of this together means that in Prefurbia, Green is affordable. Imagine the implications worldwide.

    Profit: Conventional

    A cookie-cutter subdivision developer relies on a price point to generate a profit. The local Land Planner is likely to design the same style for all clients with the thought that the minimum dimensions allowed by ordinance are in fact the absolute dimensions. Because of this, most, if not all, of the developments within the town will look and feel alike. Because competing developments look the same they must compete mainly on price. Selling cheaper to make a profit makes little sense. This is made worse when the Conventional (and Smart Growth) design requires the longest possible street lengths (and, therefore, costs) to achieve density. With the reduced lot values today, building excessive infrastructure from Conventional and Smart growth design can make many developments unprofitable.

    Financial Sustainability: Prefurbia

    Profit is not the correct word to describe the financial advantages of Prefurbia. A home is not something that is disposable after the initial sale. Subdividing land sets a pattern that continues to exist for many centuries. An average home sells once every six years. If the number of residents for each home represents just three people, a 100 unit layout will affect the lives and finances of 10,000 people over two centuries. The financial advantage of Prefurbia is based on a significant reduction of infrastructure that’s needed for development, which allows more funds to be spent on curb appeal. The ability to pay more attention to character building (architectural and landscaping elements) without increasing the initial home price provides a tremendous market advantage.

    Will the home buyer or renter prefer the claustrophobic garage grove subdivision over the beautiful, functional, open Prefurbia neighborhood? The advantages will continue to provide financial sustainability every time a resident resells the property.

    And with a significant reduction of public infrastructure, the municipality is the big winner. A 25% reduction in streets translates into 25% less cost to maintain, yet the tax base stays the same. With the increase in open space, Prefurbia neighborhoods can justify an increase in density that reduces the effects of sprawl.

    Perhaps the best news is that Prefurbia can be ideal not just to develop new suburbs and exurbs, but to redevelop urban areas… and maybe to rewrite the triple bottom line to People, Planet, Prefurbia.

    Rick Harrison is President of Rick Harrison Site Design Studio and author of Prefurbia: Reinventing The Suburbs From Disdainable To Sustainable. You can view a portfolio of pictures and videos of prefurbia at his website, rhsdplanning and at prefurbia.

  • Green Jobs Can’t Save The Economy

    Nothing is perhaps more pathetic than the exertions of economic developers and politicians grasping at straws, particularly during hard times. Over the past decade, we have turned from one panacea to another, from the onset of the information age to the creative class to the boom in biotech, nanotech and now the “green economy.”

    This latest economic fad is supported by an enormous industry comprising nonprofits, investment banks, venture capitalists and their cheerleaders in the media. Their song: that “green” jobs will rescue our still weak economy while saving the planet. Ironically, what they all fail to recognize is that the thing that would spur green jobs most is economic growth.

    All told, green jobs constitute barely 700,000 positions across the country – less than 0.5% of total employment. That’s about how many jobs the economy lost in January this year. Indeed a recent study by Sam Sherraden at the center-left New America Foundation finds that, for the most part, green jobs constitute a negligible factor in employment – and will continue to do so for the foreseeable future. Policymakers, he warns, should avoid “overpromising about the jobs and investment we can expect from government spending to support the green economy.”

    This is true even in California, where green-job hype has become something of a fetish among self-styled “progressives.” One recent study found that the state was creating some 10,000 green jobs annually before recession. To put this into context, the total state economy has lost over 700,000 jobs over the past year (more than 200,000 in Los Angeles County alone). Any net growth in green jobs has barely made a dent in any economic category; only education and health services have shown job gains over this period.

    More worrisome, in terms of national competitiveness, the green sector seems to be going in the wrong direction. The U.S.’s overall “green” trade balance has moved from a $14.4 billion surplus in 1997 to a nearly $9 billion deficit last year. As the country has pushed green energy, ostensibly to free itself from foreign energy, it has become ever more dependent on countries such as China, Japan and Germany for critical technology. Some of this is directly attributable to the often massive subsidies these countries offer to green-tech companies. But as New America’s Sherraden puts it, this “does not augur well for the future of the green trade balance.”

    Nor are we making it any easier for American workers to gain from green-related manufacturing. Some of America’s “greenest” regions are inhospitable for placing environmentally oriented manufacturing facilities. For example, high taxes and regulatory climate have succeeded in intimidating solar cell makers from coming to green-friendly California; a manufacturer from China told the Milken Institute’s Ross DeVol that the state’s “green” laws precluded making green products there.

    Attempts to put windmills in Nantucket, Mass., the Catskills and Jones Beach in New York and other scenic areas have also been blocked by environmentalist groups. Transmission lines, necessary to take “renewable” energy from distant locales to energy-hungry cities, often face similar hurdles. Solar farms in the Mojave desert might help meet renewable energy quotas but, as wildlife groups have noted, may not be so good for local fauna.

    And then there is the impact of green policies on the overall economy. Green power is expensive and depends on massive subsidization, with government support levels at roughly 20 times or more per megawatt hour than relatively clean and abundant natural gas. Lavishing breaks for Wall Street investors and favored green companies also may be harmful to the rest of the economy. A recent study on renewable energy subsidies on the Spanish economy found that for every “green” job created more than two were lost in the non-subsidized economy.

    So how do we build a green economy that is sustainable without massive subsidies? First, governments need to learn how to say no to some environmentalists. Green jobs and renewable energy can not be fully developed without affecting somebody’s backyard. Windmills will have to be built in some scenic places; transmission lines may mar somebody’s “view-shed.”

    Arguably, the thing that would spur green jobs and domestic industries most would be economic growth. Environmentalists long have been cool to growth, since they link it to carbon production and other noxious human infestations. As an official at the Natural Resources Defense Council put it, the recession has “a moment of breathing room.” Disaster may be still looming, but bad times add a few more moments to our carbon clock.

    Long term, though, I would argue hard times may prove harmful for the environmental cause. Even with subsidies, many renewable energy projects are now on hold or being canceled across the country. Slackening energy demand, brought on by a weak economy, has undermined the case for new sources of energy generation; what looked attractive with oil prices at $140 a barrel and headed higher looks at $70 less so.

    Similarly, hard-pressed homeowners and businesses don’t constitute the best market for new, often expensive “green” products. A growing economy, which would drive up energy prices, could spur a more sustainable interest in alternative energy from firms that now only do so for public relations concerns. At the same time, cash-rich consumers could more afford to install energy-saving home insulation or rooftop solar panels. A strong economy would also spur sales of new energy-efficient appliances and cars.

    This process would go more quickly if government relied less on mandates, which tend to scare serious investors, and turned toward incentives. With the right tax advantages, energy efficiency could become a positive imperative for companies.

    There’s also an unappreciated political calculus at work. A persistently weak economy undermines support for the green agenda. For the first time in 25 years, according to a Gallup poll, more people place higher priority on economic growth than on the environment.

    Furthermore, more people now feel claims about global warming are “exaggerated.” Early this year, Pew reported that global warming ranked last among the top 20 priorities of Americans.

    Ultimately, environmentalists need to realize that the road to a green economy does not lie in promoting hysteria, guilt and self-abnegation while ignoring prohibitive costs and grim economic realities. Green enthusiasts should focus on promoting a growing economy capable of generating both the demand and the ability to pay for more planet-friendly products. After all, the economy needs green jobs less than green jobs need a thriving economy.

    This article originally appeared at Forbes.

    Joel Kotkin is executive editor of NewGeography.com and is a presidential fellow in urban futures at Chapman University. He is author of The City: A Global History. His next book, The Next Hundred Million: America in 2050, will be published by Penguin early next year.