Tag: Environment

  • Obama Fuel Economy Rules Trump Smart Growth

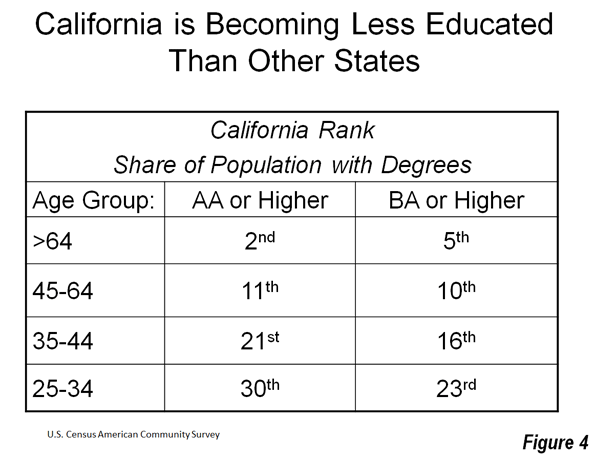
    The Environmental Protection Agency (EPA) has just finalized its regulation requiring that new cars and light trucks (light vehicles) achieve average fuel efficiency of 54.5 miles per gallon (MPG) by 2025 (4.3 liters per 100 kilometers). This increase in the "CAFE" standard (Corporate Average Fuel Efficiency) is the second major step in the Obama Administration’s program to improve light vehicle fuel efficiency. In 2010, EPA adopted regulations requiring 35.5 MPG average by 2016 (6.6 liters per 100 kilometers).

    The EPA standard is based upon carbon dioxide (CO2) grams emitted per mile of light vehicle travel, with an average of 163 grams per mile (101 per kilometer) to be achieved in 2025. This is slightly above the 2020 European Union standard of 152 grams per mile (95 grams per kilometer). Of course, the regulations have both supporters and detractors, with the automobile manufacturers being among the supporters.  

    Assuming the objectives are met, the reductions in CO2 emissions will dwarf the modest gains forecast from anti-suburban smart growth policies. For decades, this powerful movement has sought to limit or prohibit suburban expansion and even outlaw the detached housing that most people prefer. This includes railing against automobile use and seeking to coerce people out of their cars (as expressed by Secretary of Transportation Ray LaHood).

    The anti-suburban movement has many labels in addition to "smart growth," such as “densification policy," "compact cities," "growth management," "urban consolidation," etc. The origins can be traced back to just after World War II, with the enactment of the British Town and Country Planning Act. The policy origins of smart growth in the United States date from the 1960s (the state of Hawaii) and 1970s (the state of Oregon and California local jurisdictions).

    Forecast CO2 Emission Reductions from Smart Growth

    With concerns about greenhouse gas (GHG) emissions (principally carbon dioxide, or CO2), proponents saw the opportunity to force people back into the cities (from which most did not come) and turn smart growth into an imperative for "saving the planet." This is no exaggeration. As late as last month, this was claimed by fellow panelists at a Maryland Association of Counties conference. As is indicated below, the data shows no such association.

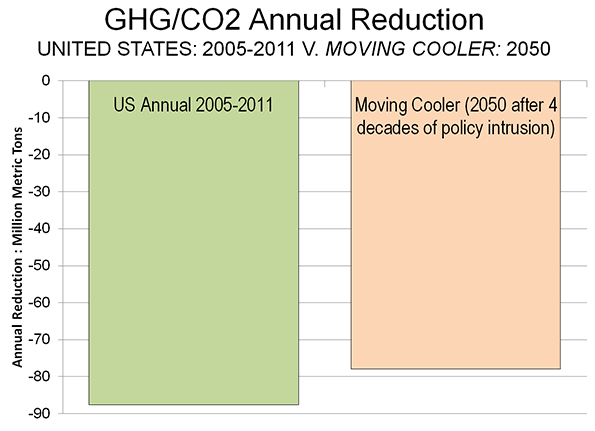
    Even forecasts by proponents fall short of demonstrating an apocalyptic necessity for smart growth. The Cambridge Systematics and Urban Land Institute Moving Cooler report attributed only modest reductions in CO2 emissions to smart growth’s land use and mass transit policies (Moving Cooler was criticized on this site by Alan Pisarski. See ULI Moving Cooler Report: Greenhouse Gases, Exaggerations and Misdirections). The data in Moving Cooler suggests an approximately 50 million ton reduction in CO2 emissions from these smart growth strategies by 2035 (interpolating between 2030 and 2050 figures).

    The more balanced Transportation Research Board Driving and the Built Environment: The Effects of Compact Development on Motorized Travel, Energy Use, and CO2 Emissions  produced similar figures, however it indicated skepticism about whether their higher range projections were "plausible."

    Comparing Smart Growth to the Previous Fuel Economy Standard

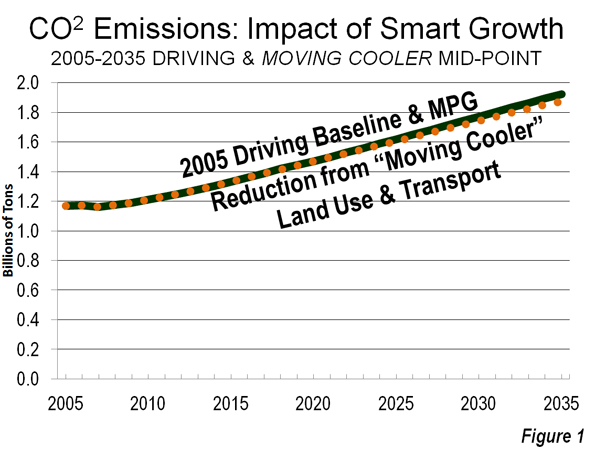
    At the 2005 fuel economy rate and the projected driving increase rate in the US Department of Energy Annual Energy Outlook:2008 (AEO), CO2 emissions from light vehicles would have increased 64 percent from 2005 to 2035 (Note 1). This could be called the "baseline" case or the "business as usual" case. This would have resulted in a CO2 emissions increase from light vehicles of approximately 0.75 billion tons.

    Using the more aggressive Moving Cooler forecast, the smart growth transport and land use strategies would only minimally reduce CO2 emissions from the baseline case (64 percent above 2005 levels) to 60 percent. This is "chicken feed" (Figure 1).

    Forecast CO2 Emission Reductions from the 54.5 MPG Standard

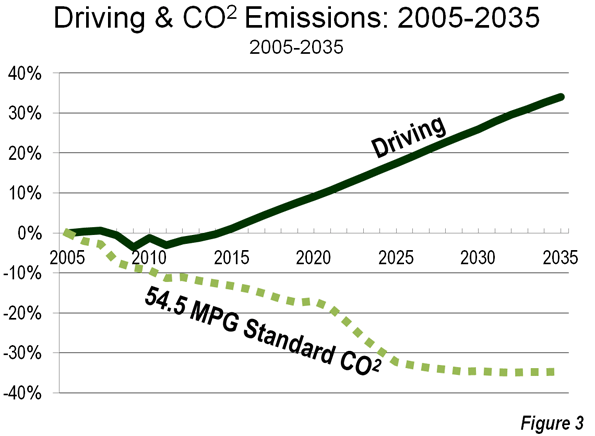
    Under the previous 35.5 MPG standard, AEO:2008 and AEO:2012,  a 19 percent reduction in CO2 emissions from cars and light trucks would occur from 2005 to 2035. We modeled the new regulations based upon AEO:2012 forecasts for the earlier regulation. This yielded a 2035 CO2 emission reduction of 35 percent from 2005 (Figure 2), despite a healthy one-third increase in driving volumes over the period. The calculation also includes an upward adjustment for the rebound effect, as lower costs of driving encourage people to drive more, which EPA estimates at 10 percent ("induced traffic"), which is indicated in Figure 3.


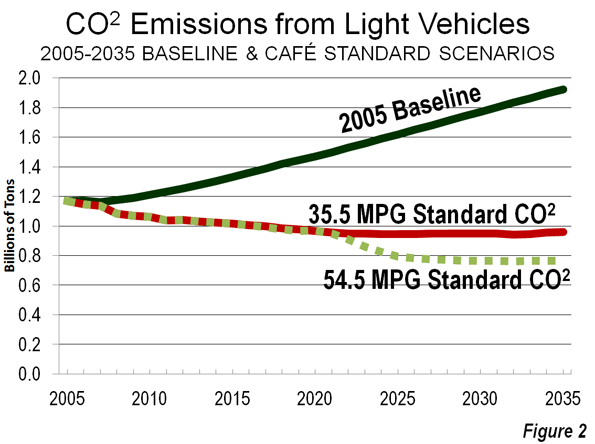
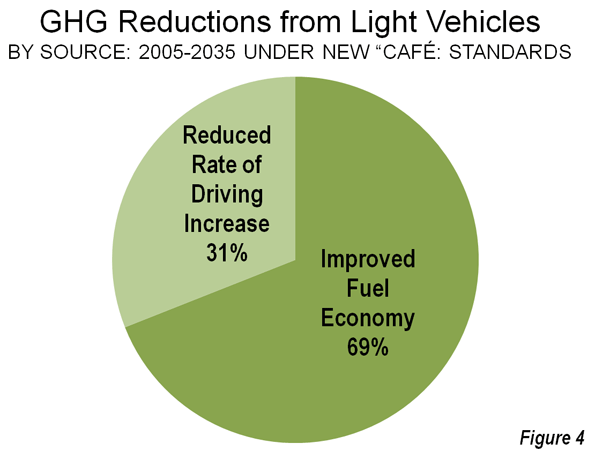
    Achievement of the 54.5 MPG standard would reduce CO2 emissions from light vehicles from 1.9 billion annual tons in 2035 under the 2005 baseline to approximately 0.750 billion metric tons in 2035. Approximately 70 percent of the decline in CO2 emissions would be from improved fuel economy, while 30 percent would be from slower annual increase in vehicle travel that has been adopted in AEO:2012 (Figure 4). The increase in driving is now forecast at 33 percent from 2005.

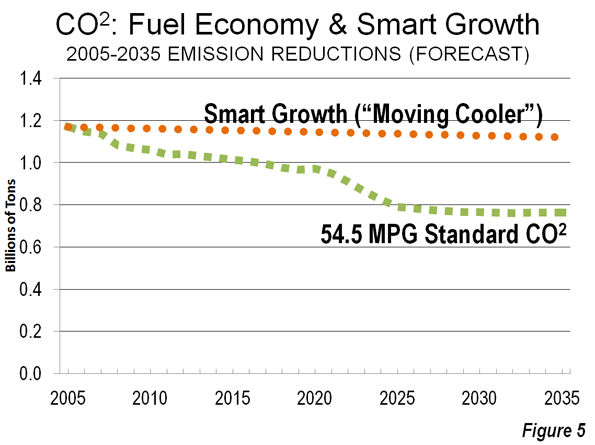
    The contrast between the potential CO2 emissions from smart growth and fuel economy is stark. By comparison, the annual overall reduction in CO2 emissions (from the 2005 baseline) would be virtually equal to the 30 year impact of smart growth (Figure 5).

    Comparison with Transit

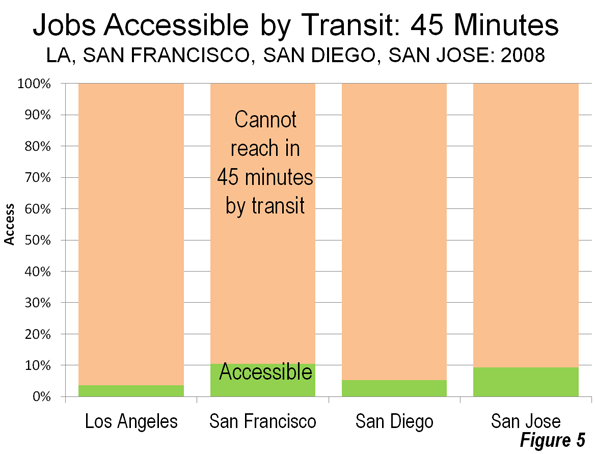
    The 35.5 MPG standard would make cars and light trucks less CO2 intensive than transit. At work trip vehicle occupancy rates, the average new light vehicle would emit less in CO2 per passenger mile in 2016 than transit in all but eight of the nation’s 51 metropolitan areas over 1,000,000 population. The 2025 54.5 MPG standard would drop that number to two (Note 2). Even before these developments, there was only scant potential for replacing automobile use with transit (much less walking or cycling) because of its long travel times. According to data in a Brookings Institution report, less than 10 percent of jobs in the largest metropolitan areas can be reached by the average resident in 45 minutes on transit (Note 3).

    Smart Growth: Not Needed to "Save the Planet"

    Smart growth is an exceedingly intrusive policy that would attempt to enforce personal behaviors,    counter to people’s preferences, by attempting to dictate where people live and how they travel. This is expensive as well as intrusive. It is also detrimental to the economy, which is already taking a toll in lower household discretionary income (especially from higher house prices) and stunted economic growth.

    A report by The McKinsey Corporation and The Conference Board  indicated that sufficient CO2 emissions could be achieved with "…no downsizing of vehicles, home or commercial space and traveling the same mileage" and "…no shift to denser housing." Or, more directly, smart growth is unnecessary, in addition to producing little "gain" for the "pain."

    Wendell Cox is a Visiting Professor, Conservatoire National des Arts et Metiers, Paris and the author of “War on the Dream: How Anti-Sprawl Policy Threatens the Quality of Life.”

    —-

    Note 1: The 2030 to 2035 driving volume is estimated using the annual percentage increase from 2025 to 2030 in AEO: 2008, which has data through 2030.

    Note 2: Calculated from 2010 National Transit Database summary by Randal O’Toole of the Cato Institute. These calculations assume the 250 gram per mile standard for new light vehicles in 2016 and the vehicle occupancy ratio of 1.13 for work trips from the 2009 National Household Travel Survey.

    Note 3: Limited transit access is not just an American problem. In Paris, with arguably the best transit system in the western world, the average resident of a suburban new town on the regional metro (RER) can reach twice as many jobs by car as by transit in an hour, according to Fouchier and Michelon.

    Prius photo by Bigstock.

  • The Unseen Class War That Could Decide The Presidential Election

    Much is said about class warfare in contemporary America, and there’s justifiable anger at the impoverishment of much of the middle and working classes. The Pew Research Center recently dubbed the 2000s a “lost decade” for middle-income earners — some 85% of Americans in that category feel it’s now more difficult to maintain their standard of living than at the beginning of the millennium, according to a Pew survey.

    Blaming a disliked minority — rich business folks — has morphed into a predictable strategy for President Obama’s Democrats, stripped of incumbent success. But all the talk of “one percent” versus “the ninety nine percent” misses new splits developing within both the upper and middle classes.

    There is no true solidarity among the rich since no one is yet threatening their status. The “one percent” are splitting their bets. In 2008 President Obama received more Wall Street money than any candidate in history, and he still relies on Wall Street bundlers for his sustenance. For all his class rhetoric, miscreant Wall Streeters, particularly big ones, have evaded big sanctions and the ignominy of jail time.

    Obama enjoys great support from the financial interests that benefit from government debt and expansive public largesse. Well-connected people like Obama’s financial tsar on the GM bailout, Steven Rattner, who is also known as a vigorous defender of “too big to fail.”

    The “patrician left” — a term that might have amused Marx — extends as well to Silicon Valley, where venture capitalists and techies have opened their wallets wider than ever before for the president. Microsoft and Google are two of Obama’s top three organizational sources of campaign contributions. Valley financiers are not always as selfless as they or their admirers imagine: Many have sought to feed at the Energy Department’s bounteous “green” energy trough and all face regulatory reviews by federal agencies.

    The Republicans have turned increasingly to those patricians who depend on the more tangible economy. If you make your living from digging coal or exploring for oil wells, even if you don’t like him, Romney is you man. This saddles the GOP with the burden of being linked to one of America’s most hated interests: oil and gas companies. Almost as detested is the biggest source of Romney cash, large Wall Street banks. (In contrast, Democratic-leaning industries, such as Internet-related companies, enjoy relatively high public support.)

    With the patriarchate divided, the real action in the emerging class war is taking place further down the economic food chain. This inconvenient reality is largely ignored by the left, which finds the idea of anyone this side of Bain Capital supporting Romney as little more than “false consciousness.”

    Obama’s core middle-class support, and that of his party, comes from what might be best described as “the clerisy,” a 21st century version of France’s pre-revolution First Estate. This includes an ever-expanding class of minders — lawyers, teachers, university professors, the media and, most particularly, the relatively well paid legions of public sector workers — who inhabit Washington, academia, large non-profits and government centers across the country.

    This largely well-heeled “middle class” still adores the president, and party theoreticians see it as the Democratic Party’s new base. Gallup surveys reveal Obama does best among “professionals” such as teachers, lawyers and educators. After retirees, educators and lawyers are the two biggest sources of campaign contributions for Obama by occupation. Obama’s largest source of funds among individual organizations is the University of California, Harvard is fifth and its wannabe cousin Stanford ranks ninth.

    Like teachers, much of academia and the legal bar like expanding government since the tax spigot flows in the right direction: that is, into their mouths. Like the old clerical classes, who relied on tithes and the collection bowl, many in today’s clerisy lives somewhat high on the hog; nearly one in five federal workers earn over $100,000.

    Essentially, the clerisy has become a new, mass privileged class who live a safer, more secure life compared to those trapped in the harsher, less cosseted private economy. As California Polytechnic economist Michael Marlow points out, public sector workers enjoy greater job stability, and salary and benefits as much as 21% higher than of private sector employees doing similar work.

    On this year’s Labor Day, this is the new face of unionism. The percentage of private-sector workers in unions has dropped from 24% in 1973 to barely 7% today and in 2010, for the first time, the public sector accounted for an absolute majority of union members. “Labor” increasingly means not guys with overalls and lunch pails, but people whose paychecks are signed by taxpayers.

    The GOP, for its part, now relies on another part of the middle class, what I would call the yeomanry. In many ways they represent the contemporary version of Jeffersonian farmers or the beneficiaries of President Lincoln’s Homestead Act. They are primarily small property owners who lack the girth and connections of the clerisy but resist joining the government-dependent poor. Particularly critical are small business owners, who Gallup identifies as “the least approving” of Obama among all the major occupation groups. Barely one in three likes the present administration.

    The yeomanry diverge from the clerisy in other ways. They tend to live in the suburbs, a geography much detested by many leaders of the clerisy and, likely, the president himself. Yeomen families tend to be concentrated in those parts of the country that have more children and are more apt to seek solutions to social problems through private efforts. Philanthropy, church work and voluntarism — what you might call, appropriately enough, the Utah approach, after the state that leads in philanthropy.

    The nature of their work also differentiates the clerisy from the yeomanry. The clerisy labors largely in offices and has no contact with actual production. Many yeomen, particularly in business services, depend on industry for their livelihoods either directly or indirectly. The clerisy’s stultifying, and often job-toxic regulations and “green” agenda may be one reason why people engaged in farming, fishing, forestry, transportation, manufacturing and construction overwhelmingly disapprove of the president’s policies, according to Gallup.

    Obama supporters sometimes trace the loss of largely white working-class support — even to the somewhat less than simpatico patrician Romney — to “false consciousness.”  A recent Daily Kos article, charmingly entitled “The Masses are Asses,” chose to wave the old bloody shirt of racism, arguing that whites “are the single largest, and most protected racial group in this country’s history.”

    Ultimately this division — clerisy and their clients versus yeomanry — will decide the election. The patricians and the unions will finance this battle on both sides, spreading a predictable thread of half-truths and outright lies. The Democrats enjoy a tactical advantage. All President Obama needs is to gain a rough split among the vast group making around or above the national median income. He can count on overwhelming backing by the largely government dependent poor as well as most ethnic minorities, even the most entrepreneurial and successful.

    Romney’s imperative will be to rouse the yeomanry by suggesting the clerisy, both by their sheer costliness and increasingly intrusive agenda, are crippling their family’s prospects for a better life. In these times of weak economic growth and growing income disparity, the Republicans delude themselves by claiming to ignore class warfare. They need to learn how instead to make it politically profitable for themselves.

    Joel Kotkin is executive editor of NewGeography.com and is a distinguished presidential fellow in urban futures at Chapman University, and contributing editor to the City Journal in New York. He is author of The City: A Global History. His newest book is The Next Hundred Million: America in 2050, released in February, 2010.

    This piece originally appeared in Forbes.

    Mitt Romney image from Bigstock.

  • Need Your Water Treated? In the Philippines, Call a Mom & Pop Shop

    “The history of cities can be described as the history of water.” — UK Urbanist Matthew Gandy, 2003

    In Cebu City, the second largest city in the Philippines, that particular history is being rewritten in a way never seen anywhere before. Contrary to the well-known major municipal water privatizations of the last two decades (including that of Manila), the existing utility in Cebu City is not functionally obsolete, nor has it been systematically de-funded in order to justify a contract with a private vendor. Here, the city’s individual entrepreneurs have bypassed the municipal provider on their own.

    Personal interviews with officials from the Philippine Department of Environmental Resources, the University of San Carlos Water Resources Department, the Metropolitan Cebu Water Department, residents, business owners, and other civic leaders reveal much about the water politics in this physically small but densely packed city of over two million people. In 2010, tests of well and municipal water showed both the saline intrusion and bacteriological contamination that have led to the private revolution.

    While water supply is certainly part of political discourse, the politics of water are rarely transparent. The public is seldom aware of the tradeoffs that are made. Governments are not about to implicitly offer a menu of choices when doing so might undermine a choice that has already been made. In the case of large scale water privatization, the money and complexity are such that contracts cannot be easily be broken without heavy losses and penalties. In 2002, the U.N. decreed that humans have a right to safe, sufficient and affordable water for personal domestic use. But this did not imply that it must be provided by the public sector. In fact, reaching international safe water goals is often the rationale used by international aid agencies to justify privatization.

    Private water systems were not uncommon historically, but a shift to public control took place in the United Kingdom and elsewhere beginning in the late 19th century, when private control did not result in safe water. During the 1990s, new privatization efforts were made. State failure replaced market failure as a conceptual framework on which this could be built. Under this rubric water is a private, tradable good, and scarcity is the result of mismanagement by government entities.

    Major privatization deals were made in Latin America and in Asia. Their large cities with a burgeoning middle class, and — often — failing utilities seemed to offer the perfect void for large multinational firms such as Bechtel and Suez to fill with modern and efficient delivery systems. But despite the promises of privatization, the areas least served by public regimes tended to remain so under private controls. The shift from government–as- provider back to dependence on the private sector was based on the assumption that government wastes resources because it lacks competition.

    Arguments on the issue come up against the inherent difficulties in applying market value to government works. Water pricing rarely takes into account the public health benefits of safe water. And externalities like pollution and disease are impossible to price and easy to undervalue.

    Cebu is one of several Asian mid-sized cities where small, private water providers thrive. These providers — hundreds of them — have taken ‘small scale’ to a new level: they are literally mom and pop operations. Where suppliers in other mid-sized Asian cities are part of a small network, in Cebu none of the private operations has a network. They do not complete with the Municipal Cebu Water Department, or extend its network cooperatively. Instead, all are relying on existing groundwater supplies, whether from a private well or a municipal connection.

    Cebu’s water has become contaminated with a combination of saltwater intrusion and bacteriological agents. The saltwater is a result of the pumping of more water than is being recharged; the pathogens stem from the lack of a sewerage system. The private suppliers that began to appear in the middle of the last decade are actually water purifying operations. As Cebu’s water quality deteriorated precipitously and the municipal water department did not respond adequately, these suppliers appeared in every barangay. Chlorination is the sole municipal method of treatment, and while it kills most pathogens, it does nothing to reduce salinity. The private purification operations handle both problems with aplomb. The systems cost about $4,500, and in many cases were staked by remittances from relatives living abroad. They distribute purified water in containers that range in size from a single cup (or baggie) up to five gallons.

    The local Carcar aquifer was once a richly productive treasure that offered a bountiful yield to the city above it. But what began with saltwater intrusion around 30 years ago has metastasized into a menace that has overwhelmed the water district’s ability to respond. In its place, the private sector has moved in to meet the needs of most, but this informal hodgepodge of private businesses is not in a position to obtain the additional water supply that this rapidly growing city needs. Cebu is currently at maximum production from the Carcar aquifer. This is the reason water runs out every evening. The beach resorts on neighboring Mactan Island are already desalinating water to meet their needs.

    The 2020 projection is sobering; demand in Cebu is expected to exceed twice the aquifer’s estimated maximum output. What is left out of the projections is the possibility that production from the overstressed aquifer will simply collapse, due to over-pumping and contamination.

    Amazingly, the humid Cebu City appears headed for the same fate as coastal locales in the arid Middle East. Ideally, sound management strategy would prevail, but absent the ability to monitor private groundwater withdrawals, this is not possible. Industrial and commercial users are already treating their water, even if they have a municipal connection. One thing is certain: Cebu City’s water supply rests on a precipice.

    Does Cebu foreshadow a paradigm shift, or is it just a historical curiosity? Only the future will tell. But it is undeniable that, right now, it has the dubious distinction that, due to its inaction, it is facing a tragic fouling of its primary water resource.

    As Cebu’s water supply degraded, a bureaucratic stalemate between the water district and city officials precluded action. Proposed joint public-private ventures designed to augment the water supply were never approved. It is imperative now that an additional supply is sourced, or that a large scale reverse osmosis project is undertaken without delay.

    In 2005, the controversial Japanese author Masaru Emoto wrote,“Usually we drink water without paying much attention to it. We know that water is important to our life, but because of its familiarity very rarely do we consciously appreciate it.” The proud citizens of Cebu are among that very rare few who appreciate every drop they drink.

    Chuck McGlynn is an assistant professor at Rowan University in Glassboro, New Jersey, whose research interests include water resources, Asian studies and aviation. He spent 15 years in aviation management at two US majors, and has worked with the University of San Carlos Water Resources Department on water supply and quality issues in Cebu City, Philippines. He resides in South Jersey with his wife, Jenny, and their six children.

    Photo by the author

  • Congratulations to America: Huge Greenhouse Gas Emission Reduction

    Congratulations to America. According to the US Department of Energy, Energy Information Administration, carbon dioxide (CO2) emissions were reduced 526 million tons from 2005 to 2011. This is no small amount. It is about the same as all the CO2 emissions in either Canada or the United Kingdom. Only five other nations emit more than that.

    The bigger news is that this was accomplished without any of the intrusive behavioral modification proposed by planners, such as by California’s anti-detached housing restrictions, Plan Maryland, or the state of Washington’s mandatory driving reduction program.

    Of course, part of the national reduction was due to the economic difficulties since 2005. However, even with 1.8 percent gross domestic product growth in 2011, EIA shows that CO2 emissions fell 2.4 percent in 2011.

    The magnitude of the decline over six years is impressive. Actual GHG/CO2 emissions were reduced more annually between 2005 and 2011 than smart growth proponents claim for their strategies after 45 years of draconian policy intrusions.Modeled smart growth forecasts in Moving Cooler’s middle scenario (by Cambridge Systematics and the Urban Land Institute) show the annual GHG/CO2 emission reduction in 2050, calculated from 2005, to be less than the emissions reduction in the average year between 2005 and 2011.

    This is despite what would be four decades of trying to force people to live where they don’t want, in housing they don’t prefer, while trying to drive them out of the cars that required to sustain economic growth in modern metropolitan areas.

    Moving Cooler’s forced densification and anti-automobile strategies were so radical that the Transportation Research Board authors of Driving and the Built Environment, could not agree that a similar approach was feasible, because it would be prevented by public resistance to the personal and political intrusions (Note 1). They would also be hideously expensive, as the Moving Cooler authors ignored the much higher costs of housing associated with smart growth’s behavioral strategies.

    This comparison demonstrates the conclusion of a recent Cambridge University (United Kingdom) led study (see "Questioning the Messianic Conception of Smart Growth", which stated:

    In many cases, the potential socioeconomic consequences of less housing choice, crowding, and congestion may outweigh its very modest CO2 reduction benefits.

    Government policies have had little to do with the reductions, except to the extent that they precipitated the greatest economic downturn since the Great Depression (such as by encouraging loose lending standards and the smart growth housing policies that drove house prices up so much that the housing bust became inevitable).

    Market forces have made a substantial contribution to the reduction. There was a substantial shift to the use of natural gas from coal, a conversion that is really only starting. There was also a modest improvement in automobile fuel efficiency (though much more is to come).

    In 2007, the McKinsey Corporation and The Conference Board published a study (co-sponsored by the Environmental Defense and the Natural Resources Defense Council), which said that sufficient GHG emissions reductions (Note 2) could be achieved without driving less or living in more dense housing. Our more recent Reason Foundation report showed that the potential for GHG emission reduction from more fuel efficient cars and carbon neutral housing far outweighed any potential for reductions from smart growth’s behavior modification.

    ——

    Note 1: Transport consultant Alan E. Pisarski evaluated Moving Cooler in an article entitled ULI Moving Cooler Report: Greenhouse Gases, Exaggerations and Misdirections.

    Note 2: Most of GHG emissions are CO2.

  • German Renewable Power: Making Sustainability Unsustainable?

    Der Speigel reports that Germany’s rushed program to convert to renewable energy is already imposing an economic burden. Part of the problem is the inherent instability of power produced by renewable sources such as wind and solar:

    The problem is that wind and solar farms just don’t deliver the same amount of continuous electricity compared with nuclear and gas-fired power plants. To match traditional energy sources, grid operators must be able to exactly predict how strong the wind will blow or the sun will shine.

    A national energy expert said:

    "In the long run, if we can’t guarantee a stable grid, companies will leave (Germany). "As a center of industry, we can’t afford that."

    An important principle of the international impetus to reduce greenhouse gas emissions is that there be little or no economic loss. Certainly, an industrial powerhouse like Germany cannot subject itself to such risks.

    At the same time, other locations would be similarly threatened by implementation of renewable power mandates whose "time has not yet come." Not only is there the potential to inflict economic harm on industry (and consumers through higher prices), but higher electricity prices would reduce discretionary incomes and could lead to greater poverty rates. The eradication of poverty has recently been declared to be a virtual prerequisite to sustainability at the Rio conference.

    eradicating poverty should be given the highest priority, overriding all other concerns to achieve sustainable development.

    Environmental sustainability requires economic sustainability. A litany of failures could do serious damage to GHG emission reduction efforts.

  • Questioning the Messianic Conception of Smart Growth

    A new analysis from the United Kingdom concludes that smart growth (compact city) policies are not inherently preferable to other urban land use policy regimes, despite the claims of proponents."The current planning policy strategies for land use and transport have virtually no impact on the major long-term increases in resource and energy consumption. They generally tend to increase costs and reduce economic competitiveness." The article goes on: "Claims that compaction will make cities more sustainable have been debated for some time, but they lack conclusive supporting evidence as to the environmental and, particularly, economic and social effects."

    These would not be surprising findings to Newgeography.com readers, who are accustomed to similar analyses rooted in economic, demographic, and environmental data. However, this article appeared in the Spring 2012 issue of the Journal of the American Planning Association, under the title, "Growing Cities Sustainably: Does Urban Form Really Matter?"

    Moreover, the authors are urban planning insiders, including Marcial H. Echenique, a land use and transport professor at Cambridge University, Anthony J. Hargreaves from the Martin Centre for Architectural Studies at Cambridge, Gordon Mitchell from the Faculty of the Environment at the University of Leeds and Anil Namdea of the School of Engineering at the University of Newcastle.

    Smart Growth Criticisms

    Many of the British critiques parallel those made by critics of smart growth for years. They focus particularly on the concern that smart growth generally has neglected economic and social costs. For example, smart growth policies lead to higher house prices by rationing land (such as with urban growth boundaries). Higher house prices lead to less discretionary income for households, so that there is less money for other goods and services, lowering employment levels. The resulting densification leads to more intense traffic congestion, with resulting economic losses and more intense air pollution, which is less healthful.

    The Research

    The authors modeled land use and travel behavior in three areas of England, subjecting them to three land use alternatives: compact development (smart growth), planned development (which I would label "smart growth light") and dispersal, the generally liberal approach common in United States, Canada, Australia and New Zealand for decades after World War II (and still in many US and some Canadian markets).

    Echenique et al analyzed the London metropolitan region (Greater London Authority, Southeast England and East England), which has a population of 20 million and the Newcastle (Tyne and Wear) metropolitan region, which has a population of 1,000,000. They also analyzed a sub-region within London metropolitan region, Cambridge, with a population of 500,000.

    Their model projected little difference in outcomes between the three land use regulatory regimes to 2031. Predictably, land consumption was less under the compact development, but the variation in land consumed varied no more than plus or minus one percent from the trend (base case) in the London area, where only 11 percent of the land is in urban or transport use. Other factors, such as the change in transport energy use, greenhouse gas (GHG) emissions from transport and residences and air pollution varied little between the three regulatory regimes.

    Economic costs in 2031 were projected to be the lowest (best) for the dispersed option and the highest for the compact development option, both in the London and Newcastle metropolitan regions. Planned development ranked second.

    The compact development option scored best in the Cambridge sub-region, while the planned development option was the highest cost. The dispersed option ranked second. The researchers attributed the better result for compact development in the Cambridge area to its uniqueness as a low-density, centrally oriented, high-tech, university community and further noted that densification could "reduce its attractiveness over the longer term."

    Smart Growth Claims: Setting the Record Straight

    Based upon their research and review of the literature, the authors proceed to undermine some of smart growth’s most sacred foundations.

    Smart Growth Claim: Smart growth has little or no impact on house prices:

    Echenique et al: "…restrictions on the supply of development land have led to property price increases, penalizing city dwellers by leading to less dwelling space…”

    Smart Growth Claim: Smart growth increases housing choice:

    Echenique et al: "One downside of this policy is a substantial reduction in choice of dwelling types, with new dwellings being mainly apartments."

    Smart Growth Claim: Smart growth does not increase traffic congestion:

    Echenique et al: The authors cite research indicating that high average density is the main cause of highway congestion in Los Angeles. They also cite Reid Ewing (University of Utah) and Robert Cervero (University of California) who reviewed studies of household travel behavior finding that a doubling of density would lead to only a 5 percent reduction per person, or an increase of 90 percent in travel (Note 1). The authors add: "The obvious conclusion is that an increase in density will increase traffic congestion."

    Smart Growth Claim: Smart growth reduces air pollution:

    Echenique et al: "It can also increase the overall respiratory disease burden as exposure to traffic emissions is increased.

    Smart Growth Claim: "Empty nesters" (aging households with no offspring at home) will seek smaller houses in the urban core: 

    Echenique et al: "There is, however, no substantial evidence that older couples leave their spacious houses and gardens…"

    Smart Growth Claim: Smart growth improves the jobs-housing balance.

    Echenique et al: "One of the main arguments for the dispersed city is that there is no longer a single center where most jobs and services occur. Urban areas, rather, exhibit a dispersed and often polycentric structure, bringing jobs and services closer to residents with a more complex movement pattern not readily served by public transport.

    The authors suggest the following "takeaway:"

    "Urban form policies can have important impacts on local environmental quality, economy, crowding, and social equity, but their influence on energy consumption and land use is very modest; compact development should not automatically be associated with the preferred spatial growth strategy."

    Thus, the Echenique et research contradicts the thesis that compact development or smart growth should replace (make illegal) other regulatory regimes, including the more liberal dispersed pattern.

    "Smart growth principles should not unquestioningly promote increasing levels of compaction on the basis of reducing energy consumption without also considering its potential negative consequences. In many cases, the potential socioeconomic consequences of less housing choice, crowding, and congestion may outweigh its very modest CO2 reduction benefits."

    The British research is an important step toward focusing urban policies on objectives, rather than means. Cities are economic organisms. They have increased their share of the population 10 fold in just two centuries and been pivotal to unprecedented economic growth and affluence. People moved to the cities for economic opportunity, not to sample particular urban forms. Cities best serve their principal purpose and their residents best when they encourage economic growth. The fundamental objective is to maximize the discretionary income of residents, and this can be done while reasonable environmental standards are maintained. Yet, as Echenique et al and others have shown, smart growth tends to retard economic growth. In an age of teetering national economies, failing pension funds and the most uncertain fiscal environment in at least 80 years, the world needs cities to be unleashed for the economic growth. Urban policies that ignore economics need to be replaced with wholistic approaches strongly focused on the key reason that cities exist: to enrich their citizens.

    Wendell Cox is a Visiting Professor, Conservatoire National des Arts et Metiers, Paris and the author of “War on the Dream: How Anti-Sprawl Policy Threatens the Quality of Life.”

    ——

    Photo: Letchworth Garden City, London metropolitan region (by author).

    Note 1: Calculation: According to the research, doubling the density of an area reduces vehicle travel per capita by 5 percent. With 200 percent of the previous population (double the density), vehicle travel would be increased 90 percent (200% [x] 95% [=] 190%).

  • Rio-20: Eradicating Poverty Takes Precedence Over “Green Economy”

    The world’s largest English language newspaper, The Times of India reports that the Rio 20 Summit has agreed with India that "eradicating poverty should be given the highest priority, overriding all other concerns to achieve sustainable development." 

    The Times continued: "After a bitter fight with the developed countries, who wanted the objective of poverty eradication be made subservient to creating a ‘green economy’, India’s demand to put the goal of removing poverty above all other objectives in the final Rio+20 declaration — called "The Future We Want" — was agreed to…"

    The "G77" group of developing nations sought to ensure that economic and social sustainable developed goals were not secondary to "more green themes — such as renewable energy targets." The United States is reported to have supported the G77 position.

  • Is Perestroika Coming In California?

    When Jerry Brown was elected governor for a third time in 2010, there was widespread hope that he would repair the state’s crumbling and dysfunctional political edifice. But instead of becoming a Californian Mikhail Gorbachev, he has turned out to be something more resembling Konstantin Chernenko or Yuri Andropov, an aged hegemon desperately trying to save a dying system.

    As with the old party bosses in Russia, Brown’s distinct lack of courage has only worsened California’s lurch toward fiscal and economic disaster. Yet as the budget woes worsen, other Californians, including some Democrats, are beginning to recognize the need for perestroika in the Golden State. This was most evident in the overwhelming vote last week in two key cities, San Diego and San Jose, to reform public employee pensions, a huge reversal after decades of ever more expansive public union power in the state.

    California’s “progressive” approach has been enshrined in what is essentially a one-party state that is almost Soviet in its rigidity and inability to adapt to changing conditions. With conservatives, most businesses and taxpayer advocates marginalized, California politics has become the plaything of three powerful interest groups: public-sector unions, the Bay Area/Silicon Valley elite and the greens. Their agendas, largely unrestrained by serious opposition, have brought this great state to its knees.

    California’s ruling troika has been melded by a combination of self-interest and a common ideology. Their ruling tenets center on support for an ever more intrusive, and expensive, state apparatus; the need to turn California into an Ecotopian green state; and a shared belief that the “genius” of Silicon Valley can pay for all of this.

    Now this world view is foundering on the rocks of economic reality. The Soviet Union armed itself to the teeth and sent cosmonauts into space while the public waited on line for toothpaste and sausages. Similarly, Californians suffer from a combination of high taxes and intrusive regulation coupled with a miserable education system — the state’s students now rank 47th in science achievement — and a rapidly deteriorating infrastructure.

    The current recession has been particularly severe, continuing at a more acute level than in most states, including places like Florida and Arizona, which also suffered greatly from the housing bust. California now has the third highest unemployment rate in the U.S., beating out only its co-dependent evil twin Nevada and Rhode Island. At the same time, according to a recent Public Policy Institute of California study, inequality in the devoutly “progressive” state has been growing much faster than in the rest of the country.

    The most auspicious sign of grassroots support for perestroika was last week’s smack down of public employee unions in San Jose and San Diego. For the first time in recent memory, the unions suffered a humiliating defeat — the measures passed by a margin greater than two to one — as voters endorsed deep reform of the pension burdens bringing these cities to the brink of bankruptcy. Backed by its Democratic mayor, Chuck Reed, San Jose’s measure B aims to reduce pension benefits for both future and current hires. Unsurprisingly, the public employee have threatened to sue.

    This may precipitate what could become the California equivalent of a prairie fire. Like San Jose and San Diego, many other California cities are on the verge of bankruptcy. Union-dominated Los Angeles could be the next big domino to fall, according to the city’s own chief administrative office, and has been forced to boost its bonded indebtedness and cut back on critical infrastructure spending to stave off the inevitable.

    As services drop and taxes rise — California’s already are among the nation’s highest — voters increasingly realize that one of the main problems is over-generous pensions for public sector workers. This is reflected in the sad reality that the state consistently competes with Illinois for the worst bond rating in the country. Most recently, the state upped its deficit estimate to $16 billion from a $9.2 billion estimate made just in January.

    Brown could have used this mounting crisis to reveal his inner Gorbachev. But instead, he has so far chosen a classic Chernenko-Andropov muddle. He proposed a mild pension reform but could not persuade his own party — aware that vengeful the unions will be around long after the old man is gone — to consider it.

    More recently, the governor showed his own inner Stalinist by jettisoning his original more modest tax increase proposal for a more radical teachers’ union measure that would raise California’s income tax to the highest in the nation.

    Brown’s “millionaire’s” tax, as it is being marketed, starts with individuals making $250,000 or more. Right now it is still ahead in the polls but seems to be losing ground. Joel Fox, a longtime anti- tax activist, senses that people in the state — as evidenced by the San Jose and San Diego votes — are beginning to realize that the tax increases are designed primarily not to improve the schools, keep the parks open or pave the roads but simply to bolster public-sector pay and pensions.

    This collective turning on of the civic light bulb comes at the same time that the primary economic delusion that has dominated progressive politics — the myth of the high-tech savior — has fallen into disrepute. Under Brown and his monumentally incompetent predecessor, Arnold Schwarzenegger, state officials maintained a belief that Silicon Valley’s money machine would be able to bail the state out of its budgetary morass.

    In this context, the underwhelming performance of Facebook’s IPO last month takes on major political significance. Not only will there be fewer puerile billionaires to inflate the Valley real estate market and bankroll “progressive” candidates and causes, scores of hip wannabe start-ups suddenly may find themselves no longer the darlings of venture capital investors or the stock market. Like California’s budget itself, the social media boom is now looking like something of a fraud.

    Another potential casualty of the weak economy could be the green drive to remake the state into a kind of Ecotopian paradise. This is evident in growing opposition to some of Brown’s most beloved initiatives, notably a fantastically expensive high-speed rail system. Sold in the euphoric progressive atmosphere of 2008, support has collapsed as the price tag has soared and the state’s grievous fiscal problems have worsened. The most recent LA Times poll currently finds nearly three in five California voters would like to see the project scrapped.

    Once unassailable politically, the environmental community is fracturing between those thoroughly allied to rent-seeking capitalists and the Democratic Party and those still primarily concerned with preserving nature. The Sierra Club, for example, objects to Brown’s attempt to exempt the high-speed line from environmental review. Some Greens also object to Brown-supported projects like the massive tortoise-roasting solar farm planned for the Mojave Desert.

    Both Brown and the Greens also have failed to deliver many of the much ballyhooed “green jobs” that they insisted their policies would produce. Instead they may soon have to confront an electorate increasingly skeptical about green fantasies and more concerned with a persistently under-performing economy.

    Clearly, the conditions for a California perestroika are coming into place. Still missing is a coherent vision — from either Independents, centrist Democrats or Republicans — that can unite business, private-sector workers and taxpayers around a fiscally prudent, pro-economic growth agenda. Yet it’s clearly good news that , for the first time in a decade, there’s hope that the whole corrupt, failing California political edifice could come crashing down, providing a renewed hope for recovering the state’s former greatness.

    Joel Kotkin is executive editor of NewGeography.com and is a distinguished presidential fellow in urban futures at Chapman University, and contributing editor to the City Journal in New York. He is author of The City: A Global History. His newest book is The Next Hundred Million: America in 2050, released in February, 2010.

    This piece originally appeared in Forbes.

    Jerry Brown photo by BigStockPhoto.com.

  • Counting Trees in San Diego

    Recently, I came across “Taking Inventory of County’s Trees” in the San Diego Union Tribune, an article that describes Robin Rivet’s “ambitious effort to map every urban tree in San Diego County”. Rivet is an urban forester-arborist at the Center for Sustainable Energy California and she ”aims to quantify the value of all local trees and make a statement about a huge but often underappreciated resource.” My concern is that this article may be alerting San Diegans to more regulations, costs and loss of property rights coming our way.

    Through California’s legislative sustainable development and smart growth initiatives SB375 and AB 32, look for the implementation of ‘urban forests’ to be another area of focus by the State of CA and environmental NGOs to significantly reduce GHGs by 80% to below 1990 levels by 2050.

    “The website keeps a running tab of the trees’ “yearly eco impact.” The nearly 300,000 trees listed as of Thursday, according to the site, have reduced 19,622,883 pounds of CO2 from the atmosphere, conserved 83,213,745 gallons of water, conserved 8,502,988 kilowatts of energy, and reduced 46,244 pounds of pollutants from the air.”

    This project is being funded by CalFire. Why? Details in the CalFire AB32 Scoping Plan for Forestry reveal that CalFire is looking to assess CO2 sequestration in all forests and range lands across the state in order to mitigate GHG emissions. Capturing a map of San Diego County’s canopy becomes useful data to the state of California that is about to launch their highly controversial and lucrative Cap and Trade auction in November. The CalFire AB32 Scoping Plan states:

    “Unlike engineered projects or measures that reduce emissions at a point source (e.g. stack or tailpipe), the forest sector sequestration benefits are accrued through tree growth over large areas of the landscape, including urban areas. With such a large land base carbon benefits need to be accounted for in average stocks (amount of carbon stored).”

    Not only has the state of California legislated the reduction of GHG emissions through AB 32, it is mandating General Plan changes via SB375. SB375 is requiring municipalities (MPOS) to update their Regional Transportation Plans (RTP) and local land use plans to “reverse sprawl” with the intent of mitigating GHG emissions. Through the forest sector, CalFire suggests that if landowners saw the economic value of carbon sequestration, they would resist selling their land to developers and choose to participate in the carbon off-set market instead.

    “The creation and maintenance of carbon markets for forest carbon, both
    voluntary and compliance-based, will increase sequestration by providing
    landowner incentives to increase carbon stocks on their ownership. The value of
    carbon at $10/t is sufficient to interest landowners in changing their management
    practices to increase carbon storage. Updating the current California Climate
    Action Registry (CCAR) Forest Protocols can create the opportunity for a larger
    number of forest landowners to participate in carbon offset markets. The success
    of these markets will depend upon quality of the carbon that is being sold, which
    will depend upon the accounting principles applied in development of forest
    protocols used to verify and register carbon sequestration projects.

    Other incentives include providing landowners reduced tax or regulatory liabilities, which will encourage the retention of working forest landscapes, instead of land division and development. Additional opportunities may exist for subsidies or carbon taxes/fee revenues collected and reinvested in carbon sequestration projects.”

    The CalFire AB32 Scoping Plan for Forestry is full of useful information that can help us to understand and assess future regulations that might develop from their global warming mitigation and adaption schemes.

    “Tree planting under the urban forestry strategy has direct overlap with the goals
    of the “Cool Communities” strategy in the Land Use sector to encourage the development of communities that have lower surface temperatures. Urban tree planting may also have overlap with the Land Use sector strategies for “Landscape Guidelines” and “Smart Growth”. In addition, the forest sector Reforestation mitigation measure would require developers to provide 1 to 2 acres of reforestation as mitigation for every acre lost to development when converting forest land to other uses.”

    Based on what I know about sustainable development and smart growth, I propose we watch out for the adaptation portion of this urban forestry implementation plan in San Diego.

  • The Export Business in California (People and Jobs)

    California Senate President Pro-Tem Darrell Steinberg countered my Wall Street Journal commentary California Declares War on Suburbia in a letter to the editor (A Bold Plan for Sustainable California Communities) that could be interpreted as suggesting that all is well in the Golden State. The letter suggests that business are not being driven away to other states and that the state is "good at producing high-wage jobs," while pointing to the state’s 10 percent growth over the last decade. Senate President Steinberg further notes that the urban planning law he authored (Senate Bill 375) is leading greater housing choices and greater access to transit.

    This may be a description of the California past, but not present.

    Exporting People

    Yes, California continues to grow. California is growing only because there are more births than deaths and the state had a net large influx of international immigration over the past decade. At the same time, the state has been hemorrhaging residents (Figure 1).

    Californians are leaving. Between 2000 and 2009 (Note), a net 1.5 million Californians left for other states. Only New York lost more of its residents (1.6 million). California’s loss was greater than the population of its second largest municipality, San Diego. More Californians moved away than lived in 12 states at the beginning of the decade. Among the net 6.3 million interstate domestic migrants in the nation, nearly one-quarter fled California for somewhere else.

    The bulk of the exodus was from the premier coastal metropolitan areas. Since World War II, Los Angeles, San Francisco, San Diego and San Jose have been among the fastest growing metropolitan areas in the United States and the high-income world. Over the last decade, this growth has slowed substantially, as residents have moved to places that, all things being considered, have become their preferences.

    More than a net 1.35 million residents left the Los Angeles metropolitan area, or approximately 11 percent of the 2000 population. The San Jose metropolitan area lost 240,000 residents, nearly 14 percent of its 2000 population. These two metropolitan areas ranked among the bottom two of the 51largest metropolitan areas (over 1,000,000 population) in the percentage of lost domestic migrants during the period. The San Francisco metropolitan area lost 340,000 residents, more than 8 percent of its 2000 population and ranked 47th worst in domestic migration (New York placed worse than San Francisco but better than Los Angeles). Each of these three metropolitan areas lost domestic migrants at a rate faster than that of Rust Belt basket cases Detroit, Cleveland and Buffalo.

    San Diego lost the fewest of the large coastal metropolitan areas (125,000). Even this was double the rate of Rust Belt Pittsburgh.

    Exporting Jobs

    California is no longer an incubator of high-wage jobs. The state lost 370,000 jobs paying 25 percent or more of the average wage between 2000 and 2008. This compares to a 770,000 increase in the previous 8 years. California is trailing Texas badly and the nation overall in creating criticial STEM jobs and middle skills jobs (Figures 2 & 3) Only two states have higher unemployment rates than California (Nevada and Rhode Island) . California has the second highest underemployment rate (20.8 percent), which includes the number of unemployed, plus those who have given up looking for work ("discouraged" workers) and those who are working only part time because they cannot find full time work. Only Nevada, with its economy that is overly-dependent on California, has a higher underemployment rate.


    Business relocation coach Joseph Vranich conducts an annual census of companies moving jobs out of California and found a quickening pace in 2012. Often these are the very kinds of companies capable of creating the high-wage jobs that used to be California’s forte. Vranich says that the actual number may be five times as high, which is not surprising, not least because there is no reliable compilation of off-shoring of jobs to places like Bangalore, Manila or Cordoba (Argentina).

    To make matters worse, California is becoming less educated. California’s share of younger people with college degrees is now about in the middle of the states, while older, now retiring Californians are among the most educated in the nation (Figure 4).

    Denying Housing Choice

    It is fantasy to believe, as Steinberg claims, that there are enough single family (detached) houses in the state to meet the demand for years to come. More than 80 percent of the new households in the state chose detached housing over the last decade. People’s actual choices define the market, not the theories or preferences of planners often contemptuous of the dominant suburban lifestyle.

    In contrast, however, the regional plans adopted or under consideration in the Bay Area, Los Angeles and San Diego would require nearly all new housing be multi-family, at five to 10 times normal California densities (20 or more units to the acre are being called for). New detached housing on the urban fringe would be virtually outlawed by these plans. And, when Sacramento does not find the regional plans dense enough, state officials (such as the last two state Attorneys General) are quick to sue. If the "enough detached housing" fantasy held any water, state officials and planners would not be seeking its legal prohibition. To call outlawing the revealed choice of the 80 percent (detached housing) would justify the equivalent of a Nobel Prize in Doublespeak.

    At the same time by limiting the amount of land on which the state preferred high density housing must be built, land and house prices can be expected to rise even further from their already elevated levels (already largely the result of California’s pre-SB 375 regulatory restrictions).

    Transit Rhetoric and Reality

    Transit is important in some markets. About one-half of commuters to downtown San Francisco use transit. The assumptions of SB 375 might make sense if all of California looked like downtown San Francisco. It doesn’t, nor does even most of the San Francisco metropolitan area. Only about 15 percent of employment is downtown, while the 85 percent (and nearly all jobs in the rest of the state) simply cannot be reached by transit in a time that competes with the car. Even in the wealthy San Jose area (Silicon Valley), with its light rail lines and commuter rail line, having a transit stop nearby provides 45 minute transit access to less than 10 percent of jobs in the metropolitan area.

    A recent Brookings Institution report showed that the average commuter in the four large coastal metropolitan areas can reach only 6.5 percent of the jobs in a 45 minute transit commute. This is despite the fact that more than 90 percent of residents can walk to transit stops. Even when transit is close, you can’t get there from here in most cases in any practical sense (Figure 5).

    SB 375 did little to change this. For example, San Diego plans to spend more than 50 percent of its transportation money on transit over the next 40 years. This is 25 times transit’s share of travel (which is less than 2 percent). Yet, planners forecast that all of this spending will still leave 7 out of 8 work and higher education trips inaccessible by transit in 30 minutes in 2050. Already 60 to 80 percent of work trips in California are completed by car in 45 minutes and the average travel time is about 25 minutes.

    For years, planners have embraced the ideal of balancing jobs and housing, so that people would live near where they work, while minimizing travel distances. This philosophy strongly drives the new SB 375 regional plans. What these plans miss is that people choose where to work from the great array of opportunities available throughout the metropolitan area. These varied employment opportunities that are the very reason that large metropolitan areas exist, according to former World Bank principal planner Alain Bertaud.

    People change jobs far more frequently than before and multiple earners in households are likely to work far apart. Similar intentions led to the development up to four decades ago of centers like Tensta in Stockholm, which ended up as concentrated low income areas (Photo). It California, such a concentration would do little to improve transit ridership, even low-income citizens are four to 10 times as likely use cars to get to work than to use transit.


    Tensta Transit Oriented Development: Stockholm

    All of this means more traffic congestion and more intense local air pollution, because higher population densities are associated with greater traffic congestion. Residents of the new denser housing would face negative health effects because there is more intense air pollution, especially along congested traffic corridors.

    Self-Inflicted Wounds

    Worst of all, California’s radical housing and transportation strategies are unnecessary. The unbalanced and one-dimensional pursuit of an idealized sustainability damages both quality of life and the economy. This is exacerbated by other issues, especially the state’s dysfunctional economic and tax policies. It is no wonder California is exporting so many people and jobs. California’s urban planning regime under SB 375 is poised to make it worse.

    Wendell Cox is a Visiting Professor, Conservatoire National des Arts et Metiers, Paris and the author of “War on the Dream: How Anti-Sprawl Policy Threatens the Quality of Life”.

    Net Domestic Migration: 2000-2009
    Rank Metropolitan Area Net Domestic Migration Compared to 2000 Population
    1 Raleigh, NC         194,361 24.2%
    2 Las Vegas, NV         311,463 22.4%
    3 Charlotte, NC-SC         248,379 18.5%
    4 Austin, TX         234,239 18.5%
    5 Phoenix, AZ         543,409 16.6%
    6 Riverside-San Bernardino, CA         469,093 14.3%
    7 Orlando, FL         225,259 13.6%
    8 Jacksonville, FL         126,766 11.3%
    9 Tampa-St. Petersburg, FL         260,333 10.8%
    10 San Antonio, TX         177,447 10.3%
    11 Atlanta, GA         428,620 10.0%
    12 Nashville, TN         123,199 9.4%
    13 Sacramento, CA         141,117 7.8%
    14 Richmond, VA           75,886 6.9%
    15 Portland, OR-WA         121,957 6.3%
    16 Dallas-Fort Worth, TX         317,062 6.1%
    17 Houston, TX         243,567 5.1%
    18 Indianapolis. IN           72,517 4.7%
    19 Oklahoma City, OK           41,082 3.7%
    20 Denver, CO           66,269 3.0%
    21 Louisville, KY-IN           34,381 3.0%
    22 Birmingham, AL           26,934 2.6%
    23 Columbus, OH           34,204 2.1%
    24 Kansas City, MO-KS           31,747 1.7%
    25 Seattle, WA           40,741 1.3%
    26 Minneapolis-St. Paul, MN-WI          (19,731) -0.7%
    27 Memphis, TN-MS-AR            (8,583) -0.7%
    28 Hartford, CT            (9,349) -0.8%
    29 Cincinnati, OH-KY-IN          (17,648) -0.9%
    30 Virginia Beach-Norfolk, VA-NC          (20,005) -1.3%
    31 Baltimore, MD          (36,407) -1.4%
    32 St. Louis, MO-IL          (43,750) -1.6%
    33 Philadelphia, PA-NJ-DE-MD        (115,890) -2.0%
    34 Pittsburgh, PA          (52,028) -2.1%
    35 Washington, DC-VA-MD-WV        (107,305) -2.2%
    36 Providence, RI-MA          (49,168) -3.1%
    37 Salt Lake City, UT          (34,428) -3.5%
    38 Rochester, NY          (40,219) -3.9%
    39 San Diego, CA        (126,860) -4.5%
    40 Buffalo, NY          (55,162) -4.7%
    41 Milwaukee,WI          (74,453) -5.0%
    42 Boston, MA-NH        (235,915) -5.4%
    43 Miami, FL        (287,135) -5.7%
    44 Chicago, IL-IN-WI        (561,670) -6.2%
    45 Cleveland, OH        (136,943) -6.4%
    46 Detroit,  MI        (366,790) -8.2%
    47 San Francisco-Oakland, CA        (347,375) -8.4%
    48 New York, NY-NJ-PA     (1,962,055) -10.7%
    49 Los Angeles, CA     (1,365,120) -11.0%
    50 San Jose, CA        (240,012) -13.8%
    51 New Orleans, LA        (301,731) -22.9%
    Data from US Census Bureau


    —–

    Note:  2000 to 2010 data not available

    Lead photo: Largely illegal to build housing under California Senate Bill 375 planning