Tag: Evolving Urban Form: Development Profiles of World Urban Areas

  • The Evolving Urban Form: Chongqing

    No city in the world is so misunderstood by analysts and the press. It is commonly asserted Chongqing is the largest city in the world. In reality it barely makes the top 50, ranking 47th.

    Cities (Shi) in China are Regions and Mostly Rural

    It is fundamentally a problem of semantics and a failure to comprehend the nuances of urban geography in China. The country is divided into provinces and their equivalents, which are in turn, divided into prefectures, most of which are "shi," "Shi" translates into English as "city." However, shi are completely different from any English conception of a city as "an inhabited place of greater size, population, or importance than or village" (per Merriam Webster).

    There approximately 300 shis and other prefectures (sub-provincial jurisdictions) in China. In contrast, there are approximately 10 times as many sub-state jurisdictions (counties) in United States, which has a land area slightly larger than that of China. China’s shi and other prefectures are thus very large. They are really more like regions in English. Virtually all shi are predominantly rural, rather than urban in their land use.

    Reporters often marvel at the many cities in China of more than 1,000,000 population. Yet many of these are nothing more than broad expanses of rural areas without large urban settlements. Take, for example, Bazhong, a "shi" of 3.3 million residents in Sichuan province. The largest urban settlement occupies just 5 square miles (13 square kilometers), roughly the same land area as Goodland, Kansas (a city of fewer than 5,000 residents). Bazhong shi’s population is spread across a virtually 100 percent rural landscape of 4,700 square miles (12,300 square kilometers).

    Chongqing in Context

    Chongqing is a shi, and is administered as a province by the national government, as also are Shanghai, Beijing and Tianjin. The province of Chongqing covers 32,000 square miles (82,500 square kilometers). This is nearly equal to the land area of Austria and more than the area of the state of Maine. No city in the world is as large as Austria.. The New York urban area comes the closest to Chongqing’s size at 4,500 square miles (11,600 square kilometers), one-seventh the land area of Chongqing.

    Not a Metropolitan Area

    Nor is it appropriate to consider the province of Chongqing as a metropolitan area (labor market). It is simply too large for that. Commuters from the Chongqing’s "Southeast Wing" would have to travel up to 5 hours, mainly on the China’s 75 mile per hour (120 kilometer per hour) freeway system to reach work in the Chongqing urban area. From the outer reaches of Chongqing’s "Northeast Wing," travel times could exceed 8 hours, again largely by 75 mile per hour freeway.

    A Largely Rural, Not Urban Province

    The province of Chongqing is predominantly rural yet The Guardian persists in telling us that "Chongqing is the fastest-growing urban centre on the planet. Its population is already bigger than that of Peru or Iraq." Not so. The 2010 Census of China placed the province of Chongqing’s population at 28.8 million, smaller than both Peru and Iraq and with fewer people than in 1990. The urban center (genuine city) of Chongqing does not reach a quarter the size of either Peru or Iraq.

    The Guardian is by no means alone. Time magazine cluelessly fawned "Virtually overnight, Chongqing has become the largest city not only in China, but in the world," Wired similarly misfired with indicating in a 2008 article that Chongqing (at 32 million population) was the "fastest-growing urban center on Earth." For all the supposed growth, not a soul was added to Chongqing province during the 2000s, as is described below.

    Not all media outlets, however, have been captured by the same fallacy as The Guardian, Time, Wired and many others. To its credit, the BBC went to considerable lengths to correct this and similar errors about the population of Chongqing. An Atlanticarticle also parsed the issue well.

    Losing Population

    In reality Chongqing lost 1.7 million people between 2000 and 2010, 5.5 percent of its population. This is significant. By contrast, the municipality of Chicago lost 6.9 percent over the same period, a loss that was considered devastating. It is not surprising that Chongqing is losing population, given its principally rural nature. Much of rural China is emptying out, as people migrate to the cities for economic opportunity (which is the very purpose of cities), just as they have done in previous decades and the last two century throughout higher income nations. Every year over the past decade, the province experienced an annual decline of 170,000, not the half-million increase reported by The Guardian. The actual urban center (not the imaginary urban center reported on by The Guardian) is gaining in population, but nothing like "half a million" per year.

    The Genuine City of Chongqing

    There is, however, a genuine city of Chongqing. Surprisingly reminiscent of Pittsburgh, Chongqing is it nestled among elongated folded mountains that are near duplicates of those near the Pennsylvania city. The city is at the confluence to two rivers, the Yangtze and the Jialing. Like the Pittsburgh’s Golden Triangle where the Allegheny and Monongahela Rivers meet, Chongqing’s has an attractive open space at Chaotianmin where the two rivers meet. Finally, as in Pittsburgh, there is an impressive, high rise central business district behind the open space. This is the best example in China of a monocentric central business district typical of many US cities (downtown Shanghai and Nanjing are similar, but more spread out).

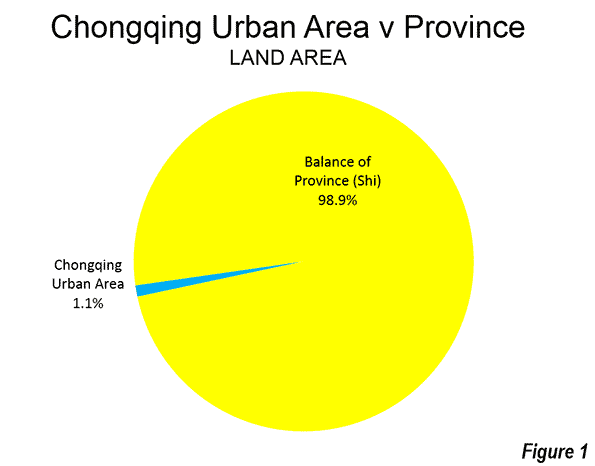
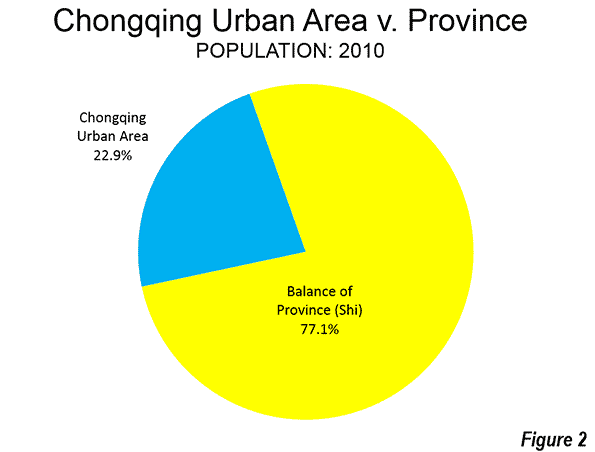
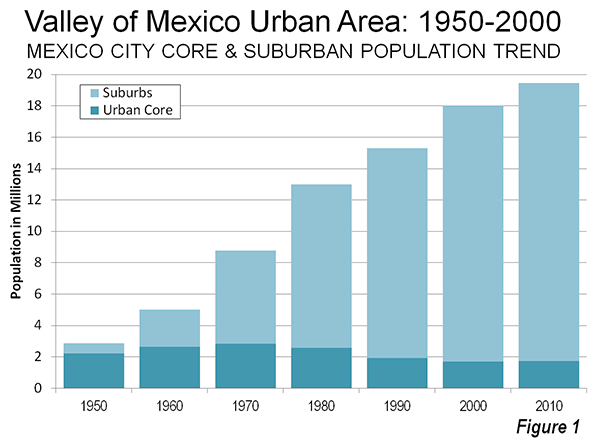
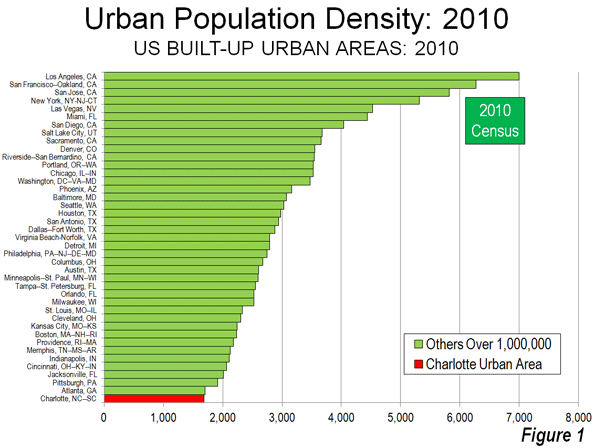
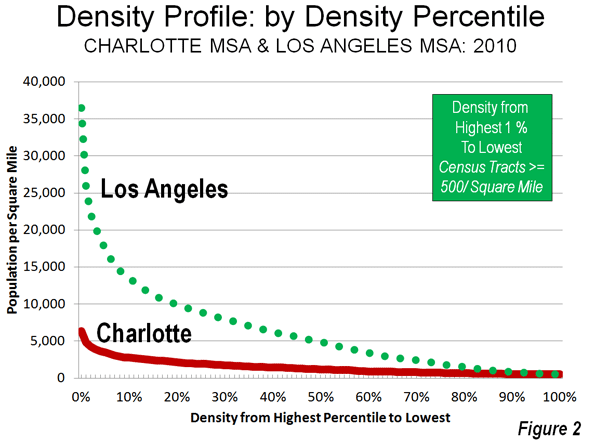
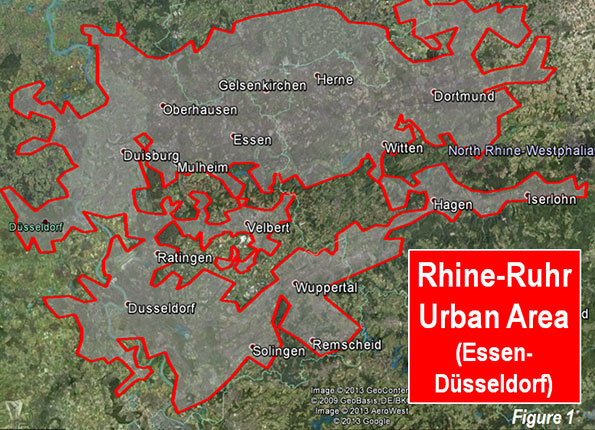
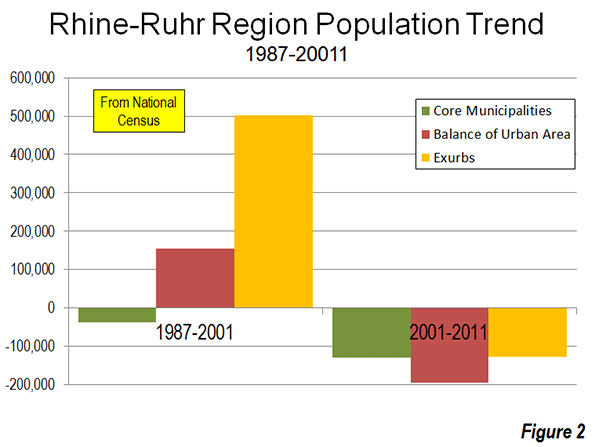
    The Chongqing urban area covers little more than 1/100th of the province’s land area (Figure 1) and contains less than one-quarter of the population (Figure 2). Yet the Chongqing urban area is still large. According to the 10th Annual Edition of Demographia Urban Areas, Chongqing has a 2014 population of 6.8 million living in a land area of 340 square miles (890 square kilometers). The urban population density is 19,600 per square mile (7,700 per square kilometer), which is about one third higher than the larger urban area average of 14,900 per square mile (5.700 per square kilometer) found across China. This is more than double the density of the Paris urban area, triple the density of the Los Angeles urban area and six times that of Portland.

    The "One Hour Economic Circle:" The Future Metropolitan Area

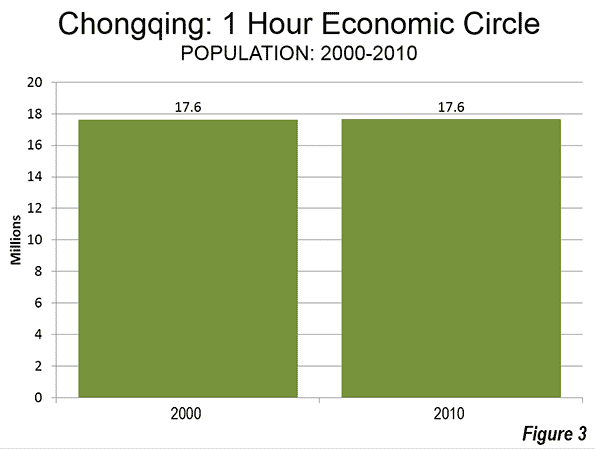
    Chongqing’s administration has a vision of a much larger city. The urban plan is concentrated on the "One Hour Economic Circle," defined as within "one hour’s driving distance." This area includes 23 of Chongqing’s 40 divisions (counties and urban districts, or qu’s), with a land area of 11,000 square miles (28,600 square kilometers), more than 1.5 times the size of the Paris metropolitan area (aire urbaine) and slightly larger than New York. The 2010 census counted a population of 17.6 million in the One Hour Economic Circle, but most of it still rural. Outside the One Hour Economic Circle, in what is called the "Northeast Wing" and the "Southeast Wing," the rural influence is even greater.

    The intent of the urban plan is to broaden the economic influence of the urban area. This would involve substantial increases in economic interchange (principally commuting) with the balance of the One Hour Economic Circle, now decidedly rural.

    Within the One Hour Economic Circle, the large rural population suggests the potential for in-situ urbanization could also contribute to economic growth as migration, as rural residents are afforded opportunities to adopt urban lifestyles (as has occurred in Quanzhou and other urban areas, especially in the province of Fuzhou).

    Population Trends 2000-2010

    The divisions (qu) that encompass the urban area are growing, even though the core is losing (Yuzhong qu). In contrast, the metropolitan area had a population of 8.0 million in 2010, up 19 percent from 2000. This is not particularly rapid growth for China. Nearly 20 metropolitan areas grew twice as fast from 2000 to 2010. Nearby Chengdu, the capital of Sichuan, grew 2.5 times as fast as Chongqing.

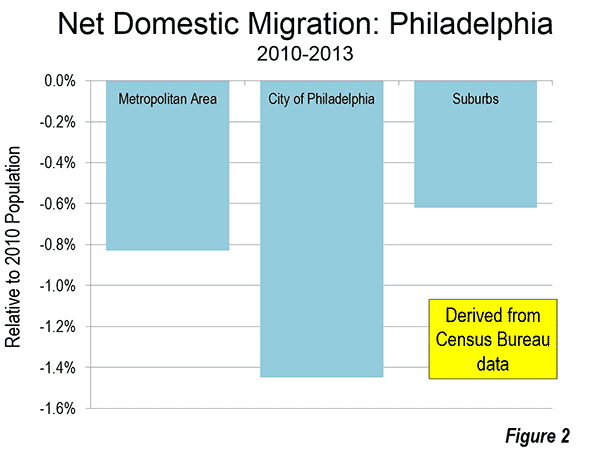
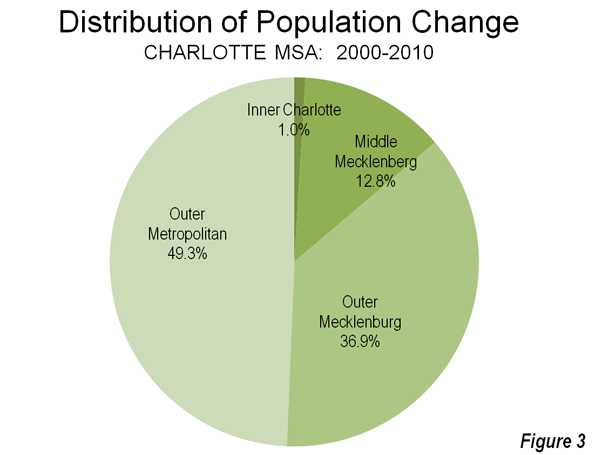
    Outside the metropolitan area, the One Hour Economic Circle experienced a population loss of 12 percent. As a result of this loss, the One Hour Economic Circle had only a negligible population increase of 0.1 percent between 2000 and 2010 (Figure 3).

    The Future

    At the presently projected United Nations growth rate, the Chongqing urban area would add nearly one quarter to its population by 2025. But under this pattern Chongqing will barely hold its own, but remain in the top 50 world urban areas. Yet, the city has grand plans. There are nationally and locally designated economic zones, and lower business costs encouraging commerce to move west in China. As a province and urban area directly administered by Beijing, Chongqing could be positioned for both strong population and economic growth. Yet, it remains an open question whether Chongqing will emerge as one of China’s major growth centers.

    —————-

    Note: Shi are divided into county level jurisdictions, such as qu (urban districts), counties (rural districts) and count level shi.

    ——-

    Wendell Cox is principal of Demographia, an international public policy and demographics firm. He is co-author of the “Demographia International Housing Affordability Survey” and author of “Demographia World Urban Areas” and “War on the Dream: How Anti-Sprawl Policy Threatens the Quality of Life.” He was appointed to three terms on the Los Angeles County Transportation Commission, where he served with the leading city and county leadership as the only non-elected member. He was appointed to the Amtrak Reform Council to fill the unexpired term of Governor Christine Todd Whitman and has served as a visiting professor at the Conservatoire National des Arts et Metiers, a national university in Paris.

    Photo: Downtown Chongqing (by author)

  • The Evolving Urban Form: Philadelphia

    Philadelphia was America’s first large city and served as the nation’s capital for all but nine months between the inauguration of George Washington is the first president in 1789 and the capital transferred to Washington, DC in 1800.

    Before the early 1900s, the United States Census Bureau had not developed a metropolitan area (labor market area) concept. However, the website peakbagger.com has attempted to define earlier metropolitan areas based on concepts similar to those used today. In the case of Philadelphia, this is important, because it was somewhat unique in having virtually adjacent, highly populated suburbs that make comparisons of municipal populations (the only population data available) misleading.

    The Nation’s Largest City

    According to municipal population data, New York had become the largest municipality in the United States by the time of the first census, in 1790. Philadelphia was ranked second. However, a list of the top 24 urban places in 1790 shows two Philadelphia suburbs, Northern Liberties and the Southwark district. When peakbagger.com includes these suburbs, Philadelphia rises as the largest city (metropolitan area) in the nation in the 1790 and 1800 censuses. The New York metropolitan area is shown as rising to number one in 1810, a position it is held for 200 years and may last for much longer in light of the much slower growth rate recently for Los Angeles.

    Soon the Nation’s 9th Largest City?

    Those were the glory days. In the years since 1800, Philadelphia has been falling in population rank. The Philadelphia metropolitan area was displaced first by Chicago in 1900, according to the metropolitan district estimates of the US Census Bureau. In 1940, Philadelphia was demoted to fourth place by Los Angeles. Philadelphia held fourth position until 2006, when Dallas-Fort Worth raced past it. Then just a few years later (2010), Houston knocked Philadelphia down to 6th place. The downward trend could accelerate rather quickly. At current growth rates (2010 to 2013), Philadelphia would be passed by Washington and Miami by the time of the 2020 census. The Atlanta metropolitan area would also pass Philadelphia if its population growth rate is restored to pre-Great Recession rates. Philadelphia should start the next decade as either the 9th or 10th largest metropolitan area in the nation.

    Population Growth in the Philadelphia Metropolitan Area

    The Philadelphia metropolitan area is unusual in being divided between four states. The core city of Philadelphia is located in Pennsylvania. Directly across the Delaware River are the suburban counties of New Jersey. Wilmington, formerly the largest metropolitan area in Delaware has been incorporated into the Philadelphia metropolitan area (New Castle County). Maryland’s Cecil County is also included in the metropolitan area.

    All of Philadelphia’s population growth since 1950 has been in the suburbs. In that year, the city of Philadelphia peaked at 2,072,000 residents. This was a healthy increase from the 1,930,000 in the 1940 census. However, this represented a decline from 1,951,000 in 1930 and shadowed massive population losses that would follow after 1950 (Cleveland and St. Louis also lost population between 1930 and 1940).

    By 2000, the city’s population had dropped 27 percent to 1,518,000. This could prove its modern low, as the population recovered to 1,526,000 in the 2010 census and was estimated by the Census Bureau at 1,553,000 in 2013.

    The suburbs of the metropolitan area as presently defined added nearly 2.6 million residents between 1950 and 2013. However, the metropolitan area only grew by 2.1 million residents because of the more than 500,000 loss in the city of Philadelphia. The inner ring suburbs, counties abutting Philadelphia County in Pennsylvania and New Jersey gained 1.8 million residents, while the outer suburbs gained nearly 800,000 residents (Figure 1).

    Domestic Migration

    Philadelphia has continued to lose domestic migrants to other areas of the country. Between 2010 and 2013, approximately 50,000 net domestic migrants left the Philadelphia area. Of this, 22,000 left the city of Philadelphia and 28,000 left the suburbs. The rate of domestic migration loss was 0.8 percent in the metropolitan area, 1.4 percent in the city of Philadelphia and 0.6 percent in the suburbs (Figure 2).

    Employment

    Within the metropolitan area, the commercial primacy of the core city of Philadelphia also has been reduced. Philadelphia has long been known for having one of the largest central business districts in the United States. The most recent census tract data from the CTPP indicates that Philadelphia has the sixth largest business district in the United States, with approximately 240,000 jobs. This represents only 8.7 percent of the metropolitan area employment, a figure slightly above the 8.4 percent average of the 52 major metropolitan areas (those with more than 1 million residents).

    The development of Philadelphia’s "center city" business district may have been stunted by city regulations that prohibited buildings to exceed the height of City Hall, topped off by a statue of city founder William Penn. At nine floors and approximately 550 feet (165 meters), City Hall was briefly the tallest building in the world in the early 1900s. City Hall remained a dominant feature of the skyline until the late 1980s, when One Liberty Place, with its 61 floors rose to 945 feet (290 meters). There are now 8 buildings taller than City Hall. Construction will soon begin on a new office and hotel tower , which at 1,120 foot tall (340 meters), 59 floor building would be the tallest building in the United States outside New York and Chicago (and taller, by 20 feet than Wilshire Grand now under construction in Los Angeles).

    Transportation

    I have described the city of Philadelphia as a "transit legacy city," which along with New York, Chicago, San Francisco, Boston, and Washington account for 55 percent of all the transit commuting destinations in the United States. This is nearly 10 times the share of jobs that are located in these six municipalities (not metropolitan areas).

    Philadelphia, like the other five other transit legacy cities has an extensive urban rail system. Philadelphia has commuter rail lines extending outward to suburban locations in Pennsylvania, New Jersey and Delaware. There are also two Metro lines (subway lines) and electric trolley lines. This transit system delivers 44 percent of commuters to "center city" jobs. This represents more than 40 percent of the transit commuting in the Philadelphia metropolitan area. Transit’s market share to work locations outside downtown is relatively small at 6.0 percent.

    The nation’s first long intercity tollway (the Pennsylvania Turnpike) passes through the Philadelphia metropolitan area. This route, in connection with the New Jersey Turnpike, the Ohio Turnpike, the Indiana Toll Road and the Chicago Skyway provided freeway equivalent access between the New York, Philadelphia, Pittsburgh, Cleveland and Chicago metropolitan areas in the middle 1950s, before the interstate highway system was authorized.

    Philadelphia’s stagnant population growth is typical for the Northeast, which continues to lose domestic migrants to the rest of the nation. It seems likely to continue. In the two decades following 2020, Phoenix and Riverside-San Bernardino are projected by the US Conference of Mayors to pass Philadelphia. This would push Philadelphia down to 12th place, compared to the 4th ranking it had at the beginning of the 21st century. Quite a ride down for the City of Brotherly Love, and its surrounding region.

    Wendell Cox is principal of Demographia, an international public policy and demographics firm. He is co-author of the "Demographia International Housing Affordability Survey" and author of "Demographia World Urban Areas" and "War on the Dream: How Anti-Sprawl Policy Threatens the Quality of Life." He was appointed to three terms on the Los Angeles County Transportation Commission, where he served with the leading city and county leadership as the only non-elected member. He was appointed to the Amtrak Reform Council to fill the unexpired term of Governor Christine Todd Whitman and has served as a visiting professor at the Conservatoire National des Arts et Metiers, a national university in Paris.

    Photo: Philadelphia City Hall by Max Binder

  • The Evolving Urban Form: Suburbanizing Mexico

    There is an increasing recognition – at least outside the academy, planning organization and urban core developer groups – that the spatial expansion of cities or suburbanization represents the evolving urban form of not only the United States and virtually all of the high income world but also across the developing world, whether middle income or third world.

    In recent years, Mexico has made substantial economic progress. Per capita income (purchasing power parity) in Mexico exceeds that of all the "BRIC" nations (Brazil, Russia, India, and China) except resource-rich Russia.

    In Mexico, as almost everywhere, cities continue to expand to provide more living space for an emerging suburban middle-class. This is obvious in the new townhouse (attached house) and detached house developments that ring the urban areas (photograph above). Some of the best evidence of this can be observed on and beyond the southern edge of the nation’s second-largest urban area, Guadalajara (for example on Google Earth).

    The Valley of Mexico

    Nearly 3 years ago, one of the first Evolving Urban Form articles highlighted the Valley of Mexico metropolitan area, which is Mexico City in its functional (economic) manifestation. That article noted that the core municipality of Mexico City in 1950 had 2.23 million residents out of the urban area’s fewer than 3 million and comprised only 54 square miles (139 square kilometers). By 1970, the city’s population had risen to 2.85 million. However, as has happened in Paris, Copenhagen, Milan, Osaka, Glasgow, Detroit, and many others, the urban core population plummeted. By 2000, the former city had a population of only 1.69 million, a 40 percent loss from 1970. There was a modest population increase between the 2000 and 2010 censuses, but its population seems unlikely to ever be restored to near their previous peak, which mirrors the experience of Paris and Copenhagen.

    Instead all population growth in the Valley of Mexico metropolitan area has been outside the 1950 area of Mexico City and in the post-World War II suburbs. While comparable metropolitan area data is not available, the Mexico City urban area added more than 10 million residents between 1970 and 2010. The same period, the suburban areas added more than 11 million residents (Figure 1). The Valley of Mexico metropolitan area is located not only in the Distrito Federal, but also in the states of Mexico and Hidalgo.

    The Other Major Metropolitan Areas

    While the scale of urbanization in the Valley of Mexico dwarfs that of the rest of the nation, similar dispersion is evident in the nation’s other 11 metropolitan areas with more than 1,000,000 population (Figures 2 and 3).

    Guadalajara

    Guadalajara, capital of state of Jalisco, is Mexico’s second largest metropolitan area. Between 2000 and 2010, the metropolitan area grew nearly 20 per cent, from 3.7 million residents to 4.4 million. The core city (locality) of Guadalajara lost 150,000 residents, registering a population of just under 1.5 million in 2010. Suburbs accounted for approximately all the metropolitan area’s population growth.

    Monterey

    Monterey, capital of the state of Nuevo Leon, is currently the third largest metropolitan area in Mexico and is growing slightly more rapidly than Guadalajara. Between 2000 and 2010, Monterey added 22 per cent to its population, which increased from 3.4 million residents to 4.1 million. The central locality grew modestly, but 97 per cent of the metropolitan area growth was in the suburbs.

    Central Mexico

    The Valley of Mexico metropolitan area is encircled by smaller, but major metropolitan areas that are among the fastest-growing in the nation.

    Queretaro, the capital of the state of Queretaro, is located 130 miles (220 kilometers) north of Mexico City by freeway. Queretaro is the fastest-growing major metropolitan area in Mexico, having added 34 per cent to its population over the last census period, to reach 1.1 million. More than two thirds of the growth was in the suburbs.

    Toluca, capital of the state of Mexico (Note), is located across a mountain range only 40 miles (65 kilometers) west of Mexico City. Toluca grew 33 percent to 1.9 million residents in 2010. Nearly 90 per cent of Toluca’s population growth was in the suburbs between 2000 and 2010.

    Pueblo, capital of the state of Puebla, is located across mountain range 130 miles (80 kilometers) to the east of Mexico City. Puebla is located in a valley surrounded by some of the most spectacular volcanoes in the world, including Popocateptl and Iztaccihuatl (both more than 17,000 feet, or 5,100 meters), toward Mexico City, La Malinche (14,600 feet or 4,500 meters), only 17 miles from the city center and Orizaba (18,500 feet or 5,600 meters). The three tallest of these reach elevations higher than any in North America outside of the Yukon and Alaska. Puebla was the slowest growing of the Central Mexico metropolitan areas, adding 23 percent to its population, and reaching 2.9 million residents in 2010. Three quarters of Puebla’s growth was in the suburbs. The Puebla metropolitan area extends into the state of Tlaxcala.

    Border Metropolitan Areas

    In comparison,   the large metropolitan areas on the United States border expanded outwards but not as rapidly. Tijuana, which is adjacent to the San Diego metropolitan area now has 1.75 million residents. More than 60 percent of its growth over the preceding 10 years was suburban. Juarez (located in the state of Chihuahua), is across the border from the El Paso metropolitan area and reached a population of 1.5 million, with slightly more than one half of its growth being in the suburbs. Neither San Diego-Tijuana area nor Juarez -El Paso qualify as metropolitan areas because they are not labor markets – there are significant limitations on the movement of labor (employees).

    Other Interior Metropolitan Areas

    Three other major metropolitan areas are located in the interior. In Torreon (states of Coahuila and Durango), more than 60 percent of the population growth was in the suburbs. A smaller 51 percent of the growth in San Luis Potosi (state of San Luis Potosi) was in the suburbs. The significant exception was Leon (state of Guanajuato), where only 36 percent of the growth was outside the core urban core.

    Continuing Dispersion

    Overall, 5.1 million of the 6.0 residents added to Mexico’s major metropolitan areas between 2000 and 2010 were outside the urban cores (Figure 4). Most of the growth was in the three largest metropolitan areas (Mexico City, Guadalajara and Monterrey), which added 3.2 million residents. The urban cores of these three metropolitan areas together declined approximately 100,000, while the suburbs attracted more than all of the metropolitan area growth. Mexico seems well positioned for continued economic growth and a populace that seeks better standards of living, more often than not in dispersed settings.

    Wendell Cox is a Visiting Professor, Conservatoire National des Arts et Metiers, Paris and the author of “War on the Dream: How Anti-Sprawl Policy Threatens the Quality of Life.

    —————-

    Note: The state of Mexico has the largest population in the nation, at 15.2 million (2010). This is 70 percent more than the second largest federal division, the Distrito Federal. This state of Mexico borders the Distrito Federal (Mexico City) on three sides and it outer suburban areas constitute more than one-half of the Valley of Mexico metropolitan area population (11 million of 21 million). Another 2 million are located in the even more distant state of Hidalgo. This state of Mexico also includes Toluca, another major metropolitan area (see above).

    ————

    Photograph: Southern suburbs of Guadalajara (by author)

    Correction: This version removes reference to Tijuana as the capital of Baja California. Mexicali is the state capital.

  • The Evolving Urban Form: The San Francisco Bay Area

    Despite planning efforts to restrict it, the Bay Area  continues to disperse. For decades, nearly all population and employment growth in the San Jose-San Francisco Combined Statistical Area has been in the suburbs, rather than in the core cities of San Francisco and Oakland. The CSA (Note) is composed of seven adjacent metropolitan areas (San Francisco, San Jose, Santa Cruz, Santa Rosa, Vallejo, Napa, and Stockton). A similar expansion also occurred in the New York CSA.

    The San Francisco Bay Area is home to two of the three most dense built-up urban areas in the United States, the San Francisco urban area, (6,266 residents per square mile or 2,419 per square kilometer) with the core cities of San Francisco and Oakland and the all-suburban San Jose urban area (5,820 residents per square mile or 2,247 per square kilometer), according to US Census 2010 data. Only the Los Angeles urban area is denser (6,999 per square mile or 2.702 per square kilometer). The more spread out New York urban area trails at 5,319 per square mile (2,054 per square kilometer).

    The San Francisco Bay & Central Valley Area

    The continuing dispersion was reflected in commuting patterns that developed between 2000 and 2010, with the addition of the Stockton metropolitan area, which is composed of San Joaquin County, with more than 700,000 residents. San Joaquin County is located in the Central Valley and is so far removed from San Francisco Bay that it may be appropriate in the long run to think of the area as the "San Francisco Bay & Central Valley Area." The distance from Stockton to the closest point shore of San Francisco Bay is 60 miles, and it is nearly another 25 miles to the city of San Francisco.

    Ironically, this continued dispersion of jobs and residences is, at least in part, driven by the San Francisco Bay Area’s urban containment land use policies designed to prevent it. What the planners have ignored is the impact on house prices associated with highly restrictive land use planning. The San Francisco metropolitan area and the San Jose metropolitan area are the third and fourth most unaffordable major housing markets out of 85 rated in the recent 10th Annual Demographia International Housing Affordability Survey, trailing only Hong Kong and Vancouver.

    Historical Core Cities: San Francisco and Oakland

    The historical core municipalities (cities) of the San Francisco Bay Area, San Francisco and Oakland have held their population very well. Each essentially retains it 1950 borders. Among the 40 US cities with more than 250,000 residents in 1950, only San Francisco and Oakland managed population increases by 2000 without substantial annexations and substantial non-urban (rural) territory within their city limits. For example, New York and Los Angeles, both of which have grown, have nearly the same city limits as in 1950 and 2000, yet much of New York’s Staten Island was rural in 1950 as was much of the San Fernando Valley in Los Angeles.

    Yet both San Francisco and Oakland have had difficult times. Between 1950 and 1980, both San Francisco and Oakland suffered 12 percent population losses, which were followed by recoveries. The losses were modest compared to the emptying out of municipalities like St. Louis. Detroit, Chicago, Copenhagen, and Paris, which remain one quarter to nearly two-thirds below their 1950s figures. Further, population gains from annexations masked losses within the 1950 boundaries of many cities, such as Portland, Seattle, and Indianapolis, etc.

    San Jose: Now the Largest City

    San Jose is now the Bay Area’s largest city. San Jose has grown spectacularly, from a population of 95,000 in 1950 to nearly 1,000,000 today. San Jose passed San Francisco by the 1990 census and Oakland by the 1970 census (Figure 1). Virtually all of San Jose’s population growth has occurred during the postwar period of automobile suburbanization. The pre-automobile urban form familiar in San Francisco and central Oakland simply does not exist in San Jose. Even attempts to pretend the pre-war urban form has returned have been famously unsuccessful. Even after building an extensive light rail system, San Jose’s transit work trip market share is barely one quarter that of the adjacent San Francisco metropolitan area.

    Nonetheless, suburban San Jose has become a dominant force in the "Silicon Valley", which stretches through San Mateo County in the San Francisco metropolitan area and into Santa Clara County, which includes San Jose. The Silicon Valley has been the capital of the international information technology business for at least a half century. The highly suburbanized region has done more than its share to elevate the San Francisco Bay Area to its high standard of living (According to Brookings Institution data), a phenomenon that has spread also the urban core of San Francisco. At the same time, San Jose is the second most affluent major metropolitan in the world and San Francisco ranks seventh. The Silicon Valley, which includes much of San Mateo County (adjacent to Santa Clara County in the San Francisco metropolitan area), is clearly the economic engine of the region with twice as many jobs as San Francisco (which is both a city and a county).

    Metropolitan Growth

    Overall, the San Francisco Bay Area has grown approximately 180 percent since 1950, considerably more than the national average from 1950 to 2012 of 107 percent. The Bay Area’s growth was strong, but well behind the 280 percent growth achieved in the Los Angeles CSA (Los Angeles, Riverside-San Bernardino, and Oxnard MSAs).

    However, growth has since moderated substantially. Between 1950 and 2000, the Bay Area grew at an annual rate of 1.9 percent but since 2000, the annual growth rate has dropped to 0.7 percent annually. Even so, in recent years, the Bay Area has nearly equaled the much slowed growth of the Los Angeles CSA, adding 23.6 percent to its population since 1990, compared to 25.5 percent in Los Angeles. Both areas, however, grew at less than the national population increase rate (25.8 percent), and slowing, in the 2000s to the slowest growth rates since California became a state in 1850.

    Suburban Growth

    Despite the decent demographic performance of the cities of San Francisco and Oakland since 1950, nearly all Bay Area growth occurred in the suburbs. Between 1950 and 2012, only one percent of population growth in the CSA occurred in the two historical core municipalities and 99 percent in suburban areas. Things have been somewhat better for the two cities since 2000, with seven percent of the growth in the historical core municipalities and 93 percent of the growth in suburban areas (Figure 2).

    Since 1950, the San Jose metropolitan area has grown by far the fastest in the CSA, with the more than 500 percent increase in population. The outer metropolitan areas (Santa Cruz, Santa Rosa, Vallejo, Napa, and Stockton) have grown nearly 300 percent, while the parts of the San Francisco metropolitan area outside the two core cities grew more than 200 percent. San Francisco and Oakland grew approximately 5 percent (Figure 3).

    Domestic Migration

    As house prices increased before the subprime crisis, the Bay Area lost more than 600,000 domestic migrants, a rate of more than 85,000 per year. Since 2008, however, with substantially lower house prices, and a renewed tech boom, there has been an annual gain of approximately 4,000 to the Bay Area in domestic migration. However, if the substantial house price increases since 2012 continue, the area could again become a net exporter of people.

    Future Urban Evolution

    Like much of California, San Francisco Bay CSA exhibits much slower population growth than before. How much of this is tied to the regional and state policies constricting suburban housing remains an open question, but it seems much growth that might have occurred in the original San Francisco metropolitan area or the later developing San Jose metropolitan area will instead occur in the Vallejo or Stockton metropolitan areas, where housing prices  tend to be much lower, particularly for larger homes that are increasingly unaffordable closer to the urban core. Indeed, it is not impossible that Modesto (Stanislaus County) could be added  to the San Francisco Bay CSA by 2020, which is even farther away from the historical core than the Stockton metropolitan area.

    At the same time, many potential new residents may find either the high prices near the core nor the long commutes associated with Central Valley residence unappealing. Many households may instead seek their aspirations in Utah, Colorado, Texas, and even Oklahoma, not least because the "California Dream" has been made affordable.

    Wendell Cox is a Visiting Professor, Conservatoire National des Arts et Metiers, Paris and the author of “War on the Dream: How Anti-Sprawl Policy Threatens the Quality of Life.

    —–

    Note: Metropolitan areas are labor markets. Their building blocks in the United States are complete counties. Metropolitan statistical areas are organized around built up urban areas with counties reaching a threshold of the urban area population being considered central counties and included in the metropolitan area. In addition, any county with an employment interchange of 25 percent or more with the core counties is also included in the metropolitan area. Adjacent metropolitan areas are added together to form Combined Statistical Areas if there is a 15 percent or more employment interchange. This is a simplified definition. Complete details are available from the US Office of Management and the Budget.

    Photo: Market Street, San Francisco (by author)

  • The Evolving Urban Form: Charlotte

    There may be no better example of the post World War II urban form than Charlotte, North Carolina (a metropolitan area and urban area that stretches into South Carolina). Indeed, among the approximately 470 urban areas with more than 1 million population, Charlotte ranks last in urban population density in the United States (Figure 1) and last in the world. According to the United States Census Bureau, Charlotte’s built-up urban area population density was 1685 per square mile (650 per square kilometer) in 2010. Charlotte is not only less dense than Atlanta, the world’s least dense urban area with more than 4,000,000 residents, but it is only one-quarter the density of the supposed  “sprawl capital” of Los Angeles (Figure 2).

    Over the last seven decades, Charlotte also has been among the fastest growing metropolitan areas in the United States. Charlotte is the county seat of Mecklenburg County, and as recently 1940 as was home to 101,000 residents while with its suburbs in Mecklenburgh County was barely 150,000.

    Declining Densities in the Core City

    Charlotte is also in example of the difficulty of using the core municipality data for comparisons to the suburban balance of metropolitan areas. With North Carolina’s liberal annexation laws, Charlotte has pursued a program of nearly continuous annexation such that in every 10 years since 1940, the city has added substantial new territory.

    In 1940, the city of Charlotte covered a land area of 19 square miles (50 square kilometers) and had a population density of 5200 per square mile (2,000 per square kilometer). For a prewar core municipality, this was not at all dense. For example, Evansville Indiana, which had approximately the same population at the time, had a population density nearly twice that of Charlotte. Other larger core municipalities approached triple or more Charlotte’s population density, such as Trenton, Buffalo, Providence, and Milwaukee.

    Over the last seven decades, the city’s population has risen by 6.2 times, while its land area has increased by 14.4 times (Table $$$). The result is a 53% decline in the city of Charlotte’s population density, to 2456 per square mile (948 per square kilometer). This is only slightly above average density of the US built-up urban area – which includes the smallest towns and suburbs of every size – of 2,343 per square mile (1,455 per square kilometer). Indeed, the average far flung suburbs (30 miles distant) of Los Angeles, such as Pomona and Tustin, are more than 2.5 times as dense.

    City of Charlotte (Municipality)
    Population & Land Area: 1940-2010
    Census Population Area: Square Miles Area: Square KM Density (Sq. Mile) Density (KM)
    1940           100,899 19.3 50.0          5,228          2,019
    1950           134,042 40.0 103.6          3,351          1,294
    1960           201,564 64.8 167.8          3,111          1,201
    1970           241,178 76.0 196.8          3,173          1,225
    1980           314,447 139.7 361.8          2,251             869
    1990           395,934 174.3 451.4          2,272             877
    2000           567,943 242.3 627.6          2,344             905
    2010           731,424 297.8 771.3          2,456             948
    Change 625% 1443% 1443% -53.0% -53.0%


    Growth by Geography

    The core city of Charlotte’s ever-fluctuating boundaries make it necessary to use smaller area measures to estimate the distribution of population growth. This can be accomplished using zip code data from the 2000 and 2010 censuses.

    Inner Charlotte, for the purposes of this analysis (zip codes 28202 through 28208) covers approximately 28 square miles (73 square kilometers) and had a population of approximately 92,000 in 2010 . This is a larger area than the city of Charlotte in 1940, which covered only two thirds as much land area and had more people. Between 2000 and 2010, this inner area population rose by 6,200 residents. All the gain was in the central zip code that comprises the downtown area (central business district), which in Charlotte is called "Uptown." Outside this small 1.8 square mile area (4.7 square kilometers), the inner area actually lost 1,400 residents.

    Overall, the inner area of Charlotte – which has somewhat an obsessive hold on many city leaders – accounted for 1.0% of the metropolitan area growth from 2000 to 2010. This is not unlike other major metropolitan areas, which have experienced slow growth, particularly in areas adjacent to the downtown cores. Among the 51 US metropolitan areas with more than 1,000,000 population in 2010, net gain occurred within two miles of city hall, while this gain was erased by a loss of 272,000 between two and five miles of city hall.

    Another 13% (64,000) of the 2000-2010 growth occurred in the middle Mecklenburg County zip codes (28209 to 28217), virtually all of which is in the city of Charlotte. This 185 square mile area, combined with the inner area, exceeds the land area of the city in 1990.

    Mecklenburg County’s outer zip codes, many of which are in the city, captured 37% of the metropolitan area’s growth (184,000). The remaining 49% (247,000) of growth in the Charlotte metropolitan area was outside Mecklenburg County (Figure 3).

    From 1990 to 2010, Charlotte was the seventh fastest growing metropolitan area out of the 51 with a population exceeding 1 million. Early data for the present decade shows Charlotte to have slipped to ninth fastest growing; however during this period, Charlotte has displaced Portland, Oregon as the nation’s 23rd largest metropolitan area. Between 1990 and 2012, Charlotte added nearly 1,000,000 residents and now has 2.4 million residents.

    Uptown: The Commercial Story

    Unlike other post-World War II metropolitan areas (such as Phoenix, San Jose, and Riverside-San Bernardino), Charlotte has developed a concentrated, high rise downtown area." Part of this is due to the city’s strong financial sector. Charlotte is the home to Bank of America, the nation’s second largest bank and the successor to the San Francisco-based California bank of the same name that was the largest bank in the world for decades. Nation’s Bank, the predecessor to Bank of America, erected a 60 story tower in 1992 that was among the tallest in the United States.

    Charlotte was also home to Wachovia Bank, which built its 42 floor headquarters before, and nearby the Bank of America Tower. Wachovia had intended to move to a larger, 50 story building. However, the time it was completed, Wachovia had been sold to Wells Fargo Bank, a casualty of the US financial crisis. The new building was renamed the Duke Energy Center.

    Thus, Charlotte consumed one San Francisco bank, and lost another to San Francisco. Now Uptown Charlotte has six buildings more than 500 feet in height (152 meters). With six buildings of this height,  Charlotte has developed by far the concentrated central business district among the newer metropolitan areas.

    However, the high employment density has not converted into a transit oriented business district, as some might have predicted. American Community Survey (CTPP) data indicates that approximately 87% of uptown employees use cars to get to work. Further, more than 90% of the jobs in the metropolitan area are outside Uptown.

    Uptown: The High Rise Condominium Story

    Uptown’s commercial progress has not been replicated in the residential market, as overzealous high rise condominium developers apparently may have confused Charlotte for Manhattan or Hong Kong. One of the more recent 500 foot plus towers was The Vue, a 50 story condominium tower. Too few condominiums were sold, and a foreclosure auction followed. The new owner has converted the condominiums to rental units. A 40 story condominium project ("One Charlotte") was to feature units priced from $1.5 million to $10 million, but was cancelled. Another condominium building, the 32 story 300 South Tryon was also cancelled. A tower base was prepared for a 50 plus story condominium monolith, but this was never built, while depositors were claiming they could not find the developer to get their deposits back. It was also reported that legendary developer Donald Trump had plans for the tallest building in town, a 72 story condominium tower, which would have been joined by another tower. These have also been cancelled (for artists renderings, click here).

    Charlotte’s Continuing Dispersion

    While Uptown condominium developers were unable to sell many units, Charlotte’s labor market dispersed so much between 2000 and 2010 that the Office of Management and Budget expanded the metropolitan area by four counties. The net addition to the population of this revision was approximately 460,000.  This is by far the largest percentage increase to a metropolitan area over the period, though much larger New York added counties with 660,000 residents.

    Charlotte seems to say it all with respect to the ill-named "back to the city movement" (ill named, because most suburbanites did not come from the city to begin with). Yes, there is growth downtown and yes, it is important and yes, it is healthy. But, in the overall scheme of things, it is small, and relative to the rest of the thriving region, likely to remain less important in the years ahead.

    Wendell Cox is a Visiting Professor, Conservatoire National des Arts et Metiers, Paris and the author of “War on the Dream: How Anti-Sprawl Policy Threatens the Quality of Life.

    Photo: Uptown Charlotte courtesy of Wiki Commons user Bz3rk

  • The Evolving Urban Form: Greater New York Expands

    The term “Greater New York” was applied, unofficially, to the 1898 consolidation that produced the present city of New York, which brought together the present five boroughs (counties). The term “Greater” did not stick, at least for the city. When consolidated, much of the city of New York was agricultural. As time went on, the term "Greater" came to apply to virtually any large city and its environs, not just New York and implied a metropolitan area or an urban area extending beyond city limits. By 2010, Greater New York had expanded to somewhere between 19 million and 23 million residents, depending on the definition.

    Greater New York’s population growth has been impressive. Just after consolidation, in 1900, the city and its environs had 4.2 million residents, according to Census historian Tertius Chandler. Well before all of the city’s farmland had been developed, New York, including its environs, had become the world’s largest urban area by the 1920s, displacing London from its 100 year predominance. Yet, even when Tokyo displaced New York in the early 1960s, there was still farmland on Staten Island. 

    New York became even larger in two dimensions, as a result of geographic redefinitions arising from the 2010 census.

    The Expanding New York Metropolitan Area

    The New York metropolitan area grew by enough land area to add more than 700,000 residents between 2000 and 2010, even after the decentralization reported upon in the metropolitan area as defined in 2000. The expansion of the metropolitan area occurred because the employment interchange between the central counties and counties outside the metropolitan area in 2000 became sufficient to expand the boundaries by more than 1,000 square miles (2,500 square kilometers).

    Summarized, metropolitan areas are developed by identifying the largest urban area (area of continuous urban development with 50,000 or more population) and then designating the counties that contain this urban area as “central counties.” Additional (“outlying”) counties are included in a metropolitan area if 25 percent or more of their resident workers have jobs in the central counties, or if 25 percent or more of the employees in the outlying county live in the central counties (There are additional criteria, which can be reviewed at 2010 Office of Management and Budget metropolitan area standards). In addition, adjacent metropolitan areas can be merged into a combined statistical area at a lower level of employment interchange (see below).

    For example, one of the counties added to the New York metropolitan area in the 2010 redefinition was Dutchess (home of the Franklin Delano Roosevelt Presidential Library). A resident of Dutchess County who works across the county line in Putnam County (a central county) would count toward the 25 percent employment interchange with the central counties of the New York metropolitan area. Contrary to some perceptions, metropolitan areas do not denote an employment interchange between suburban areas and a central city, even as major an employment destination as the city of New York.

    The OMB concept of “central” counties is in contrast to the more popular view that would consider the central counties to be Manhattan (New York County) or the five boroughs of New York City. In fact, out of the New York metropolitan area’s 25 counties, all but three (Dutchess and Orange in New York and Pike in Pennsylvania) are central counties. Sufficient parts of the urban area are in the other 22 counties, which makes them central.

    The Expanding New York Combined Statistical Area

    OMB has a larger metropolitan concept called the "combined statistical area." The combined statistical area is composed of metropolitan and micropolitan areas that have a high degree of economic integration with the larger metropolitan area. Essentially, adjacent areas are merged into a combined statistical area if there is an employment interchange of 15 percent. This occurs where the sum of the following two factors is 15 percent or more: (1) The percentage of resident workers in the smaller area employed in the larger area (not just central counties) and (2) The percentage of workers employed in the smaller area who reside in the larger area.

    On this measure, New York became greater by more 1 million residents as a result of the changes in commuting patterns. The addition of Allentown (Pennsylvania – New Jersey) and the East Stroudsburg, Pennsylvania metropolitan areas expanded the New York combined statistical area by another 2,700 square miles (7,000 square miles), bringing the population to 23.1 million. Altogether, the metropolitan area and combined area land area increases added up to 3,700 square miles (9,700 square kilometers). The 35 county New York combined statistical area is illustrated in the map (Figure 1).

    Organized Around the World’s Largest Urban Area (in Land Area)

    The New York combined statistical area is very large. It covers approximately 14,500 square miles (37,600 square kilometers). From north to south, it measures 235 miles (375 kilometers) from the Massachusetts border of Litchfield County, Connecticut to Beach Haven, in Ocean County, New Jersey. It is an even further east to west, at more than 250 miles (400 kilometers) from Montauk State Park in Suffolk County, New York to the western border of Carbon County in Pennsylvania (Note 2). Despite containing the largest urban area  in the world, at 4,500 square miles (11,600 square kilometers), more than 60 percent of the combined statistical area is rural (see Rural Character in America’s Metropolitan Areas).

    Dispersion of Jobs and Residences

    The dispersion characteristic of modern metropolitan regions is illustrated by the extent to which jobs have followed the population in the New York combined statistical area. In all “rings” outside the city of New York, there is near parity between resident workers and jobs. The greatest employment to worker parity (0.97) is in the metropolitan and micropolitan areas outside the New York metropolitan area (Allentown, PA-NY; Bridgeport, CT; East Stroudsburg, PA; New Haven, CT; Torrington, CT; and Trenton, NJ). There is 0.94 parity in the inner ring suburban counties, which include Nassau and Westchester in New York as well as Bergen, Essex, Hudson, Middlesex, Passaic and Union in New Jersey. The outer balance of the New York metropolitan area has slightly lower employment to worker parity, at 0.87 (Figure 2).

    The lowest employment to worker parity in the New York combined statistical area is in the four boroughs of New York City outside Manhattan, at 0.70. The greatest disparity is in Manhattan, where there are 2.80 jobs for every resident worker. Combining all of New York’s five boroughs yields a much more balanced 1.17 jobs per resident worker.

    Example: Commuting from Hunterdon County

    Hunterdon County, New Jersey provides an example of the dispersion of employment in the New York area. Hunterdon County is located at the edge of the New York metropolitan area. It is well served by the commuter rail services of New Jersey Transit. With a line that reaches Penn Station in New York City, approximately 55 miles (35 kilometers) away. Yet, the world’s second largest employment center (after Tokyo’s Yamanote Loop), Manhattan south of 59th Street, draws relatively few from Hunterdon County to fill its jobs.

    Among resident workers, 45 percent have jobs in Hunterdon County. Another 36 percent work in other outer counties of the combined statistical area. This leaves only 19 percent of workers who commute to the rest of the combined statistical area. The New Jersey inner suburban counties attract 16 percent of Hunterdon’s commuters and Manhattan employs just three percent of Hunterdon’s resident workers (Figure 3). Fewer than 0.5 percent of Hunterdon’s commuters work in the balance of the CSA, including the outer boroughs of New York, the other New York counties and Connecticut). The detailed area definitions are included in the Table.

    DISTRIBUTION OF COMMUTING FROM HUNTERDON COUNTY, NEW JERSEY
    To Locations in the New York Combined Statistical Area (2006-2010)
    NY CSA Sector Commuting from Hunterdon County Areas Included
    Hunterdon County 45.0% Hunterdon County, NJ
    Outer Combined Statistical Area 35.6% Monmouth County, NJ
    Morris County, NJ
    Ocean County, NJ
    Pike County, PA
    Somerset County, NJ
    Sussex County, NJ
    Allentown metropolitan area, PA-NJ
    East Stroundsburg metropolitan area, PA
    Trenton metropolitan area, NJ
    Inner Ring (New Jersey only) 16.1% Bergen County, NJ
    Essex County, NJ
    Hudson County, NJ
    Middlesex County, NJ
    Passaic County, NJ
    Union County, NJ
    Manhattan 2.8% New York County, NY
    Elsewhere 0.4% Bronx
    Brooklyn
    Queens
    Staten Island
    Dutchess County, NY
    Nassua County, NY
    Orange County, NY
    Putnam County, NY
    Rockland County, NY
    Suffolk County, NY
    Westchester County, NY
    Bridgeport metropolitan area, CT
    Kingston metropolitan area, NY
    New Haven metropolitan area, CT
    Torrington metropolitan area, CT


    From Commuter Belts and Concentricity to Dispersion

    Metropolitan areas are labor markets, as OMB reminds in its 2010 metropolitan standards, which refer to metropolitan areas, micropolitan areas, and combined statistical areas as geographic entities associated with at least one core plus “adjacent territory that has a high degree of social and economic integration with the core as measured by commuting ties. ”

    Yet metropolitan areas have changed a great deal. Through the middle of the last century, metropolitan areas were perceived as monocentric with core cities and a surrounding “commuter belt” from which the city drew workers to fill its jobs. However, metropolitan areas have become more polycentric, as Joel Garreau showed in his book Edge City: Life on the New Frontier. In more recent years, metropolitan areas have become even more dispersed, with most employment located in areas that are hardly centers at all. Of course, some people still commute to downtown and edge cities. Others work even further away, but most find their employment much closer to home. That is the story of New York and, which has just become greater, and other metropolitan areas as well.

    ——

    Note 1: OMB revised its metropolitan terms in 2000. The term “core based statistical area” (CBSA) is used to denote metropolitan areas (organized about urban areas of 50,000 population or more) and micropolitan areas (organized around urban areas of 10,000 to 50,000 population). The former “consolidated metropolitan statistical area,” was replaced by the combined statistical area, which is a combination of core based statistical areas. OMB also notes that the term “urban area” includes “urbanized areas” (50,000 population or more) and “urban clusters (10,000 to 50,000 population).

    Note 2: Part of the reason for this large geographic expanse is the use of counties as building blocks of core based statistical areas. If the smaller geographic units were used (such as census blocks, as in the delineation of urban areas), the geographies would be smaller, though populations would be similar.

    ——-

    Wendell Cox is a Visiting Professor, Conservatoire National des Arts et Metiers, Paris and the author of “War on the Dream: How Anti-Sprawl Policy Threatens the Quality of Life.

    Photograph: 59th Street, Manhattan (by author).

  • The Evolving Urban Form: Portland

    Among urban planners, there is probably not a more revered urban area in the world than Portland (Oregon). The Portland metropolitan area and its core urban area , principally located in Oregon, stretches across the Columbia River into the state of Washington (Figure 1). Nearly four decades ago, the state of Oregon adopted strong urban planning requirements, including the requirement of an urban growth boundary. Two principal purposes of the resulting policies (referred to as “smart growth,” “urban containment, “compact cities,” etc.) were densification and transferring travel demand from cars to transit.

    Portland’s progress toward these objectives has been modest, at best. Most growth has continued to be in the suburbs. There has been only modest densification, and employment has continued to disperse from the core. At the metropolitan area level, travel by car remains virtually as dominant as before and traffic congestion has intensified materially. Finally, house prices have been driven up relative to incomes (Note 1).

    Portland: A Dispersing Metropolitan Area

    Like virtually all major metropolitan areas in the world, Portland has experienced substantial dispersion. The core county of Multnomah peaked at more than two thirds of the metropolitan area population in 1930, as defined in 2000 (Note 2). By 2010, Multnomah County had dropped to one third of the metropolitan area population (Figure 2).

    The dispersion has continued in recent years, though there has been core growth (as has been the case in many metropolitan areas). Between 2000 and 2010, the area within two miles (three kilometers) of Portland City Hall grew more than 20 percent. However, this was only five percent of the metropolitan area’s growth. In the inner ring extending to five miles (eight kilometers) from City Hall, the growth was only three percent, well below the metropolitan area’s overall 15 percent growth rate. More than 90 percent of the metropolitan area’s population growth was outside a five mile radius (Figure 3).

    Portland: A Low Density Urban Area

    Despite its international reputation as an exemplar of compactness , Portland is a low density urban area. Among the 875 urban areas in the world with more than 500,000 population, 797 are denser than Portland.

    In the low density United States, Portland ranked 12th among major urban areas (over 1 million population), at approximately 3,500 residents per square mile (1,350 per square kilometer) in 2010. This is approximately 10% higher than the major urban area average density but barely half that of the densest, Los Angeles, with its undeserved reputation for low-density, “sprawling” development (Figures 4 and 5).

    Portland is less dense than all major urban areas in the 13 western states, with the exception of Seattle. Notably, Riverside San Bernardino is denser, despite consisting almost exclusively of post-World War II automobile-oriented development. Even much smaller California urban areas, such as Stockton, Bakersfield, Lodi and Delano are denser than Portland.

    Portland and Houston: Density Cousins

    The Portland metropolitan area’s density profile nearly duplicates that of Houston, which is just as famous for its liberal land use and transportation policies nearly the opposite of Portland’s (Note 3). Both metropolitan areas have nearly the same percentage of their populations living at densities below 7,500 per square mile (2,865 per square kilometer). A 40 percent larger share lives at densities of from 7,500 to 10,000 per square mile (3,860 per square kilometer) in Portland, while Houston’s share of its population living at densities above 10,000 per square mile is three times that of Portland (Figure 6).

    Among the nation’s 51 major metropolitan areas, Portland ranks 25th in the share of population living in zip codes with more than 10,000 people per square mile in 2010 (Figure 7).

    Portland’s Job Dispersion

    As in other metropolitan areas, jobs have dispersed substantially around Portland. Today, fewer than 10% of the jobs are located in downtown Portland (the central business district). The city of Portland itself has approximately 1.41 jobs per resident worker. Suburban Hillsboro, with the third largest employment base in the metropolitan area, has slightly more jobs per resident workers (a higher “jobs-housing balance”) according to American Community Survey data.

    Transit in Portland

    Portland has developed an extensive rail system, intended to attract drivers from their cars. Today, six light rail lines (five light rail) radiate toward the urban periphery, focusing on downtown (the central business district, or CBD).

    Yet the share of commuters using transit has fallen by a quarter since 1980, the last data available before the first light rail line opened. In short, rail has not changed the calculus of travel in Portland. Working at home, which is a less expensive and more environmentally friendly work access mode, has caught up with and now exceeds transit, as has occurred in most US major metropolitan areas. (Figure 8)

    Worse, transit may have already experienced its “best of times.” The future could be grim. Opposition to rail expansion has grown, and longer term transit service cuts of up to 70 percent have been threatened. (See Portland’s Transit Halcyon Days?)

    As elsewhere, transit in Portland is “about downtown.” The Portland Business Alliance estimates that 36% of downtown workers commute by transit. This is nearly one-half of all transit commuting in the Portland metropolitan area. Even in the job rich suburbs of Hillsboro and Beaverton, the share of people using transit for the work trip is less than the 5.0 percent national average.

    Portland: Intensifying Traffic Congestion

    Clinging to the fantasy transit can materially reduce automobile travel, Oregon officials have blocked substantial roadway expansions. Residents have been rewarded with much intensified traffic congestion.

    The Texas A&M Texas Transportation Institute Annual Mobility Report (Note 4) reveals Portland to have the 6th worst traffic congestion in the nation among major metropolitan areas. This compares to a before-rail ranking of 39th in 1982. Now Houston, Atlanta, Dallas-Fort Worth and Phoenix all have lower levels of traffic congestion than Portland (Figure 9). Without decades of urban containment and anti-mobility policies, these metropolitan areas have improved traffic congestion relative to Portland. This is despite far larger increases in travel demand. Since the early 1980s, each of these metropolitan areas has added more residents than live in the entire Portland metropolitan area. Portland also ranks among the worst (5th) in commuter stress (a measure of peak direction traffic congestion), according to the Annual Mobility Report

    Portland: Congestion and Higher Greenhouse Gas Emissions

    Reflecting the reality that greater traffic congestion increases greenhouse gas emissions, Portland’s carbon dioxide (CO2) emissions per automobile commuter have increased substantially and transit has made only the scantest difference. Between 1982 and 2011, Portland’s increase in CO2 emissions was greater than Houston, Atlanta and Phoenix, though less than Dallas- Fort Worth (Figure 10).

    Deteriorating Housing Affordability in Portland

    In Portland, consistent with both economic principle and considerable research, urban containment policy drives house prices up relative to incomes higher by rationing the supply of land and housing. In 2010, values of comparable land on either side of the urban growth boundary varied by more than 10 times in value per acre (a phenomenon also identified in Auckland, New Zealand by Chairman of the Reserve Bank of New Zealand, Arthur Grimes).

    The most recent Demographia International Housing Affordability Survey indicated that Portland’s median multiple (median house price divided by median household income) was 4.3. In normally functioning housing markets, the median multiple is typically 3.0 or less, a ratio last achieved in Portland in 1995. This higher median house price means than approximately 125,000 fewer Portland households —or 15% of households — are able to afford the median priced house. (Note 5).

    Higher housing costs retard the standard of living by reducing discretionary incomes (gross income minus taxes and necessities). This, in turn, leads to less demand for other goods and services (in the “discretionary economy”), less job creation and less economic growth.

    Even so, Portland’s rising house prices have been moderated by the nearby availability of less expensive houses on larger lots in the Vancouver area (Clark County, Washington). There, more liberal land use regulation permits consumer-driven housing choice, rather forcing households to choose from the limited offerings planning authorities prefer.

    In part due to rising prices, Portland is becoming less diverse . Indeed, Aaron Renn has called Portland the penultimate example in his searing critique, The White City. After the results of the 2010 census were announced. The Oregonian quoted then Mayor Sam Adams’ concern about the exodus of African-Americans from the city (municipality), saying that Portlanders should care about the fact that we offer ¬such limited access to equal opportunities. Local policymakers are largely oblivious to the role that urban containment policy may have played in diminishing those opportunities.

    Misplaced Priorities

    Despite all of this, Portland has its advantages.

    As in Houston, Seattle, Atlanta and virtually all other major metropolitan areas regardless of land use regulations, a core renaissance is underway that is making a dense urban lifestyle more practical for the relatively few who both prefer it and can afford it. The suburban lifestyle, dominant virtually everywhere in the United States, remains alive and well in Portland (Note 6). Portland’s physical location remains the envy of most metropolitan areas. There is little better scenery than the nearby Columbia Gorge or majestic Mt. Hood, which crowns the area on clear days.

    However, Portland has been sidetracked by a pre-occupation with urban design, at least partially driven by concerns about reducing greenhouse gas emissions. The good news is that technological advances are poised to do far more to reduce greenhouse gas emissions than could ever be achieved by urban containment policy.

    But scenery aside, cities are primarily economic organisms. Cities have grown by serving the aspirations of people for a better standard of living. The very purpose of cities is to facilitate affluence and minimize poverty among residents (see Toward More Prosperous Cities). Yet policies, such as urban containment, that inherently reduce household discretionary incomes and impose greater congestion costs reduce discretionary incomes. Despite intentions to the contrary, the results show this to be the real Portland story.

    —————————————–

    Note 1: Some other metropolitan areas that have embraced urban containment policy have produced even worse results. For example, traffic congestion is worse in Vancouver, Sydney, Melbourne and far smaller Auckland, according to the “Tom Tom Congestion Index,” a real-time traffic reporting competitor to INRIX. Portland has seriously unaffordable housing, though has not retarded the standard of living nearly so much as in Vancouver, Sydney, Melbourne or Auckland, where housing is severely unaffordable. Attention is drawn to Portland’s negative outcomes because of the extent to which its policies are revered in the urban planning community around the world.

    Note 2: Multnomah County is used in this analysis, instead of the historical core city of Portland, which has grown in large measure by annexation. Since 1950, the city added 108 percent to its land area and little more than half (56 percent) to its population.

    Note 3: Houston is sometimes referred to as having deregulated land use. This is not strictly correct, though Houston is closer to a deregulated model than any other US metropolitan area. The city of Houston does not have zoning, though some municipalities in the suburbs are zoned. Many neighborhoods in the city of Houston have private land use covenants.

    Note 4: The Annual Mobility Report has been the authoritative measure of traffic congestion in US urban areas for three decades. More recently, the report’s traffic congestion measures have been significantly strengthened by the use of actual global positioning data from INRIX, which also produces its own Traffic Scorecard both for US and international urban areas, using satellite based real-time traffic data.

    Note 5: Estimated from income qualifying income requirements as reported by the National Association of Realtors for the third quarter of 2012 and the metropolitan income distribution modeled based on the 2011 American Community Survey.

    Note 6: In 1999, new urbanist architect Andres Duany evaluated Portland in a commentary for The Oregonian: “To my surprise, as soon as I left the prewar urbanism (to which my previous visits had been confined), I found all the new areas on the way to the urban boundary were chock full of the usual sprawl one finds in any U.S. city, no better than in Miami. The outcome wasn’t that different after all.”

    ————————-

    Wendell Cox is a Visiting Professor, Conservatoire National des Arts et Metiers, Paris and the author of “War on the Dream: How Anti-Sprawl Policy Threatens the Quality of Life.

    Photo: Mount Hood (by author)

  • The Evolving Urban Form: The Rhine-Ruhr (Essen-Düsseldorf)

    Rhine-Ruhr, or Essen-Düsseldorf, is among the world’s least recognized larger urban areas (Figure 1).  Germany does not designate urban areas according to the international standard, and for that reason the Rhine-Ruhr does not appear on the United Nations list of largest urban areas. Yet, in reality this contiguous urban area is Germany’s largest urban area, a position as it has held since at least the end of World War II. The Rhine-Ruhr is the third largest urban area in Western Europe, trailing only Paris and London. The area was one of the strongest early urban industrial areas in the 18th century and continued as a major manufacturing and coal mining center through the first half of the 20th century.

    An Early Polycentric Urban Area

    The Rhine Ruhr is unusual in not having evolved around a single core municipality. The Rhine Ruhr has multiple core municipalities, which have grown together to form a conurbation, the second largest in the world following Osaka –Kobe – Kyoto. But the Rhine Ruhr is probably the most polycentric urban region in the world, with a minimum of eight older, large municipalities now linked by urbanization. These include Essen and Düsseldorf, which were until recently the two largest municipalities. In addition there are Dortmund, Duisburg, Bochum, Wuppertal, Gelsenkirchen and Oberhausen. Each of these eight municipalities reached a population of 250,000 or more by 1961.

    Like nearly all prewar municipalities in the high income world that had not expanded their boundaries, each of these has lost population since 1961. By 2011, the combined population of these eight municipalities was under 3.4 million, a reduction of 700,000 (Table) from their 1961 total (a 17% loss).

    Table
    Larger Rhine-Ruhr Municipalities: Population 1961-2011
      1961 2011 Change %
    Bochum      441,000      362,000     (79,000) -17.9%
    Dortmund      645,000      571,000     (74,000) -11.5%
    Duisburg      504,000      488,000     (16,000) -3.2%
    Dusseldorf      705,000      586,000   (119,000) -16.9%
    Essen      730,000      566,000   (164,000) -22.5%
    Gelsenkirchen      384,000      259,000   (125,000) -32.6%
    Oberhausen      258,000      210,000     (48,000) -18.6%
    Wuppertal      422,000      343,000     (79,000) -18.7%
    Total   4,089,000   3,385,000   (704,000) -17.2%


    Data for the balance of the urban area and the broader Rhine-Ruhr region (Note 1) is not readily available for 1961. As a result, this analysis considers the Rhine-Ruhr region to consist of the Dusseldorf, Arnsberg and Münster subregions of the state (lander) of North Rhine-Westphalia, which had a combined population of 11.22 million in 2011, up only modestly from 11.06 million in 1987. The urban area has a population of approximately 6.5 million residents, covering a land area of approximate 950 square miles (2,450 square kilometers). The urban density is approximately 6,800 per square mile (2,650 per square kilometers), less than that of Los Angeles (7,000 per square mile or 2,700 per square kilometer) or Toronto (7,600 per square mile or 2,900 per square kilometer).

    Since 1987, the Rhine-Ruhr has added 161,000 residents, having gained 617,000 residents between 1987 and 2001, and losing 456,000 from 2001 to 2011. The eight older cities lost 170,000 residents from 1987 to 2011, while the balance of the urban area lost 42,000. The exurbs, outside the urban area have added 373,000 residents, and account for more than all of the modest growth since 1987. All three sectors lost population after 2001 (Figure 2).

    Slow Growth, Even for Germany

    The Rhine-Ruhr is located in the lander of North Rhine-Westphalia, which has the largest population in Germany. Its growth, however, has been glacial. Since 1961, the average annual growth rate of the lander was 0.2%. This is one third the growth rate of the other lander that constituted the former Federal Republic of Germany (West Germany).

    North Rhine-Westphalia’s performance is stellar compared to the lander of the former Democratic Republic of Germany (East Germany), which have fallen back to their 1961 population, having lost 10% of their residents since 1990. Germany itself lost more than 2 million people in the last decade, reflecting its well-below replacement fertility rate. Based upon this rate, Germany could lose more than the 5 million more residents projected by United Nations projectionsto 2050 (to 75 million).

    But even within the slow growth environment of North Rhine Westphalia, the  Rhine Ruhr region is falling behind as nearly all the growth has shifted elsewhere to the regions of the lander that surround other urban areas, Cologne (Köln), which includes the former West German capital of Bonn, and Aachen (which stretches into the Netherlands). Local authorities in the Ruhr Valley are forecasting a population loss of approximately 8 percent by 2030.

    The Setting

    The Rhine-Ruhr conurbation is organized around confluences of two rivers with the Rhine. The northern part of the urban area stretches from the west bank of the Rhine eastward along the Ruhr River Valley with the large municipality of Duisburg anchoring the West and Dortmund the East. The southern part of the urban area stretches along the Wupper River Valley starting at Düsseldorf and continuing eastward to south of Dortmund. The elevation at the two river junctions is less than 100 feet (40 meters). A transverse, low mountain range (Rhenish Massif) separates the northern and southern parts of the urban area (maximum elevation 800 feet or 300 meters), though much of the hilly area is urban.

    Transport

    Without a dominant, large center, the Rhine-Ruhr has a lower transit work trip market share – 18 percent – than would be expected for a European urban area of its size. This is well below the 30 percent share of Berlin and the approximately 35 percent shares of Madrid, Lisbon, and Stockholm, which are all smaller than the Rhine-Ruhr. Wuppertal is home to one of the icons of mass transit, the Wuppertal Monorail, which opened in 1901. The Monorail is suspended for much of its route above the Wupper River, with supports straddling the river (such a configuration would probably not be permitted to be constructed today in any high-income world metropolitan area because of environmental regulations).

    The Rhine-Ruhr’s polycentricity requires substantial reliance on its road system. The region is well served by an extensive freeway (autobahn) system consisting of at least four east-west routes and five north-south routes. Traffic congestion is worse than in most US urban areas, but the Rhine-Ruhr’s traffic flows better than in any metropolitan area of similar size in Europe, according to 2012 data from the INRIX Traffic Scorecard. The average peak hour delay is 14.8 percent compared to “free flow.” This is less than one-half the average delay in smaller Milan (30.2 percent) and well below Paris (27.8 percent) and London (26.1 percent). In 2005, the Rhine-Ruhr had the fifth highest rated freeway access among 30 surveyed international urban areas.

    Shrinking City

    Shrinking cities (where cities are defined as metropolitan areas or urban areas) have been unusual in the high income world (Pittsburgh and Liverpool are exceptions). Even as core municipalities have lost population, such as in Atlanta and Copenhagen, metropolitan areas have continued to grow. This is likely to change because of the severe national population declines forecast in a number of countries. The Rhine-Ruhr, and other similarly situated cities, will face serious challenges in retaining dynamic economies and delivering public services in the years to come for an aging population supported by a smaller work force.

    Wendell Cox is a Visiting Professor, Conservatoire National des Arts et Metiers, Paris and the author of “War on the Dream: How Anti-Sprawl Policy Threatens the Quality of Life.

    ———–

    Note 1: The entire Rhine-Ruhr and Cologne areas are considered by Germany to be the Rhine-Ruhr metropolitan area (ballungsräume). This article is limited to an area roughly conforming to the northern part of the ballungsräume. Eurostat defines a much smaller Düsseldorf-Ruhrgebiet metropolitan area that includes the Rhine-Ruhr urban area and most of the exurban area in this analysis. There is no international standard for the designation of metropolitan areas (labor markets).

    Note 2: INRIX classifies the Rhine-Ruhr as two areas (north and south). This is the population weighted congestion delay.

    Photo: Wuppertal Monorail

  • The Evolving Urban Form: Toronto

    Toronto is the largest city (metropolitan area) in Canada and its principal commercial center. However, this is a relatively recent development. Toronto displaced Montréal is Canada’s largest city during the 1960s. Since the 1971 census, when the two Metropolitan areas were nearly identical size, Toronto has added approximately 3 million people, while Montréal has added approximately 1,000,000 (Figure 1).

    This shift is exceptional within the high-income world over the past half century.  Toronto’s ascendancy was in large part precipitated by the move by Québec, in which Montréal is the largest city, to assert the primacy of the French language even though much of the Montréal business community was Anglophone. Many of these businesses, and some of their employees, decamped to Toronto.

    Metropolitan, Suburban and Core Population Growth: 1931-2011

    Toronto has grown very rapidly. In 1931, the metropolitan area had little more than 800,000 residents. About 80% of these (630,000) lived in the former city of Toronto. Since that time, nearly all of the growth in the Toronto metropolitan area has been in the suburbs (Figure 2). The area of the former city of Toronto (abolished in 1998 as a part of a six jurisdiction amalgamation, see Note on the Toronto Amalgamation) has added little more than 100,000 residents while the suburban areas have added approximately 4.7 million. By 2011, the metropolitan area had grown to a population of 5.5 million (Figure 3).


    In recent decades, Toronto has been among the fastest-growing larger metropolitan areas in the high income world.

    The Larger Region: The Golden Horseshoe

    The Toronto metropolitan area is at the core of a much larger region of urbanization that is referred to as the Golden Horseshoe. The Golden Horseshoe stretches in the shape of a horseshoe from the US border at Niagara Falls (St. Catharine’s metropolitan area) through the Hamilton metropolitan area to Toronto and on to the Oshawa and Peterborough metropolitan areas to the east. The Golden Horseshoe (which can be defined in various ways), also includes the Kitchener, Brantford, Guelph, and Barrie metropolitan areas.

    Overall the Golden Horseshoe registered a population of approximately 8.1 million in the 2011 census. Approximately 9% of the population lives in the former city of Toronto, 3% in the inner core federal electoral districts of Toronto – Centre and Trinity – Spadina and another 6% in the balance of the former city. Approximately 91% of the population is in the rest of the Golden Horseshoe (Figure 5).
    Like many other metropolitan areas, Toronto’s core has experienced a resurgence. Between 2006 and 2011, the inner core two districts added 16.2% to their population (Figure 6). This was a much stronger increase than occurred in the federal electoral districts that roughly correspond to the balance of the former city of Toronto, which grew 1.8%. The inner suburbs grew somewhat more strongly, at 4.2%. This rate of growth, barely one-quarter that of the inner core districts, was a more than 1.5 times the actual population increase of the inner core districts.


    The outer suburbs within the metropolitan area grew 13.7%. While the outer suburban growth rate was less than that of the inner core districts, the actual population increase was more than nine times as great. The balance of the Golden Horseshoe grew 4.7%, slightly more than the inner suburbs.

    Between 2006 and 2011 the overwhelming majority – 92 percent – of population growth was outside the core roughly corresponding to the former city of Toronto. This is less than the percentage of the total population represented by the inner core in the 2006 census. This is similar to the dynamics of metropolitan population growth in the United States, where inner core districts dominated central city growth, but produce little or none of the overall growth because of the stagnant or declining populations in the areas immediately outside the inner core.

    The Urban Area

    The Toronto urban area (called “population centre” by Statistics Canada) had a population of approximately 5.1 million according to the 2011 census. With a land area of 675 square miles (1,750 square kilometers), Toronto’s population density is 7,590 per square mile (2,930 per square kilometer). Toronto is the only major urban area in the New World (Australia, Canada, New Zealand and the United States) that is more dense than Los Angeles, which had 7,000 residents per square mile (2,700 per square kilometer), according to the 2010 census (Note on extended urban areas).

    Canada’s Largest Employment Center

    It is not surprising that Canada’s largest employment center should be in its largest metropolitan area. Surprisingly it is not downtown Toronto, but rather the Pearson International Airport area, which is shared between the municipalities of Mississauga, Brampton, and Toronto that is the top job center. This large area covers approximately 45 square miles (120 square kilometers), an area as large as either the municipalities of Vancouver or San Francisco. The center is largely made up of low rise transportation and distribution facilities that stretched far from the airport itself. Overall, the Pearson International Airport center has an employment level of more than 350,000.

    In contrast  downtown Toronto has  approximately 325,000 jobs crammed into  an area of 2.3 square miles (6 square kilometers). This highly concentrated area is, however, the focal point of transit’s largest commuting market in Canada.

    The contrast between these two employment markets vividly illustrates the substantial strengths of transit in serving highly concentrated employment centers, like downtown Toronto, and its virtual inability to provide automobile competitive service in more highly dispersed employment centers (see Note on Transit and Employment Concentration)

    Overall, only 13 percent of the employment in the metropolitan area (as opposed to the Golden Horseshoe) is in downtown Toronto.

    As Goes Toronto, So Goes Canada

    Toronto and the Golden Horseshoe are particularly important to Canada. The Golden Horseshoe has more than one quarter of Canada’s population. This is an unusually high proportion of a nation’s population for one highly urbanized region and boasts an even larger share of its economic output. By comparison, the largest metropolitan region in the United States, New York, represents barely 7% of the nation’s population. In many ways, Canada’s prosperity, which has been impressive in recent years, depends on the success of Toronto and the Golden Horseshoe.

    See Also: A Toronto Condo Bubble?

    ————–

    Note on the Toronto Amalgamation: The former city of Toronto and five other municipal jurisdictions were amalgamated under an act of the Ontario government in 1998. The amalgamation was promoted by the government on efficiency grounds, claiming that hundreds of millions annually would be saved. I was hired by the former city to assist it in an effort to defeat the amalgamation proposal. Our side argued that the cost savings would not occur because of the necessity of harmonizing (the leveling up) labor costs and service levels. Despite advisory referendums that receive a minimum of a 70% no vote, the amalgamation went forward.

    The amalgamation is still a controversial subject. The financial argument appears to have been resolved in the favor of the position of the former city. A major Toronto business organization, the Toronto City Summit Alliance reported “The amalgamation of the City of Toronto has not produced the overall cost savings that were projected. Although there have been savings from staff reductions, the harmonization of wages and service levels has resulted in higher costs for the new City. We will all continue to feel these higher costs in the future.” My commentary  in the National Post on the tenth anniversary of the amalgamation summarized the experience.

    In a spirited debate in 2001 at Ryerson University, in downtown Toronto with a former Toronto transit commission official, my opponent and I agreed on one issue, that the amalgamation of Toronto had been a mistake.

    Note on Extended Urban Areas: In fact, the continuous urbanization of Toronto extends further, to the west into the Hamilton metropolitan area and to the east into the Oshawa metropolitan area. If these areas are combined into a single urban area, the population density falls to 7000 per square mile (2,700 per square kilometer). Even with this extension, Toronto would be more dense than an extended Los Angeles urban area (extending to include Mission Viejo and the western Inland Empire, at 6,200 per square mile or 2,400 per square kilometer (These larger urban area definitions are used in Demographia World Urban Areas)).

    Note on Transit and Employment Concentration: It is virtually impossible for employees throughout the metropolitan area to reach the airport area on transit that is time-competitive with the automobile. This disadvantage is not easily solved. If grade-separated rapid transit lines (such as a subway or busway) were built to the area, only a small percentage of the jobs would be within walking distance (within one quarter mile or 400 metres). Walks of up to 5 miles (8 kilometers) could be necessary from stations to employment locations.  This compares with the virtually 100 per cent of downtown jobs that are accessible by walking from subway and commuter rail (Go Transit) stations (See Improving the Competitiveness of Metropolitan Areas)

    Wendell Cox is a Visiting Professor, Conservatoire National des Arts et Metiers, Paris and the author of “War on the Dream: How Anti-Sprawl Policy Threatens the Quality of Life.

    Photograph: Google Earth Image of the Pearson Airport employment area (Canada’s largest employment area)

  • The Evolving Urban Form: Nanjing

    Nanjing is one of China’s most historic cities. It is one of the four great ancient capitals of the nation, along with Beijing, Chang’an (Xi’an) and Luoyang. Its name means southern capital (Nan=south, Jing=capital), while the name of the current capital, Beijing means Northern capital. Nanjing was the national capital at various times, however generally for periods of no more than a few decades. Upon the establishment of the People’s Republic of China, the national capital was moved permanently to Beijing, where it had been for most of the previous five centuries.

    Nanjing is the capital of Jiangsu, which is China’s fifth most populous province. It has twice as many people as California (80 million) and a land area the size of Virginia. Nanjing is also one of the "four furnaces" of China, a title derived from its humid summers. The others include Wuhan (Hubei), Chongqing and sometimes Changsha (Hunan) or Nanchang (Jiangxi).

    Nanjing is reputed to have the world’s longest, though not the oldest surviving city wall, which was built in the 14th century (Photo).  The city is also the site of the second bridge ever built over the lower Yangtze River (Photo), opened in 1968 (the first was at Wuhan). The bridge carries both automobiles and trains. There are now five Yangtze River crossings in Nanjing.


    Nanjing City Wall


    Yangtze River (toward suburban Pukou qu)

    Yangtze Delta Megalopolis

    Nanjing is a big city in one of the world’s great urban mega-regions. It serves as the Western anchor of the Yangtze Delta region, a megalopolis (string of metropolitan areas) which consists of a string of sometimes adjacent urban areas, stretching through Suzhou to Shanghai and Hangzhou to Ningbo, with a population of approximately 60 million (plus additional millions in rural areas, outside the urban areas). This is at least a third more than live in the longer Washington-New York-Boston corridor, the original megalopolis.

    A trip through the Yangtze Delta corridor demonstrates only comparatively short sections that are not urbanized. One of the longest is the 10 mile (16 kilometer) section from the eastern urban fringe of Nanjing to the western fringe of Zhenjiang (location of the Pearl S. Buck Museum). Further, Nanjing’s southern fringe now meets that of Maanshan, in Anhui province (not a part of the Yangzte Delta).

    The Nanjing Urban Area

    Nanjing has grown rapidly. In 1950, the urban area population was approximately 1.0 million (see "Definition of Terms Used in the Evolving Urban Form Series"), a population some sources say was exceeded in the 15th century. The urban area has now reached 5.8 million. Nanjing is the world’s 59th largest urban area and the 13th largest in China. It is projected to have a population of more than 8 million by 2025 (Figure 1). The Nanjing urban area (Figure 2) covers approximately 440 square miles (1,140 square kilometers). This results in a population density of approximately 13,100 per square mile (5,100 per square kilometer).

    Consistent with the general principle that cities become less dense as they get larger, Nanjing’s population density has fallen significantly over the last 60 years, even as its geographical size has more than quintupled (Figure 3). Older historic land area data is not readily available, but if it is assumed that virtually all of Nanjing’s United Nations reported 1,000,000 population in 1950 lived within the 17 square mile (44 square kilometer) periphery of the city walls, the population density would have been more than 60,000 per square mile (more than 23,000 per square kilometer). The area within the city walls is indicated by green shading in the urban area representation (Figure 2).

    By 1970, the population had increased to over 1.4 million and if this population was contained inside the city walls, the population density would have approached 90,000 per square mile (35,000 per square kilometer).Indicating a similar density, the 2010 population of the most densely populated district (Golou qu), much of which is located inside the Wall 86,000 per square mile (33,000 per square kilometer).

    The Nanjing Metropolitan Area

    Nanjing is a prefecture (regional municipality) with 11 districts, of which nine are in the metropolitan area (Note 1). The core of Nanjing continues to grow, from 2.5 million in 2000 to 3.4 million in 2010, an increase of 34 percent (Note 2). But in comparison, the suburban districts grew from 2.3 million to 3.8 million, an increase of 64 percent (Figure 4). For the first time, suburban Nanjing has a larger population than the urban core. The suburbs accounted for 64 percent of the metropolitan area’s growth over the past decade, compared to 36 percent in the urban core (Figure 5).

    Pukou, a suburban district across the Yangtze River from the historic location of Nanjing, was by far the fastest growing part of the metropolitan over the past decade. By 2010, the population had risen to 710,000 from 225,000 in 2000, when it was largely rural. Two metro lines are planned to connect Pukou to the rest of the urban area, which is likely to encourage further suburban development.

    The Nanjing Economy

    Nanjing, like other cities in China, has been a beneficiary of China’s unprecedented poverty reduction, first launched by the economic reforms started by Deng Xiao Ping in the early 1980s. It is estimated that in 2012, Nanjing’s gross domestic product per capita (purchasing power parity adjusted) was approximately $25,000 annually. Nanjing’s GDP per capita is compared to that of other Chinese metropolitan areas and examples from the developed world in Table 6 (Note 3).

    A Strong Future

    Nanjing seems likely to continue its strong growth. This and Nanjing’s geographic location in one of the most vibrant mega-regions in the world should guarantee a continuing and strong contribution not only to the development of the Yangtze Delta megalopolis, but also to economic progress of China as a whole.

    Wendell Cox is a Visiting Professor, Conservatoire National des Arts et Metiers, Paris and the author of “War on the Dream: How Anti-Sprawl Policy Threatens the Quality of Life.

    —-

    Note 1: The districts (qu and counties) designated as urban by Nanjing prefecture (regional municipality) authorities Entire peripheral districts are designated when they begin to receive urban development. The "urban" designation in China, however, does not indicate continuous urbanization and is thus not an urban area in the internationally defined sense. The Chinese urban definition is thus similar to a metropolitan area (labor market).

    Note 2: The urban core includes the following districts (qu): Xuanwu, Biaxia, Qinhaui and Gulou.

    Note 3:  Estimated the Brookings Institution Global Metro Monitor, and other sources. See "World’s Most Affluent Metropolitan Areas: 2012" including the "Note."

    Top Photo: Zifeng Tower (all photos by author)