Tag: Evolving Urban Form: Development Profiles of World Urban Areas

  • The Evolving Urban Form: Athens

    Around the fifth century BCE, Athens may have been the most important city in the West. Like China’s Chang’an (modern Xi’an), the "on and off" capital of China, Athens has experienced many severe "ups and downs" throughout its remarkable history. At its ancient peak, Athens is estimated to have had more than 300,000 residents (historic population estimates vary greatly). At least one estimate indicates that Athens may have fallen to a population of under 5,000 by the middle 19th century. The city, now having evolved into the modern manifestation of the metropolitan area (Attica region), peaked at 3.9 million in the early 2000s, but its population has begun to drop again.

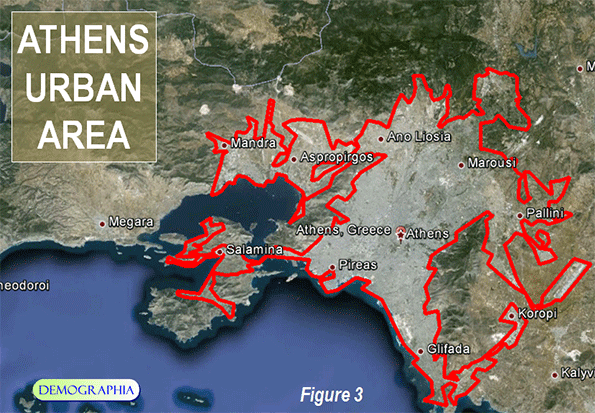
    Athens is the capital of Greece and located at the south end of the Attica peninsula, on the Aegean Sea. The core municipality of Athens is located approximately 5 miles (8 kilometers) from the historic port of Piraeus, from which ferries operate to the Greek Islands.

    Metropolitan Dispersion

    Like virtually all of the world’s metropolitan areas, population growth has been concentrated in the suburbs and exurbs for decades.

    The Athens municipality (the historic core city) peaked at 885,000 in 1981. At a population density of nearly 60,000 per square mile (23,000 per square kilometer), Athens once stood among the most dense municipalities in the world. However, the Athens municipality since has declined, with population losses in each of the three subsequent decades. Between 2001 and 2011, the population fell 125,000 to 664,000, a decline of 16%. The Athens municipality is still dense, however, at 44,000 per square mile (17,000 per square kilometer). The rest of the urban organism, as is usually the case, is considerably less so.


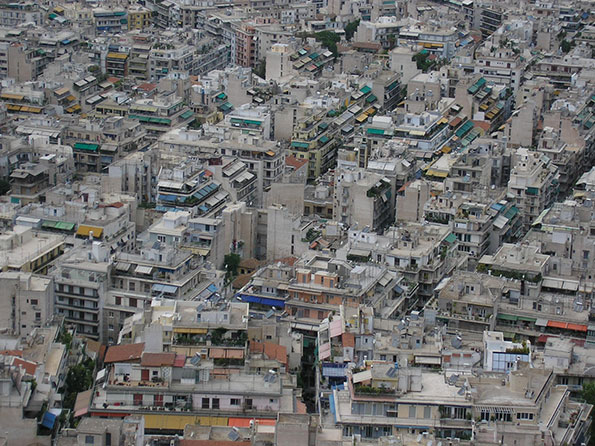
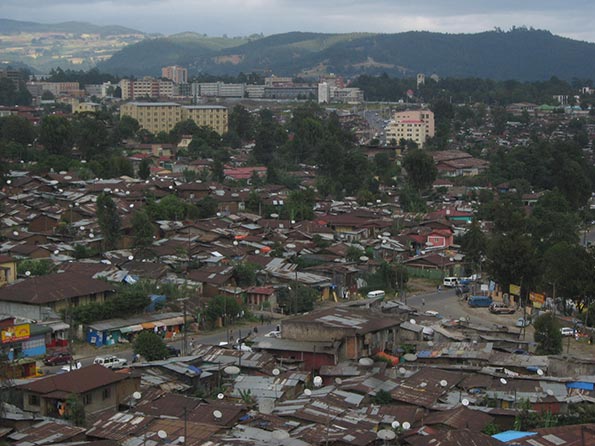
    Photo: Athens Core Density

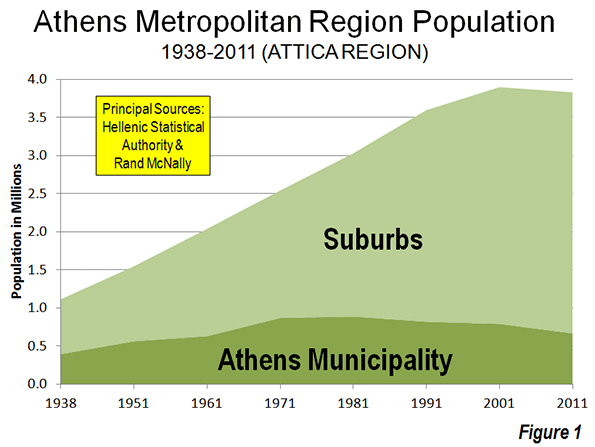
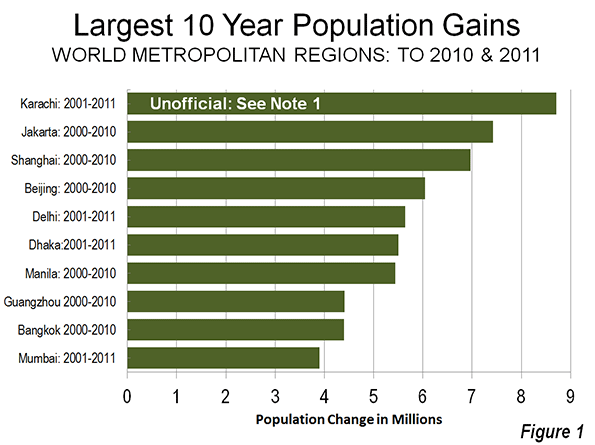
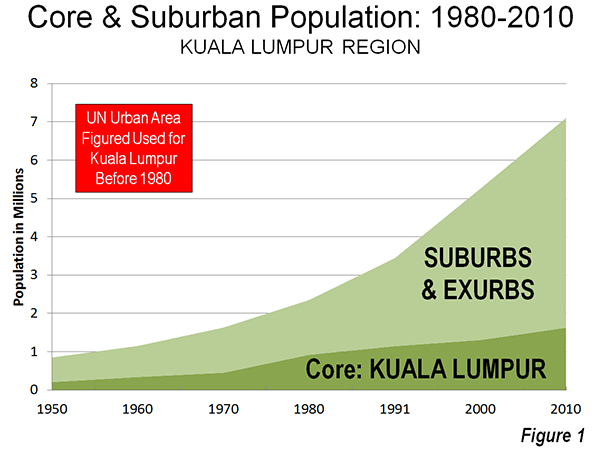
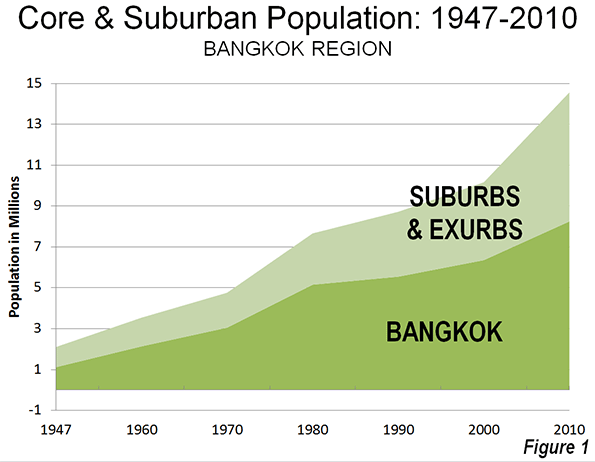
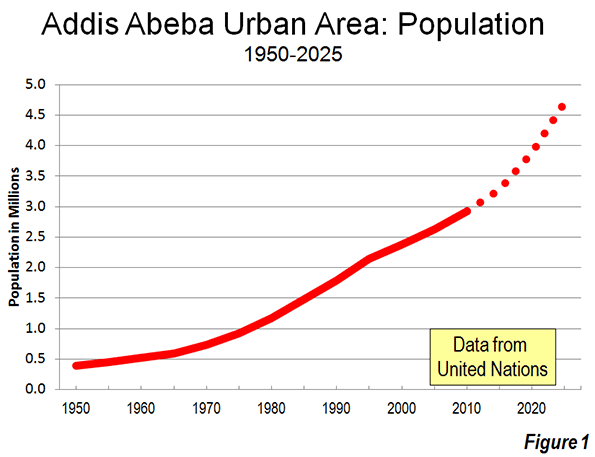
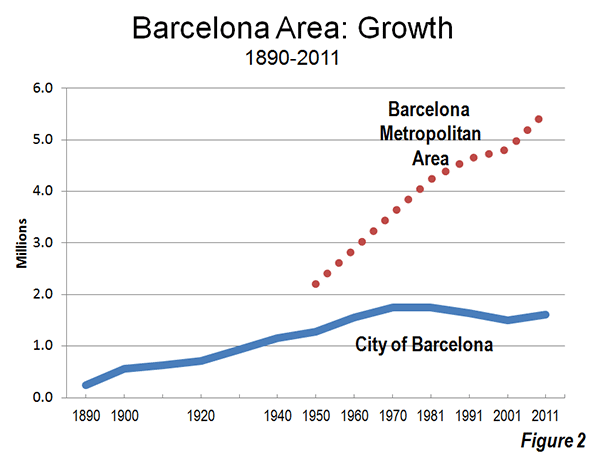
    Since 1951, suburban and exurban Athens (see The Evolving Urban Form Series Definitions) has accounted for 95% of the growth in the metropolitan region, adding 2.2 million new residents, compared to approximately 100,000 for the Athens municipality. Since 1971, all of the population growth has been in the suburbs and exurbs (Figure 1).

    However, over the last decade, population growth has dropped across the entire Athens metropolitan region. Certainly, the low Greek fertility rate is a factor (see The Rise of Post-Familialism: Humanity’s Future?). Greece’s total fertility rate (average number of children per women of child bearing age) is approximately 1.5, according to Eurostat, well below the replacement rate of 2.1 not to mention the 2.3 Greek figure in the late 1970s. More recently, it is likely that the Greek fiscal crisis has contributed to an even lower rate of increase by reducing the previously flow of international migration as well as discouraging family formation among native Greeks.

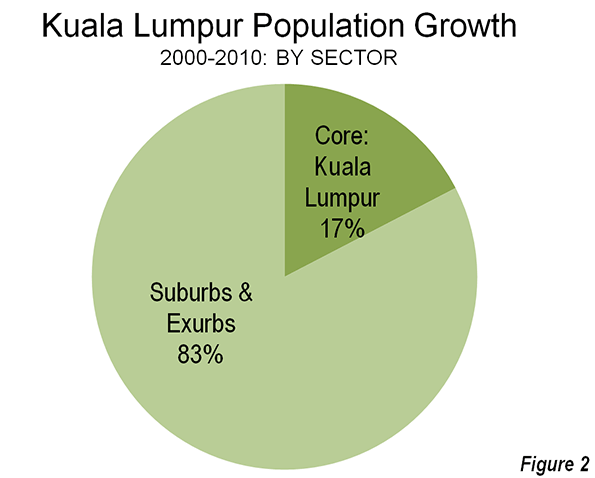
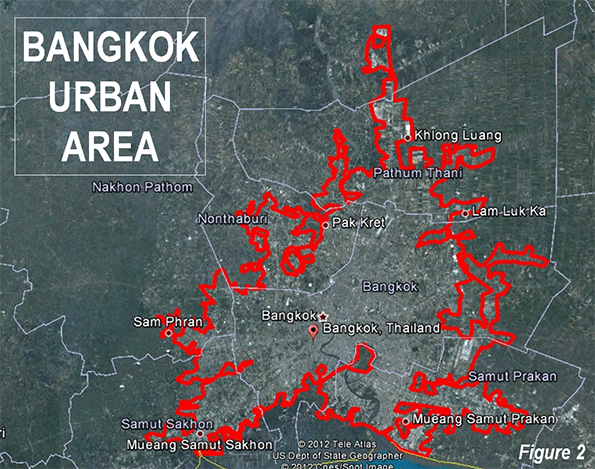
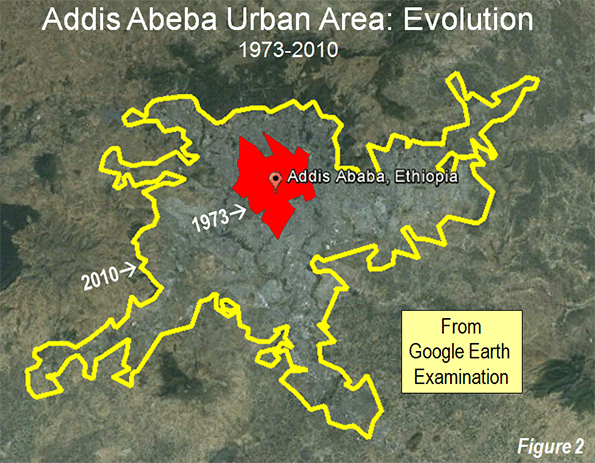
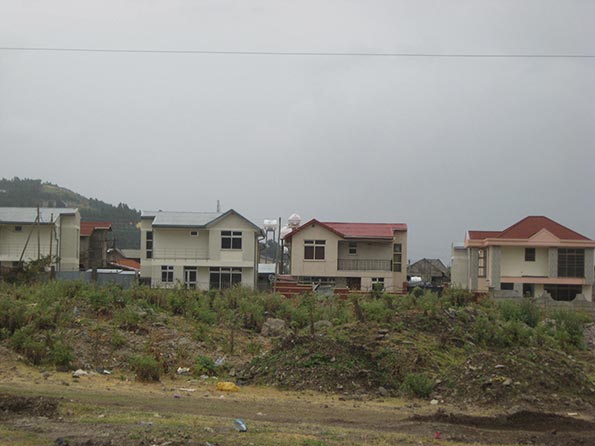
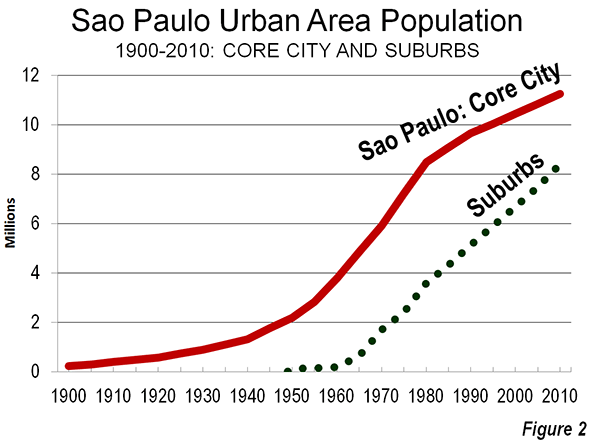
    Athens growth slowed dramatically well before the financial crisis. Between 1991 and 2001, the Athens metropolitan region added approximately 300,000 new residents. But  between 2001 and 2011, the metropolitan region lost 67,000 residents. However, the suburbs and exurbs gained marginally, adding 58,000 residents, partially offsetting the loss in the Athens municipality (Figure 2). Even so, the suburban population increase was miniscule compared to the 330,000 gain of the previous decade (photo: North Suburban Athens).


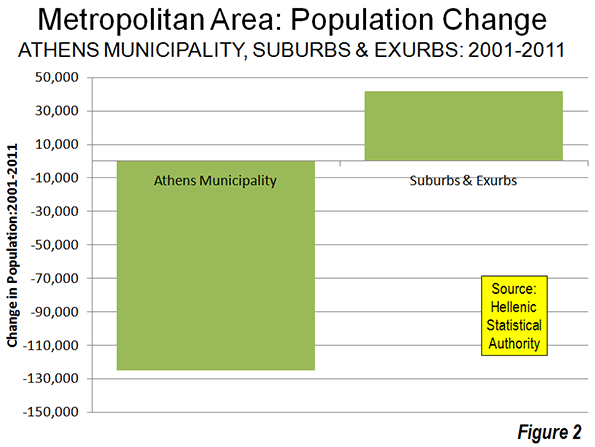
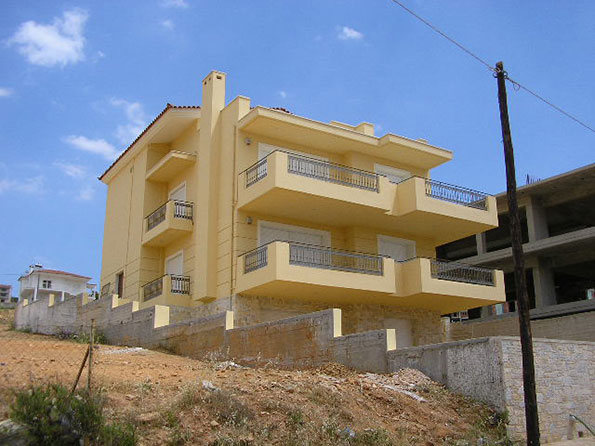
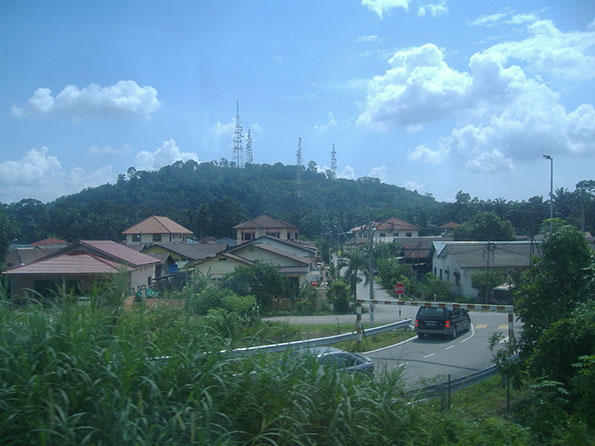
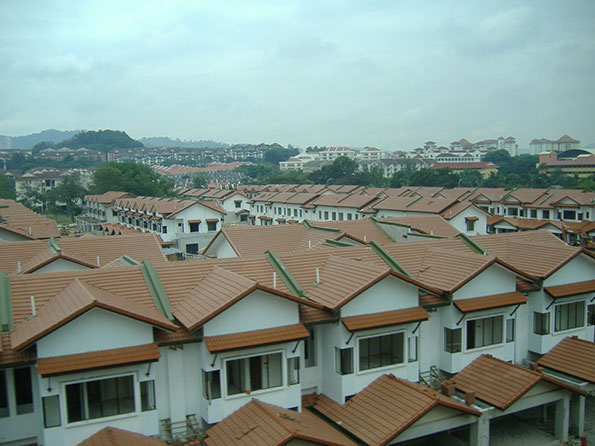
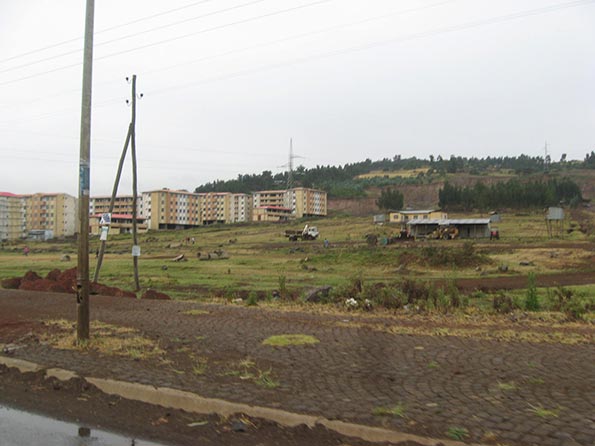
    Photo: North Suburban Athens

    The Urban Area

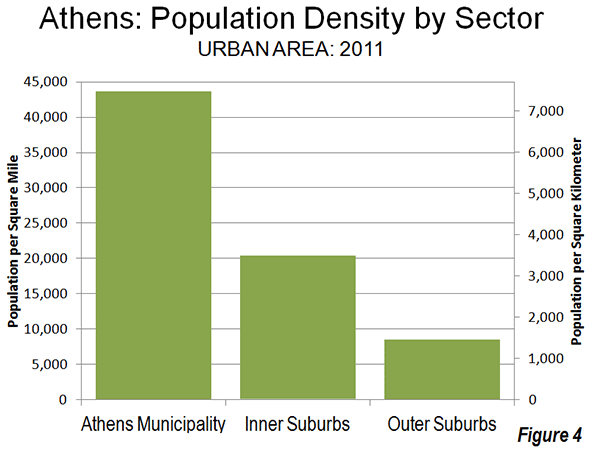
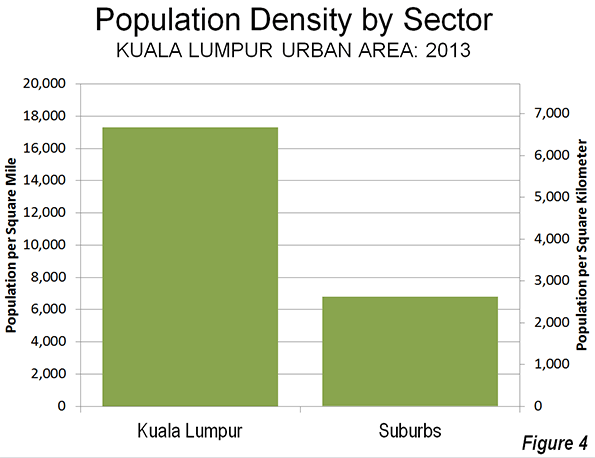
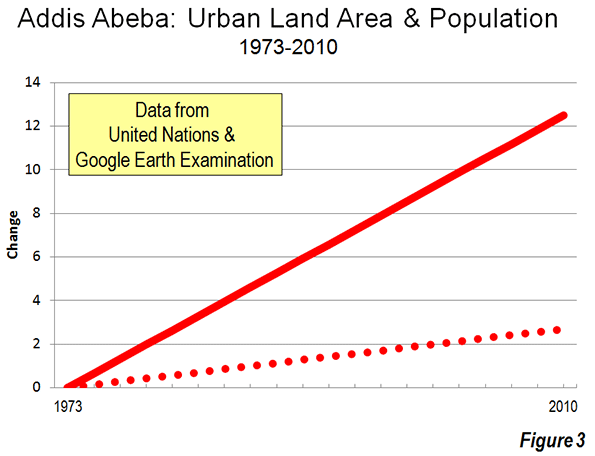
    Even with its slow and even negative growth, the  Athens urban area remains  among the most dense in the developed world (Figure 3). No major urban area in Western Europe, Japan or the New World (Australia, Canada, New Zealand and the United States) is as dense. The 2013 edition of Demographia World Urban Areasindicates that the Athens urban area has a population of 3.5 million (Note), living in a land area of 225 square miles (580 square kilometers), for a density of 15,600 per square mile (6,000 per square kilometer). This places Athens slightly ahead of London (15,300 per square mile or 5,900 per square kilometer), about double the density of Toronto or Los Angeles and more than four times that of Portland.

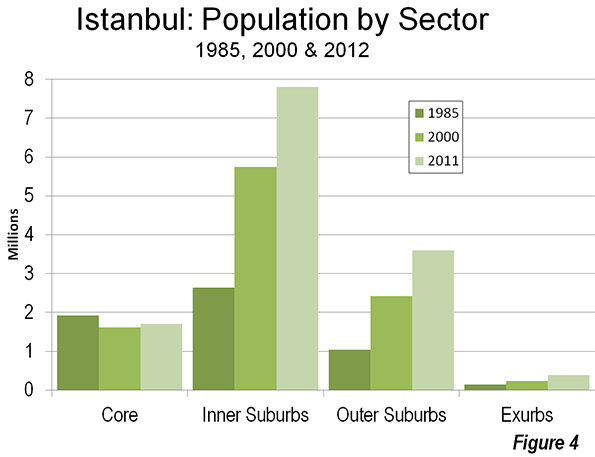
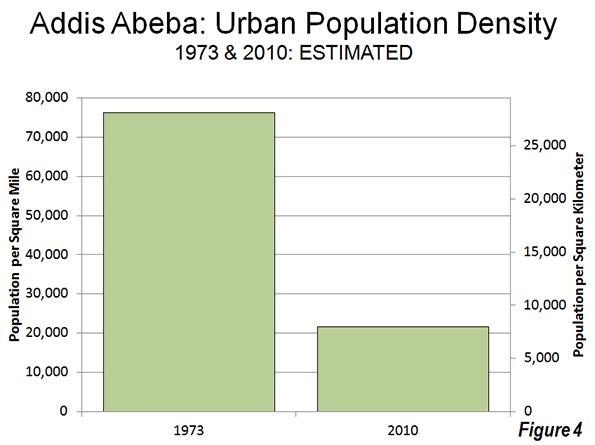
    As is typical around the world, the urban area of Athens exhibits a generally declining density from the core to the urban fringe. From the 44,000 per square mile (17,000 per square kilometer) Athens municipality density, the inner suburbs drop to approximately 20,000 per square mile (7,700 per square kilometer). This is still a high population density for inner suburbs, reflecting the fact that much of the area was developed before the broad achievement of automobile ownership (a similar situation is obvious in the inner ring suburbs of Paris). The outer ring suburbs have been more shaped by the automobile, yet have a density of 8,500 per square mile (3,300 per square kilometer), which still  is high by Western European standards (Figure 4).

    Affluence

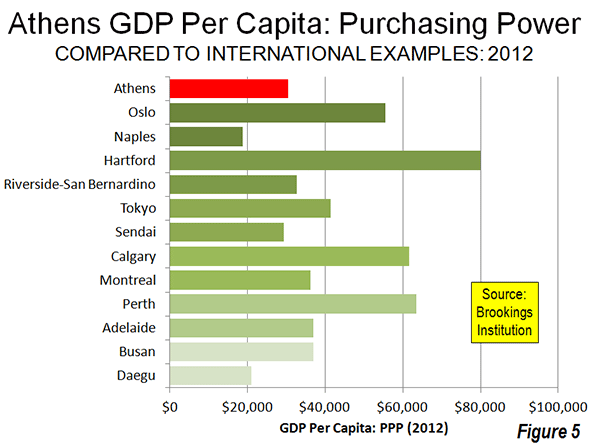
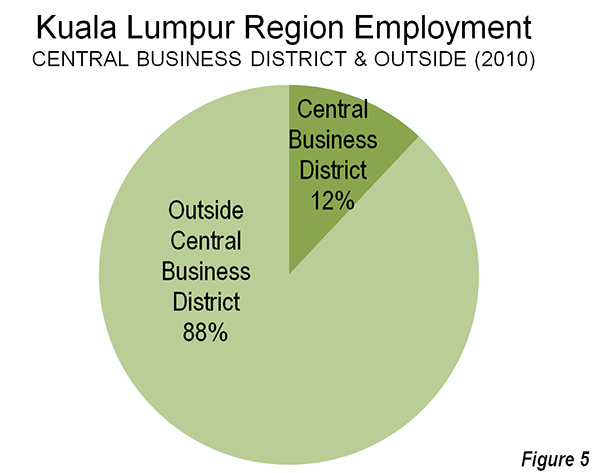
    Athens has below average affluence among the metropolitan regions of the developed world. According to data in the Brookings Institution Global Metro-Monitor, Athens had a gross domestic product, purchasing power parity adjusted (GDP-PPP) per capita of $30,500 in 2012. This trails the most affluent metropolitan regions around the more developed world. It is less than one-half the gross domestic product per capita of Hartford (US), the world’s most affluent major urban area ($79,900). The Athens GDP-PPP is approximately one-half that of regional leaders Perth (Australia) at $63,400, Calgary ($61,100), Tokyo ($41,400) and Busan (South Korea) at $36.900. Athens also ranks well below Western Europe’s most affluent metropolitan region, Oslo, at $55,500. Athens is also less affluent than the least major metropolitan areas with the lowest GDP-PPPs per capita in Australia (Adelaide), Canada (Montréal), and the United States (Riverside-San Bernardino). However, Athens has a higher GDP-PPP per capita than Sendai (Japan), Daegu (South Korea) and Naples (Figure 5), the least affluent major metropolitan areas in their respective geographies.

    Low Fertility, Declining Migration and An Uncertain Future

    Even as the national fertility rate dropped in the late 20th century, Athens continued to grow strongly due largely to international migration, especially from Albania. During the 1990s, virtually all of the population growth in Greece was the result of immigration, as the natural components of growth (births minus deaths) fell into decline. During the 2000s, immigration declined so severely that the nation lost population, most of it in the Athens metropolitan region (with the Athens municipality’s loss exceeding the nation’s) where the foreign born population has concentrated. Much of the decline in international migration resulted from the severe economic crisis.

    Athens typically exhibits the principal function of cities in civilization. When cities compete well by facilitating economic aspiration, they grow. When they do not, cities stagnate or fall into decline. For Athens, stagnation or decline seems the likely scenario in the foreseeable future.   

    Wendell Cox is a Visiting Professor, Conservatoire National des Arts et Metiers, Paris and the author of “War on the Dream: How Anti-Sprawl Policy Threatens the Quality of Life.

    —–

    Note: The difference between the metropolitan area and urban area population is the residents living in exurban areas (outside the urban area, but within the metropolitan area).

    Photo: The Acropolis (all photos by author)

  • Dispersion in the World’s Largest Urban Areas

    No decade in history has experienced such an increase in urban population as the last. From Tokyo-Yokohama, the world’s largest urban area (population: 37 million) to Godegård, Sweden, which may be the smallest (population: 200), urban areas added 700 million people between 2000 and 2010.

    Nearly one in 10 of the world’s new urban residents were in the fastest growing metropolitan regions (see: Definition of Terms used in "The Evolving Urban Form" Series), which added nearly 60 million residents. They ranged from a an estimated increase of more than 8.5 people in Karachi (Note 1) to 3.9 million people in Mumbai (Figure 1). The average population growth in these 10 metropolitan regions was 6 million, approximately the population of Dallas-Fort Worth or Toronto, which were fast-growers on their own in comparison to other high income world cities.

    By comparison, the largest growth over any single decade over the past half century in US metropolitan areas has been less than one half of the 6 million average: 2.43 million in New York (1920s) and 2.37 million in Los Angeles (1950s). Only Tokyo-Yokohama (1960s) and Shenzhen (1990s) have added more than 5 million people in a single decade before the last decade.

    Growth has been overwhelmingly concentrated outside the urban cores (Note 2) in these 10 fastest growing metropolitan region. Excluding Karachi (for which sufficient data is unavailable), approximately 85 percent of the growth was outside the urban cores (A 42 million increase in the suburbs and 8 million in the urban cores).

    Dispersion in World Megacities

    This is consistent with the findings of The Evolving Urban Form series, which is now two years old. These analyses have generally demonstrated that urban spatial expansion (pejoratively called "sprawl") is world-wide and contrary to some perceptions, not limited to the United States. Cities expand geographically as they add population, though this organic tendency is sometimes contained by urban planning. Peripheral growth is virtually always at lower densities than in urban cores, which means that as cities grow they tend to become less dense (Note 3).

    This process ironically is sometimes accelerated by planning decision-making. London‘s greenbelt —which banned the extension of housing into the near periphery of the city — has result in even greater sprawl to far outside the principal urban area. This trend since World War II, has forced commuters to travel longer times and distances to the urban core (All of metropolitan London’s growth has been suburban for 100 years, with a loss of 1.8 million in inner London, while the suburbs and exurbs grew by 10.5 million).

    The Evolving Urban Form has now covered 23 of the world’s 28 megacities (Note 4). As the Table indicates, population growth has been strongly oriented away from the urban cores and toward more suburban areas

    Table
    Summary of Megacity Population Trends
    URBAN AREA CORRESPONDING METROPOLITAN REGION
    Bangkok 10 Years: 55% of growth outside core municipality
    Beijing 10 Years: 99% of growth outside core districts
    Buenos Aires 60 Years: 100%+ of growth outside core municipality
    Cairo 16 Years: 2/3 of growth outside core governate
    Delhi 10 Years: 90% of growth outside core districts
    Dhaka 10 Years: 50% of growth outside core municipalities
    Guangzhou-Foshan 10 Years: 75%+ of growth outside core districts
    Istanbul 25 Years: 100%+ growth outside core districts
    Jakarta 20 Years: 85% of growth outside core jurisdiction
    Kolkata 20 Years: 95% of growth outside core municipality
    Los Angeles 60 Years: 85% growth outside core municipality
    Manila 60 Years: 95% growth outside core municipality
    Mexico City 60 Years: 100%+ of growth outside core districts
    Moscow 8 Years: 95% of growth outside core districts
    Mumbai 50 Years: 98% of growth outside core districts
    New York 60 Years: 95% growth outside core municipality
    Osaka-Kobe-Kyoto 50 Years: 95% of growth outside core municipalities
    Rio de Janeiro 10 Years: 95% of growth outside core districts
    Sao Paulo 20 Years: 2/3 of growth outside core municipality
    Seoul 20 Years: 115%+ of growth outside core municipality
    Shanghai 10 Years: 99% of growth outside core districts
    Shenzhen 10 Years: 70%+ of growth outside core districts
    Tokyo 50 Years: 95% of growth outside core municipalities


    In US examples, New York and Los Angeles, 95 percent and 85 percent of growth respectively of their corresponding metropolitan region growth has occurred outside the core municipalities since 1950. But these US regions are joined by middle income Buenos Aires and Mexico City where all growth has been outside urban core since 1950. In lower income Manila, 95 percent of the growth has been outside the urban core since 1950.

    The world’s largest metropolitan region, Tokyo-Yokohama, has experienced a virtual monopoly of suburban growth over the past 50 years, as has Japan’s second largest metropolitan region, Osaka-Kobe-Kyoto.

    Over the past quarter century, all of Istanbul‘s growth has been outside the urban core. The urban expansion has been going on for much longer, as is illustrated over the past 60 years (Figure 2). Cairo‘s urban expansion is similarly substantial (Figure 3). In one of the developing world’s poorer megacities, nearly all population growth in the Mumbai region has been outside the urban core for 50 years

    For the last 20 years, more than 115 percent of the growth in the Seoul-Incheon metropolitan region has been outside the core city. In the world’s second largest urban area, Jakarta (Jabotabek), growth is also strongly suburban, accounting for 85 percent of growth over the past two decades. In Kolkata suburban growth has been 95 percent over the same two decades.

    The same tendency is evident in the other megacities. Over the past decade or two, nearly all population growth in China’s four megacities (Shanghai, Beijing, Guangzhou-Foshan and Shenzhen), Delhi and Rio de Janeiro has been outside the urban cores.

    Dispersion in Other Large Urban Areas

    The Evolving Urban Form has also examined smaller urban areas. The same pattern of dispersal is evident there as well even in traditionally compact cities. Zürich, for example has had all of its growth outside the core city since 1950. All of the growth in Barcelona and Milan has been outside the core cities for 40 years. Even high density Hong Kong has experienced all of its growth outside the urban core for three decades. Low income Addis Abeba indicates a pattern of urban expansion is not unlike that of Istanbul or Cairo (Figure 4). In megacity wannabe Chicago (1.4 million short), 125 percent of growth since 1950 has been outside the core; this number reflects that the central city has been shrinking even as the periphery expands. Even in fast-growing Dallas-Fort Worth, more than 80 percent of population growth over the past 60 years has been outside the city of Dallas (which itself is largely suburban in form, see Suburbanized Core Cities).

    The one notable exception to the peripheral growth model is Quanzhou (Fujian, China), which is developing under an even more dispersed pattern, described by Yu Zhu, Xinhua Qi, Huaiyou Shao and Kaijing He at Fujian Normal University. Typically, urban areas expand from an urban core on the periphery. Quanzhou is experiencing "in situ" urbanization, the spontaneous conversion of rural areas into urban development that does not expand from the urban core. The result is a sparsely developed urban area (especially for China), with plenty of land for potential infill development in the future.

    The Future of Urbanization

    It is likely that urban areas will continue to expand as they grow larger, consistent with what appears to be both economic pressures and market preferences for lower cost, more spacious housing. For example, fast growing Ho Chi Minh City is expected to see virtually all of its population increase over the next 15 years outside the urban core. Not surprisingly Shlomo Angel, Jason Parent, Daniel Civco, Alexander Blei and David Potere at the Lincoln Land Institute project significant expansions of urban land by mid-century. And, Angel, in his Planet of Cities, notes how important it is to allow the expansion, in order to improve the quality of life for the majority of people, who deserve to live as well as people in the West.

    —-

    Note 1: Incomplete results of the 2011 Pakistan census have been reported by media in both Pakistan and India. However, no official announcement of the results has been identified from Pakistan census authorities. The Karachi population increase would be the largest metropolitan region 10 year rate of increase in history.

    Note 2: Urban cores are generally the core historical jurisdiction, which often contains substantial non-core areas, even outside the United States. Core district data within these jurisdictions is used where available. Thus, this estimate over-states the urban core population increase.

    Note 3: The driving factor in declining densities is principally transportation advances. Substantial urban expansion began with the coming of mass transit in the 19th century. However an even greater expansion began occurring with the availability of the automobile. As automobile orientation replaces transit orientation, densities tend to decline until it nearly all travel is by automobile. Even among automobile oriented urban areas, there can be large differences in urban densities. For example, transit’s market share in the Boston urban area is substantially greater than in the Los Angeles urban area. Yet the Los Angeles urban area has a population density of 7000 per square mile (2,700 per square kilometer), more than three times that of the Boston urban area, at 220 per square mile (850 per square kilometer). The difference is that in Los Angeles residential development has largely occurred densities determined by the market, with single-family housing being typically built on 1/4 acre lots. In Boston, suburban lot sizes were forced higher by urban planning requirements for large lot zoning. The result is much greater land consumption than would have occurred if people’s preferences (the market) had driven development. If Los Angeles had been developed at the same low density as Boston, its urban land area would equal that of the state of Connecticut.

    Note 4: Megacities are urban areas with more than 10 million population. Five megacities remain to be described in The Evolving Urban Form (Karachi, Lagos, Nagoya, Paris and Teheran). Corresponding metropolitan regions are used for this analysis, since historic urban area data (areas of continuous urban development) is not available for most nations.

    Wendell Cox is a Visiting Professor, Conservatoire National des Arts et Metiers, Paris and the author of “War on the Dream: How Anti-Sprawl Policy Threatens the Quality of Life.”

    —–

    Photo: New detached housing, suburban Tokyo-Yokohama (by author).

  • The Evolving Urban Form: Rio de Janeiro

    Rio de Janeiro was the capital of Brazil from before independence from Portugal was declared in 1822. That all changed in 1960, when the capital moved to the modern planned city of Brasilia, more than 500 miles (800 kilometers) inland. The move, however, did nothing to slow Rio de Janeiro’s growth, as the metropolitan area (as designated by Brazil’s census agency, the Instituto Brasileiro de Geografia e Estatística),  added 7 million people – a 150 percent increase in population – over the ensuing 60 years

    The placement of the federal government in Brasilia has had positive economic impacts on the interior, but it did not make Rio de Janeiro less crowded (factor Indonesian officials should note as they consider moving the capital from Jakarta,).

    The Urban Area

    However, it is clear that Rio de Janeiro has fallen behind even faster growing Sao Paulo, which has become one of the world’s 10 largest urban areas (with a population of approximately 20.5 million in 2013). Nonetheless, as an urban area with a 2013 population of 11.6 million (Figure 1) Rio de Janeiro still ranks among the world’s megacities (urban areas over 10 million).

    The urban area covers 720 square miles (1,870 square kilometers),   a population density of 16,100 per square mile (6,200 per square kilometer). This is similar to the density of Sao Paulo, 20 percent above that of Buenos Aires, but 35 percent less dense than the western hemisphere’s most dense megacity, Mexico City. In contrast, Rio is more than twice as dense as the most dense Canadian and US urban areas, Toronto and Los Angeles, but less than 1/6th the density of Dhaka, the world’s most dense megacity.

    Metropolitan Dispersion

    As this series on world urbanization has shown, cities tend to become less dense as they grow (at least until they reach predominantly automobile oriented densities). This can be seen in Rio de Janeiro as well. Since the 2000 census, virtually all of the population growth has been in less dense areas. The inner core (the districts or bairros of Zona Centro), for example, accounted for two percent of the urban area’s growth over the past decade. The larger, inner core (around the urban core) accounted for three percent of the growth (principally the Zona Sul and some additional bairros adjacent to Zona Cento and Zona Sul).

    A Suburbanized Core City: Like many core municipalities around the world, Rio de Janeiro contains large expanses of suburbanization (Photo: Rio’s In-City Suburbs). The suburban portions of the municipality accounted for 43 percent of the growth, while the outside-the-municipality suburbs and exurbs (inside the metropolitan area, but outside the urban area) represented 53 percent of the growth (Figure 2). Most of the growth outside the municipality of Rio de Janeiro has been across Guanabara Bay, with the large suburbs of Niteroi and São Gonçalo, and to the north, where there are a number of large municipalities (such as Duque de Caxias and Nova Iguaçu).


    Photo: Rio’s In-City Suburbs

    This preponderance of growth outside the dense core has been developing since 1950. The municipality of Rio de Janeiro has added 3.9 million residents since 1950, while the suburbs and exurbs have added 4.8 million. The municipality continues to have more than half of the population (53 percent), down from 76 percent in 1950 (Figure 3). However, the retention of this strong share of the population has been made possible only by the large amount of land available for suburban development within the municipality (this is similar to the experience of other suburbanized core cities, such as San Jose, Edmonton, Phoenix, Denver, and Kansas City).

    The Physical Setting

    Rio de Janeiro sits on the Atlantic Coast and is one of the world’s leading tourist beach areas (Copacabana and Ipanema). The urban area straddles Guanabara Bay, with the municipality of Rio de Janeiro on the west side. A bridge leads to Niteroi, on the east side. The municipality of Rio de Janeiro covers virtually the same land area as the city of Los Angeles and like its American counterpart also includes mountainous areas. The mountains include Sugar Loaf and Corcovado, site of the world famous "Cristo Redentor" statue ("Christ the Redeemer") and others.  North and West of the mountains are the broad plains that contain most of the suburbanization (both within and outside the municipality).

    Favelas

    Favelas, also called shantytowns or informal housing proliferate throughout much of Latin America. It is estimated that 20 percent of new municipality’s population lives in favelas. The largest of these is Rocinha, which accounted for a full one third of the inner and outer core growth over the last 10 years, despite having less than 5% of the population. Rocinha is located on a steep hill adjacent to affluent São Conrado, which provides employment for many residents. This is typical for shantytowns around the world, which are located near principally domestic labor opportunities, since residents generally have only limited mobility options to employment in the rest of the urban area. The favela to affluent neighborhood model represents an effective example of a "jobs – housing balance," though   rooted in poverty and gaping class distinctions. (Photo: Rocinha Favela & São Conrado, top).

    Transport

    Mass transit is very important in Rio de Janeiro. More than one half of all travel is on the Metro, commuter railways, buses and informal vans. In recent decades, the rail share of travel has been falling substantially, while the van share of travel has increased substantially. Vans have also made serious inroads into mass transit ridership in other urban areas of Brazil.

    This dependence on transit does not mean that the roads are uncongested. For example, Avenida Brasil, the main arterial leading to Centro from the North carries more than 200,000 vehicles each day, a figure that exceeds that of many US urban freeways. A new peripheral freeway is under construction arcing around the urban area from west to east.

    Gross Domestic Product

    According to the Brookings Institution Global Metro Monitor, Rio de Janeiro had a gross domestic product per capita of approximately $16,300 in 2012. This would rank Rio de Janeiro 100th out of the 300 top metropolitan area economies in the world (Note 1). This is below Latin American leaders Buenos Aires ($26,100) and Sao Paulo ($23,700). It is also below the more affluent Chinese metropolitan areas, such as Shenzhen ($28,000) and Shanghai ($21,400). Rio, however, ranked above Cape Town ($15,700) and Cairo ($10,000).

    Life After the Capital Leaves

    The growth of Rio de Janeiro shows that there is, indeed, life after the national capital leaves. Rio has experienced strong economic growth in recent years and remains a dynamic urban region.

    Wendell Cox is a Visiting Professor, Conservatoire National des Arts et Metiers, Paris and the author of “War on the Dream: How Anti-Sprawl Policy Threatens the Quality of Life.”

    —-

    Note: These rankings are based on the 300 metropolitan areas with the largest total gross domestic product (not per capita gross domestic product). As a result, many metropolitan areas that are more affluent per capita are not included because their total gross domestic product is not rank in the top 300. This would include a large number of metropolitan areas in the United States, Europe Canada and elsewhere. The ranking of metropolitan areas in China is adjusted for the 2010 census, which includes migrant workers. Additional details are provided in Endnote 19 in the Brookings Global Metro Monitor.

    Top Photo: Rocinha Favela & São Conrado (photos by author)

  • The Evolving Urban Form: Kuala Lumpur

    The Kuala Lumpur region of Malaysia is generally defined by the state of Selangor and two geographical enclaves (the federal territories of Kuala Lumpur and Putrajaya), carved from the state. These enclaves are the two seats of the federal government. Kuala Lumpur houses the national parliament and Putrajaya the executive and judicial branches.

    Population Growth in the Kuala Lumpur Region

    The Kuala Lumpur region had a population of approximately 7.1 million, according to the 2010 census. This includes 1.6 million in the federal territory (core city) of Kuala Lumpur and 5.5 million in the suburbs (which include Putrajaya). The region has experienced strong growth since modern Malaysia evolved between 1957 and 1963. In 1950, the region had only 900,000 residents. By 1980, the population had more than doubled to nearly 2.4 million and by 2010, the population had tripled from its 1980 level.

    Unlike many urban cores, the city of Kuala Lumpur continues to experience strong population growth. Since 1980 (the first census after the creation of the new territory), the city has experienced a population increase of 77 percent.

    Yet, the suburbs and exurbs (Note 1) have grown far more rapidly. The suburbs and exurbs have grown 280 percent and have added nearly six times the population increase of the city (Figure 1).  This general distribution of growth continued over the past decade, with the suburbs attracting 83 percent of the new population, while the city of Kuala Lumpur received 17 percent of the growth (Figure 2).


    The region continues to grow faster than the nation and at the current growth rate, the Kuala Lumpur region could approach a population of 10 million by 2025.

    The Urban Area

    The Kuala Lumpur urban area (area of continuous urban development) has an estimated population of 6.6 million (2013). Kuala Lumpur ranks as the 49th largest urban area in the world (Note 2). The urban area covers an estimated 750 square miles (1,940 square kilometers), ranking it 42nd largest in the world. The population density is 8,800 per square mile (3,400 per square kilometer). Among the 70 world urban areas with more than 5,000,000 population, Kuala Lumpur ranks 56th in population density, with approximately the same density as Western European urban areas in the same size classification (Figure 3).

    The highest population densities are in the city of Kuala Lumpur, at 17,300 per square mile (6,700 per square kilometer), approximately the density of the city of San Francisco. The suburban areas have a population density of 6,800 per square mile (2,600 per square kilometer), approximately five percent higher than the suburbs of Los Angeles (Figure 4).

    The Economy

    Kuala Lumpur is a prosperous region by developing world standards. Only high-income Singapore is more prosperous in Southeast Asia. According to the most recent Brookings Global Metro Monitor, Kuala Lumpur has gross domestic product per capita of $23,900 annually (based on purchasing power). This is higher than all metropolitan economies in Latin America other than Brasilia, Monterrey and Buenos Aires. If Kuala Lumpur were in China, it would rank in the top quarter of the richest per capita metropolitan economies (Note 3).

    The Setting

    The urban area stretches from the core of Kuala Lumpur more than 20 miles (32 kilometers) westward to Port Klang on the Strait of Malacca, with similar expanses to the north and south. The urban area stretches less than 10 miles into the Titiwangsa Mountains, which forms the central cordillera of the Malay Peninsula.

    Physical Description

    The Kuala Lumpur urban area is located in a densely forested tropical region. The urban areas somewhat low density has permitted retention of substantial greenery. As a result, Kuala Lumpur appears to be among the "greenest" urban environments in East Asia, and for that matter, in the world. The greenery is especially evident in residential areas, where most housing is either detached or row house (Photos).


    Detached housing

    Row Houses

    However, the greenery also extends to the central business district (Photo: Kuala Lumpur’s Green Central Business District), where the largest buildings are much less densely packed than in most large world cities. Kuala Lumpur’s central business district is home to the Petronas Towers (Photograph above), twin towers that became the tallest buildings in the world upon completion in 1998, displacing Chicago’s Sear’s Tower (now Willis Tower). The title was lost to Taipei’s Tower 101 in 2004.


    Photo: Kuala Lumpur’s Green Central Business District

    Kuala Lumpur is not monocentric. The central business district accounts for only 12 percent of regional employment, a figure that is projected to decline (Figure 5). The central business district share is slightly more than the United States average (10 percent) and less than the Western European average (18 percent).

    Transport

    The Kuala Lumpur region principally relies on personal mobility (cars and motorcycles) for its transportation. As late as 1985, 35 percent of travel in the Kuala Lumpur was by mass transit. By 2010, this had fallen to between 10 and 12 percent. This is after opening three metro lines, a monorail and three commuter rail lines, with the metro and monorail lines having opened since 1995. Kuala Lumpur’s mass transit market share is more reflective of a high-income nation region than a middle income nation, comparable to Sydney, Toronto or New York and one-third below that of Western Europe. However, Kuala Lumpur is much more transit dependent than most US metropolitan areas, at five to 10 times that of Los Angeles, Portland, Seattle, Dallas-Fort Worth and Phoenix.

    The Kuala Lumpur region is served by an extensive network of expressways. One segment includes the "SMART" tunnel, which is a 6 mile (10 kilometer) long tunnel that serves both vehicles and storm water. While the tunnel has levels dedicated to both vehicles and storm water, the entire tunnel can be converted to storm water usage when there is serious flooding.

    Prospects

    Kuala Lumpur seems well positioned for the future. As the urban area has expanded in population and land area, its populace has achieved a level of affluence toward which much of the world strives.

    Wendell Cox is a Visiting Professor, Conservatoire National des Arts et Metiers, Paris and the author of “War on the Dream: How Anti-Sprawl Policy Threatens the Quality of Life.”

    ——————

    Note 1: See "Definition of Terms used in The Evolving Urban Form"

    Note 2: The comprehensive Demographia World Urban Areas is published at least annually, with the next (9th) annual edition due in the Spring of 2013.

    Note 3: The ranking for Chinese metropolitan areas is adjusted, using the population figures from the 2010 census (which included the urban migrant population). The issue is described in Endnote 19 in the Brookings Global Metro Monitor.

    ——————-

    Photograph: Petronas Towers (all photos by author)

  • The Evolving Urban Form: Bangkok

    Since 2000, the Bangkok region has experienced annual population growth 2.5 times the rate of growth from 1980 to 2000. By 2010, the Bangkok region – which includes the provincial level city of Bangkok and the provinces of Samat Prakan, Samut Sakhon, Pathum Thani, Nonthaburi and Nakhon Pathom –  was nearing a population of 15 million (Note 1).

    As is characteristic of urbanization in both developing and developed countries, much of Bangkok’s recent growth has occurred outside the city, in suburban (and exurban) areas. Between 2000 and 2010, the city grew by 30%, while the suburban provinces grew more than twice as quickly, at 66%. The city’s population growth was 1.9 million, while the suburban provinces added 2.5 million population (Figure 1).

    Much of the urban expansion has been on the periphery both within the city of Bangkok and in the provinces of Samut Prakon to the east, Samut Sakhon to the west and Pathum Thani to the north. Unlike most cities in Asia, where new development has taken high-rise form, much of this new development has been townhouses and detached housing. (Photo: Detached housing).


    Photo: Detached Housing in the Bangkok city eastern sector

    The Urban Area

    The urban area, or area of continuous urban (and suburban) development will reach 14.5 million residents in 2013, according to United Nations projections. The urban area (Figure 2) covers approximately 900 square miles (2,330 square kilometers) and has a population density of the urban area is 16,200 per square mile (6,200 per square kilometer). This is 1.5 times the density of the Paris urban areas and more than 2.5 times that of the Los Angeles. However, Dhaka (Bangladesh), the most dense urban area, is at least eight times as dense.

    Bangkok’s high density and inadequate road system combine to make Bangkok’s traffic among the worst in the world. The Bangkok region is well served by freeways but government authorities have failed to provide the necessary arterial road (secondary road) infrastructure, as noted by Shlomo Angel, Stephen C. Sheppard, and Daniel L. Civco in a World Bank report (Note 2). As a consequence, they said that:

    The cost of reducing congestion in Bangkok is now higher—by one or two orders of magnitude—from what it would have been had adequate rights-of-way been secured earlier.  

    Bangkok is not the first urban area to have made this mistake. Atlanta’s traffic congestion is substantially worsened by its failure to provide a proper arterial roadway system.

    Bangkok’s best chance of reducing its traffic congestion lies in the expansion of its underdeveloped arterial roadway system. Nonetheless, the scattered development has preserved opportunities to develop arterial roads cost effectively in some suburban areas. The siting of more commercial and employment growth in these areas would also help.

    Some officials have suggested that expanded rapid transit would reduce traffic congestion. Bangkok has been expanding its small rapid transit system (as can be appropriate in very high density centers). There is little potential, however, for transit to reduce traffic congestion, as the intense traffic congestion and long commutes in cities well served with transit indicates (See photo at top and Note 3)

    Suburban and Exurban Bangkok

    Suburban expansion has been made possible by the increasing affluence of the Bangkok area, inexpensive land and house construction prices and the rising share of households with personal motorized vehicles (automobiles and motorcycles). Suburban dwellers are in the process of obtaining their own "Thai Dream" of home ownership, the popularity of which is demonstrated by the continuing draw of households to these rapidly developing areas.

    Angel, et al noted that the Bangkok area had become “model of a well–functioning land and housing
    market," and that:

    Affordable and minimally–serviced land was brought into the market by the efficient creation of a minimal number of narrow tertiary roads that connected building plots to the existing road system; mortgages became widely available; and private developers went down–market in large numbers, selling land–and–house packages that were affordable for more than half the urban households.

    Data from the Real Estate Information Centre of Thailand indicates that average new house prices remain similar in relation to average household income as a decade ago. By maintaining a competitive land market for new housing, Bangkok has retained housing affordability. 

    However there are difficulties. Some suburban areas, particularly in Pathum Thani, were hard hit by the 2011 floods. There has been controversy on this issue, as governments, national and local have come under criticism for their failures to control the flooding. At a minimum, the failure of the Bangkok region governments to coordinate their efforts contributed to the seriousness of this disaster. Nonetheless, new house construction continues in the suburbs and exurbs.

    The City ("Bangkok Metropolis")

    The core city of Bangkok is a provincial level jurisdiction, referred to popularly as the "Bangkok Metropolis" (Note 4). Bangkok is not a compact city, however, covering 605 square miles (1.570 square kilometers). This is 15 times the land area of the ville de Paris and larger than either Houston or Los Angeles, two of the most geographically expansive municipalities in the United States.  

    Beyond central Bangkok, the north, east and west sectors of the core city have experienced strong growth in detached and attached (row house or townhouse) construction.

    Bangkok’s commercial core is dispersed, like many other Asian cities, in China and elsewhere.  Manila is every bit as polycentric as Los Angeles or Atlanta. Bangkok, however, may be the ultimate core dispersion. There are at least five areas of high-rise commercial concentration, and large office buildings are sprinkled throughout the large central area (Photo: Dispersed core development). The UITP Millennium Cities Database indicated that only 11 percent of employment was in the central business district in the middle 1990s. With the ongoing dispersion, this figure may be lower now.


    Photo: Dispersed core development

    An Economic Success

    Bangkok residents live well compared to many living in other East Asian cities. Not only is their housing more affordable, but they have achieved much higher incomes. According to the most recent Brookings Global Metro Monitor, Bangkok has gross domestic product per capita of $23,400 annually (based on purchasing power). This is more than all but four of Latin America’s metropolitan economies (Brasilia, Monterrey, Buenos Aires and Sao Paulo), according to the Brookings the data. If Bangkok were in China, its per capita GDP would rank in the top quarter  of metropolitan economies (Note 5).

    Challenges Facing the Bangkok Region

    Bangkok seems likely to continue to grow rapidly, simply because it is virtually the only "urban draw" in Thailand. None of the world’s megacities (over 10 million population) is larger relative to other urban areas in the nation. Bangkok has more than 20 times the population of the next largest urban area in Thailand (Chon Buri). Strong population growth always presents formidable challenges for governments. The Bangkok region’s principal tasks will be to retain housing affordability by ensuring a competitive land market, and by providing a road system that reduces its exceedingly long travel times.  

    —–

    Note 1: There has been confusion about the Bangkok region’s total population. As late as 2009, the city of Bangkok projected the 2010 regional population, excluding Nakhon Pathom’s fewer than 1 million population at 10.3 million. The population as counted in the 2010 census was 3.3 higher.

    Note 2: Developers (and thus home buyers) pay for building the tertiary road systems that serve the new housing developments, similar to the practice in nations like the United States, Canada, Australia and New Zealand.

    Note 3: This is illustrated by Tokyo and Hong Kong, which each have one-way work trip travel times of 46 minutes — the longest reported in high-income world metropolitan areas. Tokyo has the world’s largest transit system and Hong Kong has the highest average urban density in the high-income world. By contrast, Los Angeles, where transit carries a small share of travel, and which has much lower densities than Tokyo or Hong Kong, has a one-way average work trip travel time of 27 minutes.

    Note 4: The city of Bangkok is a provincial level jurisdiction, formally called the Bangkok Metropolitan Administration. This use of the term "metropolitan" can be confusing, since much of the metropolitan area is outside the city (in between two and four other provinces, depending on the definition. This is similar to Tokyo and the former situation in Toronto. The prefecture of Tokyo is referred to as the "Tokyo Metropolis," which comprises barely one-third of the population of the Tokyo metropolitan area. Before the formation of the present city of Toronto, the regional authority was called the "Municipality of Metropolitan Toronto," however contained barely one half of the metropolitan area population. These semantic issues have been the source of considerable misunderstanding, not only by casual observers, but also by some academics.

    Note 5: The ranking for Chinese metropolitan areas is adjusted in China, using the population figures from the 2010 census (which included the urban migrant population). The issue is described in Endnote 19 in the Brookings Global Metro Monitor.

    Wendell Cox is a Visiting Professor, Conservatoire National des Arts et Metiers, Paris and the author of “War on the Dream: How Anti-Sprawl Policy Threatens the Quality of Life.”

    ——

    Photo: Rapid transit and traffic congestion in Bangkok (all photographs by author)

  • The Evolving Urban Form: Addis Abeba

    Addis Abeba is the capital of Ethiopia and calls itself the "diplomatic capital" of Africa, by virtue of the fact that the African Union is located here. Yet Ethiopia is still one of the most rural nations in both Africa and the world. Ethiopia also appears to be among the most tolerant. Various forms of Christianity claim account for approximately 65 percent of the population, with the Ethiopian Orthodox Church (Coptic) holding the dominant share. At the same time there is a sizable Muslim minority, at more than 30 percent of the population. Ethiopia has been spared the interfaith violence that has occurred in some other countries where there are large religious minorities.

    Growing Urban Area

    Addis Abeba is among the fastest growing urban areas in the world. Since 1970, the population has increased by nearly three times (Figure 1). However, the spatial expansion of the urban area has been much greater. The earliest available Google Earth satellite photos (1973) indicate that the urban land area (continuous urban development) has expanded over 12 times. Thus, the urban spatial expansion has been at least four times that of the population over the since the early 1970s (Figures 2 and 3).

    Since 1973, the urban population density of Addis Abeba has declined almost three quarters, from approximately 75,000 per square mile or 29,000 per square kilometer to 20,000 per square mile or 8,000 per square kilometer. Addis Abeba represents yet another example of the counter-intuitive reality of growing urban areas simultaneously becoming less dense, because population growth occurs the generally less  dense periphery in an organic city. It is not unusual for urban analysts to (wrongly) assume the opposite.

    One of the results of the spatial expansion is a significantly better lifestyle for residents of Addis Abeba, consistent with the view of Professor Shlomo Angel, who decries attempts to constrain cities within artificial boundaries (compact city policies) because they can deny people both a adequate housing and a decent standard of living.

    The Economy

    Ethiopia is one of the poorest nations on earth, with a 2010 gross domestic product-purchasing power parity (GDP-PPP) per capita of just above $1,000. This places it 170th out of 183 geographical areas according to the International Monetary Fund. By comparison, the GDP-PPP of the United States was $47,000 and Singapore $57,000.

    Ethiopia’s low income reflects  Ethiopia’s relativey low rate of urbanization. With 17 percent of the population in rural areas (outside urban areas), urbanization is concentrated in Addis Abeba (3.1 million), which is the only urban area in the nation with more than 300,000 population. Ethiopia can expect to experience a strong rate of urbanization in the decades to come, as people flock to the cities to seek better standards of living. By 2030, the total number of urban residents is projected by the United Nations to rise to 28.4 million from 13.9 million in 2010.

    Urbanization has its problems, but also economic advantages. The GDP-PPP in Addis Abeba, according to a Price-Waterhouse-Coopers estimate, is up to six times higher than that of the rest of the nation. Assuming that this ratio held to 2010, The GDP-PPP per capita of Addis Abeba would be $6,000 or more.

    Moreover, Price-Waterhouse-Coopers predicted that Addis Abeba would experience the 5th greatest economic growth to 2025, out of 151 urban areas. This would result in growth greater than that of Shanghai and Beijing. The four predicted to grow faster are the two large Viet Nam urban areas (Hanoi and Ho Chi Minh) and two in China (Guangzhou in the Pearl River Delta and Changchun in Manchuria).

    The Urban Core

    As would be expected in a developing world urban area, there is a large urban core with mixture of government and private buildings, literally surrounded by lower income, principally informal housing. With this predominant informal housing, the population density of the urban core is by far the highest in Addis Abeba (See Photo: Informal Housing in the Urban Core: Parliament and Holy Trinity Dome in the Distance).


    Photo: Informal Housing in the Urban Core: Parliament and Holy Trinity Dome in Distance

    Major government offices and cultural facilities are in this area, such as the Parliament, the prime minister’s residence, museums, the residence of the primate of the Ethiopian Orthodox Church (Coptic), the most important cathedral, Holy Trinity, in which former Ethiopian leader Haile Selassie  is buried, as well as the Catholic Cathedral and the largest Mosques.

    The New Addis Abeba

    There’s been a huge expansion of the periphery around Addis Abeba. Extensive tours around the urban area provide evidence of relative prosperity. It appears that Addis Abeba is rebuilding itself around its urban core. There is major construction in three directions from the urban core.

    The greatest activity is in the Bole District, which includes Bole International Airport, to the south of the urban core. There is a substantial amount of new commercial high-rise construction within a few kilometers to the north of the airport, along two major arterials and in between (Photo: Bole Corridor Development). There are also a large number of large, private condominium buildings. The Bole Corridor represents an edge city, in the sense defined by Joel Garreau in his seminal book Edge Cities  two decades ago. This is also the location of the largest Ethiopian Orthodox Church (see top photo) in the country.


    Photo: Bole Corridor Development

    An eastern corridor stretches for 6 miles/10 kilometers from what is locally called the "Chinese Road," a ring road built largely with the support of the Chinese government. There are many new commercial buildings, government buildings, public and private condominiums, and at the edges, large new detached houses (See photo: Detached Housing in the Eastern Corridor).


    Photo: Detached Housing in the Eastern Corridor

    To the west, principally, the southwest, is a new residential neighborhood composed principally of condominiums, generally up to five floors (Photo: Southwest Residential Area).


    Photo: Southwest Residential Area

    China in Africa

    Chinese financial assistance is not limited to the ring road. Much of the funding for the impressive new African Union headquarters (photo) was provided by the Chinese government. Further, a new light rail line will be largely financed by China. At the same time, the massive construction evident in the newer, outlying districts of Addis Abeba resemble (at least in a modest way) the urban development that has occurred in China over the past few decades.


    Photo: African Union Headquarters

    Conclusion

    The economic progress evident in Addis Abeba is encouraging. The government policies  are allowing the city to expand naturally as it grows, which facilitates  better lives for its citizens. It can only be hoped that the day will come that people in developing world urban areas, such as Addis Abeba, will enjoy the high standards of living that have been achieved in the developed world.

    Photo: Holy of Holies, Bole Mehani Alem Church (Ethiopian Orthodox Churches all have a replica of the “Ark of the Covenant,” behind a screen, which is referred to as the “holy of holies”). According to the Ethiopian Coptic tradition, the Ark of the Covenant, which tradition indicates, contained the tablets on which the Ten Commandments were written. The Ark was maintained in the holy of holies in the Jewish temple. The Ethiopian tradition holds that the Ark was taken to Ethiopia and is now kept at a chapel at a church in Axum, which is 600 miles/1,000 kilometers north of Addis Abeba.

    Wendell Cox is a Visiting Professor, Conservatoire National des Arts et Metiers, Paris and the author of “War on the Dream: How Anti-Sprawl Policy Threatens the Quality of Life.”

  • The Evolving Urban Form: Barcelona

    Among those for whom Paris is not their favorite European city, Barcelona often fills the void. Barcelona is the capital of Spain’s Catalonia region. Catalonia has been in the news in recent weeks because of the rising a settlement for independence from Spain, or at a minimum, considerably expanded autonomy. In part, the discontent is driven by a concern about the extent to which more affluent Catalonia subsidizes the rest of Spain. Another driving factor is the interest in separating Catalonian language and culture from that of Spain.

    Barcelona is nestled on the Mediterranean coast with mountains and valleys immediately behind. It would be easy to visit Barcelona without being aware of the huge expanse of suburbanization that has developed especially over the last 50 years.

    The Core City

    Like virtually all European core cities that have not annexed or combined with other jurisdictions, Barcelona’s population had peaked well before the turn of the 21st century. In 1960, the city of Barcelona had a population of just below 1.6 million people. Today, after having risen to 1.75 million in 1981, Barcelona’s population has dropped to approximately 1.62 million. Nonetheless, like other European core cities, Barcelona experienced strong growth before 1970, rising to nearly 7 times its 1890 population of 250,000.

    At the same time, like some other European and North American core cities, the city of Barcelona has begun to grow again. Having reached a modern low point of 1.5 million in 2001, the city grew by approximately 7 percent by the 2011 census.

    The city itself covers a land area of approximately 55 square miles/143 square kilometers, slightly less than that of Washington, DC. Barcelona’s density is much higher, at approximately 40,700 per square mile/15,700 per square kilometer, as opposed to the approximately 10,000 per square mile/4,000 per square kilometer of Washington. Yet, other core areas are considerably more dense, such as the ville de Paris, which is at least 30 percent more dense and Manhattan, which is approximately 50 percent more dense.

    The Metropolitan Area and the Urban Area

    The metropolitan area is generally considered to be the province of Barcelona, which is a part of the region of Catalonia (Figure 1). Since 1950, the metropolitan area has expanded from 2.2 million to 5.6 million people. Since 1960, nearly all of the population growth has been outside the city of Barcelona. The city has added approximately 60,000 people, while the balance of Barcelona province has added approximately 2.7 million people (Figure 2).


    The province of Barcelona is divided into comarques, which are the equivalent of counties. The core comarca (the singular form) is also called Barcelona and includes the city as well as other municipalities (or local government authorities), the largest of which is Hospitalet de Llobregat, with a population of 250,000.

    Barcelona’s urban area (area of continuous urban development) continues along the Mediterranean coast to the southwest into the comarca of Baix Llobregat, which includes the international airport. To the northwest the urbanization continues along the coast for some distance into the comarca of Maresme.

    The urbanization then surrounds Tibidabo Mountain behind the city along freeway routes on either side. These roadways connect with the AP-7 autopista (toll motorway), which provides direct access between Madrid, Valencia, Andalusia and France. The large valley through which the AP-7 runs contains the largest suburbs of Barcelona, which are divided into two comarques, the Valles Oriental (East Valley) and the Valles Occidental (West Valley).

    The Barcelona urban area covers approximately 415 square miles/1,075 square kilometers (Figure 3) and has a population of 4.6 million. At approximately 11,000 persons per square mile/4200 per square kilometer, Barcelona is one of Western Europe’s most dense urban areas. It is approximately 15 percent more dense than Paris and among the larger urban areas trails only Madrid (11,800 per square mile/4,500 per square kilometer) and London (15,100 per square mile/5,800 per square kilometer).

    The Barcelona urban area’s high density is also illustrated by comparison to the Zürich urban area, with its reputation for high density. As defined by the Federal Statistical Office of Switzerland, Zürich covers virtually the same land area as Barcelona, yet has less than one quarter of its population.

    Between the 2001 and the 2011 censuses, there was seven percent growth in the inner suburbs surrounding the city of Barcelona within the comarca of Barcelona. Much greater growth, however, was experienced in the more peripheral parts of the urban area. The coastal suburbs of Baix Llobregat and Maresme grew approximately 17 percent and now have a population of more than 1,000,000.

    Growth was even stronger in the interior valley, with the Valles Occidental growing at 19 percent and the Valles Oriental, which and with much more vacant land for development, grew 22 percent (Figure 4). Now the population of the Valles approaches 1.2 million.

    However the largest growth was outside the urban area entirely, in the balance of the metropolitan area, where the population increased 27 percent (Figure 5), and now approaches 1,000,000.

    Newer Development

    Much of the most recent growth has been relatively unusual for large Spanish urban areas, which have largely experienced high density expansion, with multi-family buildings (often high rise), even in the suburbs (see top photo). However, considerable detached housing has been built in the Barcelona metropolitan area over the past decade.

    Barcelona’s Dispersion

    Thus, the Barcelona metropolitan area is generally following the trend of greater growth in the urban periphery and the strongest growth in the rural and smaller urban areas that are outside the continuous urbanization.

    Wendell Cox is a Visiting Professor, Conservatoire National des Arts et Metiers, Paris and the author of “War on the Dream: How Anti-Sprawl Policy Threatens the Quality of Life.”

    Photo: Residential area in Valles Occidentale (Barcelona suburbs), by author.

  • The Evolving Urban Form: Zürich

    Zürich is the largest urban area in Switzerland. The core city (stadt) of Zürich is located at the northern end of Lake Zürich, which is glacial and similar to the "finger lakes" of upstate New York. Lake Zürich is approximately 25 miles/40 kilometers long and 1-2 miles/1.5-3 kilometers wide. The urban area extends south along most of the lake and over hills to the East and West and further North.

    Zürich, like larger Paris and Barcelona is a favorite among urban aficionados. Two reasons: the apparent compactness of its urban core and it has one of the world’s best transit systems. Yet, as is shown below, Zürich looks and feels denser than the reality experienced by its citizenry. Moreover the urban core is surrounded by a sea of anything-but-compact suburbanization, as is the case in Paris and virtually all other large Western urban areas. A visit confined to the smallish, but architecturally pleasing precincts of the core can lead to a profound misinterpretation of the urban form (See Louvre Café Syndrome: Misunderstanding Amsterdam and America).

    The City of Zürich (Stadt)

    Like virtually all European core cities that have not substantially annexed new land or consolidated with other jurisdictions, the city of Zürich has lost population. Zürich reached its population peak in 1960, with 440,000 people. Since that time, the population has fallen to 373,000, a loss of 15 percent. The city is not very dense despite its reputation to the contrary. The land area is 34 square miles/89 square kilometers, which yields a 2010 population density of 11,000 per square mile/4200 per square kilometer. This is less than two thirds the density of the city of San Francisco and similar to that of some Los Angeles suburbs, such as Santa Ana, Inglewood or Alhambra (Figure 1).

    The city is divided into nine districts. The densest, the 5th district, covers 1.1 square miles/2.9 square kilometers and has a density of 24,000 per square mile/9200 per square kilometer. By comparison, Westlake, the most densely populated community planning district in the city of Los Angeles covered three times as much land and had a population density of 34,000 per square mile/13,000 per square kilometer in 2000 (latest data available). This is 40 percent greater than the highest Zürich district density.

    The Urban Area

    According to the Federal Office of Statistics (FSO), the Zürich urban area (urban agglomeration) has a population of approximately 1.2 million and covers a land area of 420 square miles/1085 square kilometers. The population density is comparatively low, at 2800 per square mile/1075 per square kilometer.

    Zürich’s development since World War II has mirrored the international trend towards suburbanization. In 1950, the urban area included the city of Zürich and 14 additional municipalities. The city, with a population of 390,000, contained more than 85 percent of the urban area population as defined at that time. Since 1950 all growth in the Zürich urban area has been in the suburbs. By 2010, the city of Zürich represented only 32 percent of the urban area population (Figure 2). Suburban areas account for 68 percent of the population and more than 90 percent of the urban land area.

    At each decennial census year, FSO adds new municipalities to the urban area as appropriate. In 1950, the urban area included the city of Zürich as well as 14 additional municipalities. By 2000, the urban area included the city of Zürich and 130 other municipalities (Figure 3). FSO is reviewing 2010 census results and is likely to add more municipalities to the urban area within the next year. The population of the urban area as presently defined has nearly doubled since 1950. The population trend for the city of Zürich and the six suburban rings (as presently defined) is illustrated in the Table.

    Zürich Urban Area: Population of Core Municipality & Suburban Rings: 1950-2010
    1950 1960 1970 1980 1990 2000 2010
    Urban Area: (Agglomeration Zürich)   605,765   801,124   947,011   970,073   1,021,859   1,080,728   1,188,566
    City of Zürich (Stadt)   390,020   440,170   422,640   369,522      365,043      363,273      372,857
    1st Ring (1950)     59,324     97,124   132,014   136,787      135,777      138,936      153,674
    2nd Ring (1960)     45,989     73,560   120,492   140,088      154,226      168,812      192,469
    3rd Ring (1970)     13,396     19,135     44,178     59,823         67,567         73,364         82,693
    4th Ring (1980)     64,259     83,036   113,195   132,444      145,165      159,021      183,878
    5th Ring (1990)     32,777     41,483     52,329     60,240         72,402         82,862         94,244
    6th Ring (2000)     46,616     62,163     71,169         81,679         94,460      108,751
    1950 Population for 6th Suburban Ring (2000) Not Available
    Source: Statistik Stadt Zürich & FSO


    In recent decades, population growth has gradually moved farther to the periphery of the urban area. This is illustrated by Figure 4, which shows a population trends for the city, the first three suburban rings (1950 to 1970) and the outer three suburban rings (1980 to 2000). By 2000, the three inner suburban rings exceeded the population of the city of Zürich. The outer three suburban rings passed Zürich in population by 2010 (Photo: Suburbs of Zürich).

    Suburbs of Zürich

    Suburban densities are considerably lower than that of the city of Zürich. Suburban Zürich has an overall population density of approximately 2100 per square mile/800 per square kilometer. As would be expected, the population densities decline substantially with distance from the city of Zürich (Figure 5). The first ring suburbs (1950) have a population density of 4500 square mile/1800 per square kilometer. This is about a quarter higher than the aggregate suburban density of Portland or New York, but only two-thirds as dense as the Los Angeles suburbs. The lowest population density is in the sixth suburban ring (2000) at approximately 1200 per square mile/450 per square kilometer. This is slightly above the approximate 1000 per square mile/400 per square kilometer international standard used by national statistics agencies in designating urban areas (Note 1).

    Similarly, employment has become more dispersed as jobs follow residents toward lower density suburban areas. Less than 15 percent of the urban area’s employment is in the central business district, a figure similar to that the average of US, Canadian and Australian urban areas.

    Getting Around and To Zürich

    Zürich is served by one of the world’s most effective transit systems, which necessarily focuses on the central business district and provides an intense mesh of service in the core city. Among the approximately 90 urban areas of the world for which the Millennium Cities Database provides service information, Zürich ranked 22nd in transit service intensity (transit vehicle kilometers divided by urban area square kilometers), with a service-level approximately 15 percent that of Hong Kong (Note 3). Among the European urban areas surveyed, only Barcelona and Milan had more intense transit service.

    However, as is the case in all urban areas of Western Europe (as well as the United States, Canada and Australia), the overwhelming majority of motorized travel in the Zürich urban area is by car. Zürich’s automobile market share, in distance traveled, is approximately 75 percent, similar to that of Paris and approximately 15 percent below that of the New York, Toronto or Sydney urban areas.

    Zürich, as the nation’s largest urban area, is unique in not having been linked to its national freeway (motorway) system until recently. Only since 2009 has Zürich been connected to nearby Lucerne (only 30 miles/50 kilometers away) or beyond  through the St. Gotthard tunnel to Milan and the South. The new Uetliberg Tunnel (A4 motorway) connects to the exurb of Zug. For the first time Switzerland’s main north-south motorway connects to its principal route, the east-west A1 motorway   (Note 2).

    No motorway dissects the city of Zürich. However, a swath is cut through the city of Zürich by the national railway system. Starting at Zürich Station and extending to the north city limits, the railway divide is from 150 to 450 meters/650 to 1500 feet wide (Photo: Zürich Railway Divide). This may be wider than any freeway in the world. For example, the 26-lane Katy Freeway in Houston, the 18-lane Autopista Panamericana in Buenos Aires and the 14-lane MacDonald Cartier Freeway in Toronto all have average widths of 150 meters/650 feet or less.

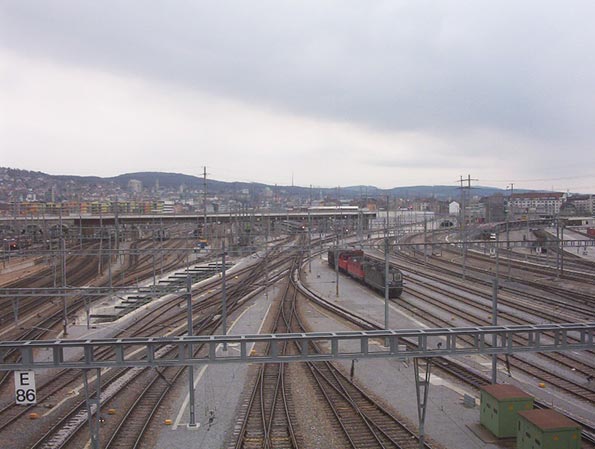
    Zürich Railway Divide (from Hardbrücke)

    Zürich: Compact Core, Suburban Reality

    Like urban residents throughout the high-income world, the residents of Zürich (and other Swiss urban areas) have chosen to live in larger, more comfortable houses, often with yards (gardens). At the same time, the historical urban core remains intact as a frequent or occasional destination for both tourists and residents, most of whom live in the suburbs.

    Wendell Cox is a Visiting Professor, Conservatoire National des Arts et Metiers, Paris and the author of “War on the Dream: How Anti-Sprawl Policy Threatens the Quality of Life.”

    —–

    Photo: Zürich Urban Core Street Scene (photos by author)

    Note 1: Such as INSEE (France), National Statistics (UK), Statistics Canada, United States Census Bureau, Census of India,

    Note 3: According to Millennium Cities Database information, only Manila had more intense transit service than Hong Kong (85 percent higher service intensity).

    Note 2: Switzerland speed limits are slow by European standards, but generally higher than those in the United States, Canada and Australia. The national speed limit on the motorway system is 120 kilometers per hour/75 miles per hour. Speed limits are higher in France and Italy at 130 kilometers per hour/81 miles per hour. In Germany, most of the autobahn system is not subject to speed limits. The highest speed limit in the United States is now planned for a new toll road (C-130) between San Antonio and Austin, at 85 miles per hour/137 kilometers per hour and on some other Texas and Utah roads at 80 miles per hour/129 kilometers per hour. Elsewhere in the United States, Canada and Australia, speed limits are lower than in Switzerland and nearly all Europe.

  • Evolving Urban Form: São Paulo

    São Paulo is Brazil’s largest urban area and ranks among the top 10 most populous in the world. Between 1950 and 1975, São Paulo was also among the globe’s fastest growing urban areas. For two decades starting in 1980 São Paulo ranked fourth in population among the world’s urban areas, but has been displaced by much faster growing urban areas like Manila and Delhi.

    São Paulo became Brazil’s largest urban area, displacing Rio de Janeiro, in the middle 1960s. There has been no looking back. By 2025, the United Nations forecasts that São Paulo will have 10 million more people than Rio (Figure 1).

    São Paulo is the capital of Brazil’s largest state, also called São Paulo. The 2010 census counted more than 41 million people in the state, more than live in California. The state of São Paulo is substantially more densely populated than California, occupying only two thirds of the land area (approximately the size of Oregon).

    There are other large urban areas in the vicinity of São Paulo. Campinas, an urban area of 2.5 million people, is located 60 miles (100 kilometers) north and San Jose dos Campos, an urban area of 600,000 is located 60 miles (100 kilometers) to the west.

    A 20th Century City

    Like many developing world megacities, São Paulo is a creation of the 20th century. In 1900, the population was 240,000. By 1950, the population had reached two million and now is approximately 20,200,000.

    São Paulo is located on a small plateau, over the mountains from the Atlantic Ocean 2500 feet (750 meters) above sea level, approximately the same elevation as Madrid. São Paulo is the world’s second largest urban area not located on an ocean or sea coast (Delhi is the largest).

    São Paulo is located 50 miles (80 kilometers) from the seaport of Santos, which is an urban area of 1.7 million. Santos is reached by one of the world’s most spectacular freeways, the Rodovia dos Imigrantes, which winds down the mountainside, with the southbound lanes crossing over the northbound lanes like the Interstate 5 Grapevine north of   Los Angeles, the grade down from Puebla (Mexico) to the city of Orizaba on Autopista 150D and a section of the N205 approaching Chamonix-Mont-Blanc in France.

    São Paulo’s Urban Expanse

    São Paulo is a comparatively dense urban area, at 16,500 persons per square mile, or 6400 per square kilometer. This makes São Paulo somewhat less than double the density of Paris, but still one quarter the density of Hong Kong or Mumbai and one seventh the density of Dhaka. The urban area covers 1,225 square miles (3,175 square kilometers), similar in size to the Miami and Washington DC urban areas.

    São Paulo is hardly a "compact city." The urban area stretches nearly 60 miles/100 kilometers east to west and more than 30 miles/50 kilometers north to south. The core city covers nearly as much area as the core city of Houston.

    Recent Growth and Suburbanization

    The central city (municipio) of São Paulo continues to grow. In the last 10 years, São Paulo  has grown from 10.4 million to 11.2 million. A majority of the urban area population, 57 percent, continue to live in the central city. However there is much stronger growth in the suburbs, reflecting the trends in nearly all other major urban areas of the world. Since 1950, São Paulo’s suburbs have experienced an explosive   growth, rising from under 200,000 residents to 8.4 million. This exceeds the core city’s growth over the same period of 7.46 million (Figure 2).

    In the last 10 years, suburban São Paulo has grown from 6.7 million to 8.4 million people, capturing   more than two thirds of the population growth. Since 1950, when the suburbs had approximately 5 percent of the population, they have increased their share in every census. However, if the strong growth of the city and the suburbs continues at the rates of the last 10 years, it could be 30 years before a majority of the population lives in the suburbs.

    Deficient Transport

    Like most nations, Brazil has a freeway or motorway system. There is a freeway between São Paulo and Rio de Janeiro and a freeway from São Paulo to the nation’s third largest urban area, Belo Horizonte. These and other freeways emerge from the urban periphery, without traversing the core.

    Yet, there is no way for trucks to traverse the São Paulo urban area from East to West without getting tied up in São Paulo’s monumental central area traffic. Nor is there a freeway for port traffic to cross the urban area south to north toward Campinas. Thus, truck traffic from the affluent urban areas of the South, such as Curitiba and Porto Alegre and the port at Santos is forced on to the Avenida Marginal Tiete and Avenida Marginal Pinheiros, forging an overused route adjacent to the urban core on both the west and north sides. East-west and north-south commercial traffic is combined on this roadway.

    However, São Paulo is building a long overdue ring road, the Mario Covas Beltway. Less than one half of this route is now in operation and the whole circle will not be completed until 2015.

    São Paulo is also on the trouble fraught high speed rail route proposed to run from Rio de Janeiro to Campinas. The route was roundly criticized by The Economist, which noted the low-balled costs, the astronomical ridership projections and the likelihood that Brazilian taxpayers would have to foot quite a bill to make it happen. This line was covered in more detail in Private Investors Shun Brazil High Speed Rail and High Speed Rail in Brazil: The Need for Guarantees.

    From Monocentricity to Polycentricity

    A number of other megacities in the developing world have added new commercial cores, becoming more polycentric, as the old central business district becomes comparatively less important. This is evident in Istanbul, Mexico City and Manila. In recent decades, most of the core-type commercial development has occurred along Avenida Paulista (two miles/three kilometers west of Centro) and then later, Luis Berrini (another 6 miles/10 kilometers further to the southwest).

    The Shantytowns

    As drivers travel on the Avenidas Marginal and the Mario Covas Beltway, they pass many shantytowns (favelas) close to the roadways. This can be a shocking site for North American rental car tourists. In more recent decades, favelas have developed not only on the urban fringe, but adjacent to affluent areas in the core (Photo). There are also corticos, which tend to be old subdivided houses and more centrally located. Both of these are increasingly interspersed through the urban area. A mid 1990s estimate placed the number of people living in this sub-standard housing at one quarter of the people in the central city of São Paulo.

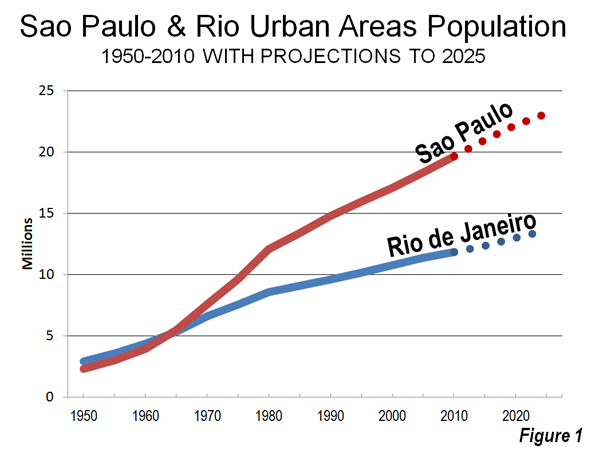
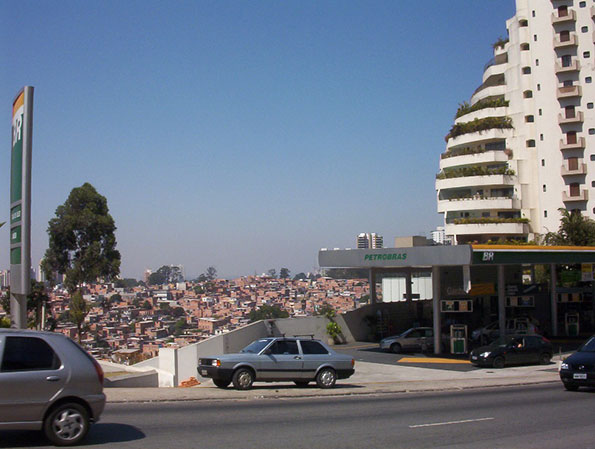
    Favela and Affluence, core city of São Paulo

    City of Hope

    The origins of this movement to Sao Paulo are clear. People moved from the poor countryside, often from the sugar plantations of the Northeast. As bad as life may look to affluent northerners, things are much better here than back in the countryside. Otherwise they would go home, which occurs with no material frequency. São Paulo, like all big metropolitan areas, is a city of hope.


    Wendell Cox is a Visiting Professor, Conservatoire National des Arts et Metiers, Paris and the author of “War on the Dream: How Anti-Sprawl Policy Threatens the Quality of Life.”

    Lead Photo: Paulista Avenue (by author)

  • The Evolving Urban Form: Istanbul

    Istanbul is unique in straddling two continents. The historical city was concentrated on the European side of the Bosporus, the wide, more than 20 mile long strait linking the Sea of Marmara (Mediterranean Sea) in the south to the Black Sea in the north. Nearly all of the historic city was located on a peninsula to the south of the Golden Horn, an inlet off the Bosporus. By 1990, the urban area had expanded to occupy large areas on both sides of the Bosporus.

    The Urban Area

    Istanbul, like many other developing world urban areas, has grown rapidly since World War II. In 1950, the urban area contained a population of less than 1,000,000. That is similar to the present population of urban areas like Edmonton, Adelaide and Raleigh. By 2012, the urban area had   a population of nearly 12.7 million.

    Few of the world’s cities boast a more storied history than Istanbul. It started as the Greek colony of "Byzantium," in the 7th century, BCE. By the fourth century, CE, Byzantium , taking advantage of Rome’s decline, was designated capital of the Roman Empire by the Emperor Constantine. The city was subsequently renamed "Constantinople." The final name change, to "Istanbul," was finalized in the early years of the post-Ottoman Empire Republic in the 1920s.

    Constantinople became capital of the Eastern empire. Constantinople eventually emerged as the seat of Eastern Christianity (Easter Orthodoxy) and remains so today, despite more than 500 years of Islamic predominance under the Ottomans and later, the Republic of Turkey.

    Like many ancient cities, Constantinople experienced wide swings in population, reaching 400,000 in 500 C.E. then dropping to under 50,000 by the time of the Ottoman conquest (1453). But the conquest proved a boon to the city.

    By 1550, the population had risen to 660,000. At the time only Beijing was larger (690,000). At that point, the city walls (the present district municipality of Fatih) and urbanization north of the Golden Horn amounted to an estimated six square miles (15 square kilometers), for a population density of approximately 110,000 per square mile (42,500 per square kilometer). Such hyper-densities were typical of pre-1800 cities, when walking was the predominant mode of transport. Some older cities were even more dense:  17th century, Paris approached 175,000 per square mile (67,000 per square kilometer (Note: Walking Cities)


    Caption: Sultan Ahmed Mosque (Blue Mosque), 17th Century, CE

    In the ensuing centuries, the urban area grew modestly to less than 1,000,000 in 1950, when the urban population density fell to 40,400 per square mile (15,600 per square kilometer). Rapid growth was to follow to today’s more than 12 million, along with a further drop in urban density, to 24,300 per square mile or 9,400 per square kilometer (Note: The Density of Istanbul). The physical expansion of the urban area now stretches north all the way to the Black Sea (Figure 1 shows the present extent of the urban area and the 1950 urban area). Over the 60 years, the urban area population grew more than 12 times, but the urban land area grew nearly 21 times (Table 1). Istanbul demonstrates the near universal truth that as cities grow, they become less dense  (Figure 2).

    Table 1          
    Istanbul Urban Area: Population & Density from 1550    
    Year Population in Millions Land Area: Square Miles Land Area: Square Kilometers Density:Square Mile Density: Square Kilometer
    1550 0.66 6 16 110,000 42,500
    1950 0.97 24 62 40,400 15,600
    2012 12.66 520 1,347 24,300 9,400
               
    Change: 1550-1950 47% 288%   -63%  
    Change: 1950-2010 1205% 2073%   -40%  


    At United Nations projected growth rates, the urban area should approach 18 million by 2025 (Figure 2). There are reports of increased migration to Istanbul from Asian Turkey, which if continued, could make the 2025 figure even higher.

    The Metropolitan Metropolis and Province

    Istanbul is a both a metropolitan municipality and a province and can be considered a metropolitan area (labor market area). The province, most of it rural, covers land area of more than 2,100 square miles (5,300 square kilometers) and had a population of approximately 13.5 million according to the 2011 census. The urban area (area of continuous urban development) is much smaller, at only 520 square miles (1,347 square kilometers). Nearly all the population is concentrated in the urban area.

    Since 1985, the metropolitan area’s growth largely has been outside the core. The historic core, on the peninsula (Fatih), lost 27 percent of its population, while the balance of the core, district municipalities to the north of the Golden Horn and to the west, lost 5 percent. Such core area losses have frequently occurred in many  major metropolitan areas   (for example, Osaka, Seoul, Mumbai, Chicago, Milan, Buenos Aires, and Mexico City).

    The inner ring, including district municipalities further to the west and north of the core on the European side and municipalities on the Asian side have captured nearly all the growth. From 1985 to 2011, inner ring district municipalities added 5,000,000 residents. The outer ring of suburban district municipalities gained 2.5 million residents with the greatest percentage growth, at nearly 250 percent. There has also been growth in exurban district municipalities (beyond the urban area), though it has been much more modest (Figure 4 and Table 2).

    Table 2          
    Istanbul: Population Growth by Sector: 1985-2012  
               
        1985 2000 2011 Change: 1985-2011
     Historic Core: Fatih             591          459          429 -27%
     Balance of Core          1,336      2,175      1,270 -5%
     Inner Ring          2,635      5,747      7,800 196%
     Outer Ring          1,044      2,424      3,598 245%
     Exurbs               147          240          386 162%
     Total            5,753    11,045    13,483 134%
               
     Population in 000s         


    Ascendant Asia

    While European Istanbul has been dominant for millennia, it is perhaps fitting that Asian Istanbul is on the rise, with nearly 40 percent of the population, up from 31 percent in 1985. Asian Istanbul was made substantially more accessible by the first bridge over the Bosporus (1973).

    Linking Istanbul

    Istanbul is served by two major east-west freeways. Each (the O-1 and O-2) both have their own crossings of the Bosporus. Other freeways feed these both in Europe and Asia. The development of the mass transit system is somewhat curious. The inner Fatih area and Beyoğlu contain the historically most important commercial centers. However, they are being fast replaced by new skyscraper developments in Levent and Maslak. This is similar to the emergence of newer commercial cores that have become more important the older cores, such as in Mexico City, Sao Paulo, Beijing, and Manila, where multiple, large cores have grown.

    Yet, Istanbul’s urban rail system keys on the old commercial centers. Both Levent and Maslak are located on a single Metro line, which makes them less convenient than if radial lines were being built to these centers instead. Both centers have good road access. Levent is located between the O-1 and the O-2 motorways, while Maslak is located just north of the O-2.

    A passenger rail tunnel between Asia and Europe, the first, is scheduled for opening to Fatih in 2015. Local authorities predict that this and other pending projects could increase the share of trips by rail in Istanbul from 3.6 percent to as much as 27.6 percent. No such market share increase has ever occurred in the world since automobiles have become widely available. Further, like Istanbul’s transit system in general, the project will not provide direct service to Levent or Maslak.

    Becoming Europe’s Largest Urban Area

    Istanbul has always been considered European and remains so even with its huge suburbs in Asia. Istanbul trails Moscow as Europe’s largest urban area, but by 2025 should be the largest. Indeed, it seems likely that Istanbul will be the only European urban area to reach a population of 20 million, as much of Europe faces stagnant or even declining population.

    Wendell Cox is a Visiting Professor, Conservatoire National des Arts et Metiers, Paris and the author of “War on the Dream: How Anti-Sprawl Policy Threatens the Quality of Life.”

    ——————–

    Note: Walking Cities: Walking constrained the physical expansion of cities, and thus the population. As result, few pre-1800 cities reached 1,000,000 population and most were not able to sustain that level. The great expansion of urban areas followed, as walking was replaced by the more efficient transport modes of transit and automobiles, both of which permitted a sizeable expansion of urban footprints and labor markets. The subsequent economic growth is legendary and accounts for having attracted so many people from the countryside. In 1800, estimates suggest that urban areas contained under 10 percent of the world population. Today, the figure is 52 percent, according to the United Nations. This includes all urbanization, from the largest cities to the smallest towns.

    Note: The Density of Istanbul. The province, most of it rural, covers land area of more than 2,100 square miles (5,300 square kilometers) and had a population of approximately 13.5 million according to the 2011 census. The urban area (area of continuous urban development) is much smaller, at only 520 square miles (1,347 square kilometers). This article highlights the urban density of Istanbul, which is the population per square mile or square kilometer. Other sources cite much lower figures, for the province/metropolitan municipality (metropolitan area). However, metropolitan area densities are not urban area densities. Metropolitan areas virtually always have more rural land than urban land, so their population cannot be included in calculations of urban density. The population and density noted above is based upon the 2011 census and will be reflected in the next edition of Demographia World Urban Areas.

    Photo: Hagia Sophia (Santa Sophia) Church (now museum) built by Justinian (6th Century CE). Photos by author.