Tag: Evolving Urban Form: Development Profiles of World Urban Areas

  • Evolving Urban Form: Dhaka

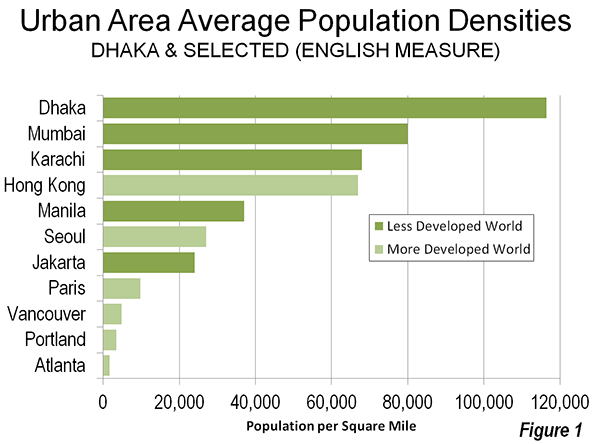
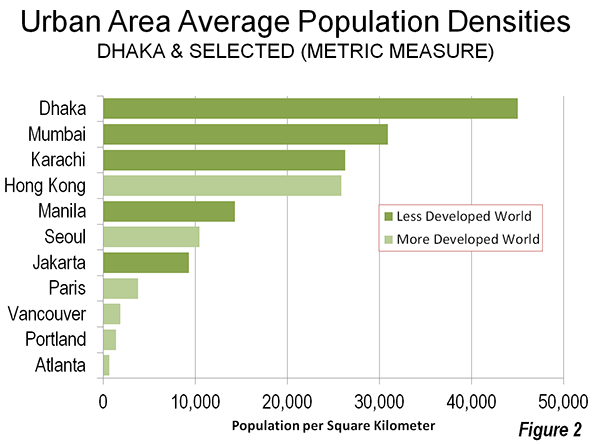
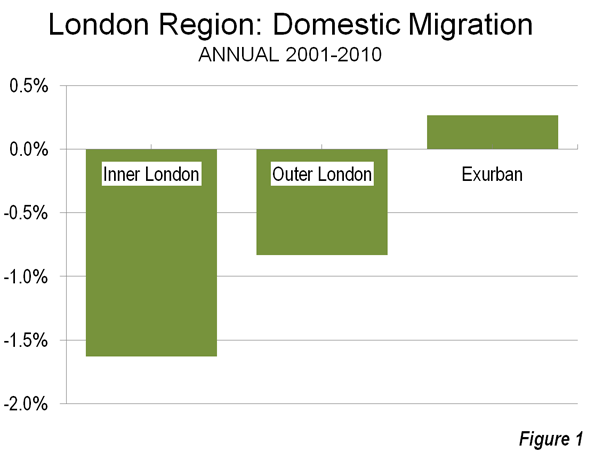
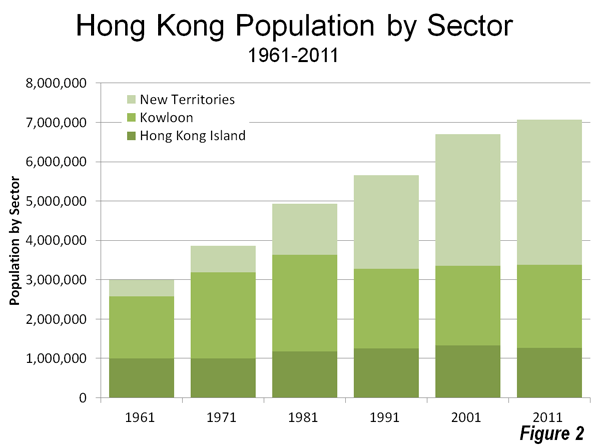
    A few weeks ago, we suggested that Hong Kong was the "smart growth" ideal, for having the highest urban population density in the high income world. But, if you expand the universe to the poorer, developing countries, Hong Kong barely holds a candle to Dhaka. Dhaka’s 14.6 million people live in just 125 square miles (325 square kilometers). At more than 115,000 people per square mile (Figure 1), or 45,000 per square kilometer (Figure 2), the capital of Bangladesh is nearly 75 percent more dense than Hong Kong.

    The Ultimate in Average Urban Area Density

    None of the world’s megacities comes close to Dhaka’s population density. Mumbai is about one-third less dense, despite its reputation as crowded and congested. The only other megacity (minimum 10 million population) more than one-third as dense as Dhaka is Karachi. Twenty three other megacities fall at least two-thirds short of Dhaka’s density (such as Jakarta, Seoul and Paris). New York’s core, Manhattan, is 40 percent less dense, and the New York urban area does not reach 1/20th of Dhaka’s density


    No city in the world uses land so efficiently as Dhaka. But this comes at a price. With an urban area ranked among the 20 most populous in the world, Dhaka’s average income is so low that it does not even place in the top 100 metropolitan area economies as measured by the Brookings Institution. Thus, the world’s most dense urban area is among the least economically productive. Brookings rated the principally suburban and exurban Hartford metropolitan area number one, with an urban density approximately 1/100th that of Dhaka, Hartford includes the old core city; but as well as the much more substantial primarily suburban or even exurban areas.. Hartford is among the least dense urban areas in the world, at half as dense as Portland and one-fourth as dense as Los Angeles. So much for the illusion that urban density and productivity are joined at the hip.

    Despite Dhaka’s hyper-density, critics complain about Dhaka’s urban sprawl. If Dhaka is "urban sprawl," then the term is meaningless. Perhaps the critics would prefer the rural poor to live in even more crowded shantytowns, or maybe better yet, that they go back home to even more desperate rural poverty. Aspiration is not a bad thing, and if that means cities with more people, covering more land area, so be it.

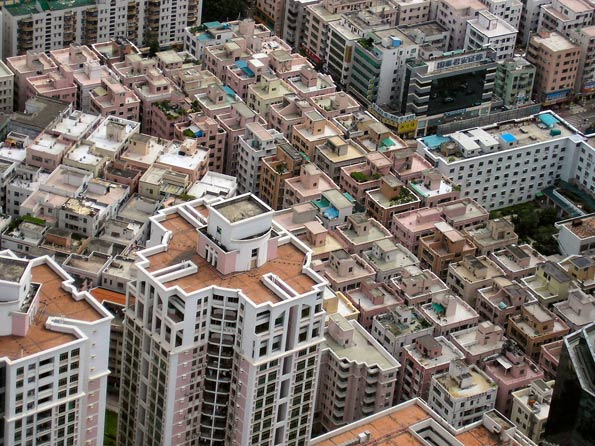
    Not only does Dhaka have the highest average urban density, but it also has some of the highest neighborhood densities: some slum (shantytown) population densities reach 4,200 per acre, which converts to more than 2,500,000 per square mile or more than 1,000,000 per square kilometer. Estimates of the slum population vary, ranging from a quarter to 60 percent of the area population.

    Dhaka in the Neighborhood

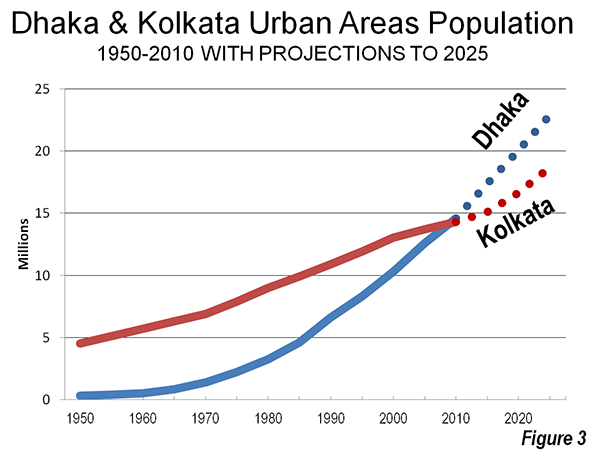
    Dhaka is only 150 miles (250 kilometers) from Kolkata. Both cities were located in the province of Bengal for all but six years of the centuries long period of  British rule. After the division of India and Pakistan in 1947, Dhaka was located in East Pakistan. Kolkata became the capital of the Indian state of West Bengal. For most of their histories, Kolkata was larger than Dhaka. But the Dhaka urban area has just overtaken Kolkata in population. By 2025, the United Nations forecasts that Dhaka will reach 23 million, well ahead of Kolkata’s projected 19 million (Figure 3).

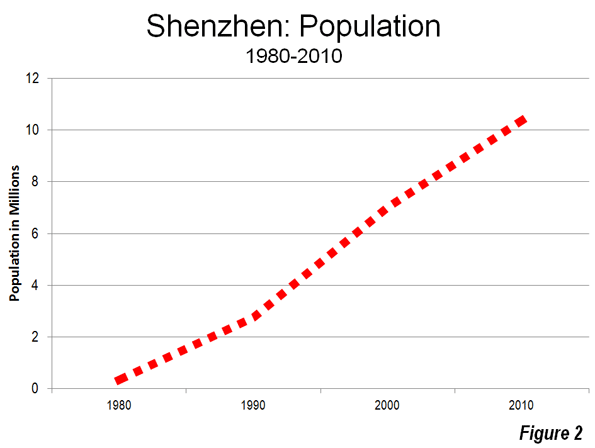
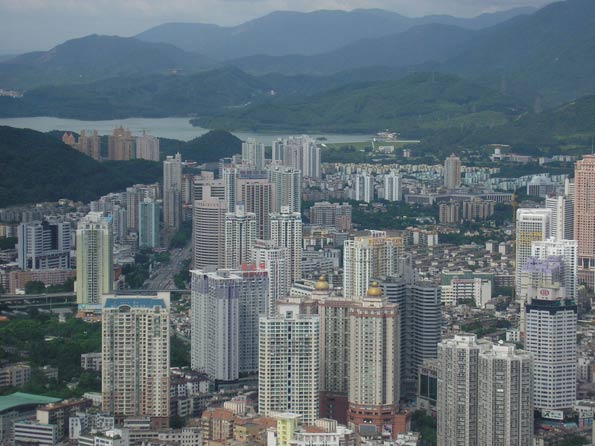
    Dhaka’s growth has been spectacular. In 1970, just before East Pakistan separated from Pakistan to become Bangladesh, the urban area had a population of 1.3 million. Its population grew by more than 10 times, Dhaka growth over four decades trails only Shenzhen among the megacities, which expanded by 30 times over the same period.

    The Metropolitan Area

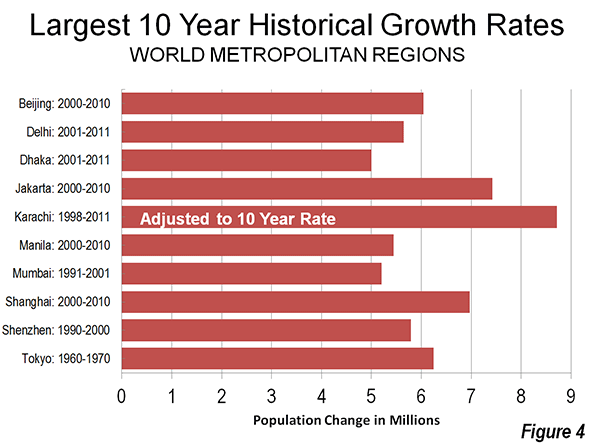
    Dhaka’s metropolitan area (which includes the urban area and economically integrated rural environs) added approximately 5,000,000 new residents between 2001 and 2011. Dhaka added at least a 50 percent to its population, rising from just under 10 million population to just over 15 million during the decade (Note 1). Few, if any of the world’s largest metropolitan areas or urban areas have achieved such a large percentage population increase in a period of 10 years. Even so, Dhaka’s population added fewer people than some larger metropolitan areas over a similar period, such as Karachi, Jakarta and Shanghai (Figure 4).

    Spatial Expansion

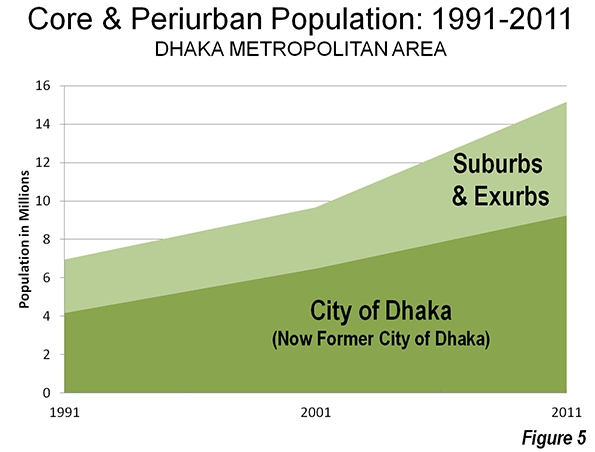
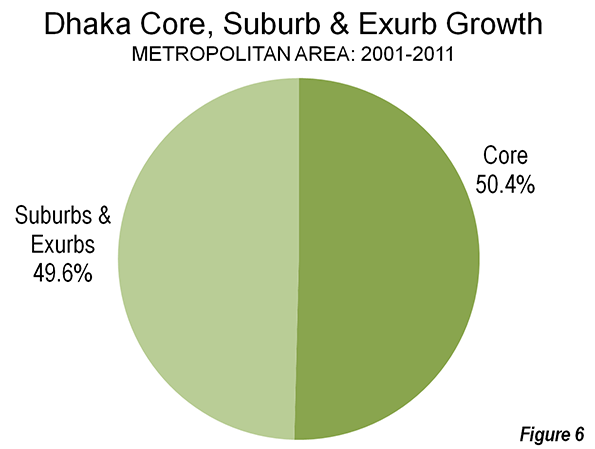
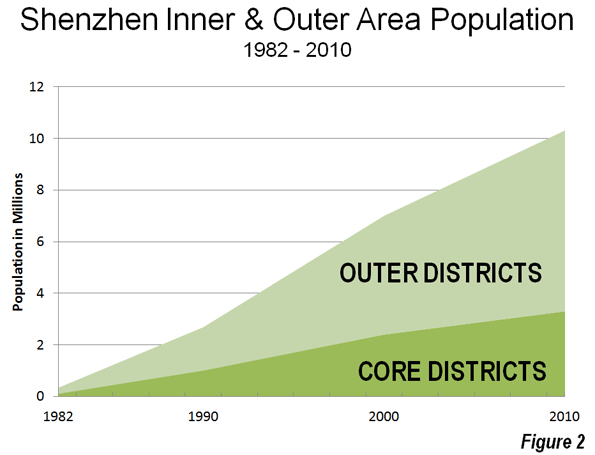
    Consistent with the trend since cities escaped walls, Dhaka has been expanding spatially as its population has increased. Over the past decade, the core municipality, Dhaka, increased its population 45 percent. The suburban and exurban population increase was nearly twice as great, at 85 percent (Figure 5). The core city of Dhaka managed to capture just over one-half the population growth, but because of its larger size, the slower percentage growth rate still resulted in half the additional population being in the city (Figure 6). Dhaka thus further confirms the axiom that as cities become larger, they become less dense.


    River City

    Dhaka may be the worst situated urban area in the world. Dhaka is located in wetlands and virtually surrounded by rivers, some of the greatest in the world.

    • Dhaka is 20 miles (32 kilometers) east of the Padma River, which is the main course of the Ganges River.
    • Only a few miles north of this point, the Padma is joined by the Jamuna River, which is the main course of the Brahmaputra River.
    • The Meghna River, the secondary Brahmaputra River course is 15 miles (25 kilometers) to the east of Dhaka.
    • Little more than 30 miles (50 kilometers to the south is the confluence of the Padma River and the Meghna River, which flows the last few miles to the Bay of Bengal as the Meghna.

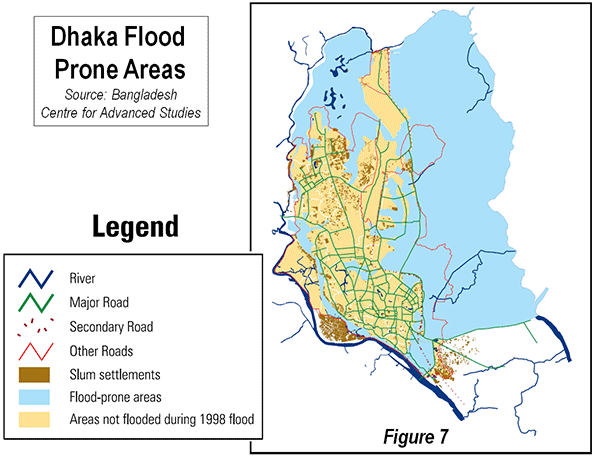
    Though Dhaka is 100 miles (160 kilometers) from the Bay of Bengal (the Indian Ocean), the lowest parts of the city are little more than five feet (two meters) above sea level. This means serious flooding. The risk is illustrated in Figure 7. The extent of the risk is illustrated by the fact that the areas not prone to flooding cover less land than the urban area. That means that the necessary urban expansion will be very expensive. With the understandable exodus from rural areas to the city, the problems of high density and, particularly slums could become more acute.

    A City Designed for a Metro?

    The river courses and wetlands have forced Dhaka into a generally north-south orientation. The urban area averages from three to seven miles east to west (five to 11 kilometers) and is nearly 30 miles (50 kilometers north to south. The more circular development that would be expected for an inland urban area is precluded by the rivers and wetlands.

    This unusual city form could serve the city well, however, as it builds its first Metro line. Stations on the planned north to south line will be within a long walk of a much of the urban area. It is hard to imagine an urban form and density more suited for a Metro. Construction is supposed to begin within the next two years.

    Not only is Dhaka the largest world urban area without an urban rail system, it is also the largest without a motorway (freeway). That too will soon change, as two should be under construction soon.

    Political Reform and the Future

    Meanwhile, in an attempt to improve city services, the national government has divided the city of Dhaka into two. The Dhaka City Corporation has now been replaced by the Dhaka North City Corporation and the Dhaka South City Corporation. There is an increasing body of literature suggesting that smaller municipalities perform better (and spend less) than larger municipalities. The Dhaka demerger may be the first significant such move since the 1986 breakup of the Greater London Council by the Thatcher government (Note 2).

    Dhaka begins the next decade undertaking significant challenges in infrastructure, economic growth and government reform. However, perhaps the biggest challenge will be to figure out where to put the additional five million people expected by the 2021 census.

    Wendell Cox is a Visiting Professor, Conservatoire National des Arts et Metiers, Paris and the author of “War on the Dream: How Anti-Sprawl Policy Threatens the Quality of Life.”

    —–

    Note 1: There was an undercount in the 2011 census, ranging from 3.8 percent in rural areas to 5.3 percent in urban areas. This complicates comparison between the 2001 and 2011 census data.

    Note 2: Even after the subsequent creation of the Greater London Council, by the Blair government, most local functions were not transferred, remaining in the 32 local boroughs. A forced amalgamation of Montréal with suburbs was partially reversed by voter referenda in the early 2000s.

    —-

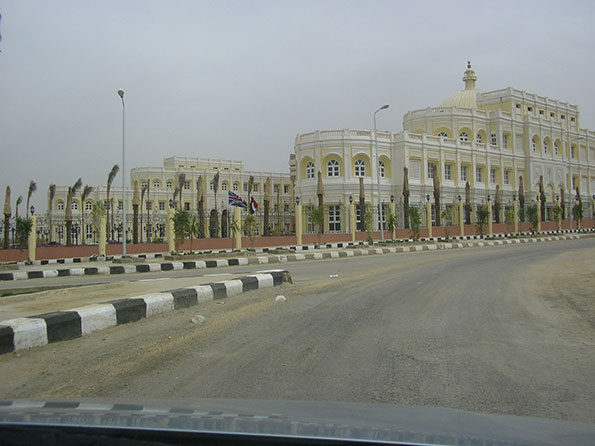
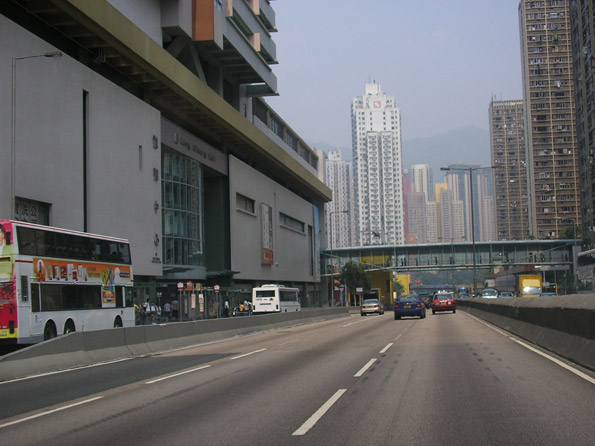
    Photograph: Farmview Supermarket Transit Transfer Center, on one of the urban area’s few north-south arterial  roadways. (by author)

  • The Evolving Urban Form: London

    The 2011 census results show that London (the Greater London Authority, which is Inner and Outer London) experienced its greatest percentage population growth in more than 100 years (1891 to 1901). London added nearly 1,000,000 new residents since 2001. That growth, however, is not an indication that "people are moving back to the city." On the contrary, National Statistics data indicates that London lost 740,000 domestic migrants between 2001 and 2011. The continuing core net domestic migration losses have been replicated in other major European metropolitan core areas, such as Milan, Vienna, Stockholm and Helsinki.

    Instead as typical in major European core municipalities, the vast majority of the growth in London has come from net international migration. London added 690,000 residents between 2001 and 2010. This pattern has become more prevalent since European Union enlargement, when Eastern Europeans began moving in much larger numbers to the United Kingdom and other richer areas of the old EU-15.
    London first became the world’s largest urban area in the first quarter of the 19th century, displacing Beijing. At that time, London was approaching 1.4 million residents, living in an urban area of approximately 15 square miles. Today, Inner London, the Outer London suburbs and two rings of exurbs spread 10,500 square miles (27,000 square miles), with a population of 20.3 million. Beijing, meanwhile, has grown so fast that it may once again surpass London in the next decade. However, other metropolitan regions are much larger, such as Tokyo and Jakarta.

    Meanwhile, the urban area (the continuous built up area), circumscribed for more than one-half century by the Greenbelt, appears to have a population of 9.5 million, which would place it 27th in population in the world.

    Over the past century, London has experienced substantial ups and downs in its population and still remains below its 1939 population, even with the large gain over the past decade. Over the same period, Inner London lost millions of its residents and only recently has begun to gain some back, largely due to net international migration gains. Outer London gained in the first half of the 20th century, plateaued and then also gained strongly in the last decade. The exurban areas virtually monopolized growth for most of the post-World War II period (Table) until recently.

    London Region: Population 1891-2011
    Year London Region London (Greater London Authority) Inner London (Historical Core) Outer London (Suburbs) Exurbs (Outside Greenbelt) 1st Exurban Ring (Historical Counties Adjacent to Green Belt) 2nd Exurban Ring
    1891 7,752,000 5,574,000 4,432,000 1,142,000 2,178,000 595,000 1,583,000
    1901 8,931,000 6,507,000 4,898,000 1,609,000 2,424,000 691,000 1,733,000
    1911 11,526,000 7,162,000 5,002,000 2,160,000 4,366,000 2,365,000 2,001,000
    1921 12,071,000 7,386,000 4,978,000 2,408,000 4,684,000 2,553,000 2,131,000
    1931 13,229,000 8,111,000 4,898,000 3,213,000 5,119,000 2,805,000 2,314,000
    1939 8,617,000 4,441,000 4,176,000
    1951 14,832,000 8,193,000 3,680,000 4,513,000 6,635,000 3,891,000 2,744,000
    1961 15,911,000 7,997,094 3,492,881 4,504,213 7,918,000 4,720,000 3,198,000
    1971 17,028,000 7,453,000 3,031,000 4,422,000 9,659,000 5,894,000 3,765,000
    1981 16,644,000 6,713,000 2,498,000 4,215,000 10,035,000 6,127,000 3,908,000
    1991 17,139,000 6,393,000 2,343,000 4,050,000 10,746,000 6,497,000 4,249,000
    2001 18,313,000 7,172,000 2,766,000 4,406,000 11,141,000 6,773,000 4,368,000
    2011 20,256,700 8,164,000 3,222,000 4,942,000 12,092,700 7,318,700 4,774,000
    Sources
    Census except 1939
    Greater London Authority, 1939


    The London Region

    The London region is composed of the Greater London Authority (GLA), which includes Inner London, the historical core municipality, covering approximately the same geographical area as the old London County Council from the 1890s to the 1960s and Outer London, the great suburban expanse consisting of detached and semi-detached housing.

    GLA is surrounded by the Greenbelt, established to contain the expansion of the urban area after World War II, and, at least at first, to decentralize London’s unhealthy and overcrowded conditions. Beyond the Greenbelt are the East of England and the Southeast, which are composed of a first exurban ring of historical county areas, adjacent to the Greenbelt, and a second ring of historical county areas in the East and Southeast, beyond the first ring. Virtually all new urban expansion in the London region was forced into the exurbs by the Greenbelt. As a result, all of the London region’s growth (6 million) since World War II has been outside the Greenbelt (Figure 1).

    Inner London

    Inner London has been a population growth miracle over the past two decades. The 2011 population was 3.2 million, up more than 450,000 from 2001 and nearly 900,000 since 1991. However, the 1991 figure of 2.3 million was more than one-half below the 5,000,000 peak reached in 1911. Even though historical core city losses are typical (where geography is held constant), Inner London’s loss was huge, at more double those sustained in Chicago (since 1950) and Paris (since 1921). The core of Inner London was developed as a walking city and expanded substantially with the coming of transit.  At approximately 26,000 residents per square mile (10,000 per square kilometer), Inner London is less than one-half the density of the ville de Paris and far less dense not only than Manhattan but even less dense than the New York City boroughs of Brooklyn and the Bronx.

    Yet despite the recent increases, inner London’s 2011 population is lower than counted in the 1861 census (yes, 1861) Even  with the population increase Inner London lost 390,000 domestic migrants (Figure 2) to other parts of Great Britain between 2001 and 2010 (the detailed 2011 data is not yet available at this level).

    Tower Hamlets, one of London’s 32 boroughs, is an example of this population roller-coaster. Tower Hamlets is located just to the east of the Tower Bridge in Inner London on the north bank of the Thames. It is home to substantial new development spurred by the rapid growth of the financial services industry both in the "square mile" ("city of London) and Canary Wharf. Tower Hamlets grew to 254,000 in 2011, a nearly 80 percent increase from the 142,000 registered in 1981, less than its 1801 population (Note: London Boroughs). But like Inner London, Tower Hamlets used to be much more populous, reaching a record for a London borough at 597,000 residents in 1901. It then lost more than 75 percent of its population over the next 80 years.  

    Outer London

    Outer London, which was combined into the Greater London Council in 1965 (and the Greater London Authority in 2000) also grew strongly, from 4.4 million to 4.9 million and is now at its peak population. Outer London’s population density is 10,000 per square mile (4,000 per square kilometer), approximately the same as the District of Columbia. Like Inner London, Outer London also lost domestic migrants, with a net 310,000 residents leaving for other parts of the United Kingdom (Figure 2).

    The Greenbelt

    Since World War II, the London urban area (principally composed of Inner and Outer London) has been surrounded by the Greenbelt on which development is not permitted. The Greenbelt ranges from 10 to 20 miles wide (25 to 50 kilometers) and covers more than three times the size of the Greater London Authority. The Greenbelt has been cited, along with related policies, with substantially raising house prices and contributing to London’s longer commutes than Paris, where there is no greenbelt.

    Exurban London

    Despite their more modest growth in the last decade, the exurbs have been effective in attracting net domestic migration. From 2001 to 2011, three was a net inflow of domestic migrants of 320,000 (Figure 2). Much of this appears to be people leaving London. During the last year, more than 50,000 residents of London moved to the exurbs. Net international migration to the exurbs had been fairly small earlier in the decade, but increased substantially in the later years. By 2009-2010, two thirds of the London region’s net international migration was to the exurbs, and only one-third to London.

    First Exurban Ring

    The first exurban ring includes the historical counties that border on the outside of the Greenbelt. These areas added approximately 550,000 residents between 2001 and 2011 and reached a new population peak, at 7.3 million.

    Second Exurban Ring

    The second exurban ring includes the counties of the East of England and the Southeast that are outside the first ring. These areas added more than 400,000 new residents, and reached a new peak population of 4.8 million.

    London and England

    In contrast to the 1991-2001 decade, the 2001-2011 decade indicated a significant slowdown in the share of England’s population growth in the London region. In the previous decade, all of England’s growth occurred in the greater London region. In the last decade, 50 percent of England’s growth took place around the capital. Overall, the core of London (Inner London) population has steadily fallen relative to the rest of England England’s while the suburbs and exurbs have grown to include one-third of England’s residents (Figure 3). So as Japan is moving to Tokyo, England is still moving to London, but not nearly so fast.

    Wendell Cox is a Visiting Professor, Conservatoire National des Arts et Metiers, Paris and the author of “War on the Dream: How Anti-Sprawl Policy Threatens the Quality of Life.”

    —-

    Note: London Boroughs: The 32 boroughs of London were defined after the creation of the Greater London Council in 1965 (which was abolished in 1986). The Greater London Authority provides data to show the historical population figures for the boroughs, going back to the initial census (1801). The new Greater London Authority was established in 2000, with less power than the previous Greater London Council. The 32 boroughs continue to operate, providing local public services.

    Photograph: London Suburbs (Outer London) by author

  • The Evolving Urban Form: Tokyo

    Tokyo is the ultimate in urbanization, being nearly one-half larger than any other urban area in the world. Further, Tokyo has retained its position as the largest urban area in the world for longer than any period since London’s approximately 100 year run from the early 1800s to the early 1900s. During the 1920s, New York became the largest, but was displaced by Tokyo in 1955.

    Tokyo became the world’s largest urban area by adding more than 20 million people between 1955 and 2000, adding more people than lived in any other urban area in the world during that period. Even with its now slow growth, Tokyo seems likely to remain number one for two decades or more. However, if the breakneck growth of urban areas like Jakarta, Delhi and Manila continues, Tokyo could relinquish its position by 2030, especially if Tokyo begins losing population, joining Japan in that country’s accelerating rate of population decline as is projected (below). 

    The Tokyo region is much more than Tokyo proper (the "ku-area"). It includes Yokohama, which with 3.7 million people is larger than any suburb in the world except for Howrah in the Calcutta area. Kawasaki, between Tokyo and Yokohama has a population of 1.4 million, while Saitama, to the north has 1.2 million. Chiba, on the way to Narita International Airport, is home to nearly 1,000,000. There are multiple possible definitions of the Tokyo region. This article defines the Tokyo metropolitan area as Chiba, Kanagawa, Saitama and Tokyo prefectures (Note 1).

    Suburban Areas: Tokyo also has the largest suburban population of any metropolitan region in the world. Approximately 26.7 million, or 75 percent of the Tokyo region’s 35.4 million population lives in suburban areas. This is the largest expanse of suburbanization in the world. The suburban population increase since 1950 exceeds that of New York, Los Angeles, and Paris combined (Note 2).

    The Core

    Tokyo is unique in having abolished its core municipality. In 1943, the former city of Tokyo was combined with the prefecture of Tokyo. This area was also labeled the Tokyo "metropolis." (Note 3) The prefecture of Tokyo contained a number of additional municipalities, which were not impacted by the merger, while the former area of the city of Tokyo was directly administered by the prefecture. In the intervening decades, the former city has been reorganized into 23 wards (ku), which have obtained considerable self-government authority, emerging as the near equivalent of cities themselves.

    This "ku" area can be considered the historical core municipality. The 23 ku reached a peak population in 1965 of 8.893 million in 1965. In the next 30 years, the 23 ku sustained a population loss of more than 900,000, while the suburban areas were adding more than 20 million. The ku area exceeded its previous peak in the 2010 census, reaching 8.946 million, approximately 50,000 more than in 1965.

    Growth Trends:

    Census data indicates that in 1940, the core accounted for 53 percent of the region’s population. This dropped to 41 percent in 1950, with the largest share of war-time population losses in the ku area. The core gained back to 47 percent of the population in 1960. After that, nearly all growth was in the suburbs. Between 1950 and 2000, 87 percent of the population gain was in the suburbs. In the last decade, the suburbs share of growth dropped to 63 percent (Figure 1 and Table)

    Tokyo Metropolitan Region
    Population by Sector: 1920-2010
    Year Tokyo Region Former City of Tokyo Balance of Tokyo Prefecture Tokyo Prefecture Kanagawa Prefecture Saitama Prefecture Chiba Prefecture
    1920    7,678,000  2,173,000     1,526,000     3,699,000   1,323,000   1,320,000   1,336,000
    1930    9,958,000  1,995,000     3,414,000     5,409,000   1,620,000   1,459,000   1,470,000
    1940  12,740,000  6,779,000        576,000     7,355,000   2,189,000   1,608,000   1,588,000
    1950  13,051,000  5,385,000        893,000     6,278,000   2,488,000   2,146,000   2,139,000
    1955  15,424,000  6,969,000     1,068,000     8,037,000   2,919,000   2,263,000   2,205,000
    1960  17,864,000  8,310,000     1,374,000     9,684,000   3,443,000   2,431,000   2,306,000
    1965  21,017,000  8,893,000     1,976,000   10,869,000   4,431,000   3,015,000   2,702,000
    1970  24,113,000  8,787,000     2,621,000   11,408,000   5,472,000   3,866,000   3,367,000
    1975  27,042,000  8,647,000     3,027,000   11,674,000   6,398,000   4,821,000   4,149,000
    1980  28,697,000  8,349,000     3,269,000   11,618,000   6,924,000   5,420,000   4,735,000
    1985  30,273,000  8,354,000     3,475,000   11,829,000   7,432,000   5,864,000   5,148,000
    1990  31,796,000  8,164,000     3,692,000   11,856,000   7,980,000   6,405,000   5,555,000
    1995  32,577,000  7,968,000     3,806,000   11,774,000   8,246,000   6,759,000   5,798,000
    2000  33,413,000  8,130,408     3,928,592   12,059,000   8,490,000   6,938,000   5,926,000
    2005  34,472,000  8,490,000     4,081,000   12,571,000   8,791,000   7,054,000   6,056,000
    2010  35,618,000  8,946,000     4,213,000   13,159,000   9,048,000   7,195,000   6,216,000
    Data from Census of Japan


    Generally, however the last decade has been far better for the core than in any period since 1960. Over each of the last two five year census periods, the percentage growth in the core has been greater than that of the suburbs, which, examining data from Europe, United States, Canada, and elsewhere is quite unusual.

    Density Comparisons

    Tokyo is often portrayed as one of the world’s highest density urban areas. It is not. At a density of 11,300 per square mile (4,300 per square kilometer), Tokyo is less dense than London (13,700 & 5,300), one-sixth the density of Hong Kong (67,000 & 25,900) and one-tenth the density of Dhaka (115,000 & 44,400). There are two reasons for this:

    1. Tokyo does not have intensely dense central areas. The ku area has a density of 37,300 per square kilometer (14,400 per square kilometer). This is well below the densities of Manhattan (69,000 & 27,000) and the ville de Paris (51,000 & 21,000). Only one of the ku (Toshima) exceeds the density of Paris.
    2. Further, according to the Japan House and Land Survey of 2008, Tokyo has a large stock of detached houses, by definition lower density. Nearly 45 percent of the Tokyo region’s housing is detached. One-third of the dwellings within 30 kilometers (18 miles) of the core are detached. This figure rises to more than 60 percent outside 30 kilometers from the core and 85 percent between 60 and 70 kilometers (37-43 kilometers) from the core (Figure 2).

    Transport

    Tokyo is a transit oriented metropolis, with by far the highest transit usage in the world. In 2007, 65 percent of trips within a 50 mile radius were by mass transit. Overall transit usage is (passenger miles or kilometers) in the Tokyo region is approximately double that of all combined usage in the United States and nearly 10 times that of Paris, according to the Millennium Cities Data base. At the same time, one-way work trip travel times are reported to be the highest in the high income world, at a median of 45.9 minutes (Note 4) for main earners. Work trip travel times from residences are the shortest from the most remote residential locations (60-70 kilometers from the core) at a median of 26 minutes and at 29 minutes from residences between 50 and 60 kilometers from the core. Median travel times are 36 minutes one way within 10 kilometers of the core (Figure 3). The longest commutes are from residences located between 10 and 50 kilometers from the core (6 to 31 miles), which peak at 54.5 minutes each way between 20 and 30 kilometers (12 and 18 kilometers) from the core.

    Toward a City State?

    Japan has been centralizing for decades, principally as rural citizens have moved to the largest metropolitan areas. Since 1950, Tokyo has routinely attracted much more than its proportionate share of population growth. In the last two census periods, all Japan’s growth has been in the Tokyo metropolitan area as national population growth has stagnated. Between 2000 and 2005, the Tokyo region added 1.1 million new residents, while the rest of the nation lost 200,000 residents. The imbalance became even starker between 2005 and 2010, as Tokyo added 1.1 million new residents, while the rest of the nation lost 900,000. (Figure 4)

    Eventually, Japan’s imploding population will finally impact Tokyo. Population projections indicate that between 2010 and 2035, Tokyo will start losing population. But Tokyo’s loss, at 2.1 million, would be a small fraction of the 16.5 million loss projected for the rest of the nation (Figure 5). If that occurs, Tokyo will account for 30 percent of Japan’s population, compared to 16 percent in 1950. With Japan’s rock-bottom fertility rate, a declining Tokyo will dominate an even larger share of the country’s declining    population and economy in the coming decades.

    Wendell Cox is a Visiting Professor, Conservatoire National des Arts et Metiers, Paris and the author of “War on the Dream: How Anti-Sprawl Policy Threatens the Quality of Life.”

    Photo: Yamanote Loop Train, Tokyo Station (by author)

    Note 1: The government defines a Tokyo major metropolitan area, using smaller area data. However, insufficient data is readily available for this article.

    Note 2: These three urban areas have the largest suburban populations in the high income world outside Tokyo and Osaka-Kobe Kyoto.

    Note 3: The term "Tokyo metropolis," has misled any number of analysts to believe that it means the Tokyo metropolitan area. In fact, it means only the prefecture of Tokyo, which is only one of the from one of the from four to eight prefectures (part or all) that can be considered a part of the metropolitan area, depending on the definition. Thus any comparison of the "Tokyo metropolis" with anything else in metropolitan in the world is best dismissed out of hand.

    Note 4: Based on an analysis of the detailed data, it is estimated that the one-way average work trip travel time is more than 48 minutes.

  • The Evolving Urban Form: Cairo

    Cairo, Egypt’s capital, has long had some of the highest neighborhood population densities in the world. In the 1960s it was reported that one neighborhood had a density of 353,000 people per square mile (136,000 per square kilometer). The most recent data from the Egypt’s statistical authority (the Central Agency for Public Mobilisation and Statistics or CAPMAS) indicates that within the Cairo governate (the province in which the municipality of Cairo is located), the overall urban population density is 117,000 per square mile, or 45,000 per square kilometer. This means that urbanization in the Cairo governate is more than 1.5 times the population density of Manhattan (in New York city) and the ville de Paris.

    In recent decades, government officials have undertaken a program to encourage people to decentralize their living and work arrangements, and to move to several new towns in the area.

    Overall, the governates that comprise the Cairo metropolitan area have a population of approximately 20.5 million, according to a CAPMAS 2012 estimate. This is approximately the same size of metropolitan areas such as New York and Mexico City. The Cairo metropolitan area is comprised of three governates, which are principally urban, but which also contain millions living in rural areas:

    The governate of Cairo (Al Qāhirah) is the largest of these jurisdictions. Parts of the Cairo governate and the Giza government would be considered in the urban core, but the political jurisdictions in Cairo do not lend themselves well to conventional core versus suburban designations (Note 1). The Cairo governate is located on the east bank of the Nile River, and spreads many kilometers, especially to the East and South. This area includes the Cairo international airport and Heliopolis, one of the most affluent areas in the Cairo metropolitan area. The governate of Cairo also includes "New Cairo," an attractive new town located in the southeastern quadrant. This area includes a number of university campuses, multi-story condominium buildings and detached housing. Eventually, New Cairo is expected to have 4,000,000 residents, though the new town is little more than a decade old and still has a modest population of approximately 125,000.


    New Cairo: University

    The governate of Giza (Al Jīzah) is located on the west bank of the Nile River and, in reality, constitutes a continuation of the urban core. Giza is home the Great Pyramids, which rise on a hill from the western urban fringe. Giza is also home to considerable informal housing development   much different than generally found in other megacities. Much of the development is high rise, with concrete block buildings rising seven and more stories from the streets. Generally, the streets are so narrow and irregular that they are not shown on local maps. The governate of Giza also includes the "6th of October" new town, located on the west side of the hills on which the Great Pyramids stand. Eventually, 6th of October is expected to have a population of 3,000,000, though it appears to be less than 500,000 today. The governate of Giza also includes the Sheihk Zayed new town. These new towns have commercial activities, multi-story condominiums and detached housing.


    Sheikh Zayed: Detached Housing


    Giza: Informal Housing

    The governate of Kalyoubia (Al Qalyūbīyah) is located to the north of the Cairo and Giza governates. Unlike Cairo and Giza, Kalyoubia has a majority of its population living in rural areas. However, the continuous urbanization of Cairo stretches into the governate and includes more than 1.5 million people, much of it in the municipality of Shubrā al-Khaymah.

    Slowing Growth: Like many of the developing world’s megacities, Cairo has experienced its strongest growth in the half century after World War II. In 1937, the metropolitan area had a population of under 3 million. This more than doubled to 7 million by 1966, and again to 14 million by 1996.  From 1996 to 2012, the metropolitan area added 5.5 million people (Note 2). However, more recently, the growth rate has slowed considerably. Between 1996 and 2006, metropolitan Cairo added 28 percent to its population (an increase of more than 4,000,000). However the 2006 to 2012 rate would indicate that by 2016, Cairo is likely to add only 13 percent to its population (approximately 2,000,000 people).

    While the governates of the Cairo metropolitan area do not lend themselves well to urban versus suburban population analysis, Cairo clearly has expanded geographically as it has added population. The more central governates of Cairo and Giza have continued to grow, however much of the growth has been in peripheral areas, such as New Cairo, 6th of October and the Helwan area, south of Cairo on the Nile (in the Cairo governate).

    Where the Growth is Occurring: Even so, the governate of Cairo accounted for only 19 percent of the metropolitan area’s growth from 2006 to 2012, down from 34 percent in the 1996 to 2006 period. The governate of Giza had the greatest growth between 2006 and 2012, at 47 percent of metropolitan growth, an increase from the 39 percent of 1996 to 2016. The governate of Kalyoubia accounted for 34 percent of the growth from 2006 to 2012, an increase from 26 percent between 1996 and 2016 (Figure 1).

    Cairo’s Physical Expansion: Even though the suburban versus core analysis is difficult to gauge from governate data, a paper by Mootaz Farid and Hatam Al Shafie of Cairo University contains depictions of the urban footprint from 1943 to 1982. In each of the depicted years, the continuous urbanization of Cairo covers only a miniscule share of the present urban footprint. Figure 2 provides an estimate of the urban footprint in 1968 compared to the 2012 urban footprint, indicating that much of the growth was on the periphery.

    The Key to Decentralization: The key to making the new towns successful in attracting more residents lies with the dispersion of employment. There is a wealth of international experience to indicate that "self-sufficient" new towns really cannot be self sufficient if they are within commuting distance of the rest of the urban area. In the case of Cairo (as elsewhere) it will prove critical to ensure that there are substantial local employment opportunities for new town residents, although it is likely that a serious degree of self sufficiency may prove difficult to achieve.

    Wendell Cox is a Visiting Professor, Conservatoire National des Arts et Metiers, Paris and the author of “War on the Dream: How Anti-Sprawl Policy Threatens the Quality of Life.”

    Top Photograph: The Great Pyramid (Giza). All photos by author

    ——

    Note 1: In the past decade there  have been reorganizations of governates in the Cairo metropolitan area. This article uses three present governates for all years.

    Note 2: Earlier population data is from http://statoids.com/ueg.html.

  • The Evolving Urban Form: Shenzhen

    No urban area in history has become so large so quickly than Shenzhen (Note 1). A little more than a fishing village in 1979, by the 2010 census Shenzhen registered 10.4 million inhabitants. It is easily the youngest urban area to have become one of the world’s 26 megacities (Figure 1). Most other megacities were the largest urban areas in their nations for centuries (such as London and Paris) and a few for more than a millennium (such as Istanbul and Beijing). Shenzhen’s primitiveness can be seen in this 1980 internet photo, and shows the beginnings of construction. A 2006 photograph of one of Shenzhen’s principal streets (Binhe Avenue) is above.

    Pearl River Delta Location: Shenzhen is located in Guangdong Province adjacent to Hong Kong’s northern border. Shenzhen is China’s fourth largest urban area, following Shanghai, Beijing, and Guangzou-Foshan.

    Along with Dongguan, Guanzhou, Foshan and smaller neighbors, Shenzhen forms the Pearl River Delta,   the world’s largest manufacturing center. The Pearl River Delta, along with Hong Kong and Macau, constitutes the world’s largest populated extent of urbanization, with nearly 50 million people. They live in a land area of just over 3,000 square kilometers (7,800 square kilometers. By comparison the world’s largest urban area, Tokyo-Yokohama, has a population of 37 million and covers 3,300 square miles (8,500 square kilometers). I recall from a Hong Kong to Guangzhou trip on the Canton-Kowloon Railway in 1999 that there was plenty of rural territory on the 100 mile (170 kilometers) route. Today,   development takes place along virtually the entire route (Note 2).

    The Special Economic Zone: Shenzhen was established as China’s first special economic zone by Deng Xiaoping in the period of liberalization after the death of Mao Zedong. The special economic zones allowed for alternative, generally market oriented reforms, with the end of improving economic growth. The result was economic progress far greater than anyone expected. The special economic zone program was eventually extended to several other urban areas in the nation.

    Some governmental officials preferred the previous state dominated approach, despite its greater poverty and sought to roll back the reforms. This threat reached its peak in the early 1990s, after Deng Xiaoping had retired from his government positions. In response, Deng undertook his renown "southern tour" to Shenzhen, Guangzhou and other parts of Guangdong province to promote the new economic approach and the progress that had been made. During the southern tour, Deng is reputed to have said that "to be rich is glorious." Three decades before he had said “I don’t care if it’s a white cat or a black cat. It’s a good cat as long as it catches mice." He committed to results rather than to ideology, in a sense Shenzen and its environs are the engines of non-state owned prosperity. Eventually, the publicity from Deng’s southern tour overwhelmed the opposition and China accelerated its move toward a more open economy.

    Shenzhen’s Core: Unlike the fast growing, but much smaller new urban areas of the United States (for example Phoenix, which is largely a low rise, dispersed expanse of suburbanization), Shenzhen has developed a dense central business district. Even though Shenzhen started the decade of the 1990s with little more than 1,000,000 residents, by 1996 it had the fourth tallest building in the world, the Shun Hing Tower. Only the Sears Tower in Chicago and the two World Trade Center Towers in New York were taller.

    In 2011, the Shun Hing Tower lost its local tallest building title to the Kingkey Financial Tower, at 1,449 feet (447 meters) is the 10th tallest building in the world. Now, the world’s second tallest building is under construction in Shenzhen, the Ping An International Financial Center, which is reported to reach 2,125 feet or 655 meters, with 116 floors. Only the Burj Khalifa (2,717 feet, 828 meters, 163 floors) in Dubai would be higher. Like Shanghai and Chongqing (and unlike most Chinese urban areas), Shenzhen has a highly concentrated central business district. As a result deserio.com rates Shenzhen’s skyline as 9th in the world (Note 3).

    Outer Areas Growing Faster: The three central districts (the qu of Futian, Luohu and Nanshan) grew from 2.4 million to 3.3 million population between 2000 and 2010, a rate of 38 percent. However, as is natural for a growing urban area, most of the growth was in the outer districts (Photo: Suburban Shenzhen), which grew from 4.6 million to 7.0 million, a growth rate of 52 percent. Thus, nearly three-quarters of the growth was on the periphery (Figure 2). Population growth in the earlier 1990 and 2000 period was slightly less concentrated in the outer area (68 percent). But overall  population growth has begun to slow down, with Shenzhen added 3.3 million new residents, compared to 4.3 million between 1990 and 2000.  


    Photo: Suburban Shenzhen (Longgang)

    The Urban Area: Overall, it is estimated that the Shenzhen urban area (area of continuous development) has a 2012 population of 11.9 million, with a land area of 675 square miles (1,745 square kilometers). The urban area has now crossed the border into the Huiyang district of the Huizhou region, to the east. The population density is estimated at 17,600 per square mile, or 6,800 per square kilometer,  approximately 10 percent less dense than the average urban area in China. Shenzhen is about one quarter the density of Hong Kong and double the density of Paris.

    Rich and Poor in Shenzhen: Like all urban areas, Shenzhen is a mixture of rich and poor. Shenzhen is generally considered one of the most affluent urban areas in China, yet it also has a very large low income population. Approximately one-sixth of China’s residents are considered to be temporary migrants; many work in boomtowns like Shenzhen. Seven million of these 220 million migrants live in Shenzhen,  considered the largest migrant population of any region in the nation. Migrants are attracted to Shenzhen for the same reasons people have moved to cities from early on: to get ahead. At the same time, their remittances sent back home are contributing to improved living conditions far beyond Shenzhen. It is expected that reforms to the "hukou" system of residence permits will allow many of the temporary migrants in Shenzhen and elsewhere obtain permanent residence status. Many of the migrants live in factory housing, or older, very densely packed buildings. At the same time, Shenzhen has a large number of world-class condominium buildings.


    Photo: Older Housing: Central Business District


    Photo: Newer Housing: Central Business District

    The Future of Shenzhen: Much of Shenzhen’s future will depend upon the economy of the Pearl River Delta and the extent to which migrants are able to obtain permanent residency status. There is still land enough in the region for substantial population growth. The longer term integration of the Hong Kong and Shenzhen economies could produce an even larger economic dynamo than the two that are currently separate. One thing is certain, however. Shenzhen has led China into a new economic and urban reality.

    Wendell Cox is a Visiting Professor, Conservatoire National des Arts et Metiers, Paris and the author of “War on the Dream: How Anti-Sprawl Policy Threatens the Quality of Life”.

    —–

    Note 1: Shenzhen is one of China’s regions, often called "cities," as translated from "shi."  "Shi" more resemble regions than "cities" in the non-Chinese sense, this article refers to "shi" as regions. "Shi" were formerly referred to in English as prefectures. A province is usually composed of "shis" and other "shi" level jurisdictions.

    Note 2: These combined regions are not a metropolitan area, for two reasons. First; there is little daily commuting between them and thus they are not a single labor market, which is the definition of a metropolitan area. Second, one of the regions, Hong Kong, has a border with Shenzhen that has international style customs and immigrant controls, which further precludes the two adjacent regions from being a single metropolitan area. In the longer run, greater affluence, greater mobility between the regions and relaxation of border controls could merge some or all of the now separate metropolitan areas.

    Note 3: Desiro.com, unlike some other skyline rating systems, places a premium on the density of buildings, rather than simply amalgamating building heights from throughout an urban area.

    Photo: Shenzhen:  Binhe Avenue from the Shun Hing Tower (by author)

  • The Evolving Urban Form: Osaka-Kobe-Kyoto

    Osaka-Kobe-Kyoto is Japan’s second largest urban area and ranks as the 12th largest urban area in the world. With a population of approximately 17,000,000 and a land area of 1240 square miles (3200 square kilometers), Osaka-Kobe-Kyoto has a population density of 13,700 per square mile (5,200 per square kilometer), making it the most dense major urban area in Japan and among the denser urban areas in the high income world. The larger metropolitan region includes four prefectures, Osaka, Kyoto, Kyoto and Nara (Figure 1).


    Adapted from WikiCommons user Kzaral

    World’s Largest Conurbation

    Osaka-Kobe-Kyoto is a conurbation, an urban area that has grown together from multiple cores (here, the urban areas of Osaka, Kobe and Kyoto). Most urban areas grow concentrically from a single core. In the process their suburban growth can engulf and incorporate smaller urban areas (such as Gifu in Nagoya, Bogor in Jakarta or Newark in New York), However, conurbations — such as  Rhine-Ruhr region in Germany (Essen, Dortmund, Duisburg, and Bochum), Katowice-Gliwice-Tychy (upper Silesia) in Poland, Dallas-Fort Worth and Minneapolis-St. Paul in the United States — develop when major urban areas grow together (or merge), forming a larger urban area.  

    The municipality of Osaka, the largest in the region, long had been Japan’s second municipality exceeded by Yokohama (in the Tokyo region) in 1980; in the 17th century it was the country’s commercial capital. Kobe, across Osaka Bay (20 miles or 32 kilometers), was one of the most cosmopolitan cities and was the site of the devastating 1995 earthquake, from which it has recovered remarkably. Kyoto is the former, historic, imperial capital as is 35 miles (55 kilometers) north of Osaka. The previous imperial capital, the historic municipality of Nara is also located in the region. Both cities are well known for its historic temples.

    Post-War Growth

    Between 1950 and 1970, the Osaka-Kobe-Kyoto region experienced extraordinary growth, adding nearly 5.7 million residents. The increase from 9.8 million to 15.5 million exceed that of all urban areas in the world except Mexico City (approximately 6 million) and Tokyo (11 million). Tokyo’s 20 year increase was the largest numerically in history for a metropolitan region. By comparison, Los Angeles, the Western world’s fastest growing metropolitan region between 1950 and 1970, added 5.0 million new residents. In 1970, only the Tokyo and New York urban areas were larger than Osaka-Kobe-Kyoto.

    The region grew quickly after the Second World War but experienced an even higher growth rate — well in excess of two percent during Japan’s great economic takeoff in the 1960s. During the 1970s, the annual growth rate dropped to 1.5%, still well above the current experience of most high income urban areas.

    Stagnating Growth, Presaging Decline

    As it turned out, the 1970s represented the conclusion of Osaka’s strong growth. From then on, growth fell quickly and   has since virtually stopped. It  appears likely that Osaka-Kobe-Kyoto will become the world’s first megacity (over 10 million population) to fall into population decline (see  end note).

    According to the 2010 census, the metropolitan region’s population of approximately 18,500,000 barely grew, adding only 13,000 residents from 2005. This represents  an annual growth rate of 0.014%, a decline of 60% from its anemic  0.036% growth rate between 2000 and 2005 (Figure 2).

    Osaka-Kobe-Kyoto’s is falling behind even Japan’s slow growth pace, being 2005 to 2010 expanding by  less than one third of the national rate. One reason for this lies in continued concentration in the Tokyo metropolitan region (Figure 3). The Tokyo area captured 56% of the growth between 1970 and at 2010. Over the past five years Tokyo has added 1.1 million people, while the balance of the nation lost 1.4 million people. Japan’s population has stabilized and is expected to fall into decline in the years to come.

    Suburban Expansion

    As is typical of major metropolitan regions in the world virtually all of the growth in Osaka-Kobe-Kyoto since 1950 has been outside the historically core municipalities. Only 150,000 of the 6,250,000 population increase from 1950 to 2010 was in the municipalities of Osaka, Kobe or Kyoto. The suburbs accounted for nearly 98% of the region’s growth.

    As growth came to a virtual stop, however, the historical core municipalities have done better. Between 2000 and 2010, the municipalities of Osaka, Kobe and Kyoto had added 125,000 people, while suburban areas lost 79,000. The net result was a 46,000 population increase between 2000 and 2010 (Table).

    Osaka-Kobe-Kyoto Metropolitan Region
    Population Trend: 1920-2010
    Historical Core Municipalities
    Year Osaka Kobe Kyoto Total Suburban Region
    1920 1,253 609 591 2,453 4,289 6,742
    1930 2,114 765 788 3,667 4,668 8,335
    1940 3,252 1,090 967 5,309 5,056 10,365
    1950 1,956 765 1,102 3,823 5,941 9,764
    1960 3,012 1,114 1,285 5,411 6,774 12,185
    1970 2,980 1,289 1,419 5,688 9,780 15,468
    1980 2,648 1,367 1,473 5,488 11,866 17,354
    1990 2,623 1,477 1,461 5,561 12,556 18,117
    2000 2,599 1,494 1,468 5,560 12,883 18,443
    2005 2,629 1,525 1,475 5,629 12,847 18,476
    2010 2,666 1,545 1,474 5,685 12,804 18,489
    In 000s
    Data from Census of Japan


    Transport in Osaka-Kobe-Kyoto

    With its high density, Osaka-Kobe-Kyoto has a high level of traffic congestion. Osaka-Kobe-Kyoto ranks 19th highest road traffic density out of more than 90 urban areas for which data is available in the Millennium Cities database. This traffic density is despite the fact that Osaka-Kobe-Kyoto has the highest mass transit market share of any high-income world megacity outside Tokyo. In 2007, 57 percent of trips in the metropolitan region were by mass transit, compared to Tokyo’s 65 percent. By comparison, mass transit’s market share is approximately 30 percent in the Paris region and 10 percent in greater New York. The annual number of transit trips in Osaka-Kobe-Kyoto alone is more than one-half the total US ridership, despite having a population only 6% of the US.

    However, lest any conclude that Osaka-Kobe-Kyoto (or Tokyo) might be a model for US or European metropolitan areas, it must be noted that transit’s market share has dropped from 80 percent in the late 1980s.   Osaka-Kobe-Kyoto (as well as Tokyo and Nagoya) also demonstrate the "mass transit cannot be profitable" claim is a myth. In each of these three metropolitan areas, the vast majority of transit travel is on profitable private suburban railways.

    Osaka-Kobe-Kyoto: The Future?

    Very few large metropolitan areas have experienced population declines, and none with the vast scale and historic importance of Osaka-Kobe-Kyoto. Smaller metropolitan areas like Pittsburgh, Cleveland, Liverpool, Manchester and Genoa have stagnated and even experienced periods of population decline. But none have faced a future bleaker  than likely for Osaka-Kobe-Kyoto. United Nations population projections indicate that Japan will decline in population by 20 percent between 2010 and 2050. As the nation’s economic activity continues to centralize in Tokyo, this could be particularly be ominous for Osaka-Kobe-Kyoto. The trains could get less crowded.

    Wendell Cox is a Visiting Professor, Conservatoire National des Arts et Metiers, Paris and the author of “War on the Dream: How Anti-Sprawl Policy Threatens the Quality of Life

    —–

    Note: New York is reputed to have become the first megacity in the world in the 1920s. As late as 1980, there were only five urban areas in the world with more than 10 million residents. In 2010 there were 25 megacities.


    Photo: Himeji Castle, Kobe Prefecture. By Jean Love

  • The Evolving Urban Form: Ho Chi Minh City (Saigon)

    Vietnam may be the next China. With a nominally communist government, Vietnam has liberalized its markets and is prospering from an increased reliance on exports. Vietnam’s gross domestic product per capita is still only about $3000, but has been among the faster growing economies over the past 10 years. Vietnam is well positioned to capture any growth that might be diverted from China’s east coast urban areas as labor costs there rise and concerns increase about the influence of that country’s powerful state-owned corporations.

    Political power in Vietnam may lie in Hanoi, but the economic heart of Vietnam is Ho Chi Minh City, the former Saigon. Ho Chi Minh City is the core of Viet Nam’s largest urban area, which is headed toward a population of 9 million, including exurban areas beyond the municipal boundaries.

    For planning purposes, the area has been divided into five subregions. The urban development trends in the Ho Chi Minh City area are similar to those of high income world urban areas. The core is experiencing little or no population growth, while peripheral areas are growing much more strongly (Photo: Core and Saigon River).


    Core and Saigon River

    Suburbanizing Ho Chi Minh City: Historical data for the districts of Ho Chi Minh City are difficult to obtain. However, the last five years provide a representative view of urban development trends, especially when combined with population projections through 2025 as reported in transportation planning documentation from the Ho Chi Minh City master plan.

    The inner core area has a population of approximately 1.4 million, with little growth expected, and is expected to decline in population by 2025. At the same time, the inner core is particularly dense, with more than 100,000 residents per square mile or 40,000 residents per square kilometer. This is approximately 1.5 times as dense as Manhattan or the ville de Paris. By 2025, the inner core will decline further to a population of 1.3 million. One unusual distinguishing characteristic of the core is very thin buildings, the result of taxation based upon building width (Photo: Tax induced thin buildings)


    Tax induced thin buildings

    Growth is stronger, but still limited in the outer core area (adjacent to the core, but differentiated because of its lower density). Over the past five years, the outer core grew from approximately 2.2 million to 2.5 million, which is strong growth in most high income world urban areas but not as notable for a rapidly growing urban area in the developing world. This growth is expected to moderate even further by 2025, when the population is expected to reach only 2.6 million. The population density in the outer core area is 60,000 per square mile or 23,000 per square kilometer.

    In contrast, almost all  the growth is expected outside the core, with both less formal development and very attractive housing (Photo: New suburban housing).


    New suburban housing

    The urban fringe areas, or the second ring of development beyond the inner core grew from 1.5 million in 2004 to 2.0 million in 2009, a 31% growth rate. By 2025, the urban fringe is projected in transportation planning documentation to grow to 3.0 million. The population density of the urban fringe is 14,500 per square mile or 5,500 per square kilometer, nearly as dense as the city (municipality) of San Francisco.

    The suburban areas within the municipality of Ho Chi Minh City grew from 1.0 million in 2004 to 1.3 million in 2009, again approximately a 30% growth rate. By 2025, the suburban areas are expected to experience the greatest growth, adding 1.6 million population, rising to 2.9 million residents.

    Comparable data for the exurban areas outside the Ho Chi Minh City municipality are not as readily available. However, it is projected that from 2007 to 2025 the population in these areas will rise from 2.6 million to 4.1 million.

    Overall, the municipality grew from 6.1 million population in 2004 7.2 million in 2009, for an 18% growth rate. Including the municipality and the exurbs, it is expected that there will be an increase from 9.1 million population in 2007 to 13.9 million in 2025. At least 95% of this growth is expected to be outside two core areas (Figure 1).

    Employment growth is also projected to be dominated by areas outside the two core areas. Between 2007 and 2025, it is expected that 80% of the new employment will be in peripheral areas.

    Building a Metro: Ho Chi Minh City may have the highest personal transportation market share outside North America. The personal vehicle (motorcycle and car) share of travel is 92%, leaving just 8% for transit (one estimate indicates an even lower 5%). Most of this travel by motorcycle, which sometimes carry three or more people.  As Ho Chi Minh City becomes more prosperous, the share of travel by automobile will likely increase. Automobile ownership is rising at 20 percent annually, more than twice the rate for motorcycle ownership.

    The government would like to change this pattern and has embarked on building a Metro in hopes of increasing transit’s market share to between 40% and 50% by 2025. This huge capital investment will be largely limited to feed and serve the core areas that will account for virtually none of the population increase and little of the new employment.

    There is no precedent for an increase in transit usage remotely of the magnitude that is sought in Ho Chi Minh City. In fact, consultants for the Asian Development Bank were so concerned that they provided an alternative projection for the system, indicating a 2025 transit market share of 22%, instead of the official goal of 40% to 50%. The consultants indicated:

    As noted earlier, the above demand models were adjusted to reflect the Government “policy” objective of achieving 40-50% PT mode share by 2025. This will entail a massive shift in travel behaviour and introduction of some very strong transport and policy initiatives. Clearly there is a risk that this may not happen as quickly or to the extent targeted. Therefore forecasts were developed for a “trend” scenario – still based on major PT transport improvements and strong policy initiatives, but with parameter values based on the consultants’ experience of what has been achieved in other cities.

    However, virtually tripling transit’s market share to 22% seems little less doubtful than increasing it to 40% to 50%. The consultant provided no examples to indicate that such an increase had "been achieved in other cities."

    Personal Mobility in Ho Chi Minh City: One of the challenges for a pedestrians in Ho Chi Minh City – like Hanoi – is dodging the swarm of motorcycles in crossing streets. Even with the Metro, more and more will buy motorcycles and cars. Traffic congestion is likely to worsen. This is principally because, even in congested urban areas, door to door travel tends to be more rapid by personal modes than by transit.

    Fortunately, the authorities are allowing the urbanization to expand, which will limit the growth of traffic congestion. They would do well to follow the advice of urban planners like Shlomo Angel (of New York University and Princeton University), who recommends building a grid of arterials streets to accommodate the growth on lower cost peripheral lands.   Strategies such as these provide Ho Chi Minh City the potential to suburbanize gracefully, maintain its high level of personal mobility and contribute substantially to its continued economic progress.

    Wendell Cox is a Visiting Professor, Conservatoire National des Arts et Metiers, Paris and the author of “War on the Dream: How Anti-Sprawl Policy Threatens the Quality of Life

    Top photo: Typical transport in Ho Chi Minh City

    All photos by author

  • The Evolving Urban Form: Hong Kong

    Hong Kong has experienced its slowest decadal growth in at least 70 years, according to the results of the recently released 2011 census. Between 2001 and 2011, Hong Kong added only 5.4 percent to its population, a decline of more than two-thirds from its 1991-2001 rate. Hong Kong’s slowest growth rate since 1921-1931 was between 1981 and 1991, when 13.8 percent was added to its population. In previous decades growth had been much greater (Figure 1).

    Further, despite Hong Kong’s much larger population base today, the numeric growth from 2001 to 2011 was also the smallest since the 1921-1931 decade. Hong Kong added 363,000 residents for a total of 7,072,000 in 2011. The increase is barely one-third of the 1,034,000 residents added between 1991 and 2001. Much of Hong Kong’s population growth in the last 60 years had been driven by its better standard of living relative to mainland China. It seems likely that the growing prosperity of the past decade on the mainland has made Hong Kong less attractive for migrants.

    High Income World’s Most Dense Urban Area: Hong Kong continues to be the densest major urban area in the high-income world. The present density is estimated at 67,000 per square mile (26,000 per square kilometer). At least one small area of Hong Kong has a population density exceeding 1 million per square mile (400,000 per square kilometer), though the much more dense Kowloon Walled City (estimated at up to 5,000,000 per square mile or 2,000,000 per square kilometer) was demolished in the 1990s. Even so, there are now detached housing developments, as Hong Kongers who can afford it choose these much more expensive accommodations, as Witold Rybczynski relates in a recent commentary (detached housing photo).

    Detached Housing

    Subdivisions of Hong Kong: The Hong Kong Special Administrative Region (HKSAR) is a unified government, with no local jurisdictions (such as cities or towns).  However, there are four broad regions and within each there are districts, are designated for statistical purposes.

    Hong Kong’s growth — like that of most major metropolitan areas — has been shifting to the periphery for decades (Table 1). Between 1981 and 2011, all of the population growth was in the New Territories, the new (greenfield and high density) suburban areas beyond the Hong Kong Island-Kowloon core. While all of Hong Kong was adding 2.1 million residents in total between 1981 and 2011, the New Territories added 2.4 million (Table 2). This suburban dominance continued in the last census period, with 96 percent of growth in the New Territories. Before that, the bulk of the growth was in the outer areas of Kowloon, which were then the suburbs (Figure 2).

    Table 1
    Hong Kong Population by District: 1911-2011
    Year Total Hong Kong Kowloon New Territories Marine
    1911 456,700 244,300 69,400 81,200 61,800
    1921 625,200 347,400 123,400 83,200 71,200
    1931 840,500 409,200 263,000 98,200 70,100
    1941 1,600,000 Estimate: No complete census
    1951 2,013,000 Estimate: Census cancelled
    1961 3,129,600 1,004,900 1,578,000 409,900 136,800
    1971 3,936,600 996,200 2,194,800 665,700 79,900
    1981 4,986,600 1,183,600 2,449,100 1,304,100 49,700
    1991 5,674,100 1,251,000 2,030,700 2,374,800 17,600
    2001 6,708,400 1,335,500 2,024,000 3,343,000 5,900
    2011 7,071,600 1,270,900 2,108,400 3,691,100 1,200
    Sources:
    Government of Hong Kong
    www.cicred.org/Eng/Publications/pdf/c-c21.pdf
    Table 2
    Hong Kong Population by District: 1991-2011
    Region & District Population: 1991 Population: 2001 Population: 2011 % 2001-2011 Land Area KM2 Land Area MI2 Density KM2 Density MI2
    HONG KONG 5,674,114 6,708,389 7,071,576 5.4% 1,098 424 6,440 16,680
    HONG KONG ISLAND 1,250,993 1,335,469 1,270,876 -4.8% 80 31 15,827 40,991
      Central and Western 253,383 261,884 251,519 -4.0% 13 5 20,089 52,031
      Wan Chai 180,309 167,146 152,608 -8.7% 10 4 15,230 39,447
      Eastern 560,200 616,199 588,094 -4.6% 19 7 31,265 80,976
      Southern 257,101 290,240 278,655 -4.0% 39 15 7,154 18,529
    KOWLOON 2,030,683 2,023,979 2,108,419 4.2% 47 18 45,138 116,909
      Yau Tsim Mong 282,060 282,020 307,878 9.2% 7 3 44,946 116,409
      Sham Shui Po 380,615 353,550 380,855 7.7% 9 4 40,175 104,052
      Kowloon City 402,934 381,352 377,351 -1.0% 10 4 37,849 98,028
      Wong Tai Sin 386,572 444,630 420,183 -5.5% 9 4 44,891 116,268
      Kwun Tong 578,502 562,427 622,152 10.6% 11 4 56,303 145,826
    NEW TERRITORIES 2,374,818 3,343,046 3,691,093 10.4% 971 375 3,801 9,845
      Kwai Tsing 440,807 477,092 511,167 7.1% 22 8 23,427 60,675
      Tsuen Wan 271,576 275,527 304,637 10.6% 61 23 5,019 12,999
      Tuen Mun 380,683 488,831 487,546 -0.3% 84 33 5,773 14,953
      Yuen Long 229,724 449,070 578,529 28.8% 138 53 4,179 10,824
      North 165,666 298,657 304,134 1.8% 137 53 2,215 5,737
      Tai Po 202,117 310,879 296,853 -4.5% 147 57 2,014 5,215
      Sha Tin 506,368 628,634 630,273 0.3% 69 27 9,074 23,501
      Sai Kung 130,418 327,689 436,627 33.2% 136 53 3,201 8,291
      Islands 47,459 86,667 141,327 63.1% 175 68 807 2,091
    MARINE 17,620 5,895 1,188 -79.8% 0 0 0 0
    Data from Government of Hong Kong Special Administrative Region


    The Core: Hong Kong Island: Hong Kong Island, home to one of the world’s most dense central business districts (Central, Western and Wan Chai districts) lost 4.8 percent of its population. All five of the districts on Hong Kong Island lost population, with Wan Chi (of "The World of Suzy Wong" movie fame) suffering the greatest loss, at 8.7 percent).

    The Core: Kowloon: Across Hong Kong harbor (see Star Ferry photograph, top), Kowloon, also a part of the core, gained 4.2 percent, adding nearly 75,000 residents (photo). Even so, Kowloon’s population remains more than 10 percent below its 1981 population. Three of Kowloon’s  five districts gained population, including Yau Sim Mong and Sham Shui Po, which along with the north shore districts of Hong Kong Island are the most intensely developed in the HKSAR.

    Suburban: The New Territories: The New Territories added 10.4 percent to their population (348,000), with seven of the nine districts gaining. The largest gain (63 percent) was in the Islands district, which includes Hong Kong International Airport. Sia Kung, also grew strongly, at 33 percent (see photo). Sia Kung, like nearly built-out Sha-Tin, is conveniently located just over a narrow mountain range from Kowloon and contains considerable amounts of greenfield land for development.

    Kowloon

    Sia Kung

    Yuen Long, home of the new Shenzhen Bridge had the third highest growth rate, at 29 percent. The Islands, Sia Kung and Yuen Long all have all experienced much improved access from extensions to the Mass Transit Railway (MTR) and the former Kowloon-Canton Railway (KCR), which have now merged into the MTR.

    Transportation in Hong Kong: Hong Kong is the most transit dependent major metropolitan area in the high-income world. Mass transit carries 72 percent of motorized trips. Even with the high residential and employment density, the average work trip is approximately five miles each way. Moreover, despite having one of the most effective mass transit systems in the world and extraordinarily high densities, the average one-way work trip travel time is 46 minutes, 18 minutes longer than Los Angeles or Houston. With the highest transit market share in the world and an automobile market share only 1/70th that of Houston, Hong Kong’s density still  produces among the highest levels of traffic congestion in the world — 1.5 times the traffic density of Los Angeles and three times that of Houston (photo).

    Hong Kong Traffic Congestion

    Economic Growth: Hong Kong has experienced strong economic growth for  the last three decades. In 1981, Hong Kong’s gross domestic product (GDP) per capita was one-third below that of the United Kingdom, its then colonial master. Even by this time, Chinese leader Deng Xiao Ping had been so impressed by Hong Kong’s market based economic advance, that he had designated adjacent Shenzhen as a special economic zone. That area has since grown from a fishing village to a population exceeding 10 million, according to the 2010 census. In the intervening years, the Pearl River Delta has emerged as the most populous extent of urbanization in the world, stretching from Hong Kong, through Shenzhen, Dongguan, Guangzhou, Jiangmen, Zhongshan and Zhuhai to Macao. However, because of border controls and the low level of commuting, these remain separate metropolitan areas and  urban areas.

    Hong Kong’s economic growth continued strongly in the middle 1990s, when its GDP per capita exceeded that of the United Kingdom. Hong Kong fell behind in the late 1990s Asian economic crisis, but soon recovered. By 2010, Hong Kong’s GDP per capita had risen to 27 percent above that of the United Kingdom.

    Hong Kong’s economic performance relative to the United States may be even more impressive. In 1980, Hong Kong’s GDP per capital trailed that of the United States by 45 percent. As of 2010, Hong Kong trailed the US by only three percent and according to International Monetary Fund data should pass the United States early in the present decade. Between 2000 and 2010, Hong Kong’s per capita GDP (PPP-2010$) rose more than one-third — only South Korea and Singapore did better among high-income areas, according to International Monetary Fund data. China’s percentage growth rate was  nearly five times Hong Kong’s but in actual dollars Hong Kong’s GDP per capita rose at triple China’s rate. However, should China’s economy slow down, as some analysts suggest, it could be difficult for Hong Kong to sustain this strong growth rate (Figure 3).

    The People’s Republic of China has maintained Hong Kong’s free market economic system, helping assure strong growth. It seems unlikely that either Deng Xiao Ping or Margaret Thatcher imagined that such economic progress would be made when they signed the historic agreement to restore Hong Kong to China in 1984. Nor is it likely they imagined China’s meteoric rise.

    Unique Hong Kong: Hong Kong is the living model of compact development and transit dependence toward which urban planning wisdom strives. However, Hong Kong itself is the outlier of outliers. Hong Kong’s population density — double that of any other high-income world urban area of similar size or larger — would never have approached this level if it had not been separated from China itself by colonization and then the historical complexities of the post-World War II period. Even in its prosperity, the growing urban areas of mainland China are being built at densities averaging no more than one-quarter that of Hong Kong. Hong Kong may be more an accident of history than an exemplar.

    Wendell Cox is a Visiting Professor, Conservatoire National des Arts et Metiers, Paris and the author of “War on the Dream: How Anti-Sprawl Policy Threatens the Quality of Life

    —-

    Photo: Star Ferry, operating between Hong Kong Island (Central) and Kowloon (Yau Tsim Mong). All photos by author.

    Hong Kong district map by Wikipedia user Moddlyg.

  • The Evolving Urban Form: Moscow’s Auto-Oriented Expansion

    Moscow is bursting at the seams. The core city covers more than 420 square miles (1,090 kilometers), and has a population of approximately 11.5 million people. With 27,300 residents per square mile (10,500 per square kilometer), Moscow is one percent more dense than the city of New York, though Moscow covers 30 percent more land. The 23 ward area of Tokyo (see Note) is at least a third more dense, though Moscow’s land area is at least half again as large as Tokyo.

    All three core areas rely significantly on transit. Muscovites use the Metro at about the same rate as New Yorkers use the subway, taking about 200 trips each year. Tokyo citizens use their two Metro systems at nearly 1.5 times the rate used in Moscow.

    But there are important differences. Moscow officials indicate that approximately two-thirds of Moscow’s employment is in the central area. This is a much higher figure than in the world’s two largest central business districts — Tokyo’s Yamanote Loop and Manhattan — each with quarter or less of their metropolitan employment. Both New York City and Tokyo’s 23 wards have extensive freeway lengths in their cores, which help to make their traffic congestion more tolerable.

    Moscow’s arterial street pattern was clearly designed with the assumption that the dominant travel pattern would be into the core. Major streets either radiate from the core, or form circles or partial circles at varying distances from it. In New York City and Tokyo’s  23 wards there are radial arterials, but,the major streets generally form a grid, which is more conducive to the cross-town traffic and the more random trip patterns that have emerged in the automobile age.

    Moscow has become much, more reliant on cars,  following the examples of metropolitan areas across Europe. The old outer circular road, which encloses nearly all of the central municipality, was long ago upgraded to the MKAD, a 10 lane freeway as long as Washington’s I-495 Capital Beltway (65 miles or 110 kilometers). The MKAD has become a primary commercial corridor, with large shopping centers and three nearby IKEAs.

    It is not surprising, therefore, that traffic congestion and air pollution became serious problems in Moscow. The road system that had been adequate when only the rich had cars was no longer sufficient. The "cookie-cutter" apartment blocks, which had served Iron Curtain poverty, had become obsolete. The continued densification of an already very dense core city led to an inevitable intensification of intensification of traffic congestion and air pollution.

    Transit-oriented Moscow was not working, nor could "walkability" make much difference. In such a large urban area, it is inevitable that average travel distances, especially to work, will be long. Geographically large employment markets are the very foundation of major metropolitan areas. If too many jobs are concentrated in one area, then the traffic becomes unbearable, as many become able to afford cars and use them. Traffic congestion was poised to make Moscow dysfunctional.

    Expanding Moscow

    The leadership of both the Russian Federation and the city of Moscow chose an unusual path, in light of currently fashionable urban planning dogma. Rather than making promises they could not keep about how higher densities or more transit could make the unworkable city more livable, they chose the practical, though in urban planning circles, the "politically incorrect" solution:  deconcentrating the city and its traffic.

    Last year, Russian President Dmitry Medvedev proposed that Moscow be expanded to a land area 2.3 times as large. Local officials and parliament were quickly brought on board. The expanded land area is nearly double that of New York’s suburban Nassau County, and is largely rural (Note 2). Virtually all of the expansion will be south of the MKAD.

    The plan is to create a much larger, automobile-oriented municipality, with large portions of the Russian government to be moved to the expanded area. Employment will be decentralized, given the hardening of the transport arterials that makes the monocentric employment pattern unsustainable. Early plans call for commercial construction more than four times that of Chicago’s loop.

    At the same time, the leadership does not intend to abandon the older, transit-oriented part of the municipality. Mayor Sergei Sobyanin has voiced plans to convert central area government buildings into residences and hotels, adding that there will be the opportunity to build underground parking facilities as refurbishments proceed. Moscow appears to be preparing to offer its citizens both an automobile-oriented lifestyle and a transit-oriented one. The reduced commercial traffic should also make central Moscow a more attractive environment for tourists, who spend too much time traveling between their hotels and historic sites, such as the Kremlin and St. Basil’s.

    Expanding the Family?

    As Moscow expands, the national leadership also wants the Russian family to expand. Russia has been losing population for more than 20 years. Since 1989, the population of the Russian Federation has dropped by 4.5 million residents. When the increase of 3.0 million in the Moscow area is considered, the rest of the nation has lost approximately 7.5 million since 1989. Between the 2002 and the 2010 censuses, Russia lost 2.2 million people and dropped into a population of 142.9 million. Russia’s population losses are pervasive. Out of the 83 federal regions, 66 lost population during the last census.

    Continued population losses could significantly impair national economic growth. The projected smaller number of working age residents will produce less income, while a growing elderly population will need more financial support. This is not just a Russian problem, but Russia is the first of the world’s largest nations to face the issue while undergoing a significant population loss.

    The government is planning strong measures to counter the demographic decline, increase the birth rate, and create a home ownership-based "Russian Dream". Families having three or more children will be granted land for building single-family houses across the nation., including plots of up to nearly one-third of an acre (1,500 square meters).  Many of these houses could be built in Moscow’s new automobile- oriented two-thirds, as well as in the extensive suburbs on the other three sides of the core municipality.

    Expanding Outside the Core

    While population decline is the rule across the Russian Federation, the Moscow urban area has experienced strong growth. Between 2002 and 2010, the Moscow urban area grew from 14.6 million to 16.1 million residents (Note 3). This 1.3 percent annual rate of increase  exceeds the recently the recently announced growth in Canada (1.2 percent). This rate of increase exceeds that of all but 8 of the 51 major metropolitan areas (Note 4) in the United States between 2000 and 2010.

    While the core district grew 6 percent  and added 41,000 residents, growth was strongest outside the core, which accommodated 97 percent of the new residents (See Table). Moscow’s outer districts grew by nearly 1.1 million residents, an 11 percent increase, and its suburbs continued to expand, adding 400,000 residents, an increase of 10  percent. These areas have much lower densities than the city, with many single-family houses.

    Table
    Moscow Urban Area Population
    2002 2010 Change % Change Share of Growth
    Inner Moscow 701,000 743,000 41,000 5.9% 2.7%
    Outer Moscow 9,681,000 10,772,000 1,090,000 11.3% 70.3%
    Suburban 4,198,000 4,617,000 420,000 10.0% 27.0%
    Total 14,581,000 16,132,000 1,551,000 10.6% 100.0%
    Note: Suburban population includes the total population of each district and city that is at least partially in the urban area.


    Moscow, like other international urban areas, is decentralizing, despite considerable barriers. The expansion will lead to even more decentralization, which is likely to lead to less time "stuck in traffic" and more comfortable lifestyles. Let’s hope that Russia’s urban development policies, along with its plans to restore population growth, will lead to higher household incomes and much improved economic performance.

    Wendell Cox is a Visiting Professor, Conservatoire National des Arts et Metiers, Paris and the author of “War on the Dream: How Anti-Sprawl Policy Threatens the Quality of Life

    —–

    Note 1: The 23 ward (ku) area of Tokyo is the geography of the former city of Tokyo, which was abolished in the 1940s. There is considerable confusion about the geography of Tokyo. For example, the 23 ward area is a part of the prefecture of Tokyo, which is also called the Tokyo Metropolis, which has led some analysts to think of it as the Tokyo metropolitan area (labor market area). In fact, the Tokyo metropolitan area, variously defined, includes, at a minimum the prefectures of Tokyo, Kanagawa, Chiba and Saitama with some municipalities in Gunma, Ibaraki and Tochigi. The metropolitan area contains nearly three times the population of the "Tokyo Metropolis."

    Note 2: The expansion area (556 square miles or 1,440 square kilometers) has a current population of 250,000.

    Note 3: Includes all residents in suburban districts with at least part of their population in the urban area.

    Note 4: Urban area data not yet available.

    Photo: St. Basil’s Cathedral (all photos by author)

  • Special Report: Census 2011: Urban Dispersion in Canada

    Canada now has fastest-growing population in the G-8 (Note 1), according to the results of the 2011 census, released last week. Canada’s growth rate from 2006 to 2011 exceeded that of the United States by nearly one-third and is nearly one half greater than just a decade ago. The population rose from 31.6 million in 2006 to 33.5 million in 2011.

    The move west continues. For the first time in history, the provinces west of Ontario (Manitoba, Saskatchewan, Alberta and British Columbia) account for more population than the provinces east of Ontario (Quebec, New Brunswick, Nova Scotia, Prince Edward Island and Newfoundland). Two-thirds of the growth was due to immigration, a development cited in a census editorial by the Toronto Star as a solution to the nation’s fertility deficit.

    … we need to make more babies. But we are not, to the extent we need to. Canada’s birth rate of 1.67 children per woman is well below the minimum of 2.0 required. Therefore, we need to get more immigrants, which we are.

    The Major Metropolitan Areas

    Canada’s six major metropolitan areas (over 1,000,000 population) grew even half again as quickly as the nation — 9.3% over five years. Within these metropolitan areas, the pattern of urban dispersion continued, with 83% of the population increase in the largest metropolitan areas (Toronto, Montréal and Vancouver) occurring outside the central municipalities. For the first time, the population in the suburbs of "905" (so-called for its area code), exceeded the population of the amalgamated municipality of Toronto. Similarly, for the first time, the island of Montréal (this includes the ville de Montréal and other municipalities) had a smaller population than the rest of the metropolitan area. According to the The Gazette:

    Most of the people who leave the 514-area (the island -ed) for the 450 (off the island -ed) do so reluctantly. They are often young people with children (or who hope to have children). They enjoy the city’s stimulation and its proximity to workplaces, shopping and entertainment. But they leave because there’s not enough suitable housing in their price range. The taxes are also high and services spotty. Not the greatest place to to raise a family.

    Dispersion continued in Ottawa- Gatineau, Calgary and Edmonton, though not as obvious because most suburban areas are inside these proportionately larger central municipalities. Even so, 56% of the growth in the six major metropolitan areas was outside the central municipalities (Table 1).

    Table 1
    Metropolitan Area Population Trend:
    Central Municipalities & Peripheral Municipalities
    Population (000) Change (000)
    Central Muncipality Surrounding Muncipalities Metropolitan Area Central Muncipality Surrounding Muncipalities Metropolitan Area
    Toronto         2,615            2,968          5,583            112               358             470
    Montreal         1,650            2,175          3,824               29               160             189
    Vancouver            604            1,710          2,313               25               171             197
    Ottawa-Gatineau            883               353          1,236               71                 31             103
    Calgary         1,079               136          1,215               90                 28             118
    Edmonton            812               348          1,160               82                 43             125
    Total         7,643            7,689       15,332            410               791          1,201
    Change in Population Share of Growth
    Central Muncipality Surrounding Muncipalities Metropolitan Area Central Muncipality Surrounding Muncipalities Metropolitan Area
    Toronto 4.5% 13.7% 9.2% 23.8% 76.2% 100.0%
    Montreal 1.8% 7.9% 5.2% 15.3% 84.7% 100.0%
    Vancouver 4.4% 11.1% 9.3% 12.9% 87.1% 100.0%
    Ottawa-Gatineau 8.8% 9.8% 9.1% 69.4% 30.6% 100.0%
    Calgary 9.2% 25.5% 10.8% 76.7% 23.3% 100.0%
    Edmonton 11.2% 14.1% 12.1% 65.5% 34.5% 100.0%
    Average 6.6% 13.7% 9.3% 43.9% 56.1% 100.0%


    Urban Core Analysis

    Recent amalgamations and aggressive annexation policies make more difficult an analysis of the growth between urban cores and more suburban areas. Only one of the six central municipalities retains boundaries that reflect the core urbanization that preceded the explosive automobile-oriented suburban expansion (Table 2). The same situation exists in US metropolitan areas, where only 19 of the 51 largest metropolitan areas have central municipalities with boundaries that have remained relatively constant over the past 60 years (see Suburbanized Core Cities).

    Table 2
    Metropolitan Area Population Trend:
    Urban Core & Outside
    Change in Population Change (000)
    Urban Core Outside Metropolitan Area Urban Core Outside Metropolitan Area
    Toronto            703            4,880          5,583               45               425             470
    Montreal            930            2,894          3,824                 9               180             189
    Vancouver            604            1,710          2,313               25               171             197
    Ottawa-Gatineau            218            1,019          1,236                 7                 96             103
    Calgary            128            1,087          1,215                 4               114             118
    Edmonton            123            1,037          1,160                 2               123             125
    Total         2,705          12,626       15,332               92           1,109          1,201
    Change in Population Share of Growth
    Urban Core Outside Metropolitan Area Urban Core Outside Metropolitan Area
    Toronto 6.8% 9.5% 9.2% 9.5% 90.5% 100.0%
    Montreal 0.9% 6.6% 5.2% 4.6% 95.4% 100.0%
    Vancouver 4.4% 11.1% 9.3% 12.9% 87.1% 100.0%
    Ottawa-Gatineau 3.2% 10.4% 9.1% 6.6% 93.4% 100.0%
    Calgary 3.0% 11.8% 10.8% 3.1% 96.9% 100.0%
    Edmonton 2.0% 13.4% 12.1% 1.9% 98.1% 100.0%
    Average 3.4% 10.5% 9.3% 6.5% 93.5% 100.0%
    Urban core based upon federal electoral districts (see text)


    The core versus suburban trends are better illustrated by examining areas more representative of the historic cores. This following analysis uses federal electoral districts that roughly conform to the urban cores as they existed in the early 1950s, at the beginning of the automobile oriented expansion. Federal electoral districts generally had a population of approximately 100,000 in 2006.

    Toronto: The Toronto metropolitan area grew 9.5%, adding 470,000 new residents.

    The central municipality of Toronto contains considerable post World War II suburban development, as a result of a late 1990s municipal amalgamation imposed by the provincial government. Federal electoral districts (Note 2) that roughly match to the former municipality of Toronto’s early 1950s boundaries grew 45,000, from a population of 658,000 in 2006 to 703,000 in 2011. This 6.8% increase represents some of the strongest growth in 80 years, though the population of the former municipality tended to hover between 600,000 to 700,000. The core growth between 2006 and 2011 was concentrated in the Trinity-Spadina and Toronto Centre electoral districts, where the population rose 38,000 (16%). These two districts have grown strongly as a result of Toronto’s high rise condominium boom. The balance of the urban core grew only 2%.

    Areas outside the core added 425,000 population, nearly 10 times the increase of the core. The percentage increase was also stronger, at 9.5%. Approximately 85% of this region’s growth was outside the municipality of Toronto, which The National Post characterized as explosive.

    Montréal: Montréal was the slowest growing major metropolitan area, at 5.9%, adding 189,000 new residents.

    Like Toronto, expansion of Montréal’s municipality boundaries include considerable amounts of post-war development. Yet the core of the ville de Montréal has become considerably less dense. In 1951, the ville de Montréal had a population of 1,022,000 people in 131 square kilometers. By1996 (before an amalgamation), the population had dropped to 1,017,000 in 186 square kilometers. This represents a 30% loss in density. Between 2006 and 2011, nine federal electoral districts (Note 3) in the urban core experienced 0.9% population growth from 922,000 in 2006 to 930,000 2011. No significant densification was evident in these districts.

    The areas outside the core added 180,000 people, 95% of the population growth. Nearly 90% of this growth was outside the ville de Montréal.

    Vancouver: The Vancouver metropolitan area grew 9.3% between 2006 and 2011 and, despite all the popular literature about the city’s “smart growth” policies, most growth was dispersed. "The population of the City of Vancouver, the urban core, is flat-lining or even declining notes the Globe and Mail. In contrast, "Surrey, Coquitlam and … Port Moody are growing fast — shifting Metro Vancouver’s centre of gravity east." The Vancouver Sun reported that suburban Surrey would surpass the population of the municipality of Vancouver in the next decade (Note 4).

    The municipality of Vancouver has retained virtually its early 1950s boundaries. The municipality grew 4.4% from 2006 to 2011, adding 25,000 residents. One -half the growth was in the densifying Vancouver-Centre electoral district, which includes downtown and English Bay. The rest of the core municipality grew at only one-fourth the rate of downtown. Despite the downtown gains, the suburbs accounted for 87% of the metropolitan area growth. Seven new suburban residents were added for every new resident in the municipality of Vancouver.

    Ottawa-Gatineau:  The Ottawa-Gatineau metropolitan area straddles the Ontario-Québec border, with the national capital in Ottawa. Ottawa-Gatineau added 9.1% to its population between 2006 and 2011, rising to 1,236,000.

    A 1990s amalgamation brought much of the former suburban area into the central municipality. Two federal electoral districts (Note 5) that are representative of the urban core grew 3.2%, from 211,000 to 217,000. Areas outside this core grew 10.4%, from a population of 923,000 to 1,019,000. Non-core area growth accounted for 94% of the metropolitan area’s population growth.

    Calgary: The Calgary metropolitan area grew 12.6%, to a population of 1,215,000 (Note 6). Calgary is one of the world’s most successful post World War II metropolitan areas. Like Edmonton, Phoenix and San Jose, Calgary has virtually no pre-automobile core. However, uncharacteristic for a new metropolitan area, Calgary has developed one of the strongest central business districts – largely due to the oil industry – in North America, and Emporis ranks Calgary’s skyline as 57th in the world, just ahead of Seattle.

    The core federal electoral district (Calgary-Centre), the most dense in the Calgary metropolitan area, experienced growth of 3.0% from 2006 to 2011. This district is comparatively large in land area, but has a   population density one-third that of Vancouver-Centre. All of the electoral districts surrounding Calgary-Centre have much lower densities.

    Most of the growth occurred the northern and western portion of the municipality of Calgary and beyond. Overall, the population growth rate outside the core electoral district was 11.8%. Non-core areas of the Calgary metropolitan area accounted for 97% of the growth.

    Edmonton: Like Calgary, Edmonton is a post-World War II metropolitan area. The Edmonton metropolitan area added 12.1%, to its population, growing to 1,160,000. The core Edmonton-Centre electoral district, the most dense in the metropolitan area, grew only 2.0%, from 121,000 to 123,000. This district has less than one-quarter the density of Vancouver-Centre. Areas outside the core grew 13.4% from 914,000 to 1,037,000. The non-core areas accounted for 98% of the area’s growth. Some of the greatest growth was in the western half of the municipality of Edmonton.

    Suburban Gains Dwarf Core Densification

    Toronto and Vancouver are experiencing significant increases in downtown populations. But the base is so small that these gains are dwarfed by the scale of suburban population increases. At the same time, central municipality areas outside downtown have lagged. Thus, the 2011 census shows that across Canada, urban dispersion continues, results similar to recent results from the United States as well as a number of major metropolitan areas in the both the developed and the developing world. More than 93% of growth was outside the urban cores.

    Wendell Cox is a Visiting Professor, Conservatoire National des Arts et Metiers, Paris and the author of “War on the Dream: How Anti-Sprawl Policy Threatens the Quality of Life

    ————

    Note 1: The G-9 includes Canada, France, Germany, Italy, Japan, the Russian Federation, the United Kingdom, and the United States.

    Note 2: Toronto Centre, Toronto-Danforth, Trinity-Spadina, Parkdale-High Park, Davenport and St. Paul’s.

    Note 3: Westmount-Ville Marie, Mount Royal, Notre-Dame-de-Grâce – Lachine, Outremont, Papineau, Ahutsic, Jeanne-Le Ber, Laurier-Sainte-Marie and Rosemont-La Petite-Patrie

    Note 4: If Surrey exceeds Vancouver in population, it is to be wondered if Canada’s third largest metropolitan area will be called Surrey instead of Vancouver. A similar displacement of the historic core municipality occurred in the United States when the population of Norfolk was exceeded by suburban Virginia Beach, with the first name of the metropolitan area changing accordingly.

    Note 5: Ottawa-Centre and Ottawa Vanier

    Note 6: This 12.6% figure differs from the 10.8% in Tables 1 & 2, which is calculated using actual data reported by Statistics Canada. Statistics Canada indicates that the data "excludes census data for one or more incompletely enumerated Indian reserves or Indian settlements."

    Photo: Condominium buildings and the CN Tower, Downtown Toronto (by author)