Tag: Evolving Urban Form: Development Profiles of World Urban Areas

  • The Evolving Urban Form: Guangzhou-Foshan

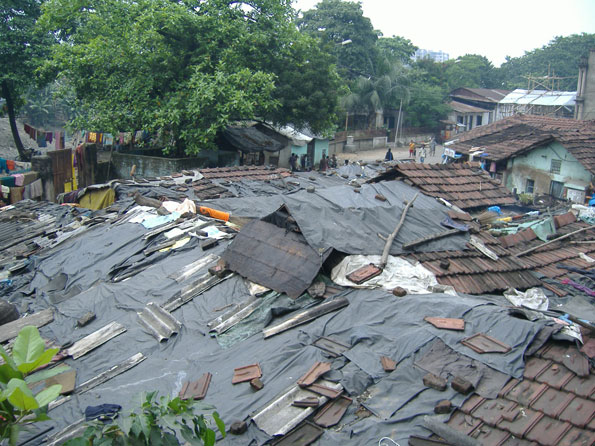
    The Pearl River Delta of China is home to the largest extent of continuous urbanization in the world. The Pearl River Delta has 55 million people in the jurisdictions of Hong Kong, Shenzhen, Dongguan, Guangzhou, Foshan, Zhongshan, Jiangmen, Zhuhai and Macau. Moreover, the urban population is confined to barely 10 percent of the land area. These urban areas are the largest export engine of China and reflect the successful legacy of Deng Xiaoping’s reforms which had their start with the special economic zone in Shenzhen and spread to the rest of the Delta and then much of the nation.

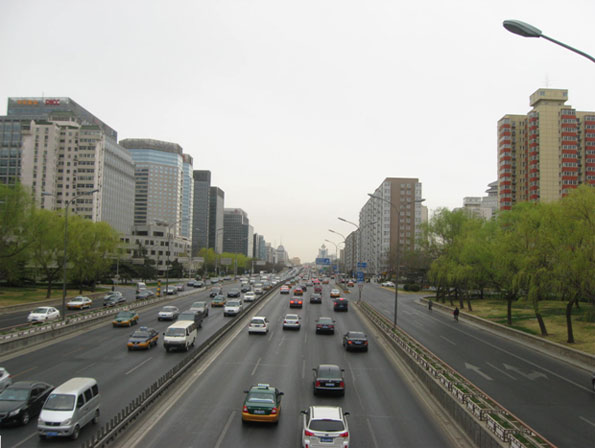
    Adjacent Metropolitan Areas: However, the Pearl River Delta today is not a metropolitan area, as is often asserted. Instead it is rather a collection of adjacent metropolitan areas or labor markets (Figure 1). Metropolitan areas are not created by a large number of people living close to one another. Metropolitan areas are labor markets, crudely delineating the geography of the jobs-housing balance. There is little commuting between the Pearl River jurisdictions. Moreover, as labor markets, metropolitan areas cannot be international unless there is virtual free movement of labor (Note). In the case of Hong Kong and Macau, commuting between the neighboring jurisdictions of Shenzhen and Zhuhai requires crossing the equivalent of an international border.


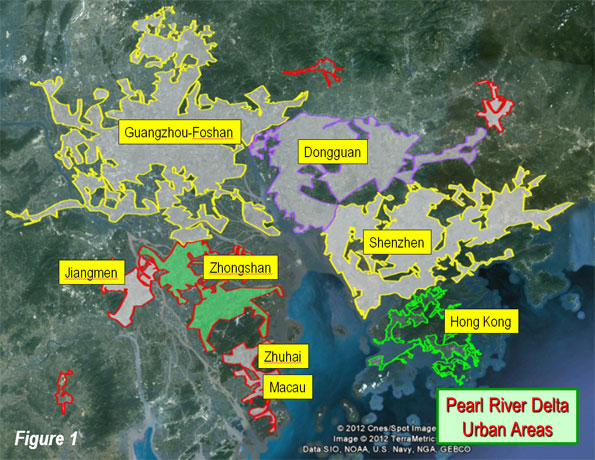
    Integrating Guangzhou and Foshan: Transportation integration has already come to two of the jurisdictions, Guangzhou and Foshan. The adjacent prefectures (confusingly interpreted into English as "cities") are now linked by a subway and unlike the other Pearl River Delta jurisdictions, the continuous urbanization does not narrow at the border (Figure 1). There are even proposals to merge the adjacent prefectures.

    Guangzhou and Foshan are separated by a tributary of the Pearl River, with a number of bridges that provide similar crossing capacity as exists in cross-river metropolitan areas like Portland (Willamette River), Cincinnati (Ohio River) and St. Louis (Mississippi River).

    Guangzhou itself is the capital of Guangdong, the largest province of China, with approximately 105 million people. Guangdong is the third largest state or province (sub-national jurisdiction) in the world, trailing the states of Uttar Pradesh (contains the eastern suburbs of Delhi) and Maharashtra (capital Mumbai) in India.

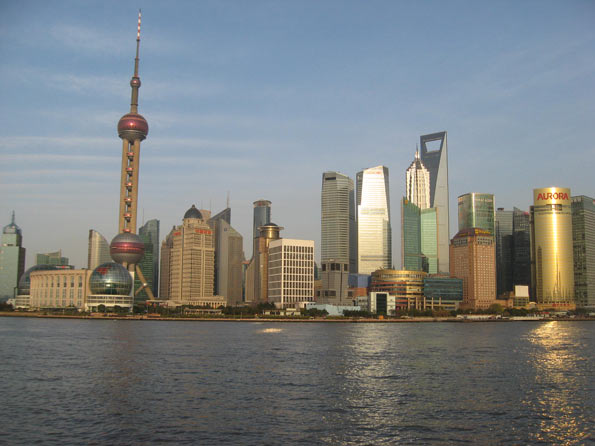
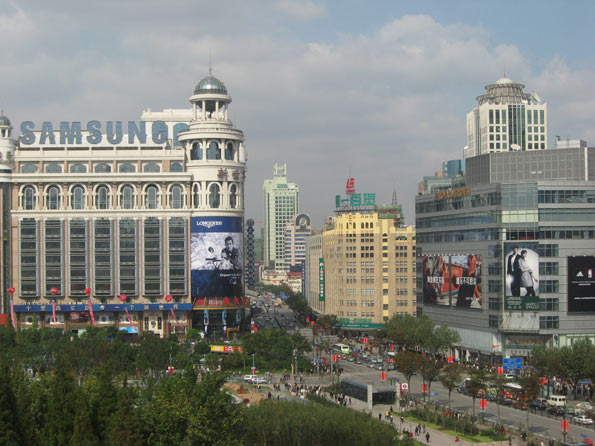
    Guangzhou is larger than Foshan. It is better known to many Westerners as Canton, and for many years served as China’s “window” on the west. Even in China, the alternative name is still used, for example in the annual Canton Fair, one of the largest trade fairs in the world.

    Canton was also a principal flashpoint of 19th century hostilities between the British and Chinese. The First Opium War (1839-42) began at Canton and led to the cession of Hong Kong to Great Britain and the establishment of British treaty ports at Fuzhou, Xiamen, Ningbo, Shanghai and Canton (Guangzhou). After the Second Opium War (1856-60), other treat ports were established and France, the United States, Russia, Germany, Japan and others gained similar rights to the British from a weakened Chinese government.

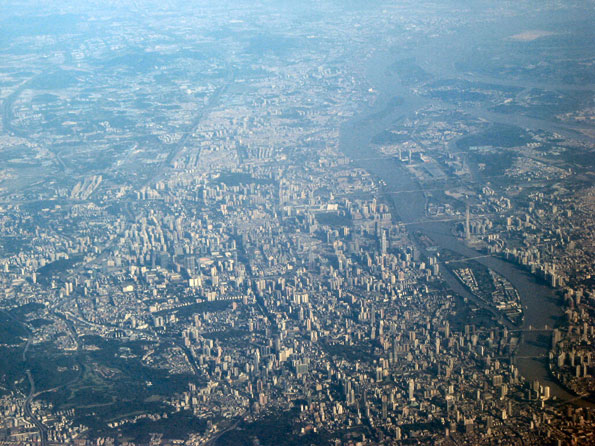
    In 2010, the metropolitan area county and district level jurisdictions of Guangzhou-Foshan had 18.3 million people. This is an increase of 4.4 million from 2000 and 11.6 million from 1982. This is surely a rapid rate of growth, but Shanghai and Beijing grew even faster over the last decade, each adding more than 6 million people.

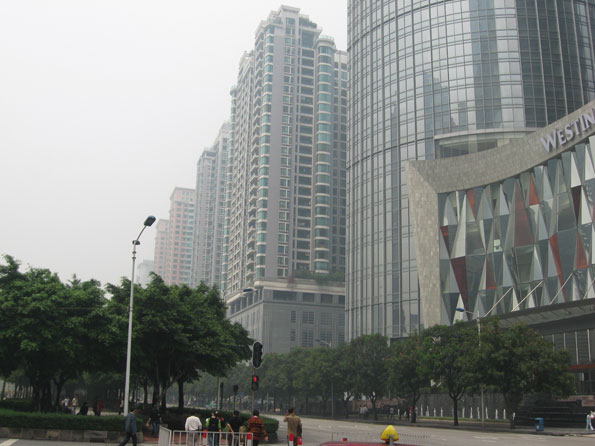
    Distribution of Population Growth: In contrast to Shanghai and Beijing, where virtually all of the growth has been outside the core, the Guangzhou-Foshan core is growing robustly. From 2000 to 2010, the core districts increased from a population of 4,040,000 to 5,050,000. With a land area of 107 square miles (279 square kilometers), the core is similar in size to the city (municipality) of Sacramento, which has less than one-tenth the population. The core density is 46,800 per square mile (18,100 per square kilometer), up from 37,500 per square mile (14,500 per square kilometer) in 2000. This is about one-third less dense than Manhattan or the ville de Paris (the central city).

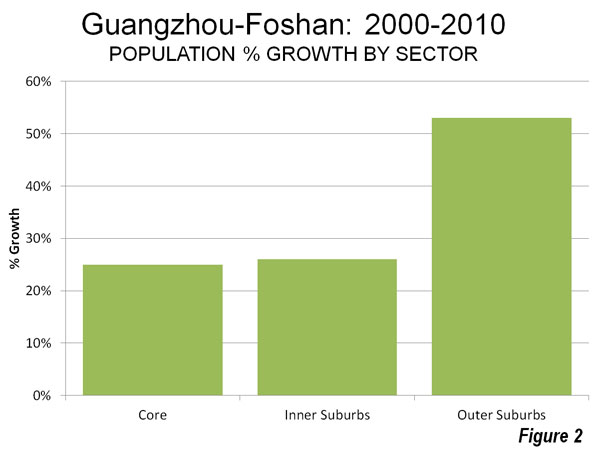
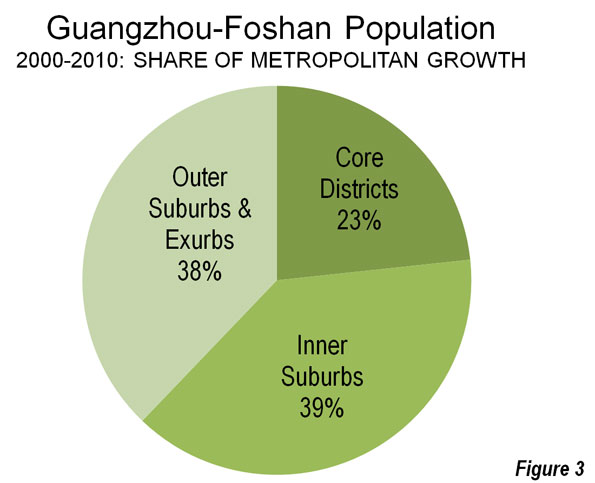
    However, as is typical for metropolitan areas around the world, Guangzhou-Foshan’s growth has been most concentrated in suburban areas. The core accounted for 23% of the population growth over the past decade, while the suburbs accounted for 77%.

    The inner suburbs grew from a population of 6,670,000 to 8,400,000. The density rose from 5,000 to 6,300 per square mile (1,900 to 2,500 per square kilometer), similar to that of the San Francisco urban area. The inner suburbs accounted for 39% of the growth and grew 26%.

    The outer suburbs grew from a population of 3,150,000 to 8,200,000 over the past decade. The population density rose from 2,000 to 3,100 per square mile (800 to 1,200 per square kilometer), slightly more dense than the Philadelphia urban area and slightly less dense than the Portland urban area. The outer suburbs accounted for 38% of the growth and grew at the greatest rate, 53% (Figures 2 & 3, Table).


    Guangzhou-Foshan Metropolitan Area & Urban Area
    2000 & 2010 Census
    Metropolitan Area Core Inner Suburbs Outer Suburbs Total
    2000         4,040,000        6,670,000            3,150,000         13,860,000
    2010         5,050,000        8,400,000            4,820,000         18,270,000
    Change         1,010,000        1,730,000            1,670,000           4,410,000
    % 25% 26% 53% 32%
    Share of Growth 23% 39% 38% 100%
    Area (KM2)                   279               3,429                   4,003                  7,711
    Area (Square Miles)                   108               1,324                   1,546                  2,977
    Density (KM2)              18,100               2,400                   1,200                  2,400
    Density (Square Miles)              46,800               6,300                   3,100                  6,100
    Urban Area  Core   Suburbs   Total 
    2010         5,050,000          11,225,000         16,275,000
    Area (KM2)                   279                   2,894                  3,173
    Area (Square Miles)                   108                   1,117                  1,225
    Density (KM2)              18,100                   3,900                  5,100
    Density (Square Miles)              46,800                 10,000                13,300
    Notes
    Boundary changes render district area data incomplete.
    Core: Yuexiu, Liwan, Haizhu, Tianhe 
    Inner Suburbs: Baiyun, Huangpu, Panyu, Nansha, Nanhai, Changcheng
    Outer Suburbs: Huadu, Luogang, Gaoming, Shunde, Shanshi 
    Nansha is in the inner suburbs because 2000 data is combined with Panyu (should be in the outer suburbs)

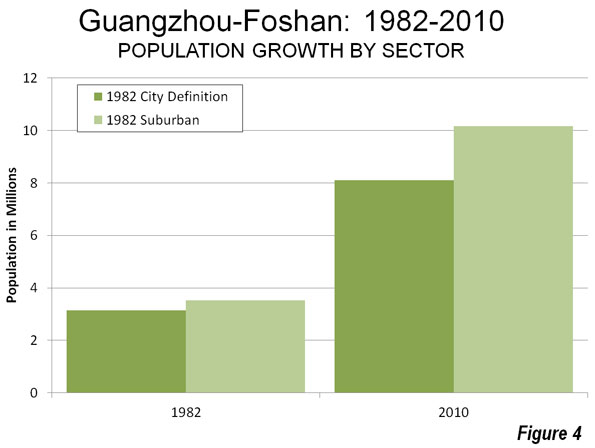
    Earlier data shows this suburban pattern has been a long term trend.  Between 1982 and 2010, the suburbs accounted for 57% of the growth outside the city of Guangzhou as then defined (Figure 4). District boundary changes limit a more precise analysis based upon a core that did not include large areas without development.

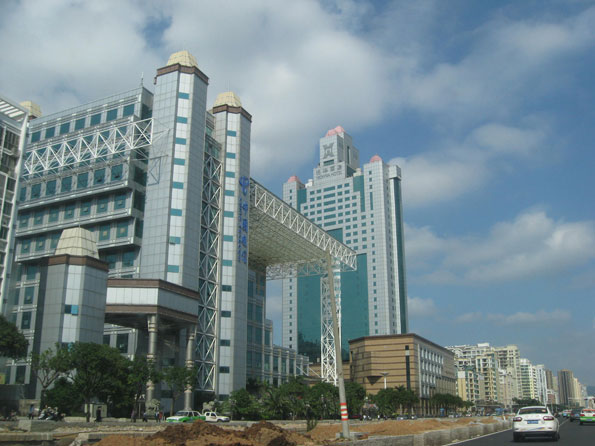
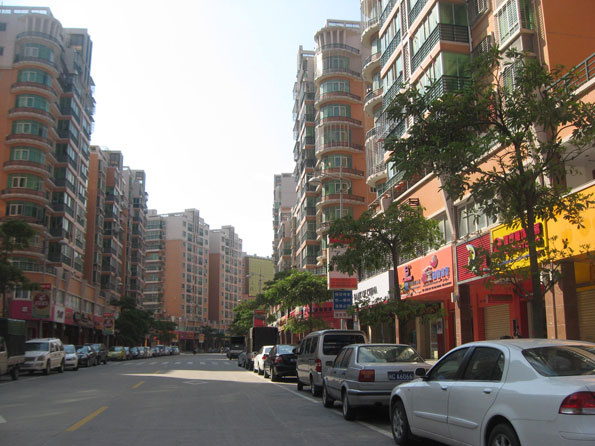
    The Guangzhou-Foshan Urban Area: The soon to be released 8th Annual Demographia World Urban Areas will show the Guangzhou urban area (area of continuous development within the metropolitan area) to have a population of approximately 16.275 million, with a land area of approximately 1,225 square miles (3,173 square kilometers). Barring later data from the multiple national censuses that will soon be reporting data, Guangzhou-Foshan is likely to be ranked the 14th largest urban area in the world. The population density is approximately 13,300 per square mile (5,100 per square kilometer), roughly comparable to the London or Barcelona urban areas. The suburbs of the urban area have a density of approximately 10,000 per square mile (3,900 per square kilometer). Most of the new residential development is multi-unit, such as high rise condominium buildings and work related housing, including dormitories. However, there is some detached housing, which is very expensive.

    A Larger Metropolitan Area: In the longer run a much larger metropolitan (and urban) area could result, if Chinese residents begin traveling to work over much longer distances between these jurisdictions and should the border restrictions at Hong Kong and Macau be eliminated. To achieve this end, there will need to be important local transportation improvements between the jurisdictions, such as more urban railways (which are planned) and wider automobile ownership, to use the already comprehensive (toll) freeway system.

    Wendell Cox is a Visiting Professor, Conservatoire National des Arts et Metiers, Paris and the author of “War on the Dream: How Anti-Sprawl Policy Threatens the Quality of Life

    ——

    Note: International metropolitan areas can now exist in the European Union, where there is free movement of labor across national borders. For example, the Lille metropolitan area is located in both France and Belgium. France and Switzerland (not a member of the European Union) provide another example, where treaty provisions permit international movement of labor with little difficulty in the resulting international metropolitan areas of Geneva (Switzerland-France) and Basel (Switzerland-France).

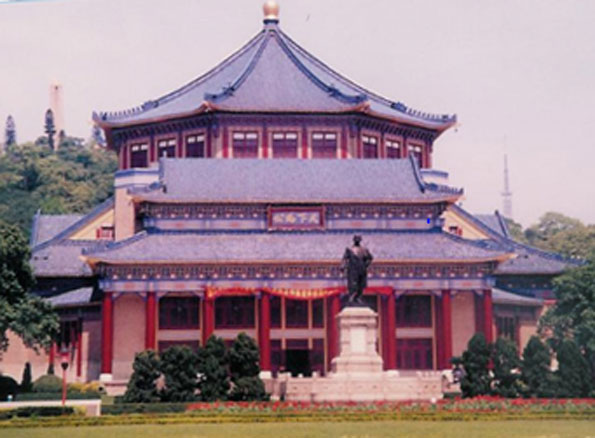
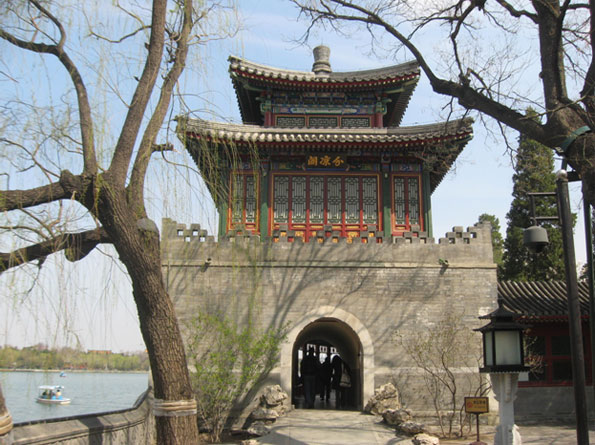
    Photo (top): Pagoda: Temple of the Six Banyan Trees, Guangzhou (all photos by author)

  • The Evolving Urban Form: Kolkata: 50 Mile City

    More than a decade ago, the Sierra Club and I crossed keyboards over urban density. The Sierra Club had just posted a new "neighborhood consumption calculator," that gave visitors the opportunity to look at the purported impacts of various density levels. The Sierra Club designated 500 dwelling units per acre as "efficient urban." Independently, Randal O’Toole and I quickly were on the Internet pointing out the absurdity of such high density. I noted that the so-called "efficient urban" density was far higher than that of the "black hole" of Calcutta, and high enough for all US residents to live in the Portland urban area.

    Within 24 hours of our responses, the "neighborhood consumption calendar" had been taken off the Internet. It was later to reappear with "efficient urban" density being discounted a full 80 percent, to 100 housing units per acre. This is still far more dense than nearly all of the world except for low income world shantytowns.

    The Kolkata Municipal Corporation (KMC): The central city of Calcutta, now called Kolkata, remains one of the densest on earth. Its population density is 63,000 per square mile (24,000 per square kilometer)  is nearly the same density as in Manhattan or the Ville de Paris. More accurately, it resembles the entire urban area densities of Mumbai and Hong Kong. The expanding suburbs of Kolkata have a population density of 25,000 per square mile (9,000 per square kilometer). The next edition of Demographia World Urban Areas (due out in the spring) will estimate the population density of the Kolkata urban area at 30,000 per square mile (12,000 per square kilometer).

    Kolkata’s spreading urbanization, however, has been going on for at least a half century. Since the 1951 Census, the central city of Kolkata has accounted for only 19% of the urban area population growth. The central city has added nearly 1,800,000 people while the suburbs have added approximately 7,650,000 (Figure 1).

    Over the past two decades, the central city’s growth has been minimal, adding 87,000 people from 1991 to 2011, while the suburbs added more than 3 million new residents. This intensifies the pattern of the last half-century where most growth clustered close to the city core.

    Between 1901 and 1951, 59% of the growth in the Kolkata urban area was in the central city (Kolkata lost the British capital to Delhi in 1911).


    Photo: Victoria Memorial, KMC

    Slower Growth in the Urban Area: Kolkata is an unusually shaped urban area, nearly 50 miles (80 kilometers) long and stretched along the Hooghly River, one of the many mouths of the Ganges. Dhaka, the megacity capital of Bangladesh used to be on a mouth, until the river’s course changed. The urban area averages little more than 10 miles (16 kilometers) in width. The municipality of Kolkata is in the south, on the east bank of the Hooghly, with most of the suburbs to the north or just across the river.

    Like a number of major urban areas around the world, Kolkata has seen its population growth slow markedly. The peak population growth decade was the 1930s, when there was an increase of 69%. Growth dropped to 29% during the 1940s but continued at 20% or more until 2001. However, between 2001 and 2011, the urban area growth rate dropped to 7%, as the area added only 900,000 new residents. Despite its earlier, smaller size, the Kolkata urban area had not added this few people since the 1921 to 1931 decade.

    In reality, Kolkata is getting less dense by the day. The results of the 2011 Census of India showed that every new resident of the Kolkata urban area was added in the suburbs (Note 1). Yes, the central city of Kolkata remains very dense but its population fell from 4,573,000 people in 2001 to 4,487,000 people in 2011. At the same time, the population of suburban Kolkata grew by nearly 1,000,000 people, and accounted for 110% of the population growth.


    Photo: Howra Bridge, Hooghly River (Howra)

    Kolkata, Los Angeles and China: It also may seem strange that despite its huge typically third world growth since 1951, the Kolkata urban area grew at a rate similar to that of the Los Angeles urban area (Note 2). Los Angeles was larger from the 1960s to 1990, while Kolkata was larger in the 1950s and has been larger the last two decades (Figure 2). Still, Kolkata’s growth has fallen to high income world rates. Other Asian megacities (over ten million)  including Delhi, Shanghai, Beijing, Mumbai, Shenzhen, Manila, Jakarta, Dhaka and Guangzhou) have all experienced much faster growth over the past decade (Note 2). Shanghai and Beijing combined added nearly the same number of people as live in Kolkata.

    Hyper-Densities: Nonetheless, Kolkata continues to have some of the highest densities in the world. In 2001, one third of the central city population (1.49 million) live in slums and shantytowns (photo). They are crammed into just 2 square miles (5 square miles). This would be like all the population of the San Fernando Valley living within a radius 0.6 miles (1 kilometer) of Los Angeles City Hall or all the population of the city of Dallas in the space covered by the passenger terminals at Dallas-Fort Worth International Airport. This is more than 725,000 people per square mile (280,000 per square kilometer), and would nearly equal the "efficient density" definition that the Sierra Club wisely discarded. It can only be hoped that when the 2011 Census slum data is available, it will show that all of the city of Kolkata’s  population loss will have been from the slums.

    Kolkata, like that of other large urban areas around the world described in The Evolving Urban Form series, shows that, given a chance, people reveal their preferences by moving to more space, to construct a better life for themselves and their households.


    Photo: KMC Slum

    Wendell Cox is a Visiting Professor, Conservatoire National des Arts et Metiers, Paris and the author of “War on the Dream: How Anti-Sprawl Policy Threatens the Quality of Life

    Kolkata Urban Area: Population 1901-2011
    Year Kolkata Municipal Corporation (KMC) Suburbs Kolkata Urban Area (Urban Aggolmeration) KMC Share of Growth KMC Growth Suburban Growth
    1901         848,000         662,000          1,510,000 56.2%
    1911         896,000         849,000          1,745,000 51.3% 5.7% 28.2%
    1921      1,031,000         854,000          1,885,000 54.7% 15.1% 0.6%
    1931      1,141,000         998,000          2,139,000 53.3% 10.7% 16.9%
    1941      2,109,000      1,512,000          3,621,000 58.2% 84.8% 51.5%
    1951      2,698,000      1,972,000          4,670,000 57.8% 27.9% 30.4%
    1961      2,927,000      3,057,000          5,984,000 48.9% 8.5% 55.0%
    1971      3,149,000      4,271,000          7,420,000 42.4% 7.6% 39.7%
    1981      3,305,006      5,888,994          9,194,000 35.9% 5.0% 37.9%
    1991      4,400,000      6,622,000        11,022,000 39.9% 33.1% 12.4%
    2001      4,573,000      8,633,000        13,206,000 34.6% 3.9% 30.4%
    2011      4,487,000      9,626,000        14,113,000 31.8% -1.9% 11.5%


    —–

    (Lead Photo: Mahatma Gandhi Road, KMC.

    —–

    Note 1: This is the Kolkata "urban agglomeration," which is the term the Census of India uses to denote urban areas, or areas of continuous urban development. The Census of India, however, applies to criteria to its urban area definitions that make them difficult to compare to urban areas in other parts of the world. The Census of India does not, for example, allow an urban agglomeration to be defined across state lines. Thus, the Delhi urban area continues to be shown as smaller then the Mumbai urban area. This is despite the fact that the immediately adjacent urbanization of Delhi includes millions of additional people in the states of Haryana and Uttar Pradesh and is by international definition by far the largest urban areas in India. The other difficulty is that the Census of India includes the entire land area of any municipality in the urban area. Thus, where municipalities are particularly large in area, as in the case of Mumbai, considerably more land area is reported that he is truly urban. This can lower urban area densities by the inclusion of large areas that are rural. In the case of the call, urban area, the municipalities are generally much smaller, and the geographical definition of the Census of India is much closer to a genuine definition of an urban area or urban agglomeration.

    Note 2: The Mission Viejo urban area is included in the 2000 Los Angeles urban area population in this comparison. Much of this urban area was included in Los Angeles before the 2000 census and it seems likely that it will be reunited with Los Angeles in 2010. The 2010 US urban area geographical definitions have not yet been released. Based upon the change in the Los Angeles metropolitan area population, it is assumed that the Census Bureau’s urban area will show a population of approximately 12.5 million.

    Note 3: Chongqing is sometimes incorrectly characterized as a megacity, because of its status of a "provincial level municipality" in China. However, the Chongqing provincial municipality is largely rural, and covers a land area similar to that of Austria or Indiana. The Chongqing urban area has a population of approximately 7 million.

  • The Evolving Urban Form: Quanzhou

    Quanzhou? Quanzhou (pronounced "CHWEN-JOE"), despite its urban population that is approaching 5 million this urban area is so unfamiliar to Westerners and the rest of the world as to require an introduction. Quanzhou is a prefecture ("shi") in China’s Fujian province. Fujian is just to the north of Guangdong, home of Guangzhou, Shenzhen and Hong Kong’s former province (before the British) and just to the south of Zhejiang, the large rich province at the south flank of the Yangtze Delta (which abuts Shanghai). Quanzhou is also adjacent to Xiamen, one of the original special economic zones established by the legendary reformer Deng Xiao Ping.

    Quanzhou has more than 8 million people in an area similar in size to that of Los Angeles County (4,400 square miles or 11,200 square kilometers). Continuous urbanization spreads through 8 of Quanzhou’s 11 political subdivisions.  

    In Situ Urbanization: Quanzhou has experienced an unusual urban development pattern. Yu Zhu, Xinhua Qi, Huaiyou Shao and Kaijing He at Fujian Normal University have documented an "in situ" urbanization (or urbanization in place, rather than by expansion from a core) that involves conversion of rural areas in place to urban areas, with agricultural employment being replaced by non-agricultural employment. A similar process has been identified in the Indian state of Kerala and some other prefectures in south China. These could be the first natural examples that defy the expansion of urban areas from a core to the periphery that has been the rule since human kind gathered in settlements.

    Quanzhou: The Ultimate: Quanzhou appears to be the most extensive case of in situ urbanization in the world. The older multistoried and single family detached farm houses have become integrated into an urban fabric, though many are falling victim to demolition. Like the economic dynamos of Shenzhen, Dongguan and Guangzhou in Guangdong to the south, Quanzhou has become a major manufacturing center for exports and urbanization is intensifying.

    A Low Density Urban Area for China: The result of in situ urbanization has been a very low density urban area by Chinese standards- something more akin to what some Western planners decry as “sprawl”. Currently, the continuous urbanization of Quanzhou covers an area of more than 500 square miles (1,300 square kilometers) with an estimated population of more than 4.5 million people. At more than 9000 persons per square mile (3,500 per square kilometer), Quanzhou is a quarter more dense than Los Angeles, similar in density to Paris but slightly more than half as dense as Shanghai. Even at its   core, Quanzhou has comparatively low density compared to other Chinese urban areas. For example, the highest density local jurisdiction (Licheng) has a population density similar to that of the city of San Francisco (approximately 18,000 per square mile or 7000 per square kilometer). The three central jurisdictions of Shanghai are 8 times as dense.

    This low density pattern does not extend to nearby urban areas. For example, the core areas of Fuzhou, (Fujian’s capital), just 100 miles up the 8-lane freeway are four times as dense as the core of Quanzhou and the urban area more than double the density.

    Balanced Population Growth: Because it is urbanizing in place, Quanzhou’s population density is increasing throughout the large urban divisions. There is plenty of vacant land throughout the urban area for development, while redevelopment is also taking place at the usually hectic Chinese pace.

    The historic core jurisdictions of Licheng and Fengze grew approximately 30% between the 2000 and 2010 censuses. The largest nearby urban jurisdictions, Jin Jiang and Shi Shi combined for a population increase of approximately 34%, while the outer metropolitan jurisdictions grew only 3%. The outer jurisdictions have far more rural land and are less attractive to residents since low automobile ownership makes them less accessible (see table). There was a population loss of 6 percent in the rural jurisdictions, which is typical for China, as people move for better lives to the urban areas.

    Quanzhou (Fujian) Population Trend by Sector
    Sector 2000 2010 Change % Change
    Jurisdictions with Substantial Urbanization
    Historic Core: Licheng & Fengze      690,000      898,000    208,000 30%
    Near Urban (Jin Jiang & Shi Shi)   1,978,000   2,660,000    682,000 34%
    Outer Urban & Exurban   2,785,000   2,864,000      79,000 3%
    Balance of Prefecture (Principally Rural)   1,830,000   1,719,000  (111,000) -6%
    Total   7,283,000   8,141,000    858,000 12%
    Note: Urban extent estimated at over 4.5 million in 2010

    A Multi-Centric Urban Area: As would be expected in such a low density urban area, Quanzhou is multi-centered, following the pattern of urban areas like Los Angeles, Houston, and Mexico City. The largest center is the historic core, which is divided between Licheng and Fengze (Photograph: Historic core). This core is genuinely historic, with the Kaiyuan Temple (Buddhist) complex dating from 686 AD. Two similar towers (one shown above) were built during the Song Dynasty.


    Historic Core

    But the historic core has substantial modern development. There is extensive new residential high rise and mid-rise development on an island in the Jin river, which is the southern border of Fengze, just north of Jin Jiang. The new high speed rail station is located far from this core and more remote than the major airport, which is located in Jin Jiang.

    There is another strong center in Shi Shi, which is 12 miles (20 kilometers) southeast of the historic core. Shi Shi has a large stock of medium rise buildings and has a small, though dense core (Photograph: Shi Shi core). There are also a number of large residential developments under construction in Shi Shi and major parts of the old core are under redevelopment.


    Shi Shi Core

    Jin Jiang is the largest of the jurisdictions in the metropolitan area, with nearly one quarter of the population. It is located just across the Jin River from Fengze. Jin Jiang also has a commercial core (Photograph: Jin Jiang core), though it is less concentrated than the historic core and the core of Shi Shi. Jin Jiang is also home to the airport serving Quanzhou. New, large multi-building high-rise residential development are under construction in many areas of Jin Jiang.


    Jin Jiang Core

    Vanishing Old China: Quanzhou may be the best place to see remnants of China’s urbanization that preceded the rise of places like Shanghai, Beijing, Wuhan and Chengdu. All three of the largest urban jurisdictions are modern, but each has areas with the dusty roads one would expect to see in a lower income nation. At the same time, Quanzhou is on its way to becoming one of the large, prosperous urban areas of China. Already its gross domestic product and the population of its urban extent exceeds that of Fuzhou, the provincial capital. Most typical throughout urban Quanzhou are the multiple building high rise residential developments typical of all large Chinese urban areas. At the same time, there are wide expanses of demolition, where the remnants of the older buildings remain, as sites are readied for more modern projects.

    Replicability? The process of in situ urbanization requires very high rural densities that can equal or exceed the 1000 per square mile or 400 per square kilometer standard used to delineate urban areas by census authorities in Canada, France, the United Kingdom, the United States and some other nations. There would simply be too much space between villages and houses in the rural areas of places like Kansas, Saskatchewan or the Ukraine. As a result, it situ urbanization is likely to remain the rare exception. However, if the world, especially Europe, were to follow the integrative urban-rural model suggested by Thomas Sieverts at the University of Darmstadt (Cities without Cities), something like in situ urbanization would be the result.

    Lead Photo:
    Zenguo Tower at Kaiyuan Temple, Licheng district of Quanzhou (all photos by author)

    See the attached file for 100 more photos of the region.

    Wendell Cox is a Visiting Professor, Conservatoire National des Arts et Metiers, Paris and the author of “War on the Dream: How Anti-Sprawl Policy Threatens the Quality of Life

  • The Evolving Urban Form: Delhi

    It has been a time of ups and downs for Delhi, which has emerged as the largest urban area (area of continuous urban development) in India. By a quirk in the Census of India definitions, an urban area (urban agglomeration) may not cross a state or territorial boundary. As a result, Delhi continues to be the second largest urban area in India according to the Census of India.

    However, as a Population Reference Bureau reported, the population of the urban expanse of Delhi had exceeded that of Mumbai by 2007 to become the largest urban area. In 2007, the Population Reference Bureau noted that the continuous urbanization of Delhi extended into the adjacent states of Haryana and Uttar Pradesh (which has largest population of any sub-national jurisdiction in the world).

    In 2010, the United Nations placed the Delhi urban area population above that of all other urban areas in the world with the exception of Tokyo. This second ranking position was only temporary, since new census data showed stronger growth in Jakarta (Jabotabek) and Seoul. These developments, along with a smaller than anticipated population in the interstate Delhi urban area dropped Delhi to fourth position after the 2011 census. Even so, with its stronger growth, and given the plummeting birth rates in Korea, it can be expected that Delhi will exceed the population of Seoul within one or two years.

    Delhi has experienced some of the quickest and most substantial urban growth in the history of the world. Since the 1951 census, Delhi has grown from under 1.5 million people to a population of 22.6 million in 2011 (Figure 1). Delhi has been one of the fastest growing urban areas in history and (along with Jakarta, Seoul and Manila) has added approximately 20 million people over the past 60 years. Only Tokyo has added more new residents than these four urban areas, (25 million population).

    The national capital of India is the city of New Delhi (Note 1), which is a district of the National Capital Territory of Delhi. New Delhi is a fully planned national capital that is among the most impressive in the world, with broad expanses of green space not unlike that of Washington, DC. New Delhi became the capital in 1911, replacing Kolkata and much of the planned capital area was completed by the 1930s.

    An Interstate Urban Area

    This interstate urban area includes all of the urbanization of the National Capital Territory, which includes the urban core, as well as the adjacent Gahziabad and the Noida urban areas in the state of Uttar Pradesh and the Faridibad and Gurgaon urban areas in the state of Haryana.

    Between 2001 and 2011 (Figure 2):

    • The population of the inner area, which includes New Delhi and the Central, North, Northeast and East districts of the National Capital Territory grew 15 percent. This area accounted for 10 percent of the urban area growth.  Consistent with the experience of other inner areas (such as Mumbai, Shanghai, Chicago and Kolkata), inner core of this area (New Delhi and the Central District) lost population between 2001 and 2001 (14 percent).
    • The balance of the urban area inside the National Capital Territory grew by 2.8 million people, an increase of 33%. This area captured 47% of the interstate urban area population growth.
    • The urban areas outside the National Capital Territory grew slightly less, at 2.7 million and accounted for 44% of the interstate urban area population growth. These outer areas grew by far the fastest, from 2.6 million to 5.3 million, an increase of .


    Map of Dehli districts courtesy of wikipedia user Deeptrivia

    Between 2000 and 2011, the strongest growth was in the urbanization in Uttar Pradesh and to the southwest in Haryana.

    Gurgaon (photograph below), in Haryana, abuts Indira Gandhi International Airport on the south side, has emerged as an important corporate and information technology center. Gurgaon grew from 250,000 people in 2001 to 900,000 in 2011.

    Ghaziabad (photograph below), in Uttar Pradesh, is located adjacent to Delhi’s Northeast district and is the largest of the urban expanses beyond the National Capital Territory, having grown from approximately 975,000 people 2001 to more than 2,350,000 people in 2011.

    Noida (photograph below), in Uttar Pradesh, is another business center, is a special econonomic zone and includes a software technology park). Noida is located in Delhi and grew from approximately 300,000 in 2001 to nearly 650,000 in 2011.

    Faridabad (photograph below), in Haryana, is located directly to the south of the National Capital Territory and had the slowest percentage growth among the urban expanses beyond the National Capital Territory, growing from 1,050,000 people in 2001 two 1,400,000 people in 2011.

    The preponderance of growth in the suburban areas mirrors the trend in the previous census. Between 1991 and 200l, 26% of the growth was in the inner area and 74% of the growth in the outer areas of the National Capital Territory.

    Common Threads

    Even with its somewhat less than expected growth over the past decade, the Delhi continues to be among the fastest growing metropolitan regions in the world. Including adjacent rural areas, the Delhi metropolitan region (Note 2) added approximately 6.0 million people between 2001 and 2010 (growing from 20.4 million to 26.4 million). This compares to the 10 year gain of 7.4 million in Jakarta, 6.6 million in Manila and Shanghai and 6.1 million in Beijing.

    The Delhi urban area illustrates the same pervasive urban growth trend evident around the world. As urban areas become larger, they tend to grow most rapidly on their periphery as opposed in the core. As a result, contrary to popular misconception, they are overall becoming become less dense. In Delhi, as well as in all of the other urban areas or metropolitan regions examined in the Evolving Urban Form series, growth is concentrated in the suburbs and further out on the periphery.

    —-

    Note 1: The city of New Delhi is officially the capital of India. It is, however, only a small part of the National Capital Territory of Delhi. The city of New Delhi had a population of 134,000 in 2011, down one-quarter from 169,000 in 2001. While the term "New Delhi" has often been used to denote the urban agglomeration, both the government of India and the United Nations refer to the urban agglomeration as Delhi.

    Note 2: This metropolitan region definition includes the National Capital Territory and the Ghaziabad and Gatam Buddha Nagar (Noida) districts of Uttar Pradesh and the Gurgaon and Faridabad districts of Haryana (districts are analagous to counties in the United States).

    Top Photograph: India Gate in New Delhi. All photos by author

    Wendell Cox is a Visiting Professor, Conservatoire National des Arts et Metiers, Paris and the author of “War on the Dream: How Anti-Sprawl Policy Threatens the Quality of Life

  • The Evolving Urban Form: Milan

    Italy’s population growth has been stagnating in recent decades, but has turned around during the last decade, with the annual growth rate increasing 16 times (from 0.04 percent to 0.69 percent). According to United Nations data, Italy added more international migrants in the 2000s (3.8.5 million) than it added people in any ten year period since 1960. Some of the strongest growth has been in the Milan metropolitan region, which has begun to grow again after years of stagnation. This is not due to any increase in Italian birth rates but principally because of surging international migration.

    Much of this has to do with the enlargement of the European Union (EU) from 15 to 27 member states, and the consequent removal of all legal barriers to internal migration. The Milan metropolitan region, occupies much of Lombardy, Italy’s most populated region. Milan added 634,000 foreign residents in just six years (2000 to 2008, the latest year for which data is available).  The largest share, 103,000, was from the EU’s Romania, with 50,000 from Albania, 47,000 from Morocco, 30,000 each from Ecuador and Egypt and 27,000 from Ukraine. Over the period, more than 80 percent of Lombardy’s growth has come as a result of international immigration.  The key to this lies with the region’s economy, which is the strongest in Italy and all of southern Europe.

    International migration has also fueled large population increases elsewhere, especially in both northern and central Italy, such as Rome and Turin. Further south, however, growth (such as in the Naples area) has continued to be comparatively slow (Figure 1).

    The Urban Area: The Milan urban area is the largest in Italy. The Milan urban area stretches from the core of Milan northward to the Alps and includes development in the provinces of Varese (photo), Como, and Lecco (Photo: Lecco) as well as Monza and Brianza. The province of Como is home to the picturesque Lake Como, while Varese sits at the foot of the Simplon Tunnel (of "Venice Simplon-Orient Express" fame) and the highway over Simplon Pass to Brig in Switzerland’s Rhone Valley and the Matterhorn.


    Varese


    Lecco: Northernmost suburbs


    There is also considerable development both to the east and the west in the province of Milan and more limited development to the south. Overall, the urban area has a population of approximately 5,400,000 (Note 1), covering approximately 800 square miles (2,100 square kilometers) for a population density of approximately 6,700 per square mile (2,500 per square kilometer).  This is similar to that of Los Angeles or Toronto.

    Growth in the Metropolitan Region: Until the recent increase in international migration, the Milan metropolitan region was growing slowly and more recently even losing population. Between 1991 and 2001, the metropolitan region lost one percent of its population. However, since 2001 the metropolitan region has gained 9.0 percent, an improvement from the minus 1.1 percent between 1991 and 2001. The last decade’s growth was at an average annual increase rate of 0.96 percent which is slightly more than the United States (0.94 percent) and slightly less than Canada (1.04 percent). 

    The Inner City: The commune of Milan is the central municipality of Milan metropolitan region. The population of Milan peaked in 1971 at just under 1,700,000 people. By 2001 the population had fallen to approximately 1,250,000 people, a loss of approximately 25 percent and its lowest population since before the 1951 census. The central municipality of Milan continued to lose population to 2001. From 1991 to 2001, Milan lost more than 100,000 people and nine percent of its population. Milan is not unusual in this decline. Declines have been characteristic for virtually all Western European central municipalities, except where there was substantial greenfield space to accommodate new suburban development (such as in Rome).

    However, the commune of Milan has begun to grow again. Milan’s population has increased by nearly 70,000 people or 5.4 percent. Milan now has a population density of 18,600 per square mile (7,200 per square kilometer), slightly higher than that the city of San Francisco (Photo: Milan). Even with the recent increase, however, all of the growth in the Milan metropolitan region since 1991 has been in the suburbs and exurbs (Figure 2) and 87 percent in the last decade (Figure 3).


    Milan

    Much of the commune’s population increase has been the result of international migration, since many Italians continue to migrate to the surrounding suburban and exurban areas, as is the case in a number of European metropolitan regions.  Domestic out-migration continued from the commune of Milan, while the suburbs and exurbs attracted domestic migrants (Note 2).

    Inner Suburbs: The inner suburbs of Milan include portions of the province of Milan outside the commune of Milan and the (single) province of Monza and Brianzia, which was separated from the province of Milan earlier in the decade. The inner suburbs also lost population between 1991 and 2001. This was reversed between 2000 and 2010, when the inner suburbs added approximately 230,000 people, and grew at an overall rate of 9.4 percent. The inner suburbs have a population density of approximately 5,000 per square mile (1,900 per square kilometer), somewhat less than the Sydney urban area and 1.5 times that of Portland.

    Outer Suburbs and Exurbs: The outer suburbs and exurbs stretch north to the foot of the Alps, as well as to the south of the province of Milan. The largest population is to the north, with a far smaller population to the south, in the exurban provinces of Pavia and Lodi. Unlike the commune of Milan and the inner suburbs, the outer suburbs and exurbs have grown in each of the last decades.  Between 1991 and 2001, the outer suburbs and exurbs accounted for all the growth, though at a modest rate of 2.5 percent. The growth has substantially increased since 2001 with the addition of more than 245,000 new residents and a growth rate of 10.4 percent. International migration accounted for 93 percent between 2002 and 2008, 93 percent were foreign (202,000).

    Where the Immigrants are Moving: As might be expected with strong international migration, most of the new entrants have moved to the inner city and inner suburbs. Between 2002 and 2006, 97 percent of the population growth was from international migration, with an addition of 202,000. The overall foreign population increased 119 percent from 2002 to 2008. Yet, the percentage growth was much stronger in the outer suburbs and the exurbs, where the foreign population grew 171 percent (125,000). However, this represented a smaller share of the overall growth (67 percent), which is likely to be an indication of strong outbound domestic migration from the inner city and the inner suburbs to the outer suburbs and exurbs. There was also strong foreign population growth in the balance of Lombardy, with an increase of 147 percent, which constituted a somewhat higher share of overall growth, at 84 percent (Figure 4).

    Decentralizing, Diversifying Milan: Like the other international urban areas (Note 3), Milan continues to suburbanize, though growth has also resumed in the historic core municipality. At the same time, international migration is changing Milan and Italy. United Nations (UN) data indicates that the number of international migrants to Italy was 10 times higher in the 2000s than in the 1990s. The UN projects that the inflow will drop by 50 percent between 2010 and 2015 and then to approximately one-third the 2000s influx to beyond 2050. Whatever the result, because of its strong economy, the Milan area will doubtless continue to attract a disproportionate share of the new arrivals.

    Wendell Cox is a Visiting Professor, Conservatoire National des Arts et Metiers, Paris and the author of “War on the Dream: How Anti-Sprawl Policy Threatens the Quality of Life

    —–

    Note 1: Milan is one of a small number of large urban areas that is often dismissed as being much smaller than it really is. This is because data for metropolitan regions is not routinely produced in Italy and Milan. As a result, analysts often referred to the population of the historical core municipality which has only 20 percent of the metropolitan population. Similar problems of national reporting occur in Germany’s Rhine – Ruhr (Essen-Dusseldorf) metropolitan region and Jakarta, Manila and Kuala Lumpur. The Rhine-Ruhr does not appear on the United Nations urban agglomeration list of all over 750,000, despite the fact that it has 7 million people in close proximity, at near average Western European large urban area densities (7,100 per square mile or 2,800 per square kilometer, compared to the Western European average of 8,000 per square mile or 3,100 per square kilometer)

    Note 2: More detailed data is not available on the internet from the Istituto Nazionale di Statistica Italia, Italy’s statistical bureau.

    Note 3: See additional reviews in the "Evolving Urban Form" series, at : Beijing, Chicago, Dallas-Fort Worth, Jakarta, Los Angeles, Manila, Mexico City, Mumbai, New York, SeattleSeoul and Shanghai .

    Photo: Duomo (Cathedral), Milan. Photographs by author.

  • The Evolving Urban Form: Beijing

    China’s capital, Beijing, has long been one of the world’s largest urban areas. Some reports placed its population at over 1 million in 1800, which would have made Beijing the largest urban area  in the world at that time. Later in the nineteenth century, Beijing dropped below 1 million population, as London, Paris and later New York rose to prominence. As late as 1953, Beijing had a population of fewer than 3 million. Since then the city’s population has  increased more than six times (Figure 1).

    Beijing is one of China’s four "directly administered municipalities" or "provincial level municipalities," along with Shanghai, Chongqing and Tianjin (Note 1). Moreover, like Shanghai and Tianjin, Beijing is essentially a metropolitan area, composed of an urban area and exurbs approximating a labor market. This is unlike Chongqing, which has extensive rural areas and extends far beyond any plausible definition of a metropolitan area (having the land area approximately the size of Indiana or Austria).

    The Growing Beijing Urban Area: In the 1990s, Beijing added 2,700,000 people and had a population of 13.6 million in 2000. Between 2000 and 2010, Beijing population increased by more than double the previous increase, or an increase of 6 million people.

    The Expanding Beijing Urban Area: Based upon the most recent census, the next edition of Demographia World Urban Areas will estimate an urban area (urban footprint) population of 17 million, with an urban land area of 1,350 square miles (3,500 square kilometers) and an urban density of 12,600 per square mile (4,900 per square kilometer) in 2011. Beijing ranks as the world’s 12th largest urban area and is larger than any urban area in the United States or Europe with the exception of New York. As in other urban areas of China, there is considerable undeveloped land in enclaves within the suburban areas, which could develop further, raising both the population and the density.

    Falling Urban Densities: Even so, Beijing is far less dense than before. Deng and Huang at the State University of New York, Albany, place the 1949 urban land area at less than 25 square miles (63 square kilometers. Based upon its early 1950s population of less than 3,000,000, the population density of the entire urban area could have been more than 100,000 per square mile or 40,000 per square kilometer (precise urban population is not available). This is greater than the highest density major urban area today, Dhaka (Bangladesh) at 90,000 per square mile or 35,000 per square kilometer. Today’s urban Beijing may have an overall population density one-eighth that of the 1950s.

    This illustrates a reality often missed by urban analysts, who confuse population growth with increases in population density. In fact, as the Evolving Urban Form series (Note 2) indicates, dispersion is at least as important in the expansion of megacities as population growth itself. Population densities generally decline as urban areas add residents.

    Suburbanizing Beijing: Consistent with the international urban trends, most growth over took place outside the core (see table at bottom and Figure 2). As Beijing has suburbanized, it has added "ring roads," (beltways or loops) which except for the 1st ring road (around the Forbidden City) are freeways, often with Texas-style frontage roads (See "2nd Ring Road" photo). Now there are six ring roads and there has been some discussion of a seventh, which would extend to the adjacent Hebei province to the south. Real-time traffic conditions on the first five ring roads can be seen at the Beijing Traffic Management Bureau site (the 6th ring road is outside the map)


    2nd Ring Road with frontage roads

    At the same time, Beijing’s expansive suburbs do not resemble the low-density suburbanization of Phoenix, Portland, Perth or Paris. Much of the development is in high rise condominiums and a substantial part is lower quality, lower rise development that houses Beijing’s large and growing migrant population (referred to as the "floating population"), most of whom do not have Beijing resident (hukou) status. Even so, there is no shortage of detached luxury housing (called "villas") in western style developments. such as "Orange County." More recently there is increasing demand for a more modern version of the "siheyuan" (courtyard) housing makes up the renown "hutong" areas of Beijing and other Chinese cities. One website refers to the "siheyuan" as the Chinese version of the "American Dream" and a recent China Daily commentary even suggested that this type of housing should constitute the future expansion of Beijing.  However, a quick review of real estate offerings for the new siheyuans, makes it clear that they are simply unaffordable for a growing middle class that finds it difficult to afford new flats in high rises outside the 4th ring road.  

    Hutong neighborhood (Dongcheng qu)

    A map of Beijing’s districts can be seen here, with color coding that corresponds to the geographical divisions in the table.

    The Inner City: During the last census period, less than one percent of the population growth has been in the inner city, which consists of the districts of Xicheng and Dongcheng, largely inside the 2nd ring road and contains the Forbidden City, Tiananmen Square, the Drum Tower (see photo below) and Bell Tower, and the Yonghegong Lama Temple (Buddhist). These districts, which contain nearly all of the remaining hutong (see photo above) residences grew only 2.2 percent. At 61,000 people per square mile (23,500 people per square kilometer), inner Beijing approaches the population density of Manhattan or the Ville de Paris.


    Toward the Drum Tower, from Jingshan Park

    Outside the Inner City: More than 99 percent of Beijing’s growth was outside the inner city. The first and second ring suburbs accounted for 96 percent of the growth, while the outer areas accounted for three percent of the growth.

    First Ring Suburbs: The four inner suburban districts of Beijing captured 52 percent of the provincial growth between 2000 and 2000. Overall, the four suburban districts added 3.2 million people, a nearly 50 percent increase in population. The population density in the inner suburbs was 19,400 per square mile in 2010 (7,500 per square kilometer). This is a higher density than the city of San Francisco. The inner suburban districts are generally located within the 5th ring road. The first ring suburbs include the district of Chaoyang, which has the largest population and where at least one-half of the population    generally lack Beijing residency (hukou). Chaoyang is also home to the new Beijing "central business district," (CBD) which is the largest concentration of high rise towers in the urban area includes  the controversial architectural icon, the CCTV Headquarters (photo at the top). The development of the CBD in the inner ring suburbs and other major commercial development are indicative of a dispersion of employment that, if permitted to continue, could ease Beijing’s legendary traffic congestion.

    Second Ring Suburbs: The outer suburban districts accounted for 44 percent of the provincial population increase between 2000 and 2000 and 2010. However, the outer suburban districts had the highest growth rate, at 72 percent, The outer suburban districts are generally located outside the 5th ring road and include considerable rural territory. The population density is 2100 per square mile (800 per square kilometer). Beijing Capital International Airport is located in this area, though it is under the jurisdiction of the inner ring district of Chaoyang. This airport is now the world’s second busiest in passenger volume, following Atlanta and having passed perennial runner-up O’Hare International in Chicago. At current growth rates Beijing Capital International could become the world’s busiest airport within five years.

    Outer Areas: The outer areas are largely rural and well outside the urban area. Nonetheless, the growth rate in the outer areas was well above the national rate and six times the rate of the inner city. The outer areas gained 186,000 people, approximately four times the inner city gain.

    Future Challenges: The floating population Beijing (and Shanghai) represented most of the population growth from 2000 to 2010. More than 7 million of Beijing’s nearly 20,000,000 population are migrant workers.   Government officials have expressed concern at the rate of population growth and have indicated an interest in severely limiting future population growth. Among Beijing’s considerable challenges is providing sufficient water for its large population. Beijing lacks the plentiful supply of water that is available to many urban areas of central and southern China (example, Shanghai, Nanjing, Wuhan and Chongqing) and the government is building a system to divert water especially from the Yangtze River. The 2020 census results could reveal a significant slowdown in growth, if these problems are not sufficiently addressed. 


    Beihei Park

    Wendell Cox is a Visiting Professor, Conservatoire National des Arts et Metiers, Paris and the author of “War on the Dream: How Anti-Sprawl Policy Threatens the Quality of Life

    ——–

    Note 1: What are translated as "cities" in China are not cities as understood in the West. A "shi" in China (translated as "city") is actually a region that may approximate a metropolitan area or labor market area in the West (with an urban core and a much larger surrounding rural territory). Some "shis" are much larger, however, such as Chongqing, which covers a land area similar to that that of Austria and nearly as large as Indiana. Chongqing and many other "cities" are far larger than any plausible metropolitan area definition.

    "Shi" may exist either at the provincial level (as in the case of Beijing, Chongqing, Shanghai and Tianjin) or it may exist within a provincial level jurisdiction, such as Nanjing in Jiangsu. Guangzhou in Guangdong or Wuhan in Hubei. Every square mile of a province (excepting the provincial level jurisdictions) is divided into shis, prefectures or comparable units, in the same way that US states are divided into county level jurisdictions or the regions of France are divided into departments. To complicate matters more, shis themselves may have county (xian) level shis within their borders, such as Cixi, a county level shi with approximately 1,000,000 people within the Ningbo shi in Zhejiang province.

    Note 2: Other megacities reviewed in this series have been: Jakarta, Los Angeles, Manila, Mexico City, Mumbai, New York ,Seoul and Shanghai .

    Photo: CCTV Headquarters in new Beijing CBD, Chaoyang district. Photo by Iamdavidtheking.

    All other photos by author.

  • The Evolving Urban Form: Los Angeles

    Los Angeles has grown more than any major metropolitan region in the high income world except for Tokyo since the beginning of the twentieth century, and also since 1950.  In 1900, the city (municipality, see Note) of Los Angeles had little over 100,000 people and ranked 36th in population in the nation behind Allegheny, Pennsylvania (which has since merged with Pittsburgh) and St. Joseph Missouri (which has since lost more than one quarter of its population).

    As people moved West in the intervening decades and especially after World War II, the Los Angeles area exploded in population. By 1960, the Los Angeles metropolitan area, which was then and is now composed of Los Angeles and Orange counties, had passed Chicago to become second in population only to the New York metropolitan area. It was to take considerably longer for the city of Los Angeles to pass the city of Chicago as the nation’s second largest municipality, though this occurred by the 1990 census.

    The Los Angeles combined statistical area (analogous to the former consolidated metropolitan statistical area) is made up of three metropolitan areas, Los Angeles, Riverside – San Bernardino and Oxnard (Ventura County). This combined area covers 35,000 square miles or more than 90,000 square kilometers. This is a land area nearly as large as that of Hungary and larger than Austria. The overwhelming share of the CSA is rural, with less than 10 percent of the land area developed.

    Growth from 1900: The CSA had only 250,000 people in 1900, though grew to nearly 5,000,000 in 1950. By 2010, the population was nearing 18 million, a figure not much less than that of Australia, at 22 million (Table 1). Indeed until 1990 the Los Angeles CSA population was closing in on Australia. However, since that time population growth in the Los Angeles area has slowed considerably and Australia should remain larger.

    Table 1
    Los Angeles Combined Statistical Area: Population (CSA): 1900-2010
    Year City of Los Angeles Balance: LA County  Los Angeles County   Orange County   Riverside County   San Bernardino County   Ventura County   Total 
    1900        102,479                   67,819         170,298           19,696         17,897            27,929         14,367         250,187
    1910        319,198                 184,933         504,131           34,436         34,696            56,706         18,347         648,316
    1920        576,673                 359,782         936,455           61,375         50,297            73,401         28,724     1,150,252
    1930    1,238,048                 970,444      2,208,492         118,674         81,024         133,900         54,976     2,597,066
    1940    1,504,277              1,281,366      2,785,643         130,760       105,524         161,108         69,685     3,252,720
    1950    1,970,358              2,181,329      4,151,687         216,224       170,046         281,642       114,647     4,934,246
    1960    2,479,015              3,559,756      6,038,771         703,925       306,191         503,591       199,138     7,751,616
    1970    2,816,061              4,216,014      7,032,075     1,420,386       459,074         684,072       376,430     9,972,037
    1980    2,966,850              4,510,653      7,477,503     1,932,709       663,166         895,016       529,174   11,497,568
    1990    3,485,398              5,377,766      8,863,164     2,410,556    1,170,413      1,418,380       669,016   14,531,529
    2000    3,694,820              5,824,518      9,519,338     2,846,289    1,545,387      1,709,434       753,197   16,373,645
    2010    3,792,621              6,025,984      9,818,605     3,010,232    2,189,641      2,035,210       823,318   17,877,006
    Consolidated statistical area as defined by OMB as of 2010

    The city of Los Angeles had grown 88 percent from 1950 to 2000, but over the past decade added only three percent to its population. Even more spectacular declines in growth occurred in the rest of the CSA. For example, Orange County had grown 1200 percent between 1950 and 2000 yet grew only six percent in the last decade.

    Growth: 2000 to 2010: The population growth in the Los Angeles CSA was widely dispersed and away from the core. The central area (urban core) of the city Los Angeles extends from the Santa Monica Mountains to South Los Angeles and from the boundaries of Beverly Hills, West Hollywood and Culver City to East Los Angeles grew only 0.7 percent. Uniquely, the central area densified strongly between 1960 and 2000, while other urban cores nearly all declined in population, whether in the United States or Western Europe. Much of this was due to strong immigration from Mexico, other parts of Latin America, as well as Asia.

    The inner suburban ring, which includes the balance of Los Angeles County south of the Santa Susana and San Gabriel Mountains as well as the older northwestern Orange County suburbs grew by 1.5 percent. Within this area, 32 inner suburbs (all in Los Angeles County) grew from 1.766 million to 1.767 million (0.1 percent) from 2000 to 2010 (Note 2).

    The outer suburbs, which include the balance of Orange County (including the Mission Viejo urban area) and the western portions of Riverside and San Bernardino counties (including the Riverside – San Bernardino urban area) grew 19 percent.

    The exurban areas, which include areas outside the core urban areas of Los Angeles, Riverside-San Bernardino and Mission Viejo grew 30 percent. The hot spots included Ventura County, the Santa Clarita Valley, the Antelope Valley, the Victorville-Hesperia area, the Coachella Valley (Indio-Palm Springs), the Hemet area and the Temecula-Murrieta area. An argument could be made that Temecula-Murrieta would be in the San Diego metropolitan area if metropolitan areas were defined by smaller area units, such as municipalities (as in Canada) or census tracts. The exurban areas are more attractive to residents at least in part because of considerably less expensive housing and their greater availability of detached houses than in the three core urban areas.

    More remote areas of the desert extending to the Nevada and Arizona borders added 42 percent to their population (Table 2, Figure 1 and 2).

    Table 2
    Los Angeles CSA: Population by Sector: 2000-2010
    Sector 2000 2010 Change % Change
    Central Los Angeles          1,752,024              1,763,967         11,943 0.7%
    Inner Ring          9,093,756              9,231,513       137,757 1.5%
    Outer Suburbs          3,053,615              3,630,273       576,658 18.9%
    Exurbs          2,173,459              2,822,884       649,425 29.9%
    Remote             301,331                 428,369       127,038 42.2%
    Total       16,374,185            17,877,006    1,502,821 9.2%

    City of Los Angeles: The dispersion of population was also evident in the city of Los Angeles. For decades, the city of Los Angeles has grown strongly. Approximately one-quarter of this growth since 1960 has been the densifying central area, as noted above.

    However, little noted is the fact that most of the city’s growth was greenfield suburban in nature, built at low and moderate densities and largely car-oriented. For most of the past fifty years the growth has been “over the hill” in the San Fernando Valley, a formerly rural area which was annexed by the city before 1930. Between 1950 and 2010, the population of the San Fernando Valley grew from 300,000 to 1,400,000. Thus, the Valley grew like virtually every fast-growing historical core city in the nation that has grown since 1950, by filling up empty land (Figure 3).

    Much has been written about the “Manhattanization” of the Los Angeles core. However, with only 13 towers more than 550 feet, downtown Los Angeles is no threat to Manhattan, with more than 125, or even Chicago with more than 70. Further, job growth is stagnant, with virtually no change in private sector employment over the last decade, despite substantial government subsidies.

    Between 2000 and 2010, the central area grew at its slowest rate since the 1950s, growing by only 0.7 percent to its population, growing only 12,000 (to 1,764,000) or barely 12 percent of the city’s growth. Nonetheless, and contrary to the reputation of Los Angeles, the central area is very densely populated, at approximately 14,000 people per square mile, with the highest density census tracts having more than 90,000 residents per square mile. Among the nation’s largest municipalities, only New York and San Francisco are denser than central Los Angeles.

    The big story in growth was on periphery. The San Fernando Valley captured 70 percent of the city’s growth in the 2000s, with considerable greenfield expansion in the hills north of Chatsworth and Northridge. Even so, the Valley’s growth was only five percent. The western portion of the city, which extends from the Santa Monica Mountains to Los Angeles International Airport, grew three percent and accounted for 13 percent of the city’s growth. The Harbor area added two percent to its population and accounted for five percent of the city’s growth (Figure 4).

    The Future: Growth or Stagnation? After more than a century of spectacular growth, Los Angeles demographic juggernaut is stagnating and could conceivably go in reverse due to declining immigration, an exodus of middle class and working class families.  Indeed Even the strong growth in the outer suburbs and exurbs was not sufficient to drag the regional population increase (9 percent) up to the national rate of 10 percent between 2000 and 2010.

    The immediate prognosis should be for even slower growth. The financial, regulatory and cost of living disadvantages of California are widely recognized by households and businesses alike. With stronger regulations in the offing, such as the stronger land use restrictions likely to occur as a result of Senate Bill 375, any future growth on the periphery could be dampened. Even with multi-billion support in terms of tax breaks and public investment, the central core seems unlikely to come close to making much of a real difference, at least beyond the media.  Los Angeles may not be on the road to Rust Belt stagnation, but the dynamism of the last century is no more.

    ——

    Note 1: In this article, the term "city" means municipality.

    Note 2: This includes municipalities and census designated places nearest the central area of the city of Los Angeles, from Glendale and Pasadena through Monterey Park to South Gate, Compton and Gardena and to the west of the central area.

    Note 3: Biographical Note: The author was born in the Echo Park district, near downtown Los Angeles.

    Photograph: Downtown Los Angeles from Echo Park (by author)

    Wendell Cox is a Visiting Professor, Conservatoire National des Arts et Metiers, Paris and the author of “War on the Dream: How Anti-Sprawl Policy Threatens the Quality of Life

  • The Evolving Urban Form: Chicago

    Looks can be deceiving. No downtown area in the western world outside Manhattan is more visually impressive than Chicago. Both the historic Loop and the newer development north of the Chicago River, especially along North Michigan Avenue have some of the most iconic structures outside of emerging Asia. Yet these vertical monuments mask a less celebrated reality: that of dispersing, low density urban area.

    Chicago Combined Statistical Area: Let’s take a close look at the 2010 census data. Overall, the combined statistical area, which includes the metropolitan area (Note 1) and two exurban counties added nearly 365,000 people, for a growth rate of 3.9 percent. This is well below the national growth rate of approximately 10 percent (Map, Figure 1). Chicago followed the general trend of with growth being greatest in the outer suburbs while declines took place both in the inner suburbs and the historical core municipality (Figure 2).

    Massive Core City Loss: The historical core city of Chicago lost but 200,000 people, and fell to a population of 2.7 million, the lowest count since the 1910 census. The population is down 925,000 from 1950 and at the current rate would drop at least 1 million from the 1950 peak by the 2020 census.  Chicago is at risk of joining London and Detroit as the only two historical core municipalities in modern times that have lost more than 1 million people.

    Inner Suburbs: As in New York and Seattle, Chicago’s inner suburbs grew slowly. The inner suburbs include the part of Cook County that is outside the city of Chicago as well as Lake County, Indiana (home of Gary), which shares the city of Chicago’s eastern border. The inner suburbs added fewer than 30,000 residents and grew only one percent.

    This suggests some limitations to the newly developing mantra that has inner suburbs will be the locus of future growth although there are scattered inner suburbs in other cities (such as Hoboken, New Jersey) that did see growth. Perhaps the old mantra, about people returning to the city from which they had never come was finally quashed by the realities of the 2010 census.   

    Outer Suburbs: The outer suburbs, which include the remaining counties of the metropolitan area, grew at a rate of 16.5 percent, actually grew faster than the national average of approximately 10 percent. The outer suburbs added more than 500,000 people. The largest growth, 175,000 was in Will County, to the south, one of the five “collar counties” that used to define the boundaries of the metropolitan area. McHenry County, the most distant of the collar counties added 100,000. The fastest growth was in far suburban and also southern Kendall County, which more than doubled in population.

    Chicago Metropolitan Area: Overall, the Chicago metropolitan area added approximately 360,000 people and grew 4.0 percent from 2000. This is well below the national average population growth rate, however was above that of the Los Angeles metropolitan area, once among the  nation’s of leading growth areas until the last decade.

    Historical Trends: The city of Chicago, like other historical core cities, had previously been dominant in its metropolitan area. The earliest Census Bureau metropolitan area (“metropolitan district”) estimates from 1900 indicated that more than 90 percent of the region’s population was contained in the city of Chicago. By 1950, the city of Chicago had fallen to 66 percent of the metropolitan area as defined in that year.  The city of Chicago now has only 28 percent of the combined statistical area population of 9.7 million (Figure 3, Table and Note 2).

    CHICAGO METROPOLITAN AREA
    POPULATION TREND BY COUNTY: 2000 TO 2010
    1900 1950 2000 2010 Change: 2000-2010 % Change: 2000-2010
    HISTORIC CORE MUNICIPALITY
    Chicago   1,698,575   3,620,962   2,895,671 2,695,598 -200,073 -6.9%
    INNER SUBURBAN      178,052   1,255,982   2,965,634 2,995,082 29,448 1.0%
    Cook County, IL      140,160      887,830   2,481,070 2,499,077 18,007 0.7%
    Lake County, IN        37,892      368,152      484,564 496,005 11,441 2.4%
    OUTER SUBURBAN      378,896      884,980   3,237,011 3,770,425 533,414 16.5%
    DeKalb County, IL        31,756        40,781        88,969 105,160 16,191 18.2%
    DuPage County, IL        28,196      154,999      904,161 916,924 12,763 1.4%
    Grundy County, IL        24,136        19,217        37,535 50,063 12,528 33.4%
    Jasper County, IN        14,292        17,031        30,043 33,478 3,435 11.4%
    Kane County, IL        78,792      150,388      404,119 515,269 111,150 27.5%
    Kendall County, IL        11,467        12,155        54,544 114,736 60,192 110.4%
    Kenosha County, WI        21,707        75,238      149,577 166,426 16,849 11.3%
    Lake County, IL        34,504      179,097      644,356 703,462 59,106 9.2%
    McHenry County, IL        29,659        50,656      260,077 308,760 48,683 18.7%
    Newton County, IN        10,448        11,006        14,566 14,244 -322 -2.2%
    Porter County, IN        19,175        40,076      146,798 164,343 17,545 12.0%
    Will County, IL        74,764      134,336      502,266 677,560 175,294 34.9%
    CHICAGO METROPOLITAN AREA   2,255,523   5,761,924   9,098,316 9,461,105 362,789 4.0%
    EXURBAN METROPOLITAN COUNTIES        75,540      150,332      213,939 224,916 10,977 5.1%
    Kankakee Coiunty, IL        37,154        73,524      103,833 113,449 9,616 9.3%
    La Porte County, IN        38,386        76,808      110,106 111,467 1,361 1.2%
    CHICAGO COMBINED STATISTICAL AREA 2,331,063 5,912,256 9,312,255 9,686,021 364,150 3.9%
    Data from the US Census Bureau


    Since 1950 (Note 3), all of the growth in the Chicago area has been in the suburbs. By 2000, both inner suburbs and the outer suburbs each had more people than the city of Chicago. Today the outer suburbs, with forty percent of the region’s population, represent the largest demographic force in Chicago (Figure 4).

    We do not usually associate Chicago with the dreaded term “sprawl” but Chicago now stands as the third largest urban agglomeration in the world in land area, trailing only New York and Tokyo. The Chicago urban area covers more land than Los Angeles, which has a far higher urban density.

    Dispersing Employment: Chicago’s dispersion extends to employment. Despite having the second strongest central business district in the nation (after Manhattan), jobs are rapidly decentralizing. Last year the Downtown Loop Alliance reported that private sector employment in the Loop fell 20 percent during the last decade. Overall, the downtown area of Chicago now represents approximately 10 percent of regional employment, barely half the percentage of Manhattan or Washington, DC.

    American community survey data from 2009 indicates the total employment in the North West corridor along Interstate 90 has at least as much employment as downtown Chicago. This corridor, anchored by the edge city (Note 4) of Schaumburg, is typical of emerging suburban centers around the nation. Only two percent of workers in this corridor use transit for commuting.

    Another corridor, along Interstate 88 (anchored by Lisle and Aurora) has at least two thirds the employment of downtown, with only one percent commuting by transit. The North Shore corridor encompassing parts of northern Cook County and Lake County is of similar size to the Interstate 88 corridor and has a larger transit work trip market share of five percent.

    Downtown, on the other hand, has the third largest transit work trip market share in the nation, following Manhattan and Brooklyn. In 2000, 55 percent of people working downtown (the larger downtown including the Loop, north of the River and adjacent areas to the west and south) commuted by transit. This illustrates the strength of transit for providing access to the largest, most dense downtown areas in contrast to dispersed suburban areas.

    Perhaps more telling, the number of jobs and resident workers (the “jobs-housing” balance) in the city of Chicago are converging toward equality. According to American community survey data, there are 1.1 jobs in the city of Chicago for each working resident. This is substantially less, for example, than Washington (2.6), Atlanta (2.0), Boston (1.7), San Francisco (1.4) and Baltimore (1.4).

    On the other hand, two of the three large suburban corridors have higher ratios of jobs to workers than the city of Chicago. The Interstate 88 corridor has 1.3 jobs per worker, while the North Shore has approximately 1.5 jobs per worker. The Interstate 90 corridor has slightly more jobs than workers. These data indicate that Chicago is well on the way to a more evenly distributed employment pattern that has become more common around the nation.

    Middle America’s Leviathan: The Chicago area has been very resilient through the years. After nearly a century as the nation’s “second city,” Aaron Renn points out the area could fall from its much cherished “global city” status. Still, Chicago remains the dominant urban area between the coasts. Virtually all of its Midwestern competition has fallen away (such as Detroit, St. Louis and Cleveland). However, in the longer run Chicago could be displaced by Dallas-Fort Worth and Houston. Nonetheless, the urban area’s visually arresting business district will retain its iconic status even if, overall, the region looks more and more like the rest of highly dispersed Middle America.

    ——

    Note 1: This article uses metropolitan area and combined statistical areas as defined by the authoritative US Office of Management and the Budget.

    Note 2: The 1950 references provided because the closest to the Post-War democratization of homeownership and car ownership and expansion of car oriented suburbanization. Before World War II, most US historical core cities were comparatively dense, while a far smaller share of the population lived in the suburbs.

    Note 3: Figure 3 and the Table show data for the 2010 geographical definition of the combined statistical area. Earlier metropolitan area definitions are also referred to in the text.

    Note 4: An “edge city” is a major employment center outside the central business district (downtown).  “Edge city” became a part of the language as a result of Joel Garreau’s 1991 book, Edge City: Life on the Urban Frontier.

    Photograph: Downtown Chicago from the Air (by author)

  • The Evolving Urban Area: Seattle

    Lunching at Seattle’s Space Needle, the casual observer might imagine that one of the nation’s most dense urban areas is spread out below. To the immediate south of the Space Needle is one of the nation’s premier downtown areas. In 2000 downtown Seattle had the seventh largest employment base in the country and was one of the most dense. Its impressive, closely packed buildings witness a storied past. For more than 60 years, between 1914 and 1990, downtown Seattle has had the tallest building on the West Coast, Smith Tower, and was the fourth tallest building in the world when built. It held the title for an impressive 55 years, from 1914 to 1969, when another Seattle building briefly took the title (1001 4th Avenue). Later (1985), Seattle’s Columbia Center became the first building on the West Coast to exceed 75 floors, but by 1990 had been passed by the U.S. Bank Tower in Los Angeles (see Elliot Bay photograph and Note 1).

    However, looks can be deceiving.  In 2000, Seattle ranked last in urban population density out of the 11 urban areas in the 13 western states with more than 1 million population (just behind Portland, which ranked next-to-last).  The Seattle urban area’s density was approximately 60 percent below that of Los Angeles, the US’s  densest urban area. Even the Houston and Dallas-Fort Worth urban areas, famous for their great expanse, were denser than Seattle. Updated urban area density data from the 2010 census will not be available for at least a year.

    Nor is the historical core municipality of Seattle particularly closely packed. With a population density of 7,200 per square mile, the city of Seattle is considerably less dense than a number of Los Angeles suburbs such as Santa Ana (12,000) and Garden Grove (9,500). Even so, the city of Seattle is nearly two-thirds more dense than the city of Portland (4,400), despite the latter’s densification claims.

    The 2010 Census: The 2010 census indicates a continuing dispersion of population in the Seattle metropolitan region (Figure 1). The Seattle metropolitan region, formally the Seattle combined statistical area (Note 2) is composed of the core Seattle metropolitan area (King, Pierce and Snohomish counties) and five exurban statistical areas, Bremerton (Kitsap County), Olympia (Thurston County), Mount Vernon (Skagit County), Oak Harbor (Island County) and Shelton (Mason County).

    Seattle Combined Statistical Area: Population 2000-2010
    Area 2000 2010 Change % Share of Growth Share of Population
    City of Seattle        563,374        608,660           45,286 8.0% 9.2% 14.5%
    Balance: King County     1,173,660     1,322,589        148,929 12.7% 30.3% 31.5%
    Pierce & Snohomish Counties     1,306,844     1,508,560        201,716 15.4% 41.0% 35.9%
    Metropolitan Area Outside Seattle    2,480,504    2,831,149        350,645 14.1% 71.2% 67.4%
    Metropolitan Area     3,043,878    3,439,809        395,931 13.0% 80.4% 81.9%
    Exurban Metropolitan Areas        663,260        759,503           96,243 14.5% 19.6% 18.1%
    Combined Statistical Area    3,707,138    4,199,312        492,174 13.3% 100.0% 100.0%
    Calculated from US Census data


    City of Seattle (Historical Core Municipality): Overall, the historical core city of Seattle grew 8.0 percent, from 564,000 to 609,000 between 2000 and 2010, which was one of the healthiest increases among major cities. In adding 45,000, the city still only accounted for 9.2 percent of the Seattle metropolitan region population growth.  The city of Seattle now constitutes less than 15 percent of the metropolitan region population, down from 36 percent 1950 (same geographic area). In 1950, the city of Seattle had nearly two thirds of the population of King County. By 2010, the city of Seattle was less than one third of King County’s population, despite annexations. As the city has continued to decline in its share of the metropolitan region’s population, the impressive downtown area has also lost its dominance and by 2009 had fallen to 8 percent of the metropolitan region’s employment.

    Inner Suburbs: Areas outside the city of Seattle accounted for more than 90 percent of growth in the metropolitan region. The inner suburbs, which include the residential development to the south, north and east of Seattle in King County grew more than 50 percent faster than the city of Seattle, at 12.7 percent between 2000 and 2010. The inner suburbs grew from 1,170,000 to 1,320,000, adding nearly 150,000 new residents, more than three times the city of Seattle increase. King County outside Seattle also captured 30 percent of the metropolitan region’s growth and now has 32 percent of the metropolitan region’s population. The eastern suburbs of King County are home to one of the nation’s largest, most diverse and successful edge cities, Bellevue, as well as the Microsoft campus in neighboring Redmond.

    Outer Suburbs: The outer suburbs, which include Pierce County (Tacoma is the county seat) and Snohomish County grew 15.4 percent, nearly double the growth rate of the city of Seattle. The outer suburbs grew from 1.3 million to 1.5 million, adding 200,000 new residents, more than four times the city of Seattle’s increase. Pierce and Snohomish counties captured 41 percent of the metropolitan region’s growth and now account for 36 percent of the metropolitan region’s population.

    Exurban Areas:  The exurban statistical areas grew nearly as quickly as the outer suburbs. Between 2000 and 2010, the exurban areas increased their population by 14.5 percent.  The exurban statistical areas accounted for 20 percent of the metropolitan region’s population growth. These more distant areas grew from 660,000 to 760,000 people, adding nearly 100,000 new residents. This is more than double the increase in the city of Seattle population. Approximately 18 percent of the population in the metropolitan region lives in the exurban statistical areas, a larger number than residing in the city of Seattle.

    The Dispersion Continues: The dispersion of Seattle, like that of metropolitan regions around the nation and the world, has been going on for decades. The city of Seattle has accounted for only 5 percent of the metropolitan region’s population since 1950 (Figure 2) with suburbs and exurbs accounting for the vast majority of the nearly 3,000,000 increase.

    Despite the pre-2010 census media and academic drumbeat to the effect that metropolitan areas were no longer dispersing, the census revealed a totally different and even inconvenient truth. This does not mean that both residents of the entire metropolitan region, suburbs and core city, should not be proud of an attractive urban area in an incomparable natural setting. Yet, the vast majority of the region’s population and employment growth is taking place outside the core. Seattle is following the national and international pattern to ever greater dispersion.

    _________

    Note 1: Downtown Seattle is on a hill and the newer buildings are generally on higher ground than Smith Tower, which makes the difference in height look greater.

    Note 2: "Combined statistical areas" were formerly "consolidated metropolitan statistical areas."

    Top Photograph: Downtown Seattle from the Space Needle (by author)

    Wendell Cox is a Visiting Professor, Conservatoire National des Arts et Metiers, Paris and the author of “War on the Dream: How Anti-Sprawl Policy Threatens the Quality of Life

  • The Evolving Urban Form: Shanghai

    According to the results of the 2010 census, Shanghai’s population was nearly 1,000,000 people more than had been projected by local authorities. The provincial level of jurisdiction grew from a population of 16.4 million in 2000 to 23.0 million in 2010. Shanghai is one of the world’s fastest growing megacities (urban regions of more than 10 million population). Shanghai’s 6.6 million population growth equals the strong growth of the Manila urban region over the same period but trails the 7.4 million growth in the Jakarta urban region. Shanghai modestly extended its lead over Beijing as China’s largest urban region, where the growth over the same period was 5.8 million.

    As is typical of urban regions around the world, Shanghai’s population gain was concentrated outside the core, in suburban and exurban areas (see table at bottom). A map of Shanghai’s districts can be seen here.

    Suburban Growth: The nine suburban districts grew 69% between 2000 and 2010. The suburban areas grew from 9.5 million in 2000 to 16.0 million in 2010, adding the equivalent of the population of greater Toronto, Dallas-Fort Worth or the Rhine-Ruhr (Essen-Dusseldorf). The suburbs dominated growth, with 99.2% of the population gain

    Sonjiang, to the west of Honquiao airport grew the most, adding nearly 150% to its population. Pudong, a huge district that extends from the new edge city development across the Huangpu River from downtown all the way to Pudong Airport on the Yangtze River added 1.9 million people and now has a population exceeding 5 million (Note).


    Pudong Business District

    The Inner Core: The inner core is the all of the famous Bund, with its Western-style commercial architecture along the Huangpu River and Shanghai’s best known shopping street, Nanjing road. The three districts of the inner core all lost population. Overall, the inner core population dropped from 1.209 million to 926,000, a decline of 23%. This may seem surprising, in view of the large number of high-rise condominium buildings that have been constructed in this area. However, these buildings typically replaced higher density low rise development that was generally not up to modern standards. The inner core has a population density of 119,400 people per square mile (46,100 per square kilometer), down from 155,700 per square mile (60,100 per square kilometer) in 2000. Even so, the inner core retains a population density more than 50% above that of either Manhattan or the ville de Paris. 


    Toward Nanjing Road

    The Outer Core: The six districts of the outer core gained 6%, increasing from 5.723 million to 6.060 million people. Two districts sustained minor losses and another three made modest gains. The district of Putuo was the exception, gaining 23%. The outer core districts had a population density of approximately 60,100 per square mile, or 23,200 per square kilometer in 2010.

    Overall, the entire core grew 0.8% and accounted for 0.8% of the growth in the jurisdiction. The population density was approximately 64,000 per square mile or 25,000 per square kilometer.

    Urban and Rural Shanghai: Overall, Shanghai covers approximately 2,445 square miles (6,333 square kilometers), a land area somewhat more than that of the Statistics Canada defined Toronto metropolitan area (2,279 square miles or 5,901square kilometers). However, Shanghai’s population is nearly four times that of the Toronto area. Even so, Shanghai’s rural population remains at approximately 3,000,000 people.

    Based upon the new census count, it is estimated that the population of the urban area is approximately 20,000,000. The suburban areas, inside the urban area but outside the core are estimated to have a population density of 10,600 per square mile or 4,100 per square kilometer, well below the density of the core. Even so, this suburban density is well above that of all but a few of the urban areas of Western Europe. The suburban areas include a number of undeveloped areas that are completely surrounded by urbanization.

    Decentralized Employment: Shanghai has also developed a decentralized employment base, despite having one of the world’s largest central business districts, with 1.25 million jobs. By comparison, Manhattan has approximately 1,750,000 jobs south of 59th Street, while Tokyo has approximately 4,000,000 jobs inside the Yamanote Loop. The central business district has approximately 15% of Shanghai’s employment.

    Shanghai’s Urban Expansion: Shanghai continues to expand in virtually every direction. It is likely that Shanghai’s urbanization will mean that of Kunshan, an urban area of nearly 1.5 million people located in the Suzhou Prefecture of Jiangsu. In addition, the urbanization is also likely to soon meet that of Taicang, another urban area in Suzhou that has a population of approximately 500,000.  At least one of Shanghai’s Metro lines is planned to be extended to Taicang.

    Shanghai’s urbanization is also poised to spill across the border into the province of Zhejiang. Development is also spreading to the east and southeast in Pudong, including Lingang, which will eventually have 1 million residents. The ocean will prevent further expansion in this direction. Lingang is the point from which a 17 mile (28 kilometer) long bridge crosses one-half of Hangzhou Bay Bridge to Shanghai’s new island port, the largest in the world.

    Shanghai exhibits the same trends that are evident in other world megacities. Like Seoul and Mexico City, the inner core population density is falling. And like Jakarta, Mumbai, Manila and most other large urban areas in the world, the overall population density is declining even as population growth continues.

    Shanghai: Population by District & County (Qu & Xian)
    2010 Census
    POPULATION            
    Sector Area: Square Kilometers  Population: 2000  Population: 2010 Population: Change 2000-2010 % Change % of Growth
    INNER CORE 20.1     1,209,000       926,000      (283,000) -23.4% -4.3%
    Huangpu Qu 4.5        575,000        430,000       (145,000) -25.2% -2.2%
    Jing’an Qu 7.6        305,000        247,000         (58,000) -19.0% -0.9%
    Luwan Qu 8.0        329,000        249,000         (80,000) -24.3% -1.2%
    OUTER CORE 261.4     5,723,000     6,060,000       337,000 5.9% 5.1%
    Changning Qu 38.3        702,000        691,000         (11,000) -1.6% -0.2%
    Hongkou Qu 23.5        861,000        852,000           (9,000) -1.0% -0.1%
    Putuo Qu 54.8     1,052,000     1,289,000        237,000 22.5% 3.6%
    Xuhui Qu 54.8     1,065,000     1,085,000          20,000 1.9% 0.3%
    Yangpu Qu 60.7     1,244,000     1,313,000          69,000 5.5% 1.0%
    Zhabei Qu 29.3        799,000        830,000          31,000 3.9% 0.5%
       
    CORE DISTRICTS 281.5 6,932,000 6,986,000 54,000 0.8% 0.8%
       
    SUBURBAN 6,051.1     9,476,000   16,031,000     6,555,000 69.2% 99.2%
    Baoshan Qu 415.3     1,228,000     1,905,000        677,000 55.1% 10.2%
    Chongming Xian 1,041.2        650,000        704,000          54,000 8.3% 0.8%
    Fengxian Qu 687.4        624,000     1,083,000        459,000 73.6% 6.9%
    Jiading Qu 458.8        753,000     1,471,000        718,000 95.4% 10.9%
    Jinshan Qu 586.1        580,000        732,000        152,000 26.2% 2.3%
    Minhang Qu 371.7     1,217,000     2,429,000     1,212,000 99.6% 18.3%
    Pudong Xin   Qu 1,210.4     3,187,000     5,044,000     1,857,000 58.3% 28.1%
    Qingpu Qu 675.5        596,000     1,081,000        485,000 81.4% 7.3%
    Songjiang Qu 604.7        641,000     1,582,000        941,000 146.8% 14.2%
       
    TOTAL 6,332.6   16,408,000   23,019,000     6,611,000 40.3% 100.0%
       
       
    POPULATION DENSITY          
       
    Sector Area: Square Kilometers  Area: Square Miles  Population/ KM2: 2000 Population/ KM2: 2010 Population/ Mile2: 2000 Population/ Mile2: 2010
    INNER CORE 20.1              7.8         60,100         46,100       155,700       119,400
    Huangpu Qu 4.5               1.7        127,800          95,600        331,000        247,600
    Jing’an Qu 7.6               2.9          40,100          32,500        103,900          84,200
    Luwan Qu 8.0               3.1          41,100          31,100        106,400          80,500
    OUTER CORE 261.4           100.9         21,900         23,200         56,700         60,100
    Changning Qu 38.3             14.8          18,300          18,000          47,400          46,600
    Hongkou Qu 23.5               9.1          36,600          36,300          94,800          94,000
    Putuo Qu 54.8             21.2          19,200          23,500          49,700          60,900
    Xuhui Qu 54.8             21.2          19,400          19,800          50,200          51,300
    Yangpu Qu 60.7             23.4          20,500          21,600          53,100          55,900
    Zhabei Qu 29.3             11.3          27,300          28,300          70,700          73,300
    CORE DISTRICTS 281.5           108.7         24,600         24,800         63,700         64,200
    SUBURBAN 6,051.1        2,336.3           1,600           2,600           4,100           6,700
    Baoshan Qu 415.3            160.3            3,000            4,600            7,800          11,900
    Chongming Xian 1,041.2            402.0              600              700            1,600            1,800
    Fengxian Qu 687.4            265.4              900            1,600            2,300            4,100
    Jiading Qu 458.8            177.1            1,600            3,200            4,100            8,300
    Jinshan Qu 586.1            226.3            1,000            1,200            2,600            3,100
    Minhang Qu 371.7            143.5            3,300            6,500            8,500          16,800
    Pudong Xin   Qu 1,210.4            467.3            2,600            4,200            6,700          10,900
    Qingpu Qu 675.5            260.8              900            1,600            2,300            4,100
    Songjiang Qu 604.7            233.5            1,100            2,600            2,800            6,700
    TOTAL 6,332.6        2,445.0           2,600           3,600           6,700           9,300


    —-

    Lead Photograph: The Bund (all photos by author)

    Note: Pudong includes the large Pudong business district, which is directly across the Huangpu River from the Bund in the central business district. However, Pudong is a relatively new development and was not a part of the urban core. Moreover, Pudong extends far to the east and southeast.

    Wendell Cox is a Visiting Professor, Conservatoire National des Arts et Metiers, Paris and the author of “War on the Dream: How Anti-Sprawl Policy Threatens the Quality of Life