Tag: Evolving Urban Form: Development Profiles of World Urban Areas

  • The Evolving Urban Form: Jakarta (Jabotabek)

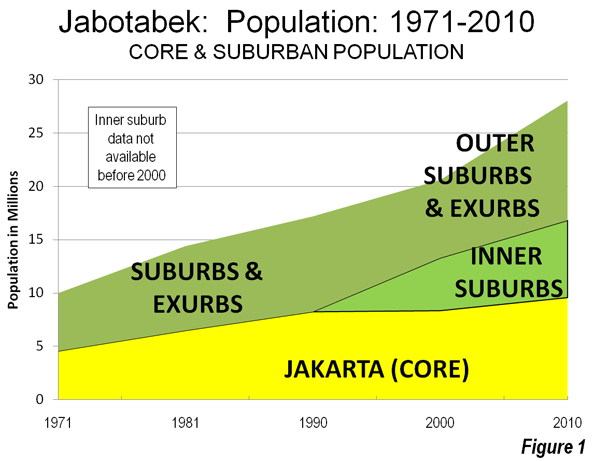
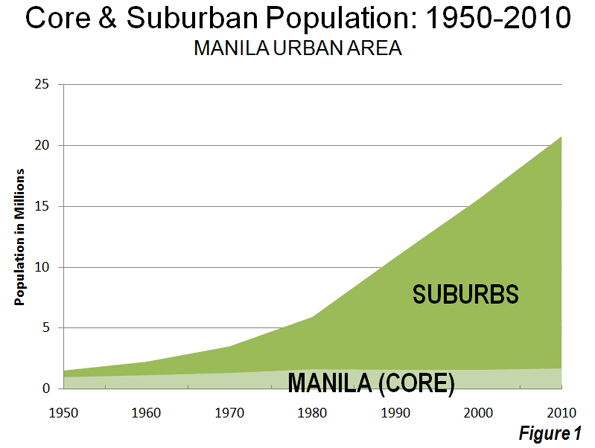
    There is probably no large urban area in the world that better illustrates the continuing dispersion of urban population and declining urban population density than Jakarta. Recently released 2010 census data indicates over the past decade that 84 percent of the metropolitan area (Jabotabek) population growth occurred in the suburbs (Note 1). This continues a trend which saw more than 75 percent of growth in the suburbs between 1971 and 2000 (Figure 1).

    Savannah State University (Georgia) Professor Deden Rukmana notes that this trend includes “many moderate and high-income families” who left the central city for better amenities while many poor people moved out to the fringe areas to escape what might be seen in the West as gentrification . 

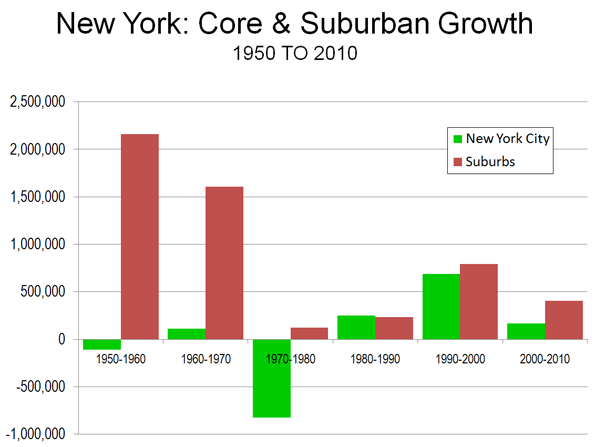
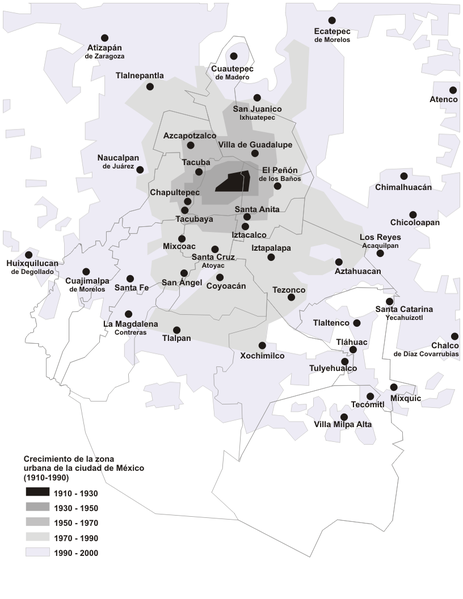
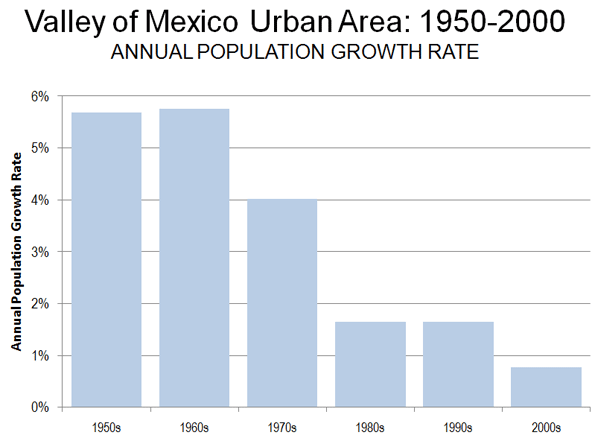
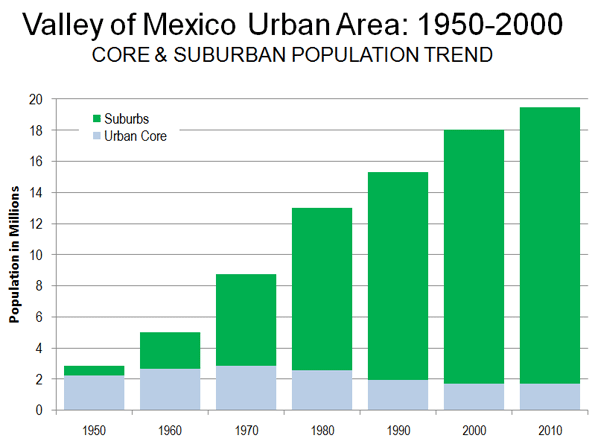
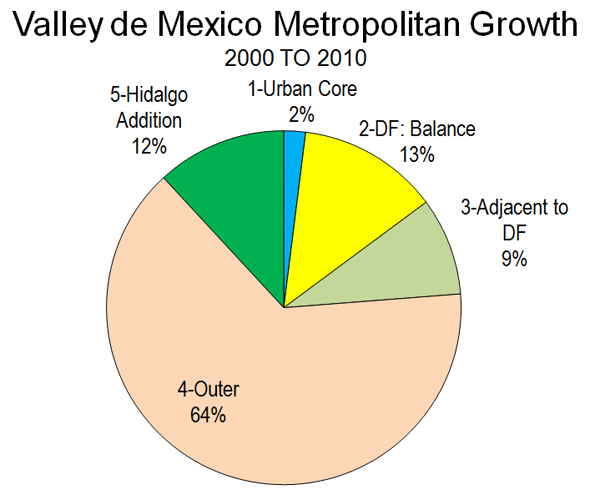
    The Megacity: Jabotabek: Jakarta is one of only a few world megacities (over 10 million) that have changed their names in recognition of their regional rather than core city focus (this sentence corrected from original). The most recent megacity with a new name is Mexico City, now referred to as the Valley of Mexico (Zona Metropolitana del Valle de México). Other examples are Tokyo-Yokohama (Kanto) and Osaka-Kobe-Kyoto (Keihansh1n).   Jakarta’s changed name, Jabotabek, represents an acronym made up of the beginning letters of the municipality of Jakarta and the three adjacent regencies (subdivisions of provinces), Bogor, Tangerang and Bekasi (Note 3). Jabotabek is one of the fastest growing megacities in the world and is experiencing accelerated growth. This is in contrast to the situation identified by the McKinsey Global Institute, which noted the declining growth rates of most megacities. In 2000, Jabotabek had a population of approximately 20.6 million, which by 2010 had risen to 28.0 million or 36 percent, nearly doubling its rate of population from the 1990s.    Jabotabek’s additional 7.4 million people is nearly equal to that of London (Greater London Authority), nearly as large as the city of New York and more people than live in the entire Greater Toronto area. In 2000, Jabotabek had a population of approximately 20.6 million, which by 2010 had risen to 28.0 million (Figure 2).

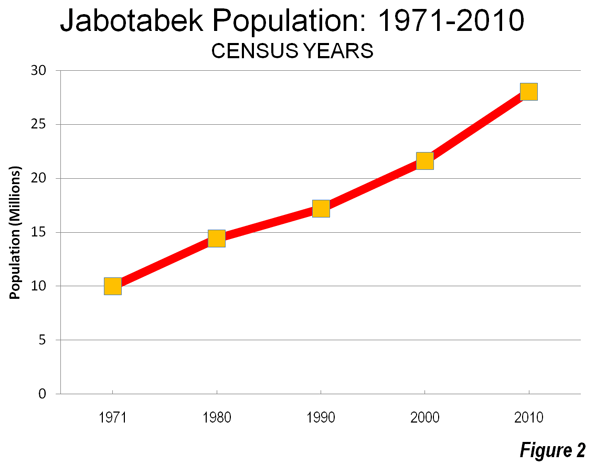
    Jabotabek’s unexpectedly high growth was greater than the 6.6 million added in both the Shanghai and Manila regions over the same period and above the 5.8 million increase in the Beijing region. The percentage growth in Shanghai and Beijing was slightly higher than in Jabotabek and slightly lower in Manila. The megacities of the United States, Western Europe and Japan have all fallen back to growth rates of less than five percent per decade (Tokyo-Yokohama, New York, Osaka-Kobe-Kyoto, Los Angeles and Paris).

    Population Trends by Sector: Population growth and rates are indicated in the table for the sectors of Jabotabek and the constituent jurisdictions.

    Jakarta Region (Jabotabek)
    Population by Sector: 2000-2010
    2000
    2010
    Change
    % Change
    Core: Jakarta 8.36 9.59 1.23 15%
    Inner Suburbs (Municipalities) 4.94 7.23 2.30 47%
    Tangerang 1.33 1.80 0.47 36%
    Tangerang Selatan 0.80 1.30 0.50 63%
    Depok 1.14 1.75 0.61 53%
    Bekasi 1.66 2.38 0.71 43%
    Outer Suburbs & Exurbs 7.30 11.20 3.90 53%
    Bogor (Municipality) 0.75 0.95 0.20 27%
    Bogor (Regency) 2.92 4.78 1.86 64%
    Tangerang (Regency) 2.02 2.84 0.82 41%
    Bekasi (Regency) 1.62 2.63 1.01 63%
    Jabotabek: Total 20.60 28.02 7.42 36%
    Population in millions


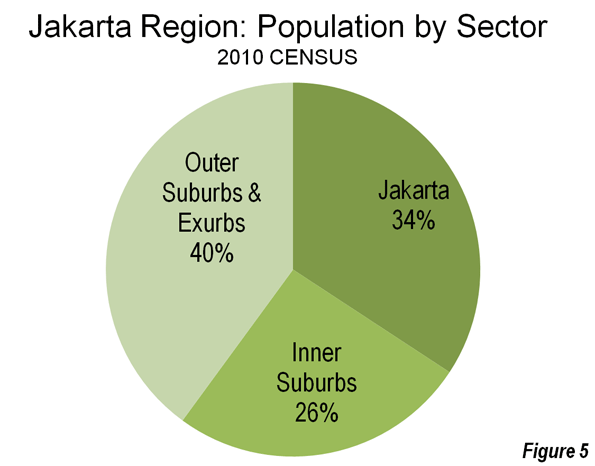
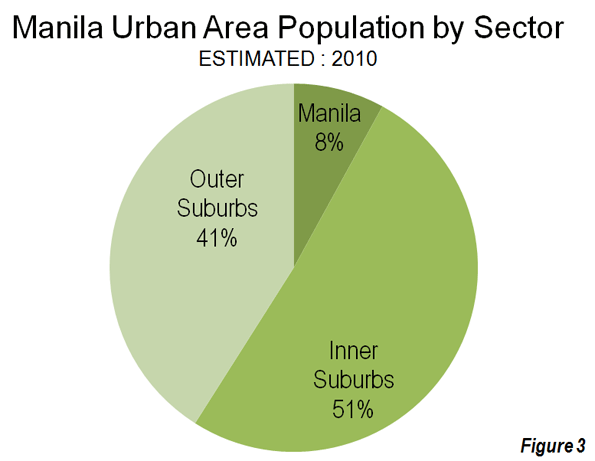
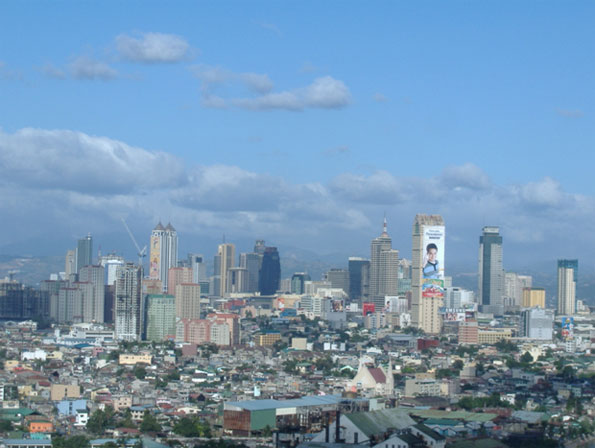
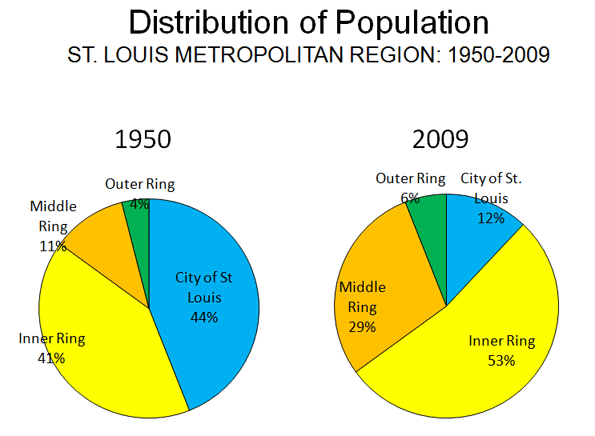
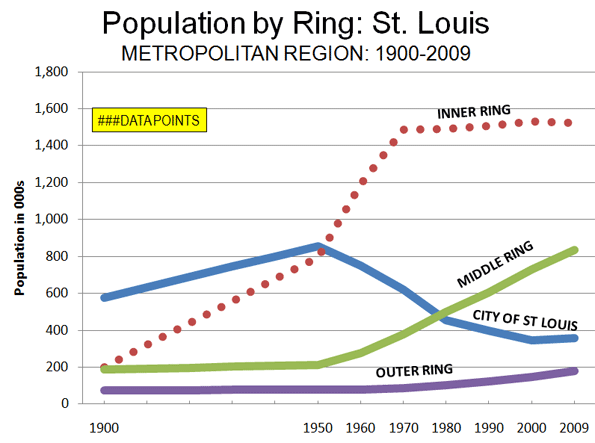
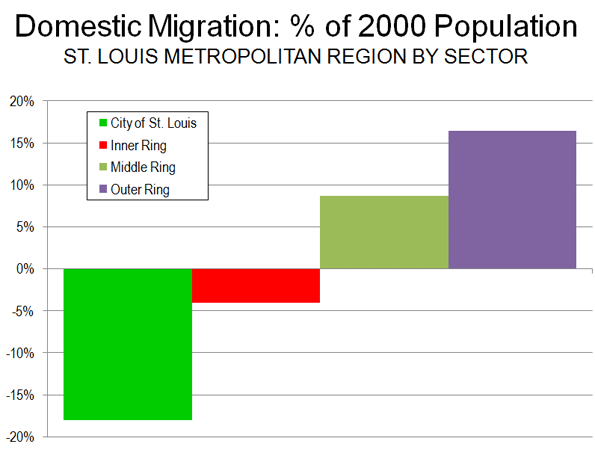
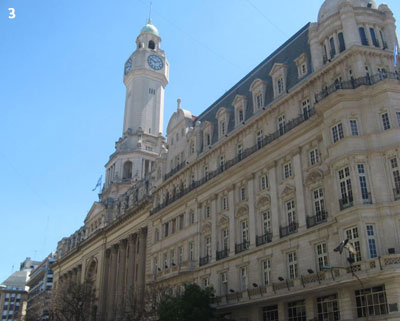
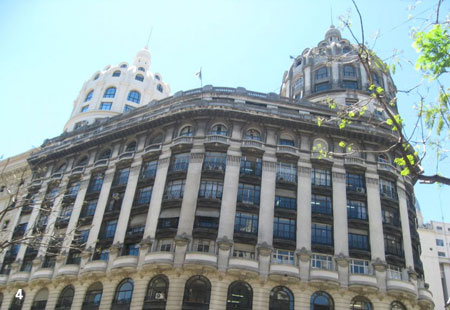
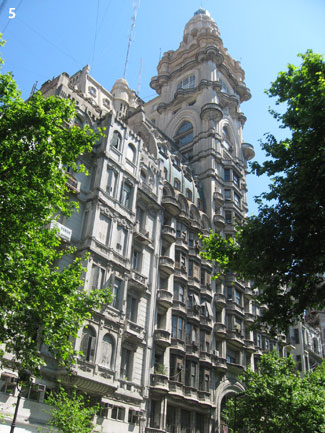
    City of Jakarta: The core city of Jakarta is the "Special Capital Region" of  Indonesia, similar to the District of Columbia in the United States, the Distrito Federal in Mexico or the Capital Federal in Argentina. This core of Jakarta grew 15 percent and added more than 1.2 million population, rising from 8.36 million in 2000 to 9.59 million in 2010, a turnaround from a loss of nearly 500,000 people between 1995 and 2000. The city of Jakarta captured 16 percent of metropolitan area growth and now accounts for 34 percent of the population of Jabotabek (Figures 3, 4 & 5).

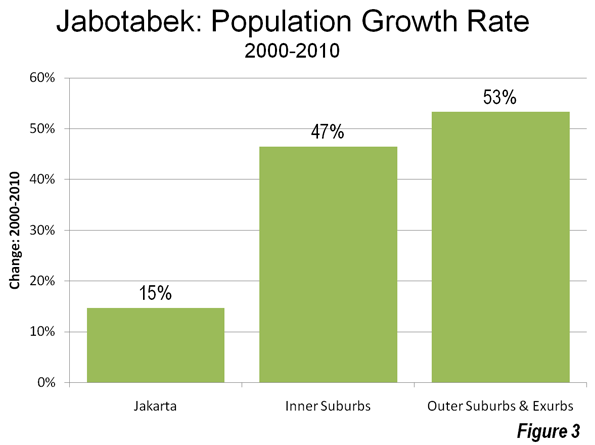
    Inner Suburbs: The inner suburbs, which are made up for the purposes of this article by the municipalities of Bekasi, Tangerang, Depok and Tangerang Selatan (South Tangerang) grew 47 percent during the 2000, from 4.94 million to 7.23 million. These inner suburban municipalities captured 31 percent of the metropolitan area growth and now have 26 percent of the population of Jabotabek (Figures 3, 4 & 5).

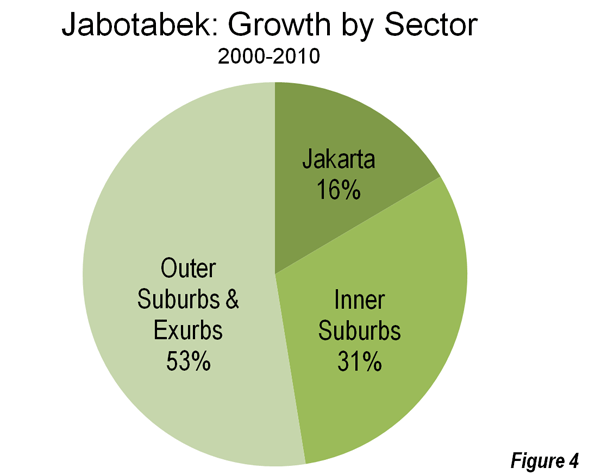
    Outer Suburbs and Exurbs: The outer suburbs and exurbs (Note 2) experienced the greatest growth, at 53 percent, rising from 7.30 million to 11.20 million. For the first time, the outer suburbs surpassed the core with the largest population. The outer suburbs and exurbs accounted for 53 percent of the metropolitan area growth and now have 40 percent of the population of Jabotabek (Figures 3, 4 & 5).

    Urban Area:  The substantial growth of Jabotabek occurred principally in the urban area (the area of continuous development or the agglomeration). It appears likely that the urban area population will exceed 24 million (Note 4). It thus seems likely that the Jakarta urban area will again be ranked as the second largest in the world, following Tokyo-Yokohama. Jakarta had been displaced by Delhi (and Seoul-Incheon), for which United Nations 2010 estimates had indicated higher than anticipated population growth as Delhi passed Mumbai to become the largest in India.

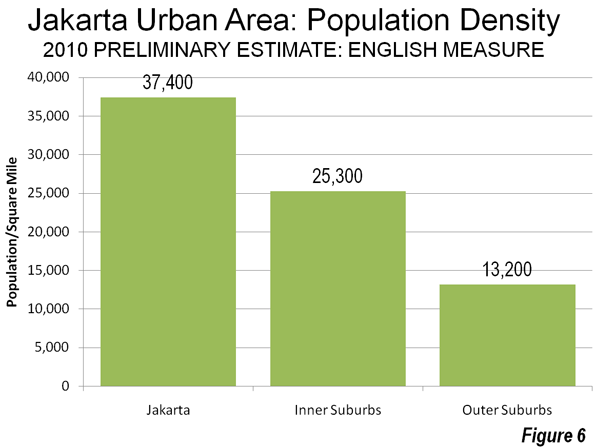
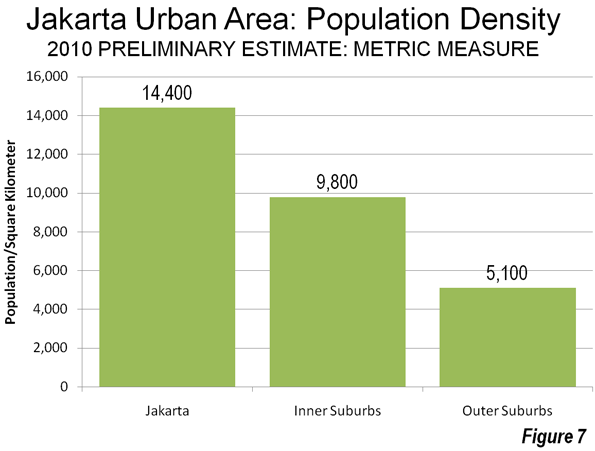
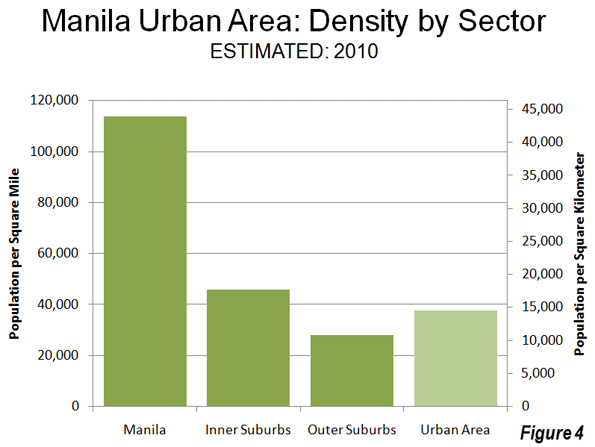
    Overall, the Jakarta urban area has a population density of approximately 22,000 per square mile or approximately 8500 per square kilometer. Yet the overall density of the Jakarta urban area has declined as population has moved to the outer suburbs which have a population density only one third that of the city of Jakarta. The inner suburbs have a population density that is only two thirds that of the city of Jakarta (Figures 6 and 7).


    Despite this, the Jakarta urban area is much denser than most large urban areas in the high income world. Overall, the Jakarta urban area is approximately 2.5 times as dense as the Paris urban area, more than three times as dense as the Los Angeles urban area, and approximately seven times as dense as the Portland urban area. Other urban areas in the developing world are even denser:  Delhi is more than 1.5 times as dense as Jakarta, Mumbai more than three times as dense and Dhaka is more than four times.


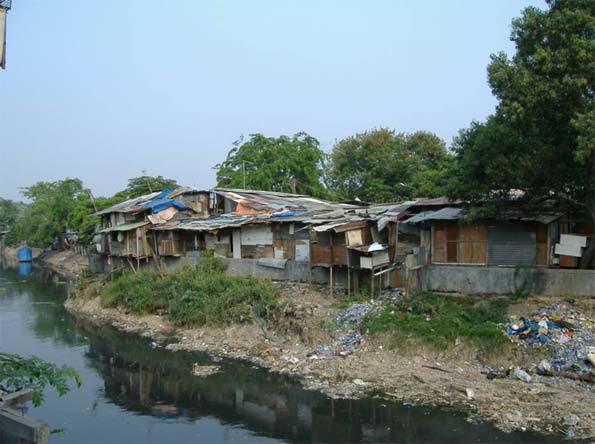
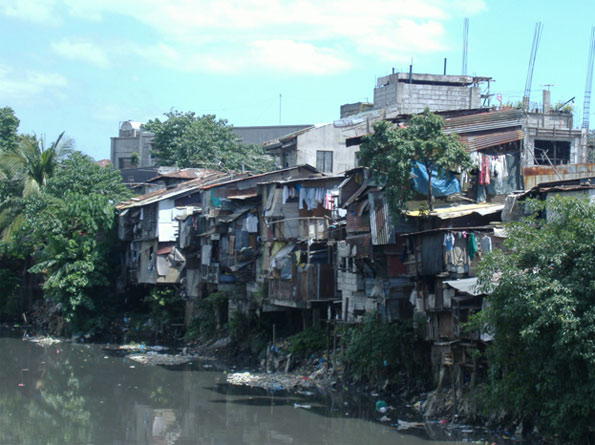
    Informal housing, city of Jakarta (photo by author)


    A Larger Metropolitan Area?  This continuing population growth could cause Jabotabek to expand even further. Indonesia’s President Susilo Bambang Yudhoyono (SBY) has proposed expanding the metropolitan area to include the regencies of Karawang, Serang, Purwakarta and Sukabumi as well as the municipalities of Serang, Sukabumi and Cilegon. Already, Jakarta’s continuous urbanization nearly reaches the Karawang urban area to the east (population over 600,000) and is nearing Serang regency to the west. SBY’s "Greater Jakarta" has a population approaching 36 million according to the 2010 census. Further pressure on suburban growth could be generated by plans in Jakarta to limit the core city’s population to 12 million.

    Yet even so it may take some decades, before Jakarta, or perhaps Delhi, could pass Tokyo-Yokohama’s nearly 37 million people to become the world’s largest urban area, assuming that they do not experience the reduced population growth so widespread in other megacities.   

    ———

    Notes:

    1. Caution should be used in making comparisons of metropolitan areas, especially between nations. There is virtually no consistency in the delineation of metropolitan areas between nations. In some cases, such as Japan, the United States, France and Canada, Metropolitan areas are based upon commuting patterns, but even between these nations there is no consistency.

    2. For the purposes of this article, suburbs are inside the urban area, but outside the central city (Jakarta). Exurbs are the portions of the metropolitan area (Jabotabek) outside the urban area.

    3. The provinces of Indonesia and the state of Virginia are subdivided similarly. In Virginia, all of the land area is divided into municipalities or counties. In the provinces of Indonesia, all of the land area is divided into municipalities (kota) and regencies (kapupaten). The regencies are further divided into sub-districts (kecamatan). Jabotabek is located in three provincial level jurisdictions, the Special Capital District of Jakarta, and the provinces of West Java (Java Barat) and Bantan. West Java has a population of 43 million, approximately 6,000,000 more than the largest state in the United States, California. Banten is bordered on the west by the Sunda Strait, location of Krakatoa, the volcano.

    Further, the name Jabotabek may not survive. As municipalities (Note 3) were carved out of the regencies in the 1990s and 2000s, the megacity was called Jabodetabek by some and proposed additions to the metropolitan area could bring even more variations. Inconsistent and alternative names probably make likely that sources will continue to call the megacity "Jakarta."

    4. This urban area population is much larger than reported by the United Nations, which for Indonesian urban areas limits its estimates to the jurisdiction of the core city, and thus excludes suburbs. As is generally the case throughout the world, the continuous urbanization of Indonesian urban generally areas extends far beyond core cities.

    —–

    Photograph: Luxury housing in Cileungsi sub-district, Bogor regency (outer suburbs), by author

    Wendell Cox is a Visiting Professor, Conservatoire National des Arts et Metiers, Paris and the author of “War on the Dream: How Anti-Sprawl Policy Threatens the Quality of Life

  • The Evolving Urban Form: Manila

    The Urban Area: The Manila urban area ranks as the world’s fifth largest urban area (area of continuous urban development) with a population of approximately 21,000,000 (Note 1) covering a land area of 550 square miles (1,425 square kilometers). The urban population density sits at approximately 38,000 people per square mile (14,500 per square kilometer).

    Like nearly all major urban areas of the world, Manila has experienced substantial suburbanization over recent decades and substantially falling urban population densities. In 1950, the core municipality of Manila had a population of under 1 million people, and it represented approximately 60 percent of the urban area population. Over the intervening years, the core of Manila grew by approximately 700,000 people, while the balance of the urban area added nearly 20,000,000 people (Figure 1).

    A Forbes article indicates that Manila is the highest density major municipality in the world with a population density of nearly 115,000 per square mile (45,000 per square kilometer). This is more than double the population density of ville de Paris. The core has a population of approximately 1.7 million in a land area of 15 square miles (39 square kilometers).

    The densest district reaches nearly 180,000 people per square mile (70,000 per square kilometer). Even so, this is far less dense than some parts of Hong Kong (more than 1.1 million per square mile and more than 400,000 per square kilometer). Even higher densities existed in the early 20th century Lower East Side in New York (according Jacob Riis, author of A Ten Years’ War: An Account of the Battle with the Slum in New York). Even higher densities were reached during the late 1980s in Hong Kong’s now demolished Kowloon Walled City, variously estimated at up to 5 million per square mile (2 million per square kilometer).

    The inner suburbs, the balance of the National Capital Region now have approximately 10,600,000 residents. The population density drops substantially from the core to the inner suburbs to approximately 45,000 per square mile (18,000 per square kilometer).  The outer suburbs, which are composed of the portions of the urban area outside the National Capital Region, have a population of more nearly 8.5 million and a considerably lower density at 28,000 per square mile or 11,000 per square kilometer (Figure 2).

    As early as the 1950s, the suburbs have captured most of the urban areas growth. Between 1950 and 1980, the core municipality attracted between 10 percent and 20 percent of the urban area growth. The core municipality of Manila reached a population peak of nearly 1.6 million in 1980, which it has only been recently exceeded. From 1980 to 2000, virtually none of the urban growth took place in the core of Manila, though it captured roughly 2 percent of the growth from 2000 to 2010 (Figure 3).

    As of 2010, it is estimated that eight percent of the population lives in the core municipality of Manila, 51 percent in the inner suburbs and 40 percent in the outer suburbs (Figure 4).

    The Metropolitan Area: Unlike urban areas, there are no international standards for the delineation of metropolitan areas (labor markets including extensions beyond urban areas). Serious attempts to compare international metropolitan area data have been rare (Note 2). Nonetheless, the evolution of Manila as a metropolitan area can be independently reviewed based upon a provincial level analysis.

    The Manila urban area occupies all or part of six provincial level jurisdictions. The largest population is in the National Capital Region, which is somewhat misleadingly referred to as "Metro Manila", despite being only a part of the metropolitan area. This is similar to Tokyo, where the prefecture of Tokyo is referred to as the "Tokyo Metropolis," yet represents only one third of the metropolitan area population. The metropolitan area also extends into the provinces of Rizal (from which the National Capital Region was carved in 1976), Cavite, Laguna, Bulucan and Batangas. The total population was estimated at 26.5 million in 2010 (Note 3).

    The metropolitan area’s population growth is strongly moving toward the outer suburbs (the five provinces outside the National Capital Region). Between 1970 and 1990, the inner suburbs captured 61 percent of the metropolitan area growth, compared to 36 percent in the outer suburbs. Between 1990 and 2010, the outer suburbs accommodated 64 percent of the metropolitan areas population growth, compared to 34 percent for the inner suburbs.

    Commercial Development: The suburbanization of Manila has not been limited to residences. New, world class commercial cores have been developed that have displaced many of the traditional functions of the older commercial core of Manila. Makati, a municipality to the east of Manila and within the National Capital Region now has the largest business district (photo), while a nearly as large commercial core has developed in Ortigas, just to the north (photo). There are other developing office centers such as the somewhat more distant commercial center near the southern border of the National Capital Region in Muntinlupa. This is similar to the kinds of newer commercial developments that have supplanted traditional business districts in urban areas such Mexico City (Reforma and Santa Fe) Sao Paulo (Paulista and Luis Carlos Berrini) and Istanbul (Levant).These developing country cities have experienced an economic decentralization of business that surpasses that of American edge cities.


    Makati


    Ortigas


    Manila’s Ominous Future? Manila faces an especially difficult future. The Philippines is projected to have one of the strongest urban growth rates in the world over the period to 2050. Since 1950, the Manila urban area has captured nearly 50 percent of the urban population growth of the nation. If this rate were to continue, the Manila urban area would reach a population of between 45 and 50 million by 2050. This is approximately 10,000,000 more than live in Tokyo, the world’s largest urban area today.

    But Manila faces even greater problems, related to the intense poverty of much of the population migrating to the urban area from the countryside. The Philippine Institute for Development Studies (PIDS) estimated that 4 million of the 11.5 million residents in the National Capital Region lived in slums (shantytowns or informal settlements) in 2010 (Photo).  PIDS indicates that this population is increasing at a rate of eight percent annually and is expected to reach 9 million by 2050. This would be nearly 60 percent of the projected population at that time, and does not include slum populations in the extensive suburbs beyond the limits of the National Capital Region.

    As if the poverty were not enough, Manila has been plagued by disastrous slum fires, the most recent within the past week. According to the Manila Times up to 10,000 people were left homeless by this most recent fire, which was in Makati, home of the metropolitan area’s largest and most prestigious business district.

    Manila also experiences some of the world’s worst traffic congestion, as people increasingly travel by car on its largely substandard road system. Perhaps even more surprisingly, a substantial number of detached housing communities have been developed, especially on the urban fringe.

    Manila’s challenge will be to accommodate the millions more who will seek a better life in the urban area and to do so while materially improving the standard of living as urgently as possible.

    ———

    Note 1: This urban area population is considerably above the figure reported by United Nations (11.6 million). United Nations figure is for the National Capital Region, which is also referred to as Metro Manila. In fact, the urban area stretches well beyond Metro Manila. This population estimate is based upon a build-up of smaller area population totals within the continuously develop urban area.

    Note 2: By far the most comprehensive attempt to apply consistent criteria to international metropolitan areas, was by urban expert Richard L. Forstall (who ran the Rand McNally "Ranally" international metropolitan area program), Richard P. Green and James B. Pick. The complexity of the research is indicated by the fact that their list is limited to the top 15 in the world. 

    Note 3: The metropolitan population is estimated by applying the 2000 to 2007 annual growth rate to from 2007.

    Wendell Cox is a Visiting Professor, Conservatoire National des Arts et Metiers, Paris and the author of “War on the Dream: How Anti-Sprawl Policy Threatens the Quality of Life

    Lead Photograph: Urban fringe development: Laguna province (outer suburbs). All photographs by author.

  • The Evolving Urban Form: Dallas-Fort Worth

    The Dallas-Fort Worth metropolitan area (Note 1), which corresponds to the Dallas-Fort Worth urban area, provides a casebook example of expanding urbanization. Dallas-Fort Worth has been one of the fastest growing major metropolitan areas in the nation for decades. Dallas-Fort Worth was among only three US metropolitan areas adding more than 1,000,000 residents between 2000 and 2010. Only Houston’s addition of 1,230,000 exceeded that of Dallas-Fort Worth, which grew by 1,210,000, a 23.4 percent growth rate. Atlanta was the third metropolitan area to add more than one million residents, at 1,021,000. During the 2000s, Dallas-Fort Worth passed Philadelphia to become the nation’s fourth largest urban area, with a population of 6,372,000. Only New York, Los Angeles and Chicago are larger.

    On an international scale, the United Nations estimates indicate that only Singapore, Houston and Atlanta had greater percentage growth between 2000 and 2010 among high-income world urban areas that exceed 4,000,000 in population.

    The Core: The core of the metropolitan area experienced the earliest growth and has since seen its share of growth and its growth rate decline significantly. Dallas County, which includes the historical core municipality of Dallas (Note 2), had a growth rate of 6.7 percent between 2000 and 2010, approximately one third less than the national growth rate of 9.7 percent. Nearly all of the growth in Dallas County was outside the city of Dallas, which added only 0.8 percent to its population, less than one-tenth of the national rate. The city of Dallas added 9,000 residents, while the suburbs within Dallas County added 140,000 residents.

    Overall, Dallas County accounted for 12 percent of the metropolitan area’s growth between 2000 and 2010. This is down from 41 percent between 1950 and 2000. Between 1900 and 1950, Dallas County accounted for an even larger share (66 percent) of growth (Figure 1). Dallas County’s annual growth rate fell from 4.1 percent between 1900 and 1950 to 2.6 percent between 1950 and 2000 to 0.7 percent in the last decade (Figure 2).


    Inner Suburban Counties: During the 2000s, the greatest growth was experienced in the inner suburban counties (those abutting the core county, Dallas). These six counties (Collin, Denton, Ellis, Kaufman, Rockwall and Tarrant, where Fort Worth is located) experienced a population gain of 38.9 percent. Inner suburban counties now contain 56 percent of the metropolitan area population. Between 2000 and 2010, the inner suburban counties captured 82 percent of the metropolitan area, up from 53 percent between 1950 and 2000 and 38 percent between 1900 and 1950. The inner suburban counties grew 1.7 percent annually from 1900 to 1950, increasing to 3.2 percent between 1950 and 2000 and 3.3 percent in the 2000s.

    Outer Suburban Counties: The outer suburban counties represent a comparatively small portion of the metropolitan area’s population. These five counties (Delta, Hunt, Jasper, Parker and Wise) accounted for only 7 percent of the metropolitan area population. The 2000 to 2010 growth rate was 20.9 percent, somewhat below the metropolitan area rate of 23.4 percent, and more than double the national population growth rate of 9.7 percent national growth rate.

    Between 2000 and 2010, the outer suburban counties captured 6 percent of the metropolitan area growth, the same share as between 1950 and 2000. However, perhaps surprisingly, their combined 1950 population was 19 percent below that of 1900. This illustrates the declining fortunes in the early part of the 20th century of counties that were dominated by agriculture, as the farm population and population of many small farm dependent communities declined. Of course, the 1900 to 1950 losses have since been compensated many times over by the post 1950 suburbanization. Nonetheless, one outer suburban county, Delta is unique in continuing to lose population through the 2010 census. Delta County’s 2010 population of 5,200 is approximately one third of its 1900 population of 15,200.

    The outer suburban counties lost 0.4 percent of their population annually from 1900 to 1950, but turned around to gain 2.1 percent from 1950 to 2000. Between 2000 and 2010, the growth rate fell back to 1.9 percent.

    The City of Dallas: The historical core municipality of Dallas illustrates of the dynamics of aggressive annexation policies. In 1910, Dallas covered only 16 square miles (41 square kilometers) and had a population of 92,000. Even at this early date, the city of Dallas was not very dense, with 5,700 residents per square mile (2,200 per square kilometer). The city reached its peak density of 7,300 (2,800 per square kilometer) in 1940, after having expanded to 41 square miles (106 square kilometers) and a population of 295,000.. Even at this peak density, the city of Dallas remained well below the densities of other core cities, especially in the East and Midwest, most of which had densities exceeding 10,000 per square mile (3,900 per square kilometer).

    By 1950, the city had expanded to 112 square miles (289 square kilometers) and with a population of 334,000, the population density had fallen to 3,900 (1,500 per square kilometer). Larger annexations were to follow, with the city reaching 343 square miles (885 square kilometers) by 2010. With a population of 1,198,000, the population density was 3,500 per square mile (1,350 per square kilometer), less than one-half the 1940 peak. Virtually all new owned housing was built consistent with the post-World War II suburban form, as occurred in metropolitan areas around the nation. The city’s addition of 9,000 residents between 2000 and 2010 was far less than the 182,000 gain between 1990 and 2000. By 2000, there was little greenfield land left to develop in the city and the population could be peaking. Indeed, the population could decline in future censuses, as has happened in geographically constrained urban cores around the world. Any such decline could, however, be counteracted by immigration, as has occurred in some urban cores.

    Ethic Trends in the Metropolitan Area: As would be expected in a state bordering Mexico, the Latino population of Dallas-Fort Worth grew substantially between 2000 and 2010, at a 43 percent rate. Overall, Latinos accounted for 42 percent of the metropolitan area’s growth. The Latino population increase was nearly 520,000, more people than live in the core city of Atlanta.

    However, unlike a number of other metropolitan areas, there was strong growth in the African-American population, which added 33 percent to its count. African-Americans accounted for 19 percent of the metropolitan area’s growth.

    This growth was strongest in the core county of Dallas, where Latino and African-American growth made up for a decline in the rest of the population.  In the inner suburban counties, 53 percent of the growth was Latino or African-America, while the lowest share of Latino and African American growth was in the outer suburban counties, at 30 percent.

    Overall, 75 percent of Latino growth and 69 percent of African-American growth took place in the suburban counties, which is a substantial change from the past (Figure 3).

    The Urban Area: Urban area data has not been released from the 2010 census. However, it is clear that Dallas-Fort Worth has become less dense since 1950. Between 1950 and 2000, the population density of the urban area declined approximately 10 percent.   Even so, it is surprising to some that the Dallas-Fort Worth urban area, with its low-density reputation, was only 12 percent less dense that Portland urban area in 2000, despite the aggressive densification strategies employed by Portland.

    The Expanding Metropolitan Area: The story in Dallas-Fort Worth is little different (Table) from what has emerged in metropolitan areas around the world, in places like Seoul, Mexico City and Mumbai. Dallas-Fort Worth also illustrates a trend only now becoming more obvious, that middle-sized and smaller metropolitan areas are generally growing faster than the megacities within their own countries (see the report by the McKinsey Global Institute). The United States has two megacities, the New York metropolitan area, which grew 3.1 percent from 2000 to 2010 and Los Angeles, which grew 3.7 percent. Dallas-Fort Worth’s far higher growth rate of 23.4 percent translated into an actual population increase of 175,000 more than the combined increase of the two megacities, despite their having five times the population.

    Dallas-Fort Worth: Population Trend by Sector and County 
    1900-2010
    1900 1950 2000 2010
    CORE COUNTY
    Dallas County       82,756    614,799  2,218,899  2,368,139
    INNER SUBURBAN COUNTIES    222,747    527,281  2,596,623  3,585,286
    Collin County       50,087      41,692    491,675    782,341
    Denton County       28,318      41,365    432,976    662,614
    Ellis County       50,059      45,645    111,360    149,610
    Kaufman County       33,376      31,170      71,313    103,350
    Rockwall County         8,531        6,156      43,080      78,337
    Tarrant County       52,376    361,253  1,446,219  1,809,034
    OUTER SUBURBAN COUNTIES    149,302    120,754    346,022    418,348
    Delta County       15,249        8,964        5,327        5,231
    Hunt County       47,295      42,731      76,596      86,129
    Johnson County       33,819      31,390    126,811    150,934
    Parker County       25,823      21,528      88,495    116,927
    Wise County       27,116      16,141      48,793      59,127
    METROPOLITAN STATISTICAL AREA    454,805  1,262,834  5,161,544  6,371,773

    The Future? It is an open question whether the rapid growth of Dallas-Fort Worth will continue. As it continues to grow, the stagnation that now afflicts the nation’s two megacities and its near-megacity, Chicago could spread to Dallas-Fort Worth. On the other hand, Dallas-Fort Worth has advantages that could permit its growth to continue for multiple decades into the future. Texas has a favorable business climate, low taxes and less heavy handed regulation than New York, California and Illinois. Dallas-Fort Worth has plenty of developable land as well as a political culture not cowed by development. The economic advance of its growing population, particularly the burgeoning Latino population, depends upon public policies that favor housing affordability and urban expansion. If it continues on its current course, Dallas-Fort Worth could pass the Chicago metropolitan area in population by 2050 and could even challenge Los Angeles later in the century.

    —-

    Note 1: As currently defined by the Census Bureau. Officially titled the Dallas-Fort Worth-Arlington metropolitan statistical area. Metropolitan areas are essentially labor markets and include a principal urban area and rural (non-urban) areas and may include smaller urban areas.

    Note 2: Fort Worth is not considered a historical core municipality, based upon the discussion in Perspectives on Urban Cores and Suburbs, though the Census Bureau considers Fort Worth and Arlington to be principal cities (which are a different thing). The "Dallas-Fort Worth" terminology is used because of its wide acceptance and to make the geographical expanse of the metropolitan area more clear.

    Wendell Cox is a Visiting Professor, Conservatoire National des Arts et Metiers, Paris and the author of “War on the Dream: How Anti-Sprawl Policy Threatens the Quality of Life

    Photo by Trey Ratcliff

  • The Evolving Urban Form: Mumbai

    The continuing dispersion of international metropolitan areas is illustrated by recently released 2011 Census of India preliminary data for the Mumbai "larger" metropolitan area. The historical core, the "island" district of Mumbai (Inner Mumbai) lost population between 2001 and 2011, while all growth was in suburban areas outside the historic core. Indeed, since 1981, Inner Mumbai lost 140,000 residents, while suburban areas gained 13.2 million.

    The larger metropolitan area is defined by district boundaries, the census division level below that of the state. The Mumbai Metropolitan Region Development Authority has a more "tight" definition, composed of smaller administrative units (municipalities), however that data is not yet available on the internet (Note). The larger metropolitan area includes four districts, two of which compose the city of Mumbai, Inner Mumbai (the historic core), and Outer Mumbai. The larger metropolitan area also includes the district of Thane, which is to the east and north of Mumbai and the district of Raigarh, which is to the south of Mumbai. The overwhelming majority of growth outside the city of Mumbai has been in Thane, which is accessible by land and bridge to Mumbai. Raigarh is less accessible from Mumbai and requires travel through Thane to reach.

    The historic population trends of these four districts are described below. The evolution of the Mumbai urban form is illustrated by the following:

    (1) The population growth rate peaked first in the core, Inner Mumbai, Outer Mumbai later and then fell substantially. Recent growth has been concentrated in the outlying districts of Thane and Raigarh. Figure 1 shows the population growth rate by district for each decade since the 1901 census.

    (2) Much of the population growth was in Inner Mumbai until 1961. From 1961 through 1981, the bulk of the population growth moved to Outer Mumbai. By the 1981 to 1991 period, Thane emerged to virtually equal Outer Mumbai in its share of growth and has been dominant since 1991. Figure 2 indicates the share of the larger metropolitan area growth by district since 1901.

    (3) The population of Inner Mumbai has risen comparatively little since 1961, with nearly all growth occurring first in Outer Mumbai and later in Thane. These two suburban areas now account for 90 percent of the larger metropolitan area population, double the 44 percent of 1961. Figure 3 illustrates the actual population, by district, of the larger metropolitan area from 1901 to 2011.

    Inner Mumbai: The historic core (Inner Mumbai) registered 3.146 million residents, down from 3.327 million in 2001. The historic core now contains only 12 percent of the larger metropolitan area population, down from 40 percent in 1961, adding approximately 375,000 residents during that forty year stretch. Overall, since 1960, the island district has captured only 2 percent of the larger metropolitan area growth. This contrast with the period before 1951; Inner Mumbai had captured approximately 60 percent of the larger metropolitan region population growth between 1931 and 1941, and 49 percent between 1941 and 1951. However, Inner Mumbai’s share dropped to a 26 percent share in 1951 to 1961 and an 11 percent share in 1961-1971. This is consistent with the overall trend in urban core population growth in metropolitan areas around the world, with population stalling or even declining once there is little greenfield land remaining for development. Inner Mumbai had lost population in the 1981-1991 census period, however recovered to reach its population peak in 2001. The 2011 population for Inner Mumbai was the lowest since the 1971 census. These population losses have occurred despite an unprecedented building boom of high-rise residential towers.

    Outer Mumbai: The Mumbai Suburban district (Outer Mumbai) became a part of the city of Mumbai through a 1950 consolidation. As Inner Mumbai became fully developed, population growth shifted sharply to Outer Mumbai. By 2011, Outer Mumbai grew to 9.33 million residents, an increase of 7.95 million from its 1961 total of 1.38 million. Outer Mumbai captured 41 percent of the larger metropolitan area growth from 1961 to 2011. However, as the supply of greenfield land has been reduced, Outer Mumbai’s growth has also slowed considerably. In each of the three decades from 1941 to 1971, Outer Mumbai grew by more than 100 percent. Outer Mumbai attracted only 19 percent of the larger metropolitan area growth, down from a 58 percent peak in the 1971-1981 period. The 2001-2011 increase of 744,000 (8.7 percent) was the lowest since the 1951-1961 census period, and was substantially below the 27.2 percent from rate from 1991 to 2001.

    Thane: During the last 10 years, Thane has become the largest district in the Mumbai larger metropolitan area, with a population of 11.1 million, passing Outer Mumbai. Thane is now the largest district in India. In 2001 Thane had 8.1 million residents in 2001 and grew 35 percent to 2011. This, however, is down from a 55 percent growth rate between 1991 and 2001, reflecting a decline in the overall growth rate of the larger metropolitan area (see below). Thane has steadily increased its share of growth in the larger metropolitan area, from 24 percent between 1961 and 1971 to 55 percent between 1991 and 2001. Thane reached a peak in the 2001-2011 census period, capturing 74 percent of the larger metropolitan area growth. Since 1961, Thane has captured 49 percent of the growth in the larger metropolitan area and added 9.4 million residents. In each of the last two census periods, Thane has added 2.9 million residents, equal nearly to the population of the urban core, Inner Mumbai.

    Raigarh: More remote from the core, Raigarh has experienced considerably slower growth than Thane, and until recently slower than Outer Mumbai. Raigarh grew 19 percent, from 2.21 million in 2001 to 2.64 million in 2011, an increase of 19 percent. This was the only census period since 1901 in which Raigarh grew more quickly than Outer Mumbai. Raigarh accounted for 11 percent of the larger metropolitan area growth between 2001 and 2011 and 8 percent since 1960. Raigarh added approximately 1.575 million residents from 1961 to 2001, more than four times that of larger Inner Mumbai (the urban core).

    Overall Population Growth: Consistent with the general population growth rate declines witnessed in less affluent nations, the Mumbai larger metropolitan area is growing less quickly than in previous decades. Between 2001 and 2011, the area grew 17.3 percent, which is down from 30.9 percent between 1991 and 2001.  The greatest growth had been between 1941 and 1951 (49 percent), with rates from 30 percent to 39 percent in each of the decades from 1951 to 1991 (Figure 4).

    Mumbai: Penultimate Density, Yet Representative: The core urban area (area of continuous urban development) of Mumbai represents approximately 80 percent of the larger metropolitan area population. Mumbai is the third most dense major urban area in the world at nearly 65,000 residents per square mile (25,000 per square kilometer), trailing Dhaka (Bangladesh) and Hong Kong. Yet even at this near penultimate density, Mumbai exhibits the general trends of dispersion and declining density that are occurring in urban areas around the world, from the most affluent to the least. In the two Mumbai city districts, as in other megacities, housing has become so expensive that population growth is being severely limited. Overall, the Mumbai larger metropolitan area may also be experiencing slower growth as smaller metropolitan areas outperform larger ones, a trend identified in a recent report by the McKinsey Global Institute. Finally, the over-crowded, slum conditions that prevail for more than one-half of the city’s residents could be instrumental in driving growth to more the distant suburbs of Thane and Raigarh.

    —-

    Note: This "larger metropolitan area" definition is consistent with the cruder US Bureau of the Census delineation for metropolitan areas, which is based upon counties (in 44 states), rather than tighter definitions, such as municipalities or census tracts.

    Photo: Chhatrapati Shivaji Terminus, formerly Victoria Terminus, Mumbai (by author)

    Wendell Cox is a Visiting Professor, Conservatoire National des Arts et Metiers, Paris and the author of “War on the Dream: How Anti-Sprawl Policy Threatens the Quality of Life

  • The Accelerating Suburbanization of New York

    Some of the best evidence that the tide has not turned against dispersion and suburbanization comes from an unlikely source:  New York’s 2010 census results. If dense urbanism works anywhere in America, it does within this greatest of US traditional urban areas.

    Before the actual count, the Census Bureau estimated, in large part as a result of a successful historical core municipality (city of New York) challenges, that as of Census Day (April 1, 2010), the city would have added 413,000 residents since 2000 and would have accounted for more than one-half of the metropolitan area growth. But the numbers turned out startlingly different. In fact, the city’s census count came in nearly 250,000 below projections and accounted for the lowest share of New York metropolitan area growth since the 1970s.

    Overall the 2010 census figures paint a picture of continuing dispersion in the nation’s largest metropolitan area, New York. The metropolitan area stretches from Manhattan, with the world’s second largest business district (after Tokyo) to the four outer boroughs of the city of New York, more than 100 miles to the eastern end of Long Island, north to Putnam and Rockland counties, completely across northern New Jersey, jumping the Delaware River to include Pike County, Pennsylvania and south to Ocean County (New Jersey), nearly all the way to Atlantic City. In all, this 23 county metropolitan area has the nation’s largest population and actually extended its margin over second place Los Angeles, which has been converted from a growth leader to a laggard giant growing slower than most Midwestern metropolitan areas. New York added 574,000 residents, while Los Angeles added 473,000. If New York continues to add more people than Los Angeles in future censuses, its position as the nation’s largest metropolitan area be secure.

    Major metropolitan areas in general did poorly in terms of growth in the new cesusus. This was particularly true in New York. Between 2000 and 2010, the New York metropolitan area population rose from 18,323,000 to 18,897,000, a modest growth rate of 3.1 percent, one of the slowest among major metropolitan areas in the country. The national growth rate was three times as high

    Suburbanization Accelerating Again: If you had read the New York Times and other Manhattan-based media over the last decade you would have assumed the suburbs were in decline and cities ascendant, particularly in the New York area. Yet in reality over the past decade, the suburban counties captured their largest share of New York metropolitan area growth in three decades. During the 2000s, the suburbs accounted for 71 percent of growth, up from 54 percent during the 1990s and 48 percent in the 1980s. The outer suburbs grew the fastest, while the inner suburbs – some of which are denser than historical core municipalities in other metropolitan areas – grew faster than the historical core municipality, the city of New York (Figure 1 and Table)


    NEW YORK METROPOLITAN AREA
    POPULATION TREND BY COUNTY: 2000 TO 2010
    2000 2010 Change %
    HISTORIC CORE MUNICIPALITY (New York)
    Bronx County, NY       1,332,650       1,385,108        52,458 3.9%
    Kings County, NY       2,465,326       2,504,700        39,374 1.6%
    New York County, NY       1,537,195       1,585,873        48,678 3.2%
    Queens County, NY       2,229,379       2,230,722          1,343 0.1%
    Richmond County, NY         443,728         468,730        25,002 5.6%
    Subtotal       8,008,278       8,175,133       166,855 2.1%
    INNER SUBURBAN
    Bergen County, NJ         884,118         905,116        20,998 2.4%
    Essex County, NJ         793,633         783,969         (9,664) -1.2%
    Hudson County, NJ         608,975         634,266        25,291 4.2%
    Middlesex County, NJ         750,162         809,858        59,696 8.0%
    Nassau County, NY       1,334,544       1,339,532          4,988 0.4%
    Passaic County, NJ         489,049         501,226        12,177 2.5%
    Union County, NJ         522,541         536,499        13,958 2.7%
    Westchester County, NY         923,459         949,113        25,654 2.8%
    Subtotal       6,306,481       6,459,579       153,098 2.4%
    OUTER SUBURBAN
    Hunterdon County, NJ         121,989         128,349          6,360 5.2%
    Monmouth County, NJ         615,301         630,380        15,079 2.5%
    Morris County, NJ         470,212         492,276        22,064 4.7%
    Ocean County, NJ         510,916         576,567        65,651 12.8%
    Pike County, PA           46,302           57,369        11,067 23.9%
    Putnam County, NY           95,745           99,710          3,965 4.1%
    Rockland County, NY         286,753         311,687        24,934 8.7%
    Somerset County, NJ         297,490         323,444        25,954 8.7%
    Suffolk County, NY       1,419,369       1,493,350        73,981 5.2%
    Sussex County, NJ         144,166         149,265          5,099 3.5%
    Subtotal       4,008,243       4,262,397       254,154 6.3%
    SUBTOTAL: SUBURBAN     10,314,724     10,721,976       407,252 3.9%
    TOTAL     18,323,002     18,897,109       574,107 3.1%


    Critically, the city of New York did worse than at any time since the 800,000 population loss that was sustained in the 1970s, representing all of the loss since 1950. Between 1950 and 1980 the suburbs added 3.9 million residents. The city’s fortunes had improved measurably in the 1980s and 1990s, with approximately one-half of the metropolitan area’s growth. The last decade’s share of metropolitan area growth – only 29 percent – in the historical core municipality indicates a startling acceleration of dispersion, although fortunately not a return to the population decline of the 1970s (Figure 2).

    City of New York: The city of New York grew from 8,008,000 to 8,175,000 between 2000 and 2010, a rate of 2.1 percent.

    Staten Island (Richmond County), which is largely suburban in form, was the fastest growing of New York’s boroughs, with a growth rate of 5.6 percent. The Bronx grew the second fastest, at a rate of 3.9 percent. Only Staten Island and Queens (below) reached their population peaks in the 2010 census (Figure 3).

    The Bronx has experienced perhaps the nation’s most successful urban turn-arounds, after a disastrous period in the 1970s and 1980s, when large swaths of the South Bronx were literally leveled. The population fell from 1,472,000 in 1970 to 1,204,000 in 1990. By 2010, the population had recovered nearly two-thirds of the loss, to 1,385,000.

    Manhattan (New York County) added 3.2 percent to its population (49,000) and reached 1,586,000. This is approximately one-third below its population peak of 2,232,000 in 1910.   Manhattan’s population, however, remained approximately 45,000 below the Census Bureau estimates.

    Brooklyn (Kings County) continues to be the largest borough in New York, with 2,505,000 residents, an increase of 39,000 (1.6 percent) between 2000 and 2010. Brooklyn reached its population peak of 2,738,000 in 1950. Brooklyn’s population proved approximately 75,000 below the Census Bureau’s estimates.

    The slowest growing borough was Queens, which added only 2,000 residents (a 0.1 percent population increase), yet reached its population peak of 2,231,000. Queens had added more residents than any other borough since 1950 and added approximately 275,000 residents in the 1990 to 2000 census period.

    Inner Ring Suburbs: The inner ring counties (Nassau, Westchester, Bergen, Passaic, Essex, Hudson, Union and Middlesex) grew 2.4 percent from 6,306,000 to 6,460,000. Growth rates varied significantly, from a loss of 1.2 percent in Essex County (where Newark is located) to 8.0 percent in Middlesex County. Middlesex County includes newer suburban areas further away from the core than in any other inner ring county. Much of the Middlesex County growth occurred in these areas. The inner ring suburbs captured 26.7 percent of the metropolitan area growth.

    Outer Ring Suburbs: By far the e fastest growth was in the outer ring counties, with a population increase of 6.3 percent, from 4,008,000 to 4,262,000. Monmouth County was the slowest growing outer ring county, adding 2.5 percent to its population. Pike County, Pennsylvania, which is the farthest to the west of any county in the metropolitan area, had by far the highest growth rate, at 23.8 percent. Ocean County, New Jersey, had the second fastest growth rate, at 12.8 percent. Ocean County lies at the extreme southern end of the metropolitan area. The outer ring counties captured 44.3 percent of the metropolitan area growth.

    Suburban Growth and Projections: Overall suburban growth was from 10,314,000 to 10,712,000, for a gain of 407,000 (4.0 percent). This was above the Census Bureau estimate of 392,000. The suburbs now contain 57 percent of the metropolitan area population.

    New York’s Continuing Dispersion: The dispersion of the 2000s is an extension of the overall metropolitan area trend since 1950 (Note). The historical core municipality, New York, has added less than 300,000 residents, or 3.6 percent. The suburbs have added 5.3 million residents, nearly doubling their population. Approximately 95 percent of the metropolitan area’s growth was in the suburbs between 1950 and 2010 (Figure 4).

    The dispersion is apparent even in the city of New York. Since 1950, Queens, the outermost of the inner four boroughs, added nearly 700,000 residents, while the more inner boroughs of Manhattan, Brooklyn and the Bronx, lost nearly as many residents. Overall these four inner boroughs gained only 6,000 residents since 1950. Staten Island, which is largely post-war suburban, grew 277,000, while the city overall was growing by 283,000, leaving only a net gain of 6,000 for the four inner boroughs of New York.

    A recent newgeography.com article documents similar patterns in employment dispersion and commuting during the 1990 to 2008 period.

    Consistency with the National Trend: The accelerating suburbanization of New York is consistent with the national trends in major metropolitan areas in the new census data. Between 1990 and 2000, historical core municipalities accounted for 15 percent of metropolitan area growth. Between 2000 and 2010, the share of historical core municipality growth had fallen to 9 percent.

    Note: This analysis is based upon the metropolitan area boundaries as currently defined.

    Wendell Cox is a Visiting Professor, Conservatoire National des Arts et Metiers, Paris and the author of “War on the Dream: How Anti-Sprawl Policy Threatens the Quality of Life

    Photo by Mike Lee

  • The Evolving Urban Form: The Valley of Mexico

    The last 60 years of urban growth in the Mexico City area should dispel any belief that suburban dispersion is principally an American phenomenon or even limited to the high income world. Over the last 60 years, all of the population growth in what is now called the Valley of Mexico metropolitan area and urban area has occurred outside the urban core (See Map). In this regard, the declining population in Mexico City urban core mirrors that of other urban cores, such as the city of Chicago, the city of Copenhagen, the city of Paris and nearly all other urban cores in the high income world.


    Map: Valley of Mexico Urban Area: Northernmost Urbanization Excluded

    A New Name: the Mexico City metropolitan area is one of only two out of the world’s more than 25 megacities (10 million or more population) that has adopted a name more reflective of geographical reality, shedding reference to the urban core, which is declining in influence virtually everywhere. The other name-changing metropolitan area is Jakarta where the name Jabotabek is an acronym composed of the beginning of four large municipality names.  Mexico’s national statistics bureau, the Instituto Nacional de Estadística y Geografía (INEGI) has designated the Mexico City metropolitan area as the "Zona Metropolitana del Valle de México," which translates to the Valley of Mexico metropolitan area.

    According to the broadest definition, the Valley of Mexico metropolitan area had a population of 21.4 million according to the 2010 census. The Valley of Mexico joins a lengthening list of metropolitan areas with more than 20 million people. No reliable world ranking of metropolitan areas is feasible, because of varying definitions by nations and other population estimating sources (Note: Metropolitan Ranking). It can be said with assurance that the world’s largest metropolitan area is Tokyo – Yokohama, with approximately 40 million people and perhaps even that Jabotabek ranks second at nearly 30 million people. Other metropolitan areas making legitimate claims to having more than 20 million people include Seoul, Sao Paulo, Mumbai, Delhi, Manila and New York (Note: New York).

    The Valley of Mexico Urban Area

    In the early 1980s, the Valley of Mexico was expected to become the world’s largest urban area. A number of factors worked to keep that from happening, such as a falling birthrate and the devastating earthquake of 1985, which slowed growth and the simple problems created by the unmanageable scale of the region. This led to greater decentralization both to peripheral parts of the Valley of Mexico as well to other Mexican states.   

    In 2010, the Valley of Mexico urban area had a population of 19.4 million people. The urban area is estimated to cover 780 square miles (2,020 square kilometers), for a population density of 25,000 per square mile (9,700 per square kilometer). This makes the Valley of Mexico urban area approximately one-fourth the density of Dhaka (Bangladesh), the densest urban area in the world and similar in density to the Cairo urban area. The Valley of Mexico is less than three times as dense as the Paris urban area and less than four times the density of North America’s most dense urban areas, Los Angeles and Toronto. The next edition of Demographia World Urban Areas: Population & Projections (current edition) will show the Valley of Mexico to be the world’s ninth largest urban area.  

    The key issue here is a population growth rate that has plummeted since 1950. In the 1950s and the 1960s, the Valley’s population growth exceeded 5.5% annually. The rate fell to 4.0% during the 1970s, and dropped to 1.6% in the 1980s and 1990s. By the 2000s, the annual population growth rate had fallen to 0.8% (Figure 1).

    Urban Core: Former Mexico City:  In 1950, the core “delegations” constituted Mexico City – Cuahtemoc, Miguel Higalgo, Venustiano Carranza and Benito Juarez had 2.23 million people out of the urban area’s 2.88 million. Mexico City covered a land area of 54 square miles (139 square kilometers). In 1970 the population rose to a peak of 2.85 million with a peak population density of 53,000 persons per square mile (20,500 per square kilometer). At this point a severe population decline began, with a drop of more than 1.1 million people to 1.68 million by 2005. This represented a 41 percent drop in population density, two 31,000 persons per square mile (12,000 persons per square kilometer). A modest increase to 1.73 million people occurred between 2005 and 2000 in the urban core.

    In 1950, the urban core accounted for 78 percent of the urban area population. By 2010 this figure had fallen to under nine percent (Figure 2).


    The Suburbs: As of the 2010 census, more than 90 percent of the urban area population lives in what has historically been the suburbs.  Since 1950, the urban core has lost 500,000 residents; while suburban areas have added more than 17 million. Thus, the suburbs have accounted for more than 100 percent of the growth in the urban area over the past 60 years (Figure 1). During the 1950s, the suburbs accounted for more than 80 percent of the growth and in each decade since that time the suburbs have been 95 percent or more of the growth.

    In the earlier decades, the suburbs inside the Distrito Federal (but still outside the urban core) accounted for most of the growth, 93 percent during the 1950s and 53 percent during the 1960s. However from the 1970s to the present the growth has shifted to the more distant suburbs outside the Distrito Federal. These suburbs have captured at least 70 percent of the growth, including between 80 percent to 90 percent over the past two decades.

    Valley of Mexico Metropolitan Area

    The trend of continuing dispersion is evident in the metropolitan area trends. As defined in 2005, the Valley of Mexico metropolitan area included the 16 "delegations" (boroughs) of Mexico City (the Distrito Federal), and 60 municipalities (municipios), 59 of which are in the adjacent state of Mexico and the last of which is in the more northerly state of Hidalgo. In the late 2000s, another 28 municipalities in the state of Hidalgo were proposed for addition to the metropolitan area (and are included in this analysis).

    The metropolitan area is divided into five parts, the urban core (pre-1994 Mexico City), the urban balance of the Distrito Federal, inner ring municipalities, which are adjacent to the Distrito Federal, the outer municipalities before the proposed expansion and the 28 municipalities in the state of Hidalgo.

    Between 2000 and 2010, the urban core of the former Mexico City added 38,000 people or two percent to its population but accounted for only two percent of total metropolitan area population growth. Thus, during the 2000s, suburbs (areas in the urban area outside the urban core) gained 98 percent of the population growth (Figure 3).

    The vast majority of the growth took place either in the outer delegations – some 12 percent of growth –while the inner suburbs of the state of Mexico captured 9 percent of the growth. The "lion’s share" of the growth was in the outer suburbs of the states of Mexico and Hidalgo, at more than 75 percent.

    Clearly, the Valley of Mexico metropolitan area is prime example of the suburbanization and reduced urban densities that have occurred virtually around the world.

    Valley del Mexico Population: 2000 to 2010
    Geographical Sector 2000 2010 Increase Rate Share
    Urban Core (Former Mexico City) 1.692 1.730 0.038 2% 2%
    Balance of Distrito Federal 6.913 7.143 0.230 3% 13%
    Distrito Federal 8.605 8.873 0.268 3% 15%
    Inner Muncipalities 6.061 6.232 0.171 3% 10%
    Outer Municipalities 3.730 5.032 1.302 35% 75%
    Hidalgo Expansion 0.993 1.240 0.248 25% 14%
    Total 19.390 21.378 1.740 9% 100%
    In millions

    ——

    Note: New York: according to US Census Bureau estimates from 2009, the New York metropolitan area had slightly less than 20 million people. However the Combined Statistical area (which includes the Connecticut suburbs) had a population of 22 million people. Because metropolitan areas are labor market areas, the extent of their transport systems is an important factor in delineation. In the case of New York, the extent of the highway and transit systems is sufficient to suggest the combined statistical area as more appropriate for international comparisons.

    Note: Metropolitan Area Ranking: There is only one known research effort to consistently define and rank the world’s metropolitan areas. Richard L. Forstall (who ran the Rand McNally "Ranally" international metropolitan area program), Richard P. Green and James B. Pick, produced that list, which was limited to the top 15 in the world. This small number, in relation to more than 750 metropolitan areas in the world with more than 500,000 people illustrates both the difficulty of obtaining sufficient data and the complexity of the research.

    Note: Pachuca de Sota: the entire urban area is within the Valley of Mexico metropolitan area.

    Photo:  Cathedral, Mexico City (by author)

    Wendell Cox is a Visiting Professor, Conservatoire National des Arts et Metiers, Paris and the author of “War on the Dream: How Anti-Sprawl Policy Threatens the Quality of Life

  • The Evolving Urban Form: Seoul

    Based upon the preliminary results of the South Korea 2010 census, Seoul has become the world’s third largest metropolitan area. The jurisdictions making out the metropolitan area, the provincial level municipality of Seoul (which is the national capital), the province of Gyeonggi and the provincial level municipality of Incheon now have a population of approximately 23.6 million people. This is third only to Tokyo – Yokohama, which has a population of approximately 40 million and Jabotabek (Jakarta), which is approaching 30 million. While international metropolitan area population estimates should be taken with a "grain of salt," (Note 1: Metropolitan Areas) the rise of Seoul is nearly unprecedented in the high-income world. Further, many more people are projected to move to the Seoul metropolitan area as the trend of rural and smaller area migration to larger urban areas continues.

    A Difficult History: However, any analysis of Seoul and its progress must begin in the context of the overall economic progress of South Korea and its difficult history.

    Seoul was a major battleground in the Korean War of 1950 to 1953. During 1950 alone, military control of the municipality of Seoul changed hands four times. Today, despite the precariousness of the political situation on the Korean Peninsula, the northern suburbs of Seoul are as close as four miles (seven kilometers) from the demilitarized zone, which forms the border with North Korea. 

    Strong Economic Growth: A very poor country even before the war, South Korea has been an economic success story. Based upon data produced for the Organization for Economic Cooperation and Development by the late economist Angus Maddison, South Korea had a gross domestic product per capita (purchasing power parity) of less than $1300 (2010$) in 1950. It had peaked, as a Japanese colony, somewhat above that level before World War II, but never approached one quarter of the GDP per capita of the United States and averaged less than one third of then high income Argentina.

    After the Korean War, initial economic progress was slow. As late as 1965, South Korea’s GDP per capita was less than that of Mozambique. Since that time, South Korea’s GDP per capita has risen from approximately $2000 to $30,200 in 2010 It exceeded Argentina in the 1980s.  

    South Korea today has a higher GDP per capita than Spain and New Zealand and less than 10 percent behind the European Union, on which it is gaining quickly. As the capital, the Seoul is a prosperous metropolitan area in a prosperous country.

    South Korea’s prosperity is also considerable contrast to that of North Korea’s. South Korea’s GDP per capita is more than 15 times that of North Korea (Figure 1). This would make any future reunification far more expensive for South Korea then Germany’s unification was for West Germany, because the economic disparity, though substantial, was much less.

    The Urban Area: Growing and Dense: The Seoul urban area (area of continuous development) includes the municipality of Seoul and also includes the urbanization of Incheon, to the west and substantial suburban development in the province of Gyeonggi on the other three sides (Note 2: Urban Areas). Based upon an analysis of data from the 2010 census, we have estimated the Seoul urban area population at 22.5 million. The next edition of Demographia World Urban Areas: Population & Projections (current edition) will show Seoul to be the world’s third largest urban area, trailing only Tokyo-Yokohama and Delhi (which recently passed Mumbai to become India’s largest urban area). Jakarta, the second largest metropolitan area, ranks as the fourth largest urban area, though will soon pass Seoul, because of much stronger growth. Among high income world urban areas, Seoul’s population growth has been greater than that of any other since 1950 except for Tokyo-Yokohama. Seoul added more than 20 million people, while Tokyo-Yokohama added more than 25 million people. By comparison, New York added less than 10 million people and Paris added 4 million people.

    Seoul’s population density is among the highest of the world’s affluent urban areas. With population density of 27,000 people per square mile (10,400 per square kilometer), Seoul ranks second in the high income world among urban areas of more than 5 million people, trailing only Hong Kong, which is more than twice as dense. Thus, Seoul is more than twice as dense as Tokyo-Yokohama, three times as dense as Paris and four times as dense as Los Angeles or Toronto, the densest urban regions in North America.

    With the exception of Hong Kong, no first world urban area has the density of high rise condominium developments as are found in Seoul. While virtually all of the recent urban expansion in both population and geography has been in the suburbs, nearly all of the new residences are in high rise buildings.

    Seoul is also the home to massive city real estate developments. For example, Ilsan, in Gyeonggi is a very large planned high-rise community to the north of the Han River (which bisects the urban area), west of Seoul and north of Icheon. Most of Ilsan was developed by the early 2000s. The high rise development of Songdo, four miles (seven kilometers) south of the core of Incheon is intended to be home to 75,000 people and 50 million square feet of office space.

    Seoul’s Han River is crossed by multiple bridges, including architectural icons. A new international airport (Seoul-Incheon) was opened in 2005, 43 miles (70 kilometers) away from the Seoul central business district. This airport, on an island west of Incheon is most remote international Airport among the world’s megacities (urban areas over 10 million population), 8 miles further even than Narita International Airport from central Tokyo. Domestic flights continue to operate out of Gimpo Airport, which is halfway between the cores of Seoul and Incheon.

    Distribution of Population Growth: The municipality of Seoul – the capital district – is one of the largest municipalities in the world, with nearly 10 million people (Note 3: Municipalities). However, like many core municipalities that have not expanded their boundaries, Seoul is losing population. The 2000 census shows the population to have declined 900,000, or nearly 10 percent, from 1990. The population loss during the 2000s was a somewhat more modest 200,000.

    Since 1990, all the population growth in the Seoul metropolitan area since has been in the suburbs. The province of Gyeonggi has gained more than 5 million residents, while the municipality of Incheon has added more than 800,000 residents.  During the 2000s, the province of Gyeonggi added enough population to exceed the municipality of Seoul as the largest provincial level jurisdiction in the metropolitan area (Table).

    Seoul Metropolitan Area Population: 1960-2010
    Year Metropolitan Area Provincial Level Jurisdiction
    Seoul Gyeonggi Incheon
    1960 5.1 2.4 2.7  
    1970 8.6 5.3 3.3  
    1980 14.9 8.3 6.6  
    1990 18.6 10.6 6.2 1.8
    2000 21.4 9.9 9.0 2.5
    2010 23.6 9.7 11.3 2.6
    In Millions
    Incheon created from Gyeonggi in 1981


    The Future? There is also some question about whether Seoul will remain the national capital. In 2004, the national government decided to move the capital to Gongju, 90 miles (150 kilometers) south of Seoul. The decision was both preceded and followed by considerable political jockeying and it appears that the government is backtracking on the capital move (though construction has begun).

    Regardless of the eventual fate of the new capital, Statistics Korea projections indicated that the Seoul metropolitan area will continue to expand. The population of the municipality of Seoul is expected to decline through 2030 while the suburban jurisdictions of Incheon and Gyeonggi are expected to continue their growth. Further, more rapid growth is anticipated in North Chungcheon and South Chungcheon provinces as the metropolitan area, and perhaps even the urban area spreads further to the south. This larger metropolitan area is projected to grow to more than 31 million people by 2030.

    —-

    Note 1: Metropolitan Areas: Metropolitan areas are the economic dimension of the urban form. They represent the labor markets (area from which people commute to the urban area) and thus include both the urban area and surrounding economically attached rural and exurban areas. There are no international standards for delineating metropolitan areas and most national statistical agencies have no such delineation. The nations that do giving me metropolitan areas have differing standards and even within nations there are substantial difficulties. The only serious attempt to define metropolitan areas based upon consistent standards was by urban expert Richard L. Forstall (who ran the Rand McNally "Ranally" international metropolitan area program), Richard P. Green and James B. Pick. The complexity of the research is indicated by the fact that their list is limited to the top 15 in the world. Other attempts to delineate metropolitan areas generally rely on complete second or third level jurisdictional boundaries, such as counties, states or provinces. This can lead to specious comparisons of densities, because the jurisdictions that are used vary so much in size. This is perhaps best illustrated by comparing Portland and Riverside – San Bernardino. In 2000 (latest available data), the Riverside – San Bernardino urban area had a densities slightly higher than that of Portland. Yet the metropolitan areas vary greatly in size, due simply to the size of the counties that comprise them. The two counties of the Riverside – San Bernardino metropolitan area cover four times as much land area as the seven county Portland metropolitan area.

    Note 2: Urban Areas: urban areas are the structural dimension of the urban form (the "urban footprint"). Urban areas are the area of continuous urban development. They may also be called urbanized areas (such as United States, United Kingdom, France, India and Canada); urban centers (Australia) or urban agglomerations (United Nations). Canada will switch its terminology for urban areas to "population centres" in the 2011 census. The distinction between urban areas and metropolitan areas can be confusing and has led some internet – based lists to somewhat indiscriminately mix the two. Moreover, the term "urban area" has even been used to denote an area well beyond the continuous urbanization (more akin to a metropolitan area), such as in its definition by statistics New Zealand.

    Note 3: Municipalities: international comparisons of municipalities (often called "cities," which is a term that can also be used for two substantially different concepts, metropolitan areas and urban areas) are generally invalid, because there is no geographic or population criteria between or even within nations by which municipalities are defined. This is illustrated by the fact that the world’s largest municipality, Chongqing is largely rural, not urban, and covers an area approximately the size of Austria or Indiana. While the municipality of Chongqing (and virtually all other Chinese "cities") is larger than its metropolitan area, municipalities may be far smaller than their metropolitan areas. For example, the municipality of Melbourne ("city of Melbourne") has less than 2 percent of the metropolitan area population, while the municipality of Atlanta has less than 10 percent of the metropolitan area.

    Note 4: The United Nations population estimates show the Seoul urban area to be limited to the municipality of Seoul which produces a far smaller estimate of less than 10 million people.

    —–

    Photo: Suburban Seoul (by author)

    Wendell Cox is a Visiting Professor, Conservatoire National des Arts et Metiers, Paris and the author of “War on the Dream: How Anti-Sprawl Policy Threatens the Quality of Life

  • Shrinking City, Flourishing Region: St. Louis Region

    Throughout the high income world, in this age of cities, many urban centers continue to shrink. This is particularly true in municipalities that have been unable either to expand their boundaries or to combine with another jurisdiction, subsequently running out of new developable land.

    For example, the city of Paris (as opposed to the metropolitan area or urban area, see Note) lost a quarter of its population between 1954 and 1999, while the loss in some core districts (arrondissements) was 75 percent. Copenhagen, which is often considered one of Europe’s most vibrant municipalities lost more than one-third of its population between 1950 and 2000. Other core municipalities have lost more than one-half million people, such as, London, Seoul, Glasgow, Berlin, Osaka, Chicago, Detroit, Philadelphia and St. Louis.

    City of St. Louis Population Loss: Yet no city which achieved the scale of a half million residents has lost a larger percentage of its population in peacetime than St. Louis. To some extent, this is a very old problem for a city that was once the largest in the Midwest but was passed in 1880 by Chicago.

    In 1950 the city population peak at 857,000 people and ranked 8th among the nation’s municipalities. By 2009, the latest estimates, the population was 357,000 (ranked 48th in the nation), a decline of nearly 60 percent from the peak.

    Metropolitan Population Gain: But as is the case for many “shrinking cities,” the region outside the municipal boundaries has continued to grow. In1950, the population of the metropolitan region (as currently defined) was 1,940,000. By 2009, the metropolitan region had grown to 2,890,000, for a population increase of nearly 1,000,000 (more than a 50 percent increase). St. Louis is a bi-state metropolitan area, with three quarters of the population living in Missouri and the balance in Illinois, a ratio than has been largely unchanged since 1900.

    The metropolitan region (or combined statistical area) includes the city of St. Louis, (a county equivalent jurisdiction), 8 counties in Missouri and 8 counties in Illinois. The St. Louis metropolitan region covers approximately 9,100 square miles (Figure 1), of which the principal urban area (area of continuous urbanization) covered 829 square miles (9 percent of the metropolitan region).

    As in the case of virtually all large high-income world metropolitan areas, population growth has principally occurred on the suburban fringe. For example, from 1965 to 2000, 110 percent of the growth in major metropolitan areas of Western Europe was in the suburbs, more than in the United States (90 percent since 1950).

    Distribution of Population: Even by these standards, St. Louis may be an extreme case. In 1950, 44% of the region’s population was in the city of St. Louis. The inner ring the counties of St. Louis, St. Clair (Illinois) and Madison (Illinois), accounted for another 41% of the population. Thus 85% of the metropolitan region’s population lived in the city or the inner ring counties. The other 15% lived in middle ring and outer ring counties.

    By 2009 the population of the city and the inner ring counties had fallen to 65% of the region. The city and county of St. Louis (which were combined until 1876), reached a combined population peak in 1970 and has lost 225,000 people since that time, falling below the 1960 census total.

    The middle ring counties represented 29% of the population while the outer ring counties had 6% of the population (Figure 2) in 2009. During the 2000s, the middle ring counties added more than 130,000 residents, while the city added 10,000.

    Consistent with the trend since the late 1950s, nearly all of the metropolitan region growth occurred outside the city and the inner ring between 2000 and 2009. The city is estimated to have accounted for 7% of the region’s growth. The inner ring counties actually shrank while the middle ring counties accounted for 76% and the outer ring counties 22% of the growth (Table 1 and Figure 3) for the region.

    Table 1
    St. Louis Metropolitan Region: Population Trend
    1900-2009
    Sector
    1900
    1950
    2000
    2009
     METROPOLITAN REGION (CA) 
    1,039,543
    1,942,848
    2,757,377
    2,892,874
     HISTORIC CORE 
    575,238
    856,796
    346,904
    356,587
     City of St. Louis 
    575,238
    856,796
    346,904
    356,587
     INNER RING 
    201,419
    794,651
    1,531,692
    1,524,482
     St. Louis Co. 
    50,040
    406,349
    1,016,364
    992,408
     Madison Co. (IL) 
    64,694
    182,307
    259,120
    268,457
     St. Clair Co. (IL) 
    86,685
    205,995
    256,208
    263,617
     MIDDLE RING 
    187,384
    213,394
    730,563
    833,706
     Franklin Co. (MO) 
    30,581
    36,046
    94,059
    101,263
     Jefferson Co. (MO) 
    25,712
    38,007
    198,740
    219,046
     St. Charles Co. (MO) 
    24,474
    29,834
    286,171
    355,367
     Bond Co. (IL) 
    16,078
    14,157
    17,650
    18,103
     Clinton Co. (IL) 
    19,824
    22,594
    35,536
    36,368
     Jersey Co. (IL) 
    14,612
    15,264
    21,655
    22,549
     Macoupin Co. (IL) 
    42,256
    44,210
    48,989
    47,774
     Monroe Co. (IL) 
    13,847
    13,282
    27,763
    33,236
     OUTER RING 
    75,502
    78,007
    148,218
    178,099
     Lincoln Co. (MO) 
    18,352
    13,478
    39,254
    53,311
     St. Francois Co. (MO) 
    24,051
    35,276
    55,743
    63,884
     Warren Co. (MO) 
    9,919
    7,666
    24,721
    31,485
     Washington Co. (MO) 
    14,263
    14,689
    23,410
    24,400
     Calhoun Co. (IL) 
    8,917
    6,898
    5,090
    5,019
     Metropolitan Region: Combined Statistical Area (2009 Definition) 

    Despite often well-orchestrated impressions to the contrary, the continuing dominance of suburban population growth in the St. Louis metropolitan region mirrors the experience in other major metropolitan areas across the nation.. This growth has not been, as is often supposed, at the expense of the city. Over the past sixty years suburban growth was actually three times the total net loss suffered by the city. Increasingly when people move to St. Louis, they actually mean that they are coming to the suburban periphery.

    Domestic Migration: Overall in the past decade, the St. Louis metropolitan region experienced only a modest domestic migration loss – far less than many other regions . Approximately 1.3 percent of the 2000 population, or 35,000 people moved from St. Louis to other parts of the nation. By comparison, in similar sized and sunny San Diego, the domestic migration loss was 127,000, with a percentage loss more than three times that of St. Louis. Who could have imagined that in a decade, Los Angeles would lose 1.3 million more domestic migrants than St. Louis and New York 2 million more (granted, from much larger bases).

    During the 2000s, the domestic migration trends within the St. Louis metropolitan region reflected the national trend of migration from core areas to the suburbs. According to US Census Bureau estimates, the 2000 to 2009 in domestic migration loss in the St. Louis metropolitan region was distributed as follows (Figure 4):

    • The city of St. Louis has lost a net 63,000 domestic migrants (18.0 percent of its 2000 population)
    • The inner ring counties have lost a net 59,000 domestic migrants(4.0 percent of the 2000 population), 57,000 of which were lost in St. Louis County
    • The middle ring counties gained a net 64,000 domestic migrants with a gain of 45,000 in St. Charles County (8.7 percent of the 2000 population).
    • The outer ring counties gained a net 24,000 domestic migrants (16.4 percent of the 2000 population) with nearly one half of the gain (11,000) in Lincoln County.

    Net international in-migration was the one bright spot for the city and inner suburbs, which gained the bulk of the 30,000 immigrants who came to region over the past decade (Table 2). But this was not nearly enough to balance the losses from domestic migration.

    Ultimately the St. Louis story reflects the deeper reality seen across the high-income (and even in some low and lower income world metropolitan areas, as future installments will indicate), albeit somewhat more exaggerated. Many core cities continue to stagnate or even shrink, but their regions remain vibrant, expressing a form of urbanism that, while often unappreciated, remains vital and expansive.

    ——–

    Note: Metropolitan areas are composed (outside New England) of complete counties or county equivalent jurisdictions. They include substantial rural expanses, which are economically tied to the principal urban area (the largest urban area in the metropolitan area). An urban area is an expanse of continuous urbanization, and contains no rural territory.

    Photo: St. Louis skyline (by author)

    Wendell Cox is a Visiting Professor, Conservatoire National des Arts et Metiers, Paris and the author of “War on the Dream: How Anti-Sprawl Policy Threatens the Quality of Life

  • The Two Worlds of Buenos Aires

    Central Buenos Aires is undoubtedly one of the world’s great tourist destinations. Days could be spent walking among its narrow streets admiring the plentiful art noveau, art-deco, beaux-arts and other architectural styles. The triumphal Avenida 9 de Julio is one of the world’s widest boulevards with two interior roadways of up to seven lanes and two service roads of two lanes, with a Washington Monument type obelisk at Avenida Corrientes (Top photo). Avenida 9 de Julio is bordered by buildings that are both ordinary and impressive, such as the Colon Opera House.

    There is also an attractive area of redevelopment adjacent to the core in the former dock area, Puerto Madero. The old port buildings have been converted to commercial uses, especially restaurants. A number of high-rise condominium buildings have been constructed beyond the old port basins. Government buildings more than match the commercial architecture, with the National Congress and the Casa Rosada, or “Pink House,” with its balconies from which President Peron and his wife Eva used to address the public (Photo 2). Not more than two weeks ago, former President Nestor Kirchner lay in state to be visited by in an emotional outpouring by hundreds of thousands of Argentineans. The city of Buenos Aires also has a distinctive legislative building (Photo 3).

    These older romantic styles make Buenos Aires a wonderful walking environment. Most were erected in the first three decades of the 20th century. This was Buenos Aires at its zenith. Then, Buenos Aires was capital of one of the world’s acknowledged economic powers. Argentina generally ranked around10th in gross domestic product (GDP) per capita during that period (Note 1). Thus, today, the tourist can enjoy the product of that prosperous time.

    Economic Stagnation: More recent years have not been good to the Buenos Aires area and Argentina. The nation has seen decades of ups and downs – but mostly downs. The nation has been buffeted between constitutional governments and military dictatorships. Too often, even the constitutional governments have placed too little emphasis on creating wealth and too much on redistributing it. A failed currency policy in the 1990s destroyed the savings of millions. All of this has led to Argentina’s migration from the top 10 economies to near the bottom of the top 100, now ranked at 82nd in the world in GDP per capita. No top ten nation from early in the 20th century has fallen so far. New Zealand managed to drop from 1st in the world in 1920 to 51st now, but still has a GDP per capita double that of Argentina.

    Argentina suffered the largest sovereign debt default in world history, at $100 billion in 2002. The nation’s former colonial master, Spain, trailed Argentina in GDP per capita throughout the 20th century to the 1980s, yet is now more than twice as prosperous (Figure 1)

    This economic decline is not so evident in the autonomous city of Buenos Aires, which is also called Capital Federal, analogous to the District of Columbia (DC) in the United States. This is the Buenos Aires of tourists, an area only slightly larger than Washington, DC, but with five times the population. The municipality of Buenos Aires is by far the most affluent urbanization in the nation. Even so, there are informal settlements within the city, such as Villa 31. Overall, approximately three percent of the city’s population is in these kinds of informal settlements.
    BA3-bencich
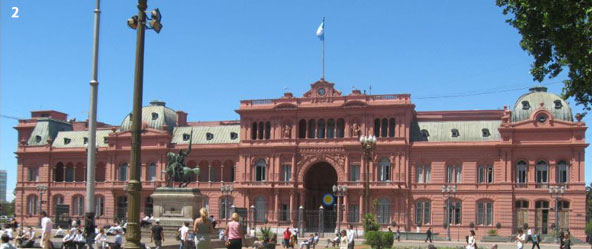
    Population and Distribution: According to the last census (2001), the city of Buenos Aires had fewer people than in 1947, having fallen from 3.0 million residents to 2.8 million. The city is also very dense, at 35,600 persons per square mile (13,700 per square kilometer), which is about one-half the density of Manhattan or the ville de Paris and double the density of the city of San Francisco.

    Most of the population lives in peripheral areas. This dominant suburban growth pattern is typical of world urbanization, as can be seen in such high-income nation capitals as London, Washington, Brussels, Copenhagen has been in the suburbs. Indeed, all growth in Paris has been in the suburbs since 1881. Like the ville de Paris, the city of Buenos Aires now accounts for less than 25 percent of its metropolitan area population (Figure 2).

    Overall, the urban area (area of continuous development) has nearly 13 million people and covers more than 1,000 square miles (2,600 square kilometers) for a population density of 12,100 per square mile (4,700 per square kilometer). This is 70 percent more dense than Los Angeles and one-third more than Paris but less than one-eighth that of Dhaka (Bangladesh).

    Suburban Buenos Aires: The suburbs of Buenos Aires differ from those in high-income national capitals. Generally, the suburbs are far poorer than the city and reflect the more recently less affluent Argentina that has emerged in recent decades just as the central area testified to the nation’s former relative wealth. All of suburban Buenos Aires is in the adjacent Buenos Aires province, which has the largest population in the nation.

    Some of the suburbs are affluent, especially to the northwest, where suburban municipalities like Pilar and Tigre contain housing that could easily fit in upper middle income suburbs of the United States or Europe. However, even in these areas, there are close-by developments of low-quality and even informal housing, mostly housing domestic employees to the higher income population.

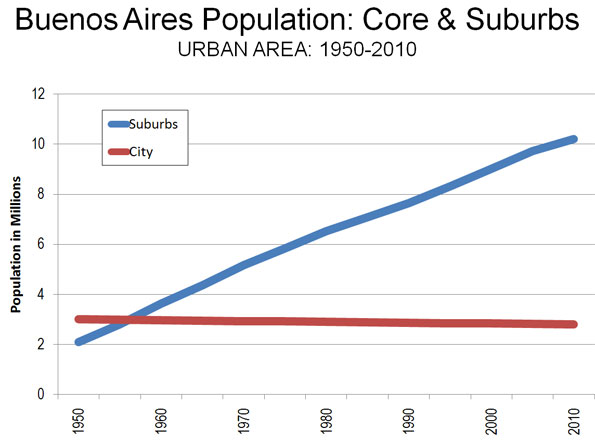
    The suburban poverty is far more pervasive to the southwest and the southeast. Many neighborhoods look similar to modest suburbs in Mexico City, though without the pervasive informal settlements. More people live in informal settlements in the suburbs than in the city, with estimates putting the number at above 500,000.

    More than the Core: Any thought, however, of Buenos Aires being a “compact city” is dispelled by the vast sea of lights visible on an evening flight out of Ezeiza International Airport. The urbanization stretches 30 to 40 miles in all possible directions, to the northwest, southwest and southeast (with the Rio de la Plata being to the northeast).

    However, probably no urban area illustrates the general rule that urban cores tend to be substantially different from their suburbs. Not only is suburban Buenos Aires far less dense, but it is far less affluent. Any who visits the city alone will have missed more than three-quarters of the reality.

    ————

    Note: GDP per Capita data based upon Angus Maddison’s work for the Organization for Economic Cooperation and Development.

    Photos (by the author):
    Top: Avenida 9 de Julio
    2: Casa Rosada
    3: City of Buenos Aires Legislative & Office Buildings
    4: Bencich Building
    5: Casa Borolo

    ————

    Wendell Cox is a Visiting Professor, Conservatoire National des Arts et Metiers, Paris and the author of “War on the Dream: How Anti-Sprawl Policy Threatens the Quality of Life