Tag: Heartland

  • The U.S. Economy: Regions To Watch In 2012

    In an election year, politics dominates the news, but economics continue to shape people’s lives. Looking ahead to 2012 and beyond, it is clear that the United States is essentially made up of many economies, each with distinctly different short- and long-term prospects. We have highlighted the five regions that are most poised to flourish and help boost the national economy.

    Our list assumes that we will be living in a post-stimulus environment. Even if President Obama is re-elected, it will largely be the result of the unattractive nature of his opposition as opposed to his economic policies. And given it is unlikely the Democrats will regain the House — and they could still lose the Senate — we are unlikely to see anything like the massive spending associated with Obama’s first two years in office.

    Clearly the stimulus helped prop up certain regions, such as New York City, Washington and various university towns, which benefited from the financial bailout, lax fiscal discipline and grants to research institutions. But in the foreseeable future, fundamental economic competitiveness will be more important. Global market forces will prove more decisive than grand academic visions.

    With that in mind, here are our five regions to watch in 2012.

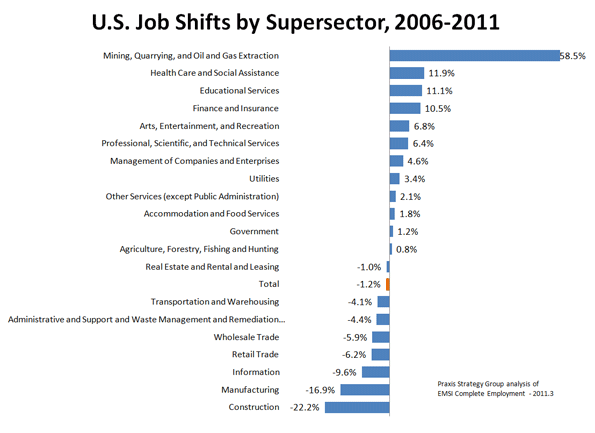
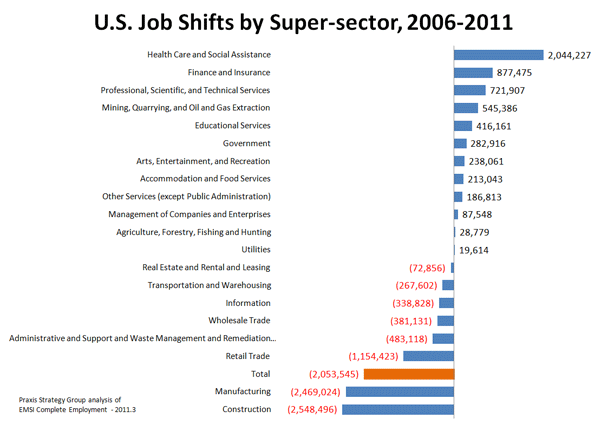
    1. The Energy Belt. Even if Europe falls into recession, demand from China and other developing countries, as well as threats from Iran to cut off the Persian Gulf, will keep energy prices high. While this is bad news for millions of consumers, it could be a great boon to a host of energy-rich regions, particularly in Texas, Oklahoma, the Dakotas, Montana, Louisiana and Wyoming. New technologies that allow for greater production require higher prices than more conventional methods — roughly $70 a barrel — and most experts expect prices to stay above $100 for the next year.

    Goldman Sachs recently predicted that the U.S. will become the world’s largest oil producer by 2017. The bounty is so great that the key energy-producing states have consistently out-performed the national average in terms of job and income growth. Houston, the nation’s energy capital, has enjoyed the fastest growth in per-capita income in the past decade. No reason to expect this to slow down much this year.

    Energy growth, notes Bill Gilmer, senior economist at the Federal Reserve Bank of Dallas, also sparks “upstream” expansion in a host of other industries, such as chemicals and plastics. Massive new expansions to serve the industry are being planned not only in Texas and Louisiana but in former rust belt states, including now gas-rich Ohio. The big exception is oil-rich California, which seems determined to keep its fossil fuels — and the growth they could drive — out of mind and underground.

    2. The Agricultural Heartland. You don’t have to have oil or gas to enjoy a strong economy. Omaha, Neb., is not in the energy belt, but its strong agriculture-based economy keeps its unemployment rate well under 5%. Demand from developing countries — especially China, which is expected to supplant Canada as our No. 1 agricultural market — should boost the nation’s farm income to a record $341 billion.

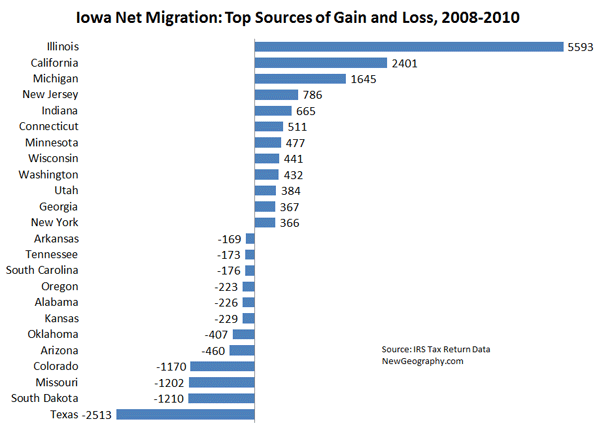
    Most of the increased product demand lies in commodities like soybeans, corn, barley, rice and cotton. Contrary to the assumptions of East Coast magazines such as The Atlantic, which paint a picture of a devastated and dumb rural America, places like Iowa are doing very well indeed and are likely to continue doing so. Urban economies like Des Moines are also benefiting and expanding into finance and other non-farm related activities. The once massive out-migration from the region has slowed to something like a balance, with increasingly strong in-migration from places like Illinois and California.

    3. The New Foundry. The revival of Great Lakes manufacturing is one of the heartening stories of the past year, but the biggest beneficiaries of American manufacturing’s revival will likely be in the Southeast and along the Texas corridor connected to Mexico. Future big growth will not come from bailed-out General Motors or Chrysler, with their legacy costs and still-struggling quality issues, but from foreign makers — Japanese, German and increasingly Korean — that build highly rated, energy-efficient vehicles. These countries are not just investing in cars; they also have placed steel mills and aerospace facilities in the rising south-facing foundry.

    Foreign companies have good reasons to look to an expanded U.S. base: aging domestic markets, diminishing workforces and a growing concern over China’s tendency to steal technology and favor state-owned firms. This shift from domestic production has been building for years, in large part due to familiar reasons of less unionization and lower business costs. Of the ten foreign auto assembly plants opened or announced between 1997 and 2008, eight were in Southern right-to-work states. As the recovery has taken hold, new expansions are being announced. In 2011 Toyota opened a new plant in the tiny hamlet of Blue Springs, Miss., just 17 miles from Elvis’ hometown of Tupelo, while Mercedes-Benz announced  $350 million to add capacity to its plant just outside of Tuscaloosa.

    4. The Technosphere. Silicon Valley, as well as the Boston area, has thrived under the stimulus, and worldwide demand for technology products will continue to spark some growth in those areas. Over the past year, San Jose-Silicon Valley, Boston and Seattle all stood in the top five in job creation among the country’s 32 largest metro areas. The coming IPO for Facebook and other Valley companies may heighten the tech sector’s already smug sense of well-being.

    Unfortunately for the rest of California, and even more blue-collar Bay Area communities like San Jose and Oakland, high costs and an unfavorable regulatory environment will keep this bubble geographically constrained. Historic patterns, particularly over the past decade, suggest that as the core tech companies expand, they are likely to head  to business-friendly places such as  Salt Lake City, Raleigh and Columbus, Ohio, which have picked up both tech companies and educated migrants from California.

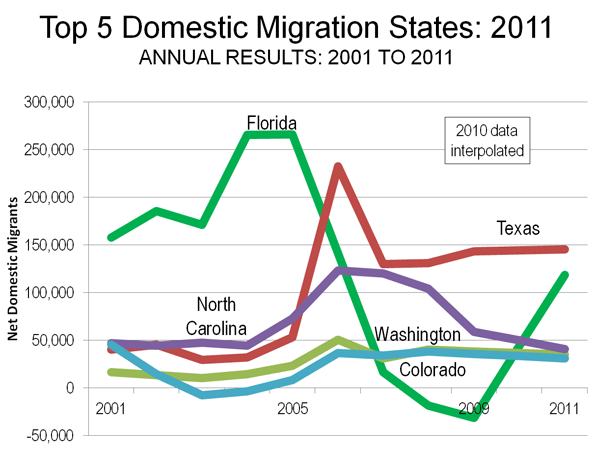
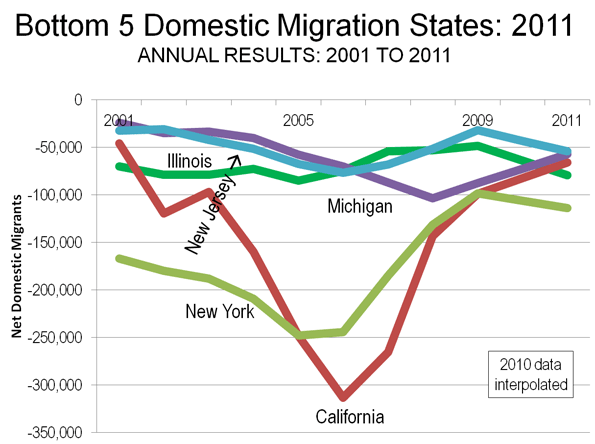
    5. The Pacific Northwest. This is one blue region in the country with excellent prospects. For one thing, both Washington and Oregon enjoy considerable in-migration, in sharp contrast to New York, California and Illinois. They also have a more varied economy than Silicon Valley, with strong companies connected to retail (Amazon, Costco and Starbucks), aerospace (Boeing) and software (Microsoft).

    The Seattle region, home to all these companies,  is the real standout. It ranked first on our recent list of technology regions and third in industrial manufacturing, a trend likely to continue as Boeing expands production of its new 787 Dreamliner. The business climate and the housing costs are somewhat challenging, but more favorable than in California. The Bay Area and Los Angeles continue to send large numbers of migrants to the Puget Sound region. Over the long term, the area also benefits from possessing ample cheap renewable energy (mostly hydro) and water, which are both  in short supply elsewhere.

    These scenarios, of course, could be changed by either world events — such as an unexpected crash in the Chinese economy — or a stunning Democratic sweep in 2012 that would occasion another round of Obamaian stimulus and ever more heavy-handed regulation. Yet barring such developments, expect the back to basics economy to continue enriching these regions best positioned to take advantage of it.

    This piece also appeared at Forbes.com.

    Joel Kotkin is executive editor of NewGeography.com and is a distinguished presidential fellow in urban futures at Chapman University, and contributing editor to the City Journal in New York. He is author of The City: A Global History. His newest book is The Next Hundred Million: America in 2050, released in February, 2010.

    Photo by BigStockPhoto.com.

  • The Shifting Landscape of Diversity in Metro America

    Census 2010 gave the detail behind what we’ve known for some time: America is becoming an increasingly diverse place.  Not only has the number of minorities simply grown nationally, but the distribution of them among America’s cities has changed. Not all of the growth was evenly spread or did it occur only in traditional ethnic hubs or large, historically diverse cities.

    To illustrate this, I created maps of U.S. metro areas showing their change in location quotient. Location quotient (LQ) measures the concentration of something in a local area relative to its concentration nationally. This is commonly used for identifying economic clusters, such as by comparing the percentage of employment in a particular industry locally vs. its overall national percentage. In a location quotient, a value of 1.0 indicates a concentration exactly equal to the US average, a value greater than 1.0 indicates a concentration greater than the US average, and a value less than 1.0 indicates a concentration less than the US average.

    While commonly used for economic analysis, the math works for many other things. It can be useful to measure how the concentration of particular values changes over time relative to the national average.  In this case, we will examine the change in LQ for various ethnic groups between the 2000 and 2010 censuses for metro areas. Those metro areas with a positive change in LQ grew more concentrated in that ethnic group compared to the US average over the last decade. Those with a negative change in LQ grew less concentrated compared to the nation as a whole, even if they grew total population in that ethnic group.

    To increase concentration level requires growing at a faster percentage than the US as a whole. This is obviously easier for places that start from a low base than those with a high base. In this light, places that have traditionally been ethnic hubs – such as west coast metros for Asians – can grow less concentrated relative to the nation as a whole even if they continue to add a particular ethnic group. Asian population, for example, can grow strongly in California, but at a slower rate than the rest of the country. This is indeed the case as groups like Hispanics and Asians have been de-concentrating from the west coast, and now are showing up in material numbers even in the Heartland.

    Black Population


    Black Only Population, Change in Location Quotient 2000-2010

    The change in Black concentration is particularly revealing. Much has been written about the so-called reversing of the Great Migration. But contrary to media reports, there is no clear monolithic move from North to South. Instead, we see that the outflow has been disproportionately from America’s large tier one metros like New York, Chicago, and Los Angeles. In contrast, Northern cities like Indianapolis, Columbus, and even Minneapolis-St. Paul (home to a large African immigrant community) grew Black population strongly, and actually increased their Black concentrations. Similarly, there were clearly preferred metro destinations in South for Blacks, like Atlanta and Charlotte. Many other Southern metros , particularly those along the Atlantic coast of Georgia and the Carolinas continued to lose their appeal to Blacks, relatively speaking.

    Hispanic Population


    Hispanic Population (of any race), Change in Location Quotient 2000-2010

    Here we see de-concentration clearly in action. The Mexican border regions retained high Hispanic population counts, but they are no longer as dominant as in the past. Places like Nashville, Oklahoma City, and Charlotte particularly stand out for increasing Hispanic population percentage. Again, large traditionally diverse tier one cities like New York and Chicago show declines on this measure as smaller cities are now more in on the diversity game.

    Asian Population


    Asian Only Population, Change in Location Quotient 2000-2010

    Again, we see here that America’s Asian population spread well beyond traditional west coast bastions. There were big increases in Asian population counts, with resulting LQ changes, in places like Atlanta, Indianapolis, Philadelphia, and Boston. Even New York (which now has over one million Asian residents within the city limits alone) and Chicago showed gains among Asians.

    Children (Population Under Age 18)

    As a bonus, here is a look at LQ change for metro areas for people under the age of 18.


    Children (Population Under Age 18), Change in Location Quotient 2000-2010

    Here we see that metros along America’s northern tier now have relatively fewer children than a decade ago, while metros like Denver, Dallas, and Nashville had more. Clearly, some places are increasingly seen as better – and perhaps also more affordable – locations for child rearing than others.  Perhaps unsurprisingly many of the out of favor locales are either expensive, have poor economic prospects, and/or are excessively cold. Not surprisingly, for example, Atlanta, Houston and Florida’s west coast have gained in this demographic while much of the Northeast, particularly upstate New York, have lost out.

    The overall key is while there are certain broad themes that emerge from the recent Census, such as America’s increasing diversity or signs of a reversing of the Great Migration, we need to take a more fine grained view to see which places are in fact benefitting and being hurt by these trends.  What we see here is that traditional large urban bastions of black population and ethnic diversity are no longer the only game in town. Smaller places in the interior and the South are now emerging as diversity magnets in their own right, as well as magnets for families with children. This is the collection of places to watch to look for the next set of great American cities to emerge.

    Aaron M. Renn is an independent writer on urban affairs based in the Midwest. His writings appear at The Urbanophile. Telestrian was used to analyze data and to create maps for this piece.

    Note: The original version of this piece included incorrect charts for the Asian, Hispanic, and child measures.

  • New Census Data Reaffirms Dominance of the South

    The 2011 state population estimates released earlier today by the Census Bureau show that the South has retained its dominant position in both population and growth over the last year. Southern states accounted for more than one half of the nation’s population growth between 2011 and 2000, despite having little more than one third of the population. Moreover, the South was the recipient of 95% of the inter-regional net domestic migration (people moving from one state to another), with the West accounting for the other 5%, with the losses split between the Northeast and the Midwest.

    Overall, a net 533,000 people moved from one state to another, somewhat above the low of 503,000 in 2008 and below the 573,000 at the beginning of the previous decade (2001). The figure, however, remained less than one-half that of the mid 2000s peak.

    The state data confirmed the "return to normalcy," that had been indicated by the 2010 American Community Survey data.

    The South Rises Again

    In 2011 (July 2010 to June 2011), seven of the top domestic migration gaining states were in the South. This is a restoration of the same dominance the South achieved in 2001 to 2006. Some of the states have changed, but the overall impact is little different.

    Texas:Texas again led the nation in net domestic migration, adding 145,000 people from other states to its population. This was a slight increase from the 143,000 net domestic migrants in 2009 (Note 1) and was the highest for Texas since the artificially intense exodus from Louisiana in the year (2006) following hurricanes Katrina and Rita. Texas has led the nation in net domestic migration for six years and ranked second in the nation over the 2001 to 2009.

    Florida: Most spectacularly, however, has been the performance of Florida. Florida had been a net domestic migration leader for years, and had been number one from 2001 through 2005. However, when its highly inflated house prices collapsed (New York Federal Reserve Bank research refers to Florida as one of the "four bubble" states, along with California, Arizona and Nevada), Florida lost domestic migrants for the first time in at least six decades, in both 2008 and 2009. That has been radically turned around. In 2011, Florida added 119,000 net domestic migrants, housing prices dropped to normal levels (Note 2). While this is less than one half the gains in 2004 and 2005, it exceeds the annual Texas increase in the previous decade by 20%.

    North Carolina and South Carolina: North Carolina ranked third, adding 41,000 net domestic migrants. This is an improvement from a fourth-place ranking in the previous decade. Neighboring South Carolina added 22,000 net domestic migrants and ranked sixth. This is an improvement from the previous decade’s ranking of seventh. The domestic migrants to North Carolina and South Carolina have been called "halfbacks," as some have suggested that many who had moved to Florida from the Northeast have subsequently moved to North Carolina and South Carolina, essentially one half of the way back to where they moved from originally.

    Tennessee, Georgia and Virginia: Tennessee (7th), Georgia (8th) and Virginia (9th) rounded out the South’s seven of the top 10 states. Tennessee improved from having been 8th in 2001 to 2009, while Georgia dropped from 5th and Virginia was a new entrant, having previously ranked 12th.

    Western Runners-Up

    While the West continued to show net domestic migration gains, this formerly fastest-growing area of the nation has fallen well behind.

    Washington: Washington ranked fourth in 2011, an improvement from ninth between 2001 and 2009. Washington added 35,000 net domestic migrants.

    Colorado: Colorado also improved its position, adding a net 31,000 domestic migrants and ranking fifth in 2011, which is up from its 10th ranking in 2001 through 2009.

    Oregon:Oregon ranked 10th, adding 14,000 net domestic migrants and was a new entrant to the top 10, having placed 11th between 2001 and 2009.

    Things Never Change: The Bottom 10

    A similar restoration of normalcy is evident in the bottom 10 states. From 2001 to 2009, all of the bottom 10 net domestic migration states were in the Northeast or the Midwest, joined by California. This changed somewhat in 2011, with formerly fast-growing Nevada, edging out one of the former bottom 10. There was some movement at the very bottom of the list.

    New York: New York recovered its last place position (51st), which it held overall between 2001 and 2009, but had yielded to California later in the decade. New York lost 114,000 net domestic migrants in 2011, which compares to the 1,650,000 loss between 2000 and 2009.

    Illinois:Illinois had the second-highest net domestic migration loss, sending 79,000 of its residents to other states. Illinois had ranked 49th in net domestic migration in the previous decade, with a 615,000 loss. Unlike the other biggest losers, New York and California, the Illinois rate in the single year of 2011 exceeded its annual rate of net domestic migration loss between 2000 and 2009.

    California:The bad news is that California continues to be among the most hemorrhaging states in net domestic migration. The 2000 to 2009 net domestic migration loss of 1,500,000 was more than the population of the cities (municipalities) of San Francisco and Sacramento combined. Perhaps it is good news that the net domestic migration loss dropped to 66,000 in 2011, less than half the annual rate in the previous decade. California ranked 49th in net domestic migration in 2011, an improvement from its 50th place position in 2001 through 2009.

    Michigan: Michigan continued its heavy losses, losing a net 57,000 domestic migrants in 2011 and ranking 48th. In the previous decade, Michigan had also ranked 48th and had a net loss of more than 535,000 domestic migrants.

    New Jersey, Ohio and Connecticut: New Jersey, Ohio and Connecticut occupied the next three higher positions in the bottom ten. The New Jersey and Ohio ranks of 47th and 46th were the same as in the previous decade. Connecticut ranked 45th in 2011 and had ranked 42nd, at the top of the bottom 10, in the previous decade. Each of these states experienced an acceleration of net domestic outmigration relative to their annual loss in the previous decade. In the previous decade, the New Jersey and Connecticut losses had been driven by the New York metropolitan area, which suffered the preponderance of the net domestic migration losses in the Northeast.

    Missouri and Indiana: The Midwestern states of Missouri and Indiana were new entrants to the bottom 10. Missouri ranked 44th in net domestic migration in 2011, losing 12,000, a substantial deterioration from its 20th ranking in the previous decade when the state added 41,000 residents from other states. Indiana ranked 43rd compared to its 32nd place ranking in the previous decade.

    Nevada: Nevada, which had ranked sixth in net domestic migration in the previous decade, occupied the top position in the bottom 10, at 42nd. Nevada lost 11,000 domestic migrants, compared to a gain of more than 360,000 in the previous decade. Like Florida, house prices had escalated sharply during the housing bubble and prices have since fallen back to normal levels. However, much of Nevada’s economy is tied to that of California, which could be a hindrance to the restoration of its previous growth.

    Other Notes

    The other "bubble state," Arizona ranked 11th in net domestic migration, adding 13,000 new residents from other states. As in Florida, house prices had escalated sharply but have since fallen back to normal levels. However, despite its healthy domestic migration, Arizona’s gain is far less than its annual rate in the previous decade.

    There are nothing but surprises in the balance of the top 15. Oklahoma, which has long exported people, especially to the West, ranked 12th in net domestic migration, an improvement from 19 in the previous decade. The District of Columbia ranked 13th, which is a strong improvement from its previous ranking of 37th. Louisiana continued its recovery, ranking 14th, which is an improvement from 45th in the previous decade. North Dakota, whose 2000 population was less than that of 1920, ranked 15th, which is an improvement from 31th in the previous decade.

    No Matter How Much Things Change They Stay the Same

    Both over the last decade and in 2011, the South accounted for 53% of the nation’s growth, the West 32%, with the Midwest rising from 8% to 9% and the Northeast falling from 7% to 6%. And, as indicated above, net domestic migration results were similar. The conclusion from the new census estimates is consistent with the old adage that "no matter how much things change, they stay the same."

    Net Domestic Migration by State:
    2001-2009 and 2011
    By 2011 Rank
    State 2011 2011 Rank 2001-2009 2001-2009 Rank
    Texas       145,315                   1        838,126                   2
    Florida       118,756                   2     1,154,213                   1
    North Carolina         41,033                   3        663,892                   4
    Washington         35,166                   4        239,037                   9
    Colorado         31,195                   5        202,735                 10
    South Carolina         22,013                   6        306,045                   7
    Tennessee         20,328                   7        259,711                   8
    Georgia         17,726                   8        550,369                   5
    Virginia         15,538                   9        164,930                 12
    Oregon         13,636                 10        177,375                 11
    Arizona         13,150                 11        696,793                   3
    Oklahoma           8,933                 12           42,284                 19
    District of Columbia           8,334                 13         (39,814)                 37
    Louisiana           7,085                 14       (311,368)                 45
    North Dakota           6,368                 15         (18,071)                 31
    Kentucky           5,761                 16           81,711                 15
    Arkansas           5,724                 17           75,163                 16
    Montana           3,888                 18           39,853                 21
    West Virginia           2,814                 19           17,727                 26
    South Dakota           2,610                 20             7,182                 27
    Delaware           2,347                 21           45,424                 18
    New Mexico           2,202                 22           26,383                 24
    Alabama           1,974                 23           87,199                 14
    Alaska               740                 24           (7,360)                 29
    Wyoming             (149)                 25           22,883                 25
    Idaho             (256)                 26        110,279                 13
    Utah             (826)                 27           53,390                 17
    Vermont             (841)                 28           (1,505)                 28
    Nebraska             (977)                 29         (39,275)                 36
    Maine          (1,000)                 30           29,260                 23
    Pennsylvania          (1,121)                 31         (33,119)                 34
    Iowa          (1,361)                 32         (49,589)                 40
    Hawaii          (2,320)                 33         (29,022)                 33
    Maryland          (2,994)                 34         (95,775)                 43
    New Hampshire          (3,645)                 35           32,588                 22
    Rhode Island          (6,273)                 36         (45,159)                 38
    Mississippi          (6,672)                 37         (36,061)                 35
    Kansas          (7,928)                 38         (67,762)                 41
    Minnesota          (8,073)                 39         (46,635)                 39
    Massachusetts       (10,886)                 40       (274,722)                 44
    Wisconsin       (10,990)                 41         (11,981)                 30
    Nevada       (11,113)                 42        361,512                   6
    Indiana       (11,412)                 43         (21,467)                 32
    Missouri       (11,831)                 44           41,278                 20
    Connecticut       (16,848)                 45         (94,376)                 42
    Ohio       (44,868)                 46       (361,038)                 46
    New Jersey       (54,098)                 47       (451,407)                 47
    Michigan       (57,234)                 48       (537,471)                 48
    California       (65,705)                 49   (1,490,105)                 50
    Illinois       (79,458)                 50       (614,616)                 49
    New York     (113,757)                 51   (1,649,644)                 51
    Data from US Bureau of the Census


    —–

    Note 1: The Census Bureau did not produce domestic migration data for 2010 (2009-2010). Any reference to 2010 in this article is based upon an interpolation of the 2010 estimate from 2009 and 2011 Census Bureau estimates.

    Note 2: By 2010, housing affordability in all of Florida’s four major metropolitan areas with the exception of Miami had been returned to a Median Multiple (median house price divided by median household income) of approximately 3.0 or less, which is the historical norm (See: 7th Annual Demographia International Housing Affordability Survey). During the housing bubble of the early to middle 2000s, the Median Multiple had risen to above 5.0 in all of the major metropolitan areas except Jacksonville.

    Wendell Cox is a Visiting Professor, Conservatoire National des Arts et Metiers, Paris and the author of “War on the Dream: How Anti-Sprawl Policy Threatens the Quality of Life

  • Iowa: Not Just the Elderly Waiting to Die

    Stephen Bloom, a journalism professor at the University of Iowa, created quite a stir in Iowa this week with a piece in The Atlantic describing his unique observations on rural Iowa as evidence that it doesn’t deserve its decidedly powerful hand in the vote for the president. After the article appeared last Friday both his colleagues and the massive student body of the state he so harshly criticizes are returning the favor.

    Mr. Bloom’s writing is not offensive because it contains no truths, but because has over-generalized our collective character as unfalteringly Christian, complacent, ignorant, and uncultured.  He continually describes a sense of delusion that is rampant in the Iowa populace. And, of course, since we’re from Iowa we must have met a meth head before, right?

    When I was a four year old, my parents picked up everything they had and transplanted their lives from Phoenix all the way to Northwest Iowa. I was young, but I can still remember the farm that we originally settled in– it was the kind of farm you see in a painting: a one-level home, a big red barn, two silos for storage, a small thicket grove with a number of deer, and even a fenced-in area for hogs. I was living the rural Iowa dream.

    Eventually, when I was around seven, our next settlement of choice was a (very) small town only a couple of miles from the farmhouse. The city’s population had around 200 people, the vast majority of them at least 50 years old, and a main street littered with old buildings and storefronts of yesterday that had been abandoned over the years since their mid-century inceptions. People didn’t move to this town; instead those living in it would die from old age, or, in my case, move away in hopes of seeing something bigger.

    I’m well aware of the stereotypes of Iowans: we’re wannabe hicks, we’re uncultured, we hunt, we tend to our rolling hills of corn and beans, we all drive Ford trucks because they “ride better” than anything else. I’ve grown up with people that fulfill these stereotypes here and there and I am no stranger to small town life, but not every soul that I have met in this state fits the profile as Professor Bloom posits. Far from it.

    Expectedly, Bloom’s portrayal of Iowans hasn’t exactly had a warm reception. On Tuesday, the Daily Iowan’s front page had perhaps the most outrageous quote that Bloom’s article included, labeling rural Iowans as nothing more than “the elderly waiting to die, those too timid (or lacking in educated [sic]) to peer around the bend for better opportunities, an assortment of waste-toids and meth addicts with pale skin and rotted teeth, or those who quixotically believe, like Little Orphan Annie, that ‘The sun’ll come out tomorrow.’”

    Yesterday, Sally Mason, the president of the University of Iowa, sent out a campus-wide letter reminding the students that she “disagrees strongly with and was offended by Professor Bloom’s portrayal of Iowa and Iowans”. She reminds us of the generosity that Iowans famously possess and of our “pragmatic and balanced” lifestyles. She also goes on to speak about Dubuque’s recent revitalization, the kinds of companies Iowa has attracted (namely Rockwell Collins in Cedar Rapids and Google in Council Bluffs), and the fact that Iowa City, at times called the “Athens of the Midwest”, is designated as the only “City of Literature” in the United States. It seems like Bloom forgot to take any of this into account.

    He even goes so far as to berate and categorize Iowa’s Mississippi River cities as “some of the skuzziest cities” that he’s ever visited. Cities such as Burlington, Keokuk, Muscatine, and Davenport all seem to be more degraded, violent, and worse-off than some of the cities he’s used to having seen growing up in New Jersey, a place with cities that are labeled time and time again for their overall “skuzziness.” Has he ever driven to Newark?

    It seems that Bloom’s laughable interpretation of his years in Iowa have a few rings of truth that I’ve definitely witnessed, but to completely overgeneralize a people into one category assuming it’s only an “Iowa thing” is inappropriate and crude. Is he correct about anything at all? The numbers show that he is off base about the state as a whole.

    The Mississippi River cities’ so-called blight is similar to many other hard hit industrial cities in the Midwest, perhaps on a similar scale to areas in Michigan (which was the only state in the past Census to actually lose population) where Bloom has holed up most recently as a visiting professor for the University of Michigan. Even so, Iowa has the 11th lowest household poverty rate in the nation. So much for widespread blight.

    The state’s brain drain is always a topic of discussion. There has been a very noticeable population shift of rural to urban in the past half-century which was especially fueled by the farming crisis in the 80s, but this trend holds out empirically for all Midwestern states. The problem is that a look at the numbers doesn’t confirm major outmigration. Iowa saw a net gain from other states according to IRS tax return data from 2008-2010. In fact, the net gain from the top 12 source states ­­– states like Illinois, California, and Michigan – in the last three years is 40% higher than the net loss to the top destinations. If Iowans are “fleeing” anywhere, it’s to places like Texas, the largest gainer, and second placed South Dakota which the professor would no doubt like even less.

    Iowa does have high concentrations of people over age 70, but that group makes up about 10% of the total population, not enough to skew the other age groups much from the national average. Iowa has an average number of children, and it lags the most in 35-44 year olds: about 10%. This older group skews the state’s educational attainment numbers as well. Iowa’s young workforce is well educated, ranking 11th of all states in residents with at least an associate’s degree. Bloom’s claim that the state is uneducated is simply not true.

    The median age of those living in rural areas is 41.2 while urbanites are relatively young at 35.8. To further add to these negative trends, rural areas have a job growth rate of -6% in the past three years, these numbers mainly fueled by the recession. But overall state jobs are is down 2.8% since January 2008, better than 35 other states. Clearly Iowans are not lazy and giving up.

    Four Iowa cities were even included on CNN Money’s Best Cities to Live in 2011. (This includes the Mississippi River city of Bettendorf.) The state and its cities are also a great place to do business, according to Forbes. In 2010, Des Moines was ranked first, with Cedar Rapids at 13th beating out even a few Texan heavyweights, including Houston, Dallas, and Fort Worth that have been lauded for having a plethora of jobs. The 2011 list puts Des Moines in second place and Cedar Rapids in 11th. It seems Iowa isn’t as economically distraught as Bloom leads us to believe.

    Bloom comes off as nothing more than an ignorant, smug “city-slicker” (a word that Iowans apparently use to describe Obama) who sees the state through an apparently very blurry window. He claims to have seen all 99 counties of Iowa, but how can he possibly paint a portrait of the state that is so absurdly misguided after living here for so long?  If this is what they teach in journalism school, perhaps our skepticism of the media may be better placed than even we suspect.

    Jacob Langenfeld is a senior undergraduate at the University of Iowa studying economics and geography.

    Mark Schill contributed demographic analysis to this piece.

    Des Moines photo courtesty of BigStockPhoto.com.


  • HELP WANTED: The North Dakota Boom

    The nation’s unemployment rate has been hovering at nearly nine percent since 2009. But not every state is suffering an employment crisis. In the remote, windswept state of North Dakota, job fairs often bustle with more recruiters than potential workers. The North Dakota unemployment rate hasn’t risen above five percent since 1987.  In the state’s oil country, unemployment hovers at around two percent, and pretty much everyone who wants a job—as long as they are old enough and not incarcerated—is employed.  North Dakota has either tied for or had the lowest unemployment in the country since 2008.   

    The job base of the state (population 672,500) has grown five percent in the past two years. Even more astonishing, there are over 16,000 unfilled jobs, and projections indicate that 45,000 more workers will be needed in the next two years.  Of those jobs, one out of three will be in oil and gas.

    The Booming West

    If you are willing to endure the blazing hot summers and bitterly cold winters, come to western North Dakota, young (or not) man (or woman) and you can get a job. Michael Ziesch has worked with Job Service of North Dakota for the past 15 years and is currently a manager in the Labor Market Information Center. “The average wage in oil and gas is $80,000 plus overtime, and there will likely be plenty of that,” said Ziesch.  Development of the massive Bakken oil field in the western part of the state has tapped out the local workforce.

     If you are not interested in an energy job, consider retail. Employers are paying $15 an hour for convenience store employees and fast food workers. Drive through any community in the area and you will be hard pressed to find a store front devoid of a sign shouting “Help Wanted, Now!” It seems that everything in the state these days ends with an exclamation mark, and for a state filled with unassuming, hardworking, family-centered kind of folks, it’s a little disconcerting.

    New North Dakotans

    Job seekers from outside the state are flocking to Williston, the unofficial capital of the oil boom, located in the remote northwestern corner of North Dakota. The population here has grown from 12,500 to an estimated 22,000 in the past five years.

    Williston is home to 350 oil service companies. Willistonlife.com, an employment and informational website built with the objective of attracting workers to the area, boasts that at any given time, over 1,200 job openings are available in the Williston area alone. On its home page, the website beckons to the nation’s unemployed in large white letters brightly juxtaposed against a black background, “Make Your Move!”

    The wildcat oil culture that the newly arrived encounter, though, is distinctly different than the risk-averse culture of the state. One “New North Dakotan” noted that although long-time residents of the state are pleasant (we smile a lot), helpful (there’s no better place to have a flat tire), kind (we’ll bring you a hot dish if you are sick), and polite (we almost always hold the door open for the person behind us), we are not quite “friendly.” We are a little guarded with folks we didn’t grow up with. Ethnic to us means Norwegian or German. We’re not used to accents other than our own. (And, no, we don’t talk like the actors in the movie Fargo.) One more thing — and this is important — we talk about the weather a lot.

    What should you know before you throw your last $100 in your gas tank and head up to Williston to make cold calls for jobs? Don’t come without a housing plan, or you may find yourself among the hundreds of parking lot denizens, living out of your car.

    New North Dakotans need places to live, creating an enormous construction boom. Williston formerly saw about five new homes a year. So far this year, 2,000 new homes have sprouted up. In 2012, the expectation is for 4,000 more along with apartments, hotels and, outside of town, dormitory-style housing facilities known as ‘man camps’. According to the Williston Herald, since the boom began, the market price of rental housing in Williston has jumped from $300 to $2,000 per month for a modest apartment. Hotels are full and booked for months, charging $170 to $200 a night.  

    Service is hard to come by. Waits of 45 minutes or more are not uncommon at fast-food restaurants. The Dairy Queen closes at 5:00 pm because they can’t retain enough staff to stay open any later, and many small businesses have simply closed their doors for lack of employees. The town’s Wal-Mart doesn’t have enough employees to stock the shelves, so boxes are simply laid open in the middle of the aisles for customers to grab what they need. Locals have discovered a “secret route” into the store to avoid the worst of the incoming traffic, and even the local Luddites have managed to learn how to use the self-checkout lanes as a matter of self-preservation. A professor at Williston State College complained recently that she had to text her husband with a request to pick up clothes hangers while he was out of town visiting relatives because local stores were completely sold out. It’s not only hangers; long lines and low inventory have made running everyday errands a vexing challenge. “It sounds crazy,” this same professor says, “but I order laundry detergent online and have it delivered by UPS to my front door.”

    At Williston State College, faculty often take out their own garbage to help out the strapped maintenance staff.  The school is seeing lower enrollments as students are drawn away from post-secondary education by the lure of instant cash.

    The law of supply and demand has kicked in across all sectors of the community. A severe shortage of contractors, plumbers and electricians means that homeowners wait weeks or even months for simple home projects. The local community college is putting out a second bid for a parking lot because, the first time, they didn’t get any bids at all.

    Even more disturbing in Williston are rumors of impending electricity shortages. Worried about brownouts and blackouts during the long North Dakota winter, many townspeople have picked up generators in Fargo, where they sell for $700, compared to the “sale” price of $1300 in Williston.

    Officials are quick to point out that the state’s larger cities, Bismarck and Fargo, are also thriving. In the Governor’s most recent State of the State address, he posited his explanation of ‘The North Dakota Miracle’: “It is about an educated workforce, low taxation, a friendly regulatory climate.” And if your state happens to be sitting atop 400 billion barrels of oil … hey, it can’t hurt.

    Energy Economics: Boom and Bust

    Oilmen have known for fifty years that beneath North Dakota’s surface lay billions of barrels of oil, perhaps as much as 4 million barrels per square mile.

    In 1952, The Wall Street Journal reported that Williston was receiving a “cornucopia of riches.” Banks were setting new deposit records weekly, and the population had jumped from 7,500 to 10,000.  In the early 1980s, oil prices skyrocketed and the region again became an exploration target as its vast deposits became economically feasible to drill. When prices began to slip, hitting a low of $9 a barrel by 1986, the boom faltered and, even more quickly than it began, it was over. The state spent the later part of the 1990s trying to recover from a brutal bust.

    Today, a perfect storm of two 21st century technologies, hydraulic fracturing and horizontal drilling, along with high prices and unprecedented demand, have come together to make drilling profitable, triggering a new boom that some experts say will be the biggest and longest lasting in the cycle of boom and bust. Conventional wisdom is that this time around the oil boom will be steadier and longer, because oil prices are no longer being defined by the cartels that once controlled the world’s oil prices and, therefore, the economics of energy. In the meantime, the oil pump jacks that dot the skyline are nodding their heads in greeting. Welcome to North Dakota.

    Debora Dragseth, Ph.D. is professor of business at Dickinson State University in Dickinson, North Dakota.

    Photo of Williston, ND traffic jam courtesy of Williston Department of Economic Development.

  • A Decade in College Degree Attainment

    This week the Census Bureau released its 2010 data from the American Community Survey. The ACS is what contains many of the core demographic characteristics that are frequently opined upon, such as college degree attainment, commute times, etc.

    It used to be that the Census Bureau collected this information during the decennial census using the so-called “long form” that went to one out of every ten households. But that was discontinued as of this census and has been replaced with with the ACS. The ACS reports data more frequently (annually for geographies larger than a certain size), but has a smaller sample size and so there’s lot of statistical noise that I don’t think we are used to dealing with yet. For example, in 2008 the Indianapolis metro area ranked #3 in the US for growth in college degree attainment over the course of the decade to date among metros greater than one million people. But in the 2010 data Indy ranked #28 on the same measure. There are fluctuations year to year and the margin of error needs to be accounted for in serious statistical analysis. Nevertheless, this is what we have to work with.


    Metro area college degree attainment, 2010

    I’m going to roll out a series of posts covering the highlights of some of this data. I’ll start with educational attainment, since that is something that is so key to upward social mobility and urban economic success.

    But first I’ll put in a brief plug for my Telestrian tool. The Census Bureau site for distributing this data is a disaster. As one Brookings senior fellow put it, “Lots of Census data yesterday, today. Lots of angles, stories, conclusions. One shared sentiment: new American Factfinder is AWFUL” and “New Factfinder making mainframe punchcards look appealing.” Telestrian is designed for very rapid basic analysis and comparative benchmarking moreso than simple fact lookups (though it can do that do). In fact, I generated every table, graph and map in this post in ten total minutes with it. Even if you aren’t in the market for a commercial product, there’s a no credit card required free trial period, so if you are interested in perusing the ACS data and don’t want to beat your head against the wall with the Census Factfinder, I encourage you to check it out. Telestrian doesn’t have every data element, but it has a lot of interesting stuff.

    College Degree Attainment

    College degree attainment (the percentage of adults with a bachelors degree or higher), is one of the most critical factors in urban success. If you’d like to know more, just check out all the great research on it under the heading of “talent dividend” over at CEOs for Cities.

    The map at the top of the post is 2010 college degree attainment for metro areas. Here are the top ten, among those with a population greater than one million, showing total number of people with degrees and the attainment percentage:


    Row Metro Area 2010
    1 Washington-Arlington-Alexandria, DC-VA-MD-WV 1,758,297 (46.8%)
    2 San Jose-Sunnyvale-Santa Clara, CA 558,519 (45.3%)
    3 San Francisco-Oakland-Fremont, CA 1,317,354 (43.4%)
    4 Boston-Cambridge-Quincy, MA-NH 1,335,276 (43.0%)
    5 Raleigh-Cary, NC 301,012 (41.0%)
    6 Austin-Round Rock-San Marcos, TX 429,163 (39.4%)
    7 Denver-Aurora-Broomfield, CO 651,661 (38.2%)
    8 Minneapolis-St. Paul-Bloomington, MN-WI 822,321 (37.9%)
    9 Seattle-Tacoma-Bellevue, WA 867,193 (37.0%)
    10 New York-Northern New Jersey-Long Island, NY-NJ-PA 4,613,445 (36.0%)

    And here’s the bottom ten:


    Row Metro Area 2010
    1 Riverside-San Bernardino-Ontario, CA 499,663 (19.5%)
    2 Las Vegas-Paradise, NV 278,387 (21.6%)
    3 Memphis, TN-MS-AR 209,987 (25.1%)
    4 San Antonio-New Braunfels, TX 344,247 (25.4%)
    5 Louisville/Jefferson County, KY-IN 224,392 (25.8%)
    6 Tampa-St. Petersburg-Clearwater, FL 513,182 (26.2%)
    7 Birmingham-Hoover, AL 198,856 (26.3%)
    8 New Orleans-Metairie-Kenner, LA 209,916 (26.8%)
    9 Jacksonville, FL 241,801 (26.9%)
    10 Phoenix-Mesa-Glendale, AZ 731,643 (27.2%)

    While we are on the topic, here is a map of college degree attainment by state:


    State college degree attainment, 2010

    And here is county level college degree attainment for those counties covered by the 1-year ACS:


    County college degree attainment, 2010

    Changes in College Degree Attainment

    Beyond just the raw 2010 numbers, it’s interesting to look at which places are growing their college degree attainment the most. That is, which places are growing their talent base. So here’s a look at metros by their change in college degree attainment over the last decade:


    Change in percentage of adults with college degrees, 2000-2010.

    Some places already have very high college degree attainment, which can make it tougher to grow even higher. Speaking of which, the US as a whole raised its college degree attainment as well. To some extent, this is purely a function of demographics. Older generations have lower educational levels than younger ones. (None of my grandparents had a college degree, and my father’s parents never even finished high school. I don’t think that was atypical for their day).

    What might be more interesting to look at is whether places are increasing their college degree attainment faster or slower than the US overall. There’s a measure that does capture that. It’s called location quotient, and is used in economic analysis to measure the concentration of industries in certain locations.

    An economist told me once that he likes to look at this for all sorts of things, not just industry clusters. The formula works for other stuff. I really haven’t seen this used before, so caveat emptor, but here’s a look at shifts in location quotient for metro areas over the course of the decade:


    Metro area change in location quotient for college degree attainment, 2000-2010. Increase in LQ in blue, decrease in red.

    The blue metro areas had a higher concentration of college degrees relative to the nation as a whole in 2010 than they did in 2000. The red ones a lower concentration. This is certainly an interesting area for further exploration.

    While I’m on the topic, here’s the same chart, only limited to graduate and professional degrees. There’s some interesting variability here.


    Metro area change in location quotient for graduate and professional degree attainment, 2000-2010. Increase in LQ in blue, decrease in red.

    A Closer Look at Indianapolis

    Just as one more granular example, I wanted to take a look at the Indianapolis vertical. Here’s 2010 college degree attainment for the city, metro, state, and America as a whole:


    College degree attainment, 2010

    As we know, urban regions tend to be more highly educated. Here we see that while Indiana is one of the lowest states in terms of college degree attainment, the Indy metro area actually beats the US average. However, the city of Indianapolis falls short of the US average. Because Indy is a consolidated city-county government that includes a lot of inner ring suburban areas, it’s hard to draw conclusions about the true urban core, but it does seem clear that the center is less educated than the periphery of the metro.

    Now lets look at the change in attainment for the decade:


    Change in the percentage of adults with a college degree, 2000-2010.

    Here we see that the rich get richer, as Indy metro not only started out on a higher base, but had the best showing in attainment growth as well. OTOH, going back to our LQ measure, Indiana actually boosted its LQ while the Indy region was stagnant. That’s because this is a percentage point change, not a percentage change, and growing from a low base makes it easier to boost LQ. It’s one of the quirks of that formula.

    The poor showing of the city of Indianapolis is something that should definitely be worrying. It would be interesting to do a similar analysis for other metros, but alas that’s all for today.

    Aaron M. Renn is an independent writer on urban affairs based in the Midwest. His writings appear at The Urbanophile, where this piece originally appeared. Telestrian was used to analyze data and to create charts for this piece.

  • Gassing Up: Why America’s Future Job Growth Lies In Traditional Energy Industries

    In his new book, The Coming Jobs War, Gallup CEO James Clifton defines what he calls an “all-out global war for good jobs.” Clifton envisions a world-wide struggle for new, steady employment, with the looming threat of “suffering, instability, chaos and eventually revolution” for those who fail to secure new economic opportunities.

    In the U.S., this conflict can be seen as a kind of new war battle the states, each fighting not only for employment but for jobs that pay enough to support a middle-class lifestyle.

    My colleagues at Praxis Strategy Group and I have looked over data for the period after the economy started to weaken in 2006. Using stats from EMSI, based on data from the Bureau of Labor Statistics, we compared sectors by growth, and then by average salary.

    Not surprisingly “recession-proof” fields such as health care and education expanded some 11% over the past five years. More inexplicably, given its role in detonating the Great Recession, the financial sector expanded some 10%.

    But the biggest growth by far has taken place in the mining, oil and natural gas industries, where jobs expanded by 60%, creating a total of 500,000 new jobs. While that number is not as large as those generated by health care or education, the quality of these jobs are far higher. The average job in conventional energy pays about $100,000 annually — about $20,000 more than finance or professional services pay. The wages are more than twice as high as those in either health or education.

    Nor is this expansion showing signs of slowing down. Contrary to expectations pushed by “peak oil” enthusiasts, overall U.S. oil production has grown by 10% since 2008; the import share of U.S. oil consumption has dropped to 47% from 60% in 2005.  Over the next year, according to one recent industry-funded study, oil and gas could create an additional 1.5 million new jobs.

    This, of course, violates the widespread notion that the future lies exclusively in the information and technology industries. While technology may well be ubiquitous, as a sector it is far from a reliable creator of high-wage jobs. Since 2006 the information sector has hemorrhaged over 330,000 jobs. And those who do have jobs make on average about $20,000 less than their oil-stained counterparts per year.

    How about those “green jobs” so widely touted as the way to recover the lost blue-collar positions from the recession? Since 2006, the critical waste management and remediation sector — a critical portion of the “green” economy — actually lost over 480,000 jobs, 4% of its total employment. Pay here is lower still, averaging something like $32,000 annually, about one-third that of the conventional energy sector.

    The future of the rest of the “green” sector seems dimmer than widely anticipated. One big problem lies in cost per kilowatt, where wind is roughly twice as expensive and solar at least three times as expensive as electricity produced with natural gas. Given the Solydra   bankruptcy  and their inevitable impact on the renewables industry, it’s also pretty certain that the U.S., at least in the near term, will not be powered by windmills and solar panels.

    So instead of tilting windmills or taking out the trash, what about joining the much ballyhooed “creative class”?  Not so great a bet for those limited in talent or nepotism. The arts, entertainment and recreation sector gained about half as many total jobs as energy, and the pay is nothing to write home about. The average salary for these creative souls is about $27,000, slightly higher than for food service workers, but barely a quarter of the average salary for the oil and gas-dominated sector.

    The relative strength of the energy sector can be seen in changes in income by region over the past decade. For the most part, the largest gains have been heavily concentrated in the energy belt between the Dakotas and the Gulf of Mexico. Energy-oriented metropolitan economies such as Houston, Dallas, Bismarck and Oklahoma City have also fared relatively well. In energy-rich North Dakota there’s actually a huge labor shortage, reaching over 17,000 — one likely to get worse if production expands, as now proposed, from 6000 to over 30,000 wells over the next decade.

    What message does this send to politicians seeking to turn around our moribund economy? Perhaps   they should target oil and gas development as a spur not only to new employment, but to the kind of “good jobs” that Gallup’s Clifton speaks about. With the proper environmental controls, these industries could provide a major jolt to the economy while cutting down on energy imports, reducing debts and bringing jobs back home. As long as Americans consume oil and gas, why not produce close to the market and with reasonable environmental controls?

    The monthly proliferation of new energy finds can provide a much brighter future than many have anticipated. Industry experts say that the shift in energy exploration is moving from the Middle East to the Americas, with rich deposits of oil and gas uncovered from Brazil to the Canadian oil sands.

    Much of the new action is on the U.S. mainland, including the Dakotas, Montana and Wyoming. Increasingly, there’s excitement about finds in long-challenged sections of the Midwest such as Ohio. The Utica shale formation, according to an estimate by Chesapeake Energy, could be worth roughly a half trillion dollars and be, in the words of CEO Aubrey McClendon, “the biggest to hit Ohio, since maybe the plow.”

    Ohio now has over 64,000 wells, with five hundred drilled just year. Recent and potential finds, particularly in the Appalachian basin, could transform the Buckeye State into something of a Midwest Abu Dhabi, creating more than 200,000 jobs over the next decade. The new finds could also help Ohio fund its depleted state coffers without imposing either debilitating budget cuts or economically self defeating new taxes.

    The energy boom also has sparked a spate of new factory expansions, including a $650 million new steel mill to make pipes for gas pipelines. Other local firms are gearing up to make up specialized equipment like compressors.

    Michigan, another perennially hard hit state, is also looking at new energy finds to turbocharge its gradually recovering industrial sector.  While risible former Gov. Jennifer Granholm pushed the notion that Michigan’s recovery lay in “cool cities” and green jobs, the state’s current leaders are focusing on more down-to-earth — and under-the-earth — solutions as part of a strategy to revive industrial production.

    Such growth anywhere is good news, particularly in Midwestern blue-collar towns that have borne the brunt of the recession. Since 2006 manufacturing and construction have shed some 5 million jobs combined — jobs that pay above-average wages, far better than those earned in growing fields such as health care, education or the lower-end service sector.

    The surest road to recovery does not lie in the chimera of “green jobs” or by magically harvesting riches from social networks. It’s in making America a more self-reliant and productive power. The new spate of energy in the Midwest and elsewhere in the country may be one way to do this, if we have the will to take full advantage.

    This piece originally appeared at Forbes.com.

    Joel Kotkin is executive editor of NewGeography.com and is a distinguished presidential fellow in urban futures at Chapman University, and an adjunct fellow of the Legatum Institute in London. He is author of The City: A Global History. His newest book is The Next Hundred Million: America in 2050, released in February, 2010.

    Analysis and charts by Mark Schill, Praxis Strategy Group.

    Photo by flickr user thorinside

  • The Next Boom Towns In The U.S.

    What cities are best positioned to grow and prosper in the coming decade?

    To determine the next boom towns in the U.S., with the help of Mark Schill at the Praxis Strategy Group, we took the 52 largest metro areas in the country (those with populations exceeding 1 million) and ranked them based on various data indicating past, present and future vitality.

    We started with job growth, not only looking at performance over the past decade but also focusing on growth in the past two years, to account for the possible long-term effects of the Great Recession. That accounted for roughly one-third of the score.  The other two-thirds were made up of a a broad range of demographic factors, all weighted equally. These included rates of family formation (percentage growth in children 5-17), growth in educated migration, population growth and, finally, a broad measurement of attractiveness to immigrants — as places to settle, make money and start businesses.

    We focused on these demographic factors because college-educated migrants (who also tend to be under 30), new families and immigrants will be critical in shaping the future.  Areas that are rapidly losing young families and low rates of migration among educated migrants are the American equivalents of rapidly aging countries like Japan; those with more sprightly demographics are akin to up and coming countries such as Vietnam.

    Many of our top performers are not surprising. No. 1 Austin, Texas, and No. 2 Raleigh, N.C., have it all demographically: high rates of immigration and migration of educated workers and healthy increases in population and number of children. They are also economic superstars, with job-creation records among the best in the nation.

    Perhaps less expected is the No. 3 ranking for Nashville, Tenn. The country music capital, with its low housing prices and pro-business environment, has experienced rapid growth in educated migrants, where it ranks an impressive fourth in terms of percentage growth. New ethnic groups, such as Latinos and Asians, have doubled in size over the past decade.

    Two advantages Nashville and other rising Southern cities like No. 8 Charlotte, N.C., possess are a mild climate and smaller scale. Even with population growth, they do not suffer the persistent transportation bottlenecks that strangle the older growth hubs. At the same time, these cities are building the infrastructure — roads, cultural institutions and airports — critical to future growth. Charlotte’s bustling airport may never be as big as Atlanta’s Hartsfield, but it serves both major national and international routes.

    Of course, Texas metropolitan areas feature prominently on our list of future boom towns, including No. 4 San Antonio, No. 5 Houston and No. 7 Dallas, which over the past years boasted the biggest jump in new jobs, over 83,000. Aided by relatively low housing prices and buoyant economies, these Lone Star cities have become major hubs for jobs and families.

    And there’s more growth to come. With its strategically located airport, Dallas is emerging as the ideal place for corporate relocations. And Houston, with its burgeoning port and dominance of the world energy business, seems destined to become ever more influential in the coming decade. Both cities have emerged as major immigrant hubs, attracting on newcomers at a rate far higher than old immigrant hubs like Chicago, Boston and Seattle.

    The three other regions in our top 10 represent radically different kinds of places. The Washington, D.C., area (No. 6) sprawls from the District of Columbia through parts of Virginia, Maryland and West Virginia. Its great competitive advantage lies in proximity to the federal government, which has helped it enjoy an almost shockingly   ”good recession,” with continuing job growth, including in high-wage science- and technology-related fields, and an improving real estate market.

    Our other two top ten, No. 9 Phoenix, Ariz., and No. 10 Orlando, Fla., have not done well in the recession, but both still have more jobs now than in 2000. Their demographics remain surprisingly robust. Despite some anti-immigrant agitation by local politicians, immigrants still seem to be flocking to both of these states. Known better s as retirement havens, their ranks of children and families have surged over the past decade. Warm weather, pro-business environments and, most critically, a large supply of affordable housing should allow these regions to grow, if not in the overheated fashion of the past, at rates both steadier and more sustainable.

    Sadly, several of the nation’s premier economic regions sit toward the bottom of the list, notably former boom town Los Angeles (No. 47). Los Angeles’ once huge and vibrant industrial sector has shrunk rapidly, in large part the consequence of ever-tightening regulatory burdens. Its once magnetic appeal to educated migrants faded and families are fleeing from persistently high housing prices, poor educational choices and weak employment opportunities. Los Angeles lost over 180,000 children 5 to 17, the largest such drop in the nation.

    Many of L.A.’s traditional rivals — such as Chicago (with which is tied at No. 47), New York City (No. 35) and San Francisco (No. 42) — also did poorly on our prospective list.  To be sure,  they will continue to reap the benefits of existing resources — financial institutions, universities and the presence of leading companies — but their future prospects will be limited by their generally sluggish job creation and aging demographics.

    Of course, even the most exhaustive research cannot fully predict the future. A significant downsizing of the federal government, for example, would slow the D.C. region’s growth. A big fall in energy prices, or tough restrictions of carbon emissions, could hit the Texas cities, particularly Houston, hard. If housing prices stabilize in the Northeast or West Coast, less people will flock to places like Phoenix, Orlando or even Indianapolis (No.11) , Salt Lake City (No. 12) and Columbus (No. 13). One or more of our now lower ranked locales, like Los Angeles, San Francisco and New York, might also decide to reform in order to become more attractive to small businesses and middle class families.

    What is clear is that well-established patterns of job creation and vital demographics will drive future regional growth, not only in the next year, but over the coming decade.  People create economies and they tend to vote with their feet when they choose to locate their families as well as their businesses.  This will prove   more decisive in shaping future growth   than the hip imagery and big city-oriented PR flackery that dominate media coverage of America’s changing regions.

    Cities of the Future Rankings
    Rank Metropolitan Area
    1 Austin, TX
    2 Raleigh, NC
    3 Nashville, TN
    4 San Antonio, TX
    5 Houston, TX
    6 Washington, DC-VA-MD-WV
    7 Dallas-Fort Worth, TX
    8 Charlotte, NC-SC
    8 Phoenix, AZ
    10 Orlando, FL
    11 Indianapolis, IN
    12 Salt Lake City, UT
    13 Columbus, OH
    14 Jacksonville, FL
    15 Atlanta, GA
    16 Las Vegas, NV
    16 Riverside, CA
    18 Portland, OR-WA
    19 Denver, CO
    20 Oklahoma City, OK
    21 Baltimore, MD
    22 Louisville, KY-IN
    22 Richmond, VA
    24 Seattle, WA
    25 Kansas City, MO-KS
    26 San Diego, CA
    27 Miami, FL
    28 Tampa, FL
    29 Sacramento, CA
    30 Birmingham, AL
    31 New Orleans, LA
    32 Philadelphia, PA-NJ-DE-MD
    33 Minneapolis, MN-WI
    34 St. Louis, MO-IL
    35 Cincinnati, OH-KY-IN
    35 New York, NY-NJ-PA
    37 Boston, MA-NH
    38 Memphis, TN-MS-AR
    39 Pittsburgh, PA
    40 Virginia Beach, VA-NC
    41 Rochester, NY
    42 Buffalo, NY
    42 San Francisco, CA
    44 Hartford, CT
    45 Milwaukee, WI
    45 San Jose, CA
    47 Chicago, IL-IN-WI
    47 Los Angeles, CA
    49 Providence, RI-MA
    50 Detroit, MI
    51 Cleveland, OH

    This piece originally appeared at Forbes.com.

    Joel Kotkin is executive editor of NewGeography.com and is a distinguished presidential fellow in urban futures at Chapman University, and an adjunct fellow of the Legatum Institute in London. He is author of The City: A Global History. His newest book is The Next Hundred Million: America in 2050, released in February, 2010.

    Photo by Exothermic Photography

  • Drones on the Prairie

    When the Base Realignment and Closure Commission was drawing up its list of military installations to close back in 2005, consultants assured the city of Grand Forks, North Dakota, that its Air Force base would be spared. Days before the list was made public, though, word leaked out that Grand Forks was on the chopping block, after all.

    North Dakota’s Congressional delegation swung into action and managed to win the base a reprieve; its KC-135 Stratotankers would be reassigned, but they would be replaced by unmanned aerial vehicles (UAVs). Earlier this month, in a ceremony that drew local dignitaries, industry executives, and military brass, Grand Forks Air Force Base marked the arrival of its first Global Hawk aircraft.

    Gunmetal gray, with long, white wings stretching out from the fuselage, the Global Hawk can stay aloft for 30 hours at a time, transmitting sensor data back to operators on the ground. The plane, manufactured by aerospace giant Northrop Grumman, has become a staple of the Air Force’s intelligence, surveillance, and reconnaissance efforts in Iraq and Afghanistan. Eleven Global Hawks will eventually be stationed at Grand Forks, along with 450 additional base personnel.

    “The base is our second largest economic engine,” said Eric Icard, senior business development officer at the Grand Forks Region Economic Development Corporation. “To have a new mission with a new technology solidifies the Air Force’s commitment to the Grand Forks region.”

    Sgt. Joseph Kapinos couched the plane’s arrival in more personal terms: “I think people are excited, because they feel like we have a mission again.”

    Grand Forks AFB

    Col. Don Shaffer, Commander of the 319th Air Base Wing at Grand Forks Air Force Base, told a crowd of dignitaries that the arrival of the Global Hawk marked a transition for the base to a "global vigilance mission." Photo by Marcel LaFlamme

    The ceremony came on the eve of the fifth Unmanned Aircraft Systems Action Summit in Grand Forks, which was sponsored by the Red River Valley Research Corridor. With military procurement of unmanned aircraft projected to double over the next decade, North Dakota has worked to position itself as one of the nation’s hubs for UAV research and training. Last month, the University of North Dakota (UND) awarded degrees to the first five graduates of its unmanned aircraft operations program. At the Summit, Northrop Grumman presented Minnesota’s Northland Community and Technical College with a full-scale model of a Global Hawk for use in its UAV maintenance and repair shop.

    It’s too soon to say whether the Upper Great Plains will emerge as a new powerhouse of the military-industrial complex, a new buckle on what regional planners have dubbed the Gunbelt. Participants at the Summit said that the real economic boom would come as UAV technologies begin to find commercial applications. One major impediment is the ban on flying UAVs in the National Airspace System; North Dakota Congressman Rick Berg has pushed for the creation of test sites where UAVs could fly (and it’s no secret that North Dakota is angling to be one of them), but the FAA reauthorization bill that would make that possible is currently mired in conference committee.

    North Dakota has been riding a wave of media adoration as of late, buoyed by low unemployment numbers and a massive oil strike. But 42 of its 53 counties still posted population losses in the 2010 Census.

    How, the question remains, do rural communities stand to benefit from the burgeoning UAV industry? Are all of these "knowledge economy" jobs bound to spring up in Grand Forks
    and Fargo, even as the state’s struggling farm communities continue to wither away?

    Not if Carol Goodman has anything to say about it. Goodman heads the Job Development Authority in Cavalier County, up by the Canadian border; the county lost 17% of its population between 2000 and 2010, dipping below 4,000 people for the first time in over a century. She’s working to redevelop an abandoned missile base from the Cold War era as a UAV testing site, which could create as many as 670 jobs in the county.

    “Tell them to send some of those UAVs over here,” said Bob Wilhelmi, owner of the lone bar in the wind-blown town of Nekoma. A man from neighboring Walsh County said that, the year after next, his school district will not have a single child enrolled in kindergarten. 

    Mickelsen Safeguard Complex

    The Stanley R. Mickelsen Safeguard Complex: once an antiballistic missile site with its eyes on Moscow, now a potential test bed for unmanned aircraft. Photo by Marcel LaFlamme

    The unmanned aircraft industry in North Dakota is a sort of test case for what happens when a traditionally agrarian state decides to pursue high-tech growth. It’s still not clear whether the state will succeed. But to watch those airmen jostle for a picture with their base’s newest piece of hardware, or to hear a recent UND graduate pitch the start-up company that will keep him in Grand Forks, or even to look up for a while at the clear, empty Dakota sky, you start to think that the state’s drone charmers may just have a shot.

    This piece originally appeared at Daily Yonder.

    Marcel LaFlamme is a graduate student of the Department of Anthropology at Rice University in Houston.

    Lead photo: Official U.S. Air Force

  • The Rise Of The Third Coast: The Gulf Region’s Ascendancy In U.S.

    For most of the nation’s history, the Atlantic region — primarily New York City — has dominated the nation’s trade. In the last few decades of the 20th Century, the Pacific, led by Los Angeles and Long Beach, gained prominence. Now we may be about to see the ascendancy of a third coast: the Gulf, led primarily by Houston but including New Orleans and a host of smaller ports across the regions.

    The 600,000 square mile Gulf region has long been derided for its humid climate, conservative political traditions and vulnerability to natural disasters. Yet despite these factors, the Gulf is destined to emerge as the most economically vibrant of our three coasts. In our rankings of the fastest-growing job markets in the country, six Gulf cities made the top 50: Houston, Corpus Christi and Brownsville, in Texas; New Orleans; and Gulfport-Biloxi and Pascagoula, in Mississippi. In contrast, just one Pacific port, Anchorage, Alaska, and one small Atlantic port, Portsmouth, N.H., made the cut.

    This reflects a long-term shift of money, power and jobs away from both the North Atlantic and the Pacific to the cities of the Gulf. The Port of Houston, for example, enjoyed a 28.1% jump in foreign trade this year, and trade at Louisiana’s main ports also reached records levels.

    This growth stems from a host of factors ranging from politics, demographics and energy to emerging trade patterns and new technologies. One potential game-changer is the scheduled 2014 $5.25 billion widening of the Panama Canal, which will allow the passage to accommodate ships carrying twice as much cargo as they are able to carry currently. This will open the Gulf to megaships from Pacific Basin ports such as Singapore, Shanghai, Pusan and Kaohsiung, which have mostly sent their cargos to West Coast ports such as Los Angeles and Long Beach. Some analysts predict that more than 25% of this traffic could shift to Gulf and South Atlantic ports. “More of Asia will be heading to this part of the world,” says Jimmy Lyons, CEO of the Alabama State Port Authority.

    The area also is getting a big jolt from ascendant Latin America, the Gulf’s historic leading trade partner. Bill Gilmer, an economist with the Federal Reserve Bank of Dallas, notes that Latin America is home to many of the world’s fastest-growing economies, with overall growth rates last year exceeding 6.1%. Since 2002 about 56 million people in the region have risen out of poverty, according to the World Bank.

    Trade with Latin American partners — including Mexico — is ramping up growth in Houston as well as other Gulf ports. Brazil, for instance, has risen to become Mobile, Ala.’s leading trade partner.  Latin immigration to virtually all the Gulf cities, including New Orleans, can only strengthen these economic ties.

    The energy industry represents another critical force in the Gulf’s resurgence. It employs at least 55,000 workers in the Gulf, which produces roughly one-quarter of the nation’s natural gas and one-eighth of its oil. Although Houston seems assured of its spot as the focal point of the world fossil fuel industry, oil and gas also boosts numerous economies throughout the region, notably in Corpus Christi and various ports across Southern Louisiana.

    Though the Obama administration puts its bets on subsidizing “green jobs,” traditional energy jobs may prove, in the short and medium term, far more important.  There is even widespread talk about the Gulf emerging as a center for the export of natural gas. Over $ 6 billion in new investments are already being proposed for export facilities, notes David Dismukes, associate director of the Louisiana State University Center for Energy Studies.

    The energy-related economy produces high-wage jobs that range from geology and engineering to the muscle work on the oil rigs, which provide well above average wages for blue collar workers. Such growth is particularly critical to regions such as New Orleans, long dependent on generally lower-wage industries like hospitality and personal services. The energy business also will help accelerate the expansion of business services such as law, accounting, architecture and advertising.

    The shift to the Gulf includes some rapid industrial expansion, particularly for energy intensive industries. Huge natural gas supplies are creating enormous opportunities for expanding petrochemical industries. The German firm Thyssen Krupp opened a new $5 billion steel mill last year, and Nucor Steel announced a large new facility to be built just outside New Orleans. Like energy production, these facilities tend to pay above-average wages for blue collar workers, which will likely raise living standards for a region that has lagged historically.

    At the same time, demographic trends suggest these areas will continue to become more attractive to international commerce. Despite a legacy of hurricanes and floods, Houston, with over 5 million people, has emerged as among the fastest-growing large metropolitan regions in the country. The region’s population is expected to double in the next 20 years. Most of the economies its port serves — Dallas-Fort Worth, San Antonio and Austin — also have experienced rapid growth. Recoveries are in place in many other hurricane-devastated areas, including greater New Orleans.

    Overall the Gulf is expected to be home to 61.4 million people by 2025, a nearly 50% increase from its 1995 base. This expanding domestic market — along with the possibilities posed by the canal — have already persuaded two larger retailers, Wal-Mart and Home Depot, to establish modern new distribution centers in Houston.

    Finally there is the matter of political will. Both the Northeast and the Pacific regions are increasingly dominated by environmental, labor, urban land and other interests often hostile to wide-ranging industrial expansion.  A legacy of labor unrest, most notably a big strike of West Coast ports in 2002,   convinced some shippers to diversify their operations elsewhere.   Growing regulation in California, suggests economist John Husing, a leading expert on port-related issues, makes the prospects for growing warehouse, logistics and manufacturing jobs increasingly “impossible”  there.

    East Coast ports, subject to some of the same pressures, may be slow to make the “intense capital improvements” required to capture expanding trade. In contrast, the Gulf’s leaders in both parties support   broad based economic growth.  New Orleans’ Democratic Mayor Mitch Landrieu is no less friendly to industrial and port expansion  than Republican Gov. Bobby Jindal. Houston Democratic mayors like Annise Parker, Bill White and Bob Lanier have been as strongly in favor of critical business and infrastructure investment as their Republican counterparts.

    Such differences in attitude have driven power shifts   throughout American economic history. In the 19th century New York through a combination of ruthless ambition and greater vision  overcame aristocratic Boston and more established Philadelphia. Icy Chicago performed a similar coup over its then far more established and temperate rival, St. Louis, in the mid- and late 1800s.

    In the last century, unfashionable Los Angeles, without a great natural port, overcame the grand Pacific dowager San Francisco, blessed by one of the world’s great natural harbors, as the economic center of the West Coast. Los Angeles built a vast new modern and largely artificial port to make up for what nature failed to provide, and also nurtured a host of   industries from aerospace, oil and entertainment to garments.

    Now history is about to repeat itself as Texas, Louisiana and other Gulf Cities seek to reorder the nation’s economic balance of power.  Unless California and the Northeast awaken to the challenge, they will be increasingly supplanted by a region that seems more determined to expand their economic dominion.

    This piece originally appeared at Forbes.com.

    Joel Kotkin is executive editor of NewGeography.com and is a distinguished presidential fellow in urban futures at Chapman University, and an adjunct fellow of the Legatum Institute in London. He is author of The City: A Global History. His newest book is The Next Hundred Million: America in 2050, released in February, 2010.

    Photo by NASA Goddard Photo and Video