This video from Center for Opportunity Urbanism (COU) explores America’s housing crisis — focusing on the new generation. COU is a non-profit dedicated to preserving the American dream and promoting upward mobility for all Americans. Check out the video and let us know what you think.
Tag: housing market
-
LSE/Netherlands Research Documents Price Effects of Tight Housing Regulation
New research by London school of economics Professor Christian Hilber and Wouter Vermeulen of the Netherlands Bureau for Economic Policy Analysis provides strength and evidence of the connection between high housing prices and strong regulatory constraints. The paper advances the science by estimating the share of house price increases attributable to regulatory constraints. Hilbur and Vermeulen show that supply constraints are considerably more important in driving up house prices than the physical constraints (such as lack of land or topography) and lending conditions or interest rates:
"In a nutshell, in our paper we use this unique data to test our prediction that house prices respond more strongly to changes in local demand in places with tight supply constraints. In doing so, we carefully disentangle the causal effect of regulatory constraints from the effects of physical constraints (degree of development and topography) on local house prices, holding other local factors constant and accounting for macroeconomic fluctuations induced, for example, by changing lending conditions or interest rates."
Their conclusions are based on analysis of housing markets in the United Kingdom since 1979. Unlike the United States, Canada, Australia or New Zealand, the United Kingdom was fully engulfed by urban containment regulatory policy by that time.
Perhaps the most important advance of the research was the author’s quantification of developable land. This is a relatively new direction in research, with perhaps the most important early contribution from Alberto Saiz of Harvard University, whose estimates relied on the assumption of a 50 mile radius of land from the cores of US metropolitan areas. My response doubted the usefulness of measuring housing markets with a fixed radius, not least because since some metropolitan areas (and even built-up urban areas) extend beyond that distance. Hilbur and Vermuelen avoid this problem by estimating developed land by local authority area, which allows for analysis at the housing market level (which is usually larger than the local authority area).
The authors also note recent research on the consequences of land use regulation to economic growth and stability. These include Hseih and Moretti, who found that without tight housing regulation, the gross product in the median city might be nearly 10 percent higher, and Glaeser et al research showing the greater volatility of prices in a tightly regulated environment.
The authors summarize the problem:
"Absent regulation, house prices would be lower by over a third and considerably less volatile. Young households are the obvious losers, yet macroeconomic stability is also impaired and productivity may suffer from constrained labour supply to the thriving cities where demand is highest."
This is important research in a world struggling to restart healthy economic growth and reverse the decline of the middle-income standard of living.
-
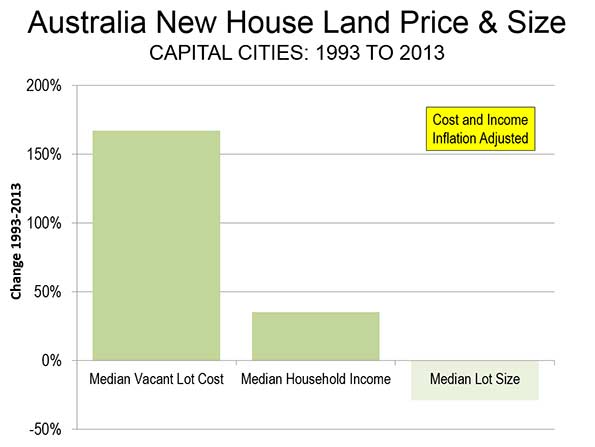
Urban Containment: Land Price Up 5 Times Income & Smaller
The shocking extent to which urban containment policy (urban consolidation policy) is associated with higher land (and house) prices is illustrated by a recent press release from RP Data in Australia. The analysis examined the vacant building lot prices for the period of 1993 to 2013.
During the period, the median price of a vacant lot rose 168 percent after adjustment for inflation. This is nearly 5 times the increase in the median household incomes of the seven largest capital cities (Sydney, Melbourne, Brisbane, Perth, Adelaide, Canberra and Sydney).
But it gets worse. The median lot size was reduced nearly 30 percent. This should put paid to the myth that urban containment reduces lot prices as it reduces their sizes (Figure). The same dynamic has been indicated in the United States.
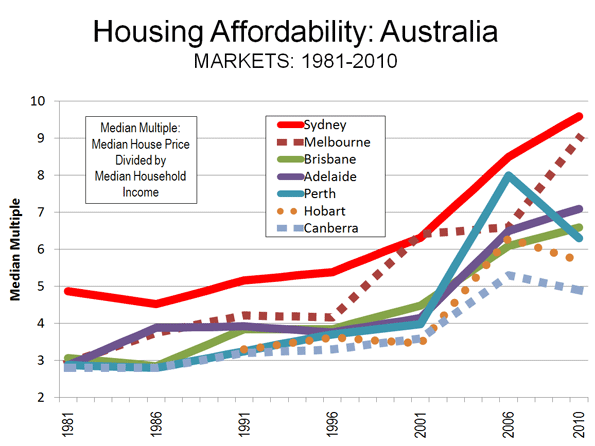
Australia has been plagued by huge house cost increases relative to incomes in association with urban containment policy. Before the adoption of urban containment policy, it was typical for house prices to average three times or less than that of household income. Now, Sydney has the highest median multiple (median house price divided by median household income) of any major metropolitan area in the New World, with the exceptions of Vancouver and San Francisco. Melbourne, the second largest metropolitan area in Australia, has a median multiple of 8.4, making it fifth most costly in the New World, behind San Jose. All of Australia’s major metropolitan areas "severely unaffordable," including slow-growing Adelaide (6.3), as well as most smaller areas.
For a complete listing of median multiples by major metropolitan area, see the 10th Annual Demographia International Housing Affordability Survey.
Additional information on the RP Data research is available at Australian Property Through Foreign Eyes
-
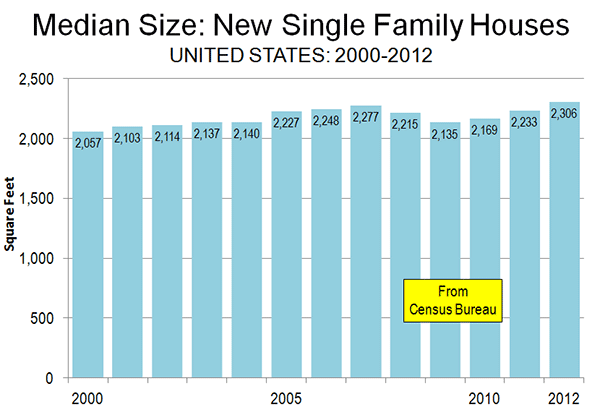
US Sets New House Size Record in 2012
There have been numerous press reports about the expansion of micro housing, and expectations that Americans will be reducing the size of their houses. As the nation trepidatiously seeks to emerge from the deepest economic decline since the 1930s, normalcy seems to be returning to US house sizes.
According to the latest new single-family house size data from the US Census Bureau, the median house size rose to an all-time record of 2306 square feet in 2012. This is slightly above the 2277 square feet median that was reached at the height of the housing bubble in 2007 (Figure). The average new house size (2,505 square feet) remains slightly below the 2007 peak of 2,521 square feet.
There was little coverage in the media, with the notable exception of Atlantic Cities, in which Emily Badger repeated the expectation of many:
“It appeared after the housing crash that the American appetite for ever-larger homes was finally waning. And this would seem a logical lesson learned from a recession when hundreds of thousands of households found themselves stuck in cavernous houses they neither needed nor could afford.”
But she concluded “Perhaps we have not changed our minds after all.” Well stated.
-
Canada’s Central Bank Issues Warning on Toronto Condominium Market
For a few years, concern has been expressed about house price increases in Canada, which have been disproportionate compared to household incomes.
In this regard, the latest, semi-annual Bank of Canada Financial System Review points to the overbuilt multi-unit market, especially the Toronto condominium market, as having the potential to inflict serious harm on the economy (see A Toronto Condo Bubble?), including “reduced household net worth.” In its report, Canada’s central bank said:
“…the total number of housing units under construction remains significantly above its historical average relative to the population. This development is almost entirely attributable to multiple-unit dwellings (which include condominium units). In the Toronto condominium market, the number of unsold high-rise units in the pre-construction and under-construction stages has remained near the high levels observed since early 2012. If the investor component of demand has boosted construction in the condominium market beyond demographic requirements, this market may be more susceptible to shifts in buyer sentiment. Furthermore, if the upcoming supply of units is not absorbed by demand as they are completed over the next 12 to 30 months, the supply-demand discrepancy would become more apparent, increasing the risk of an abrupt correction in prices and residential construction activity.
Any correction in condominium prices could spread to other segments of the housing market as buyers and sellers adjust their expectations. Such a correction would reduce household net worth, confidence and consumption spending, with negative spillovers to income and employment. These adverse effects would weaken the credit quality of banks’ loan portfolios and could lead to tighter lending conditions for households and businesses. This chain of events could then feed back into the housing market, causing the drop in house prices to overshoot.”
(Emphasis by author)
Canadian analysts have long been concerned about the potential for its rising house prices to collapse, as occurred in the overheated US markets. Just as the housing bust in California, Florida, Arizona and Nevada threw the US economy and that of the world into the worst economic decline since the Great Depression, a housing price bust could inflict serious damage to the Canadian economy, which has performed strongly in recent years.
In the United States, the housing bust led to a nearly 20 percent reduction in household net worth, while recent reports show that the loss has been recovered. However, this recovery has been anything but equal. Many households who suffered losses, such as in investments intended to finance retirement, have not seen their wealth restored.
There is plenty about housing market distortion for Canada to be concerned about.
-
Single Family Houses Sales Up, Builders Register Confidence
A continuing increase in new single-family house sales has fueled the substantial increase in the NAHB/Wells Fargo Housing Market Index (HMI) to 46 in November. This indicates that nearly one half of surveyed home builders are positive about future sales of single family houses. This is a strong increase from the HMI of 41 in October. The HMI had reached its low point in the midst of the housing bus in January 2009 at 8 and is now higher than at any point in more than six years.
NAHB reported that national single-family house sales in September were nearly 30% above the September 2011 rate, though remained approximately one-half the 2007 rate.
The National Association of Realtors also reported that single family houses continued to dominate existing house sales, garnering approximately 88% of sales in October.
The strengthening of the single-family housing market Is to be expected as the economy improves. These developments are further indication that the claimed change in housing preferences from single-family to multifamily is not occurring. In a related development, the latest available data indicates a preference in California for single-family housing on conventional sized lots, which is described in A Housing Preference Sea Change: Not in California.
-
Things Aren’t that Bad in Saginaw
Our 8th Annual Demographia International Housing Affordability Survey included the Saginaw, Michigan metropolitan area, which we noted had the lowest Median Multiple (median house price divided by median household income) among the included 325 metropolitan areas. This made Saginaw the most affordable metropolitan market, principally due to depressed economic conditions. Saginaw has been ravaged by the loss of manufacturing jobs and a generally declining economy because of its strong industrial ties to the Detroit metropolitan area.
D. Robertson of Freeman’s Bay (Auckland, New Zealand) must think that things are much worse, as indicated by a letter to the editor in the New Zealand Herald on January 24 (The Herald does not post letters to the editor on its internet site). Robertson says that including and prominently reporting the result of Saginaw Michigan (population 297 in 120-odd dwellings) was inappropriate. Robertson makes a 99.9% error, having apparently confused Saginaw, Missouri (population 297) with Saginaw, Michigan. According to the 2010 US Census, the Saginaw metropolitan area has a population of 200,169. That would be substantial enough to qualify Saginaw as one of New Zealand’s largest metropolitan areas if it were there.
-
Why Housing is So Expensive in Metropolitan Washington
Anyone familiar with housing affordability in the Washington (DC-VA-MD-WV) metropolitan area is aware that prices have risen strongly relative to incomes in the last decade.
However, a recent Washington Post commentary by Roger K. Lewis both exaggerates the contribution of higher construction costs and misses the principal factor that has driven up the price of housing: more restrictive land-use regulations.
Lewis compares construction costs in the early 1970s to current costs and finds that they are approximately 6 times as high. However, when the R. S. Means construction cost index for locations in the metropolitan area are adjusted for inflation, the increase is more like 15% (1970 to 2007).
Lewis also indicates that construction costs have risen faster than the "relatively flat income curve." In contrast, Census Bureau data indicate that median household incomes in the Washington metropolitan area have increased more than 30% since the early 1970s, after adjustment for inflation. House construction costs are the flatter of the two, not incomes.
While Lewis’ focus is affordable housing, costs in this low income sector are impacted by many of the same factors that drive overall housing affordability (overall house prices relative to incomes).
Lewis does not consider the huge cost increase in the non-construction costs of housing. In the Washington metropolitan area, we have estimated that the land and the regulatory costs for a new house have been driven to more than 5.5 times the level that would be expected in a normal regulatory environment (see the Demographia Residential Land & Regulation Cost Index). The problem is that the restrictive land-use policies, such as the Montgomery County agricultural reserve, similar regulations in other metropolitan area counties and the large lot building restrictions in Loudoun County have driven the price of land up substantially, and with it, the price of housing. We estimate that more restrictive land use regulations have driven the price of a new house up approximately $75,000.
Not surprisingly, Washington’s Median Multiple (median house price divided by median household income) remains more than a third above the 3.0 historic norm, at 4.0, even after the burst of the housing bubble. So long as governments in the Washington, DC area continue to strictly ration land for development, higher than necessary costs will continue to plague both housing affordability and affordable housing.
-
How Phoenix Housing Boomed and Busted
When analysing the US housing bubble, four states stand-out for the way in which home values rose into the stratosphere before crashing and burning: California, Nevada, Florida and Arizona (see below chart).

Since I covered three markets were covered in previous posts at Macrobusiness (see above links), I now want to analyse the Arizona housing market – with particular emphasis on its largest city, Phoenix – to determine why prices bubbled and then burst in such a violent manner.
In the lead-up to the crash, Phoenix’s economy was booming. New jobs were being added at a fast pace and per capita incomes were growing strongly:


With confidence riding high on the back of seemingly solid fundamentals and rising asset prices, along with easy access to credit, Arizona households borrowed heavily. Per capita debt accumulation surged in the mid-2000s to levels far in excess of the national average:


But Phoenix was living on borrowed time. With the national economy turning south in the wake of the sub-prime crisis and the collapse of Lehman Brothers, Phoenix home prices, which had already been falling gradually, began to slide fast. After home prices peaked in May 2006, it took another 18 months before Phoenix’s unemployment rate began rising:

The rest is history. Home prices continued falling, unemployment kept rising, and nominal per capita incomes fell for the first time in at least 40 years.And the pain is widespread, with around one in seven mortgages 90 days in arrears – well in excess of the national average:

So what went wrong? Could anything have been done differently to prevent the housing bubble/bust?
Certainly, if credit was less readily available, households would have been constrained in their ability to bid-up prices. But easy credit was only part of the problem. Another key driver of the rampant price escalation and then collapse was the way in which land was supplied for housing.
Throughout the 2000s, Arizona was one of the fastest growing metropolitan area in the United States with more than 1,000,000 population (see below chart).

However, despite there being ample developable land on the urban fringe to accomodate this population growth, the actual quantity of land available for development was heavily restricted on two counts:
- The State of Arizona passed statewide planning laws in 1998 and 2000, which included the implementation of high impact fees on new development and urban containment devices. In a 2006 study of land-use policies in the 50 largest metropolitan areas of the US, the Brookings Institution ranked Phoenix as ‘growth management’, which is the same ranking as Florida and California.
- The overwhelming majority of potential developable land in Arizona is either owned by the state and federal governments, preserved for conservation, or otherwise off-limits to development.
On the second point – the lack of available land for development – the below graphics highlight the land supply situation in Phoenix.
First, a pie diagram, extracted from the Arizona State Land Department Annual Report, showing how only 17.5% of land in Arizona is privately owned:

Second, a map showing the lack of developable land around Phoenix:

There is evidence that the Arizona State Land Department, whose mission is to “optimize economic return for the Trust beneficiaries”, heavily restricted sales of land to the market in an effort to maximise revenues, causing builders and developers to bid-up land price in period auctions to ensure their supply of land for construction (called ‘land banking’).
Whereas the price of land for housing sold for around $40,000 per acre immediately prior to the bubble, at the peak average land prices fetched nearly $200,000 (see below chart).

And with the state rationing the supply of fringe land, average residential land prices rose throughout Arizona:

Obviously, this land price inflation was a principal cause of the house price escalation as well as the delayed supply response to the rapidly growing population and rising house prices (see below chart).

Had land around Phoenix been freely available for development, developers would likely not have paid such high prices for the land sold by the state government and Phoenix home prices would never have risen to such heights or crashed as violently.
Phoenix is yet another example of where excessive government interference in the supply of land has combined with easy credit to create a speculative bubble followed by a painful bust.
This piece originally appeared at Macrobusiness.
Leith van Onselen writes daily as the Unconventional Economist at MacroBusiness Australia. He has held positions at the Australian Treasury, Victorian Treasury and currently works at a leading financial services company. Follow him @leithVO.