Tag: Houston

  • The Cities That Are Benefiting The Most From The Economic Recovery

    It is painfully clear that the current U.S. economic recovery has been a meager one, with the benefits highly concentrated among the wealthiest. The notion that “a rising tide” lifts all boats has been sunk, along with the good ship middle class.

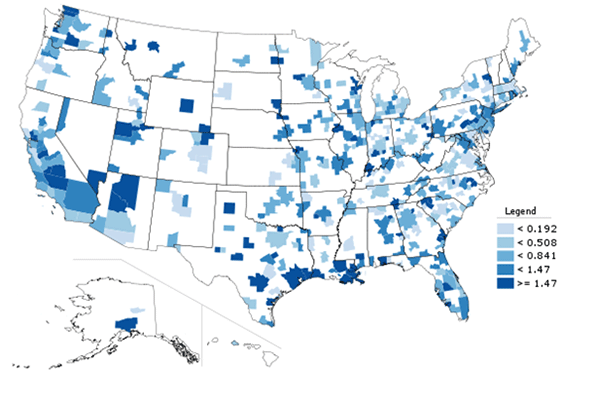
    Geographically as well, the recovery has been concentrated in a relative handful of regions. Nationwide, real per capita GDP rose a meager 3.8% from 2010 through 2013, according to new Bureau of Economic Analysis numbers. An analysis of the data by urban expert Aaron Renn shows that a handful of metropolitan areas have enjoyed much faster growth. For the most part, these are areas that have cashed in on the current technology or energy booms, and in some cases, both. Also, surprisingly, there have been some very good gains in some of the nation’s long-distressed industrial heartland metro areas, as the combination of energy development and a resurgent automobile industry have boosted regional GDP.

    Tech Capitals

    Of the nation’s 52 largest metropolitan statistical areas, many of the top performers have strong tech economies, led by the No. 2 metro area on our list, San Jose-Sunnyvale-Santa Clara, aka Silicon Valley, where real per capita GDP expanded 11.5% from 2010-13. Perhaps more surprising is the strong, tech-fuelled performance of No. 3 Portland-Vancouver-Hillsboro, Ore., where real per capita GDP grew 9.2%. The prime contributor has been the robust performance of late of Intel, the state’s largest private employer, which employs about 17,000 in Portland’s western suburbs around the town of Hillsboro, the company’s largest concentration of workers anywhere.

    Other less heralded tech centers have also performed well, including No. 4 Columbus, Ohio (8.2% growth), and No. 8 Salt Lake City (7.3%), both of which are also benefiting from the surge in oil and gas production. Among smaller cities with strong tech communities, Fargo, N.D., and Provo-Orem, Utah, have enjoyed better than 10% real per capita GDP growth since 2010.

    Energy Regions

    Per capita growth in the energy states has been even more impressive. Placing first on our big cities list is Houston-the Woodlands-Sugarland, Texas, where per capita GDP rose 13.2% from 2010-13, a major achievement in a region whose population continues to grow rapidly. Zooming out to all 381 U.S. MSAs, no places come close to the two Texas oil towns that rank first and second overall, Midland (sizzling 38.8% growth since 2010) and Odessa (34.1%). Both lie in the Permian basin, an oil-rich geological formation that was first tapped in the 1920s and has seen a marked revival in production recently due to advances in extraction techniques like horizontal drilling and fracking. Also notable, the southern Texas town of Victoria clocked over 21% growth.

    Among the largest metro areas, energy hubs also did well, including Oklahoma City (7th, 7.5%) and Dallas-Ft. Worth-Arlington (13th,  6.5%) and the San Antonio area (16th), which is benefiting from a gusher in the Eagle Ford Shale play. Economist estimate its development has pumped $87 billion into the south Texas economy.

    Rust Belt Revives

    The booms in tech and energy are well-known. But the most surprising wrinkle in our survey of per capita GDP growth is the revival of auto manufacturing, which benefits both from technological improvements and lower energy costs. Among the larger metro areas, the key winners have been Grand Rapids-Wyoming (fifth, 7.8%) and Detroit (tied for ninth, 7.2%), as well as the surprising 15th place ranking for Cleveland-Elyria.

    These gains are heartening, but the real question may be how long this will continue. In part, the strong 2010-13 numbers reflect a recovery from very poor economic performance that has stretched on for decades, and population losses, which tend to skew per capita GDP numbers upwards. But signs of health in the nation’s long disdained midsection deserve applause.

    Surprising Laggards

    The recovery has not lifted most regions, just as it has not helped most Americans. Per capita income growth has been slow in most of the nation’s largest cities outside Texas. Given the enormous financial bailout from the federal government, as well as the massive spike in stock and real estate prices, one would have expected far better performance from New York, which ranks a middling 33rd out of the 52 largest MSAs, with below average 2.3% growth since 2010.

    Chicago-Naperville-Elgin ranked 26th; Los Angeles-Long Beach-Anaheim, 38th, and  Philadelphia, 40th. Perhaps the biggest disappointment is 51st place Washington D.C.-Arlington-Alexandria, which had been a high-flier through the Recession amid strong federal spending. Per capita GDP since 2010 has fallen 3.4%. This disturbs some pundits, such as Richard Florida, but no doubt Washington’s fall from grace would be widely welcomed by most Americans.

    And What About Poverty

    Increasingly, many question not only the relative lack of growth, but that the growth we are experiencing is doing very little for the vast majority of Americans. Former Clinton adviser Bill Galston has noted that this recovery has “left almost everybody” out.

    No group has been harder hit than the poor. The nation’s population below the poverty line has expanded a full percent since 2010. An analysis by demographer Wendell Cox shows that poverty declined in just seven of the nation’s 52 largest metropolitan areas from 2010-13: Louisville, Ky.; Oklahoma City; Nashville, Tenn.; Columbus Ohio; Grand Rapids; and Texas’ Austin and San Antonio.

    Most of the areas with the strongest growth in per capita GDP posted smaller than average increases in poverty. In Houston the share of the population living in poverty rose 0.6% from 2010-13 to 16.4%, 11th highest among the nation’s biggest metro areas.

    The results in California suggest strongly that the tech boom has not done much to relieve poverty in the Golden State, despite the much ballyhooed “California comeback” trumpeted by the likes of Paul Krugman. In reality it’s poverty, not prosperity, that’s on the march in most California cities outside the Bay Area. Since 2010, the percentage of the population of San Diego living in poverty has grown 1.3% to 15.2%, while that of Riverside-San Bernardino rose 1.7% to 18.2%, the third highest rate among the 52 largest metro areas in the country. Meanwhile the poverty rate in Los Angeles, the state’s dominant urban region, has risen 1.8% to 17.6% (fifth worst), and Sacramento, the state capital, has seen a 2.0% increase in poverty to 16.6% (10th).

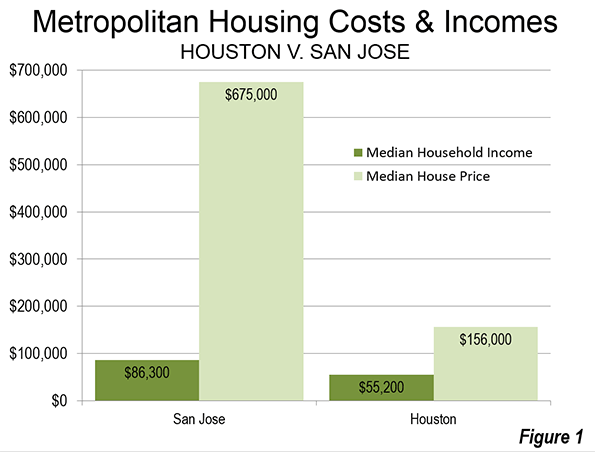
    This suggests that, for the most part, what has passed for growth has been too meager to reduce poverty. In many places, even ones growing rapidly, such as the Silicon Valley hub of San Jose, the number of poor continue to increase. Since 1999, poverty in the valley has jumped  from 7.6% to 10.5%. This also likely is a low figure, given the extraordinarily high cost of living in the Bay Area, as well as the rest of coastal California. According to the Census Bureau, California’s poverty rate is the highest in the nation when adjusted for the state’s exorbitant cost of housing.

    For the most part, poverty has been reduced, or at least has grown less, in lower-cost regions that have ties to the energy and manufacturing revival, which tend to create opportunities for middle- and working-class residents. Until we figure out how to get growth whose benefits are widely shared, and reduce poverty, the one measurement likely to go up is cynicism about the efficacy of our current economic policies.

    Real Metropolitan Area GDP Per Capita (2010-2013)
    Rank Metropolitan Area 2010 2013 2010-2013 Change
    1 Houston-The Woodlands-Sugar Land, TX  $  63,816  $    72,258 13.2%
    2 San Jose-Sunnyvale-Santa Clara, CA  $  89,806  $  100,115 11.5%
    3 Portland-Vancouver-Hillsboro, OR-WA  $  63,025  $    68,810 9.2%
    4 Columbus, OH  $  50,370  $    54,493 8.2%
    5 Grand Rapids-Wyoming, MI  $  41,248  $    44,482 7.8%
    6 Charlotte-Concord-Gastonia, NC-SC  $  51,819  $    55,802 7.7%
    7 Oklahoma City, OK  $  45,993  $    49,441 7.5%
    8 Salt Lake City, UT  $  57,790  $    62,008 7.3%
    9 Nashville-Davidson–Murfreesboro–Franklin, TN  $  50,464  $    54,112 7.2%
    10 Detroit-Warren-Dearborn, MI  $  46,314  $    49,653 7.2%
    11 Pittsburgh, PA  $  48,710  $    52,053 6.9%
    12 Cincinnati, OH-KY-IN  $  48,841  $    52,063 6.6%
    13 Dallas-Fort Worth-Arlington, TX  $  57,032  $    60,730 6.5%
    14 Birmingham-Hoover, AL  $  46,108  $    49,034 6.3%
    15 Cleveland-Elyria, OH  $  52,169  $    55,430 6.3%
    16 San Antonio-New Braunfels, TX  $  37,202  $    39,280 5.6%
    17 San Francisco-Oakland-Hayward, CA  $  75,103  $    78,844 5.0%
    18 Seattle-Tacoma-Bellevue, WA  $  71,404  $    74,701 4.6%
    19 Minneapolis-St. Paul-Bloomington, MN-WI  $  59,168  $    61,711 4.3%
    20 Sacramento–Roseville–Arden-Arcade, CA  $  43,905  $    45,764 4.2%
    21 Austin-Round Rock, TX  $  50,094  $    52,110 4.0%
    22 Denver-Aurora-Lakewood, CO  $  59,284  $    61,595 3.9%
    23 Phoenix-Mesa-Scottsdale, AZ  $  43,156  $    44,803 3.8%
    24 Boston-Cambridge-Newton, MA-NH  $  71,936  $    74,643 3.8%
    25 San Diego-Carlsbad, CA  $  55,921  $    57,955 3.6%
    26 Chicago-Naperville-Elgin, IL-IN-WI  $  55,727  $    57,752 3.6%
    27 Providence-Warwick, RI-MA  $  41,698  $    42,994 3.1%
    28 Louisville/Jefferson County, KY-IN  $  46,710  $    48,048 2.9%
    29 Tampa-St. Petersburg-Clearwater, FL  $  39,066  $    40,153 2.8%
    30 Buffalo-Cheektowaga-Niagara Falls, NY  $  41,497  $    42,550 2.5%
    31 Baltimore-Columbia-Towson, MD  $  55,907  $    57,294 2.5%
    32 Indianapolis-Carmel-Anderson, IN  $  58,590  $    60,038 2.5%
    33 New York-Newark-Jersey City, NY-NJ-PA  $  67,499  $    69,074 2.3%
    34 Riverside-San Bernardino-Ontario, CA  $  26,509  $    27,094 2.2%
    35 St. Louis, MO-IL  $  47,876  $    48,738 1.8%
    36 Milwaukee-Waukesha-West Allis, WI  $  55,767  $    56,734 1.7%
    37 Miami-Fort Lauderdale-West Palm Beach, FL  $  44,386  $    45,145 1.7%
    38 Los Angeles-Long Beach-Anaheim, CA  $  58,211  $    59,092 1.5%
    39 Kansas City, MO-KS  $  52,916  $    53,677 1.4%
    40 Philadelphia-Camden-Wilmington, PA-NJ-DE-MD  $  58,696  $    59,339 1.1%
    41 Memphis, TN-MS-AR  $  46,534  $    47,014 1.0%
    42 Richmond, VA  $  50,977  $    51,498 1.0%
    43 Rochester, NY  $  44,825  $    45,202 0.8%
    44 Atlanta-Sandy Springs-Roswell, GA  $  51,830  $    52,178 0.7%
    45 Virginia Beach-Norfolk-Newport News, VA-NC  $  48,395  $    48,708 0.6%
    46 Raleigh, NC  $  51,820  $    51,673 -0.3%
    47 Las Vegas-Henderson-Paradise, NV  $  43,351  $    43,079 -0.6%
    48 Jacksonville, FL  $  42,068  $    41,752 -0.8%
    49 Hartford-West Hartford-East Hartford, CT  $  68,005  $    66,870 -1.7%
    50 Orlando-Kissimmee-Sanford, FL  $  47,023  $    45,855 -2.5%
    51 Washington-Arlington-Alexandria, DC-VA-MD-WV  $  76,035  $    73,461 -3.4%
    52 New Orleans-Metairie, LA  $  61,325  $    56,943 -7.1%
    Analysis by Aaron M. Renn


    This piece first appeared at Forbes.

    Joel Kotkin is executive editor of NewGeography.com and Roger Hobbs Distinguished Fellow in Urban Studies at Chapman University, and a member of the editorial board of the Orange County Register. His newest book, The New Class Conflict is now available at Amazon and Telos Press. He is author of The City: A Global History and The Next Hundred Million: America in 2050. His most recent study, The Rise of Postfamilialism, has been widely discussed and distributed internationally. He lives in Los Angeles, CA.

    Photo by w:Flickr user Bill Jacobus [CC-BY-2.0], via Wikimedia Commons

  • Battle of the Upstarts: Houston vs. San Francisco Bay

    “Human happiness,” the Greek historian Herodotus once observed, “does not abide long in one place.” In its 240 years or so of existence, the United States has experienced similar ebbs and flows, with Boston replaced as the nation’s commercial capital first by Philadelphia and then by New York. The 19th century saw the rise of frontier settlements—Cincinnati, Pittsburgh, Cleveland, and finally Chicago—that also sought out the post position. In the mid 20th century, formerly obscure Los Angeles emerged as New York’s most potent rival.

    Today we are seeing yet another shuffling of the deck among American regions. New York remains the country’s preeminent city, but its most powerful rivals are likely to be neither Chicago nor Los Angeles, but rather two regions rarely listed in the hierarchy of influential regions: the San Francisco Bay Area and Houston.

    Making of a new pecking order

    The Bay Area does not rank among the 20 top global cities in most studies, such as the 2014 A.T. Kearney listings. In the respected rankings of the London-based Globalization and World Cities Network, the Bay Area stood below not only Chicago, which is considered an “alpha” global city, but also such places as Toronto and Mexico City.

    Yet such rankings vastly underestimate the power now being wielded by the San Francisco region. As the headquarters for the largest concentration of cutting edge tech firms in the world, the Bay Area increasingly shapes the operations of companies from manufacturing and marketing to retail and media. And given that roughly half the nation’s venture capital is still being lavished on area start-ups, it is not surprising that Silicon Valley ranks number one in the world as a place to launch tech ventures, according to the Startup Genome.

    Tech dominance, according to a recent study on global cities conducted by my firm NewGeography, explains why the San Francisco Bay Area nudges out much larger Los Angeles for bragging rights on America’s Pacific Rim. Technology leaders, including Intel, Apple, Oracle, Google, and Facebook, are based in Silicon Valley, while Asian global tech firms such as Samsung also have North American headquarters there. Top technology firms from other cities often have their key R&D functions in the Bay Area. Even a frugal firm like Wal-Mart is enlarging its Silicon Valley presence.

    The current social media bubble will surely pop, but as Michael S. Malone and others have noted, the Bay Area’s preeminence will likely continue, fueled by its unique concentration of engineers, entrepreneurs, and risk capital. As a lure for the ambitious, Silicon Valley and San Francisco are replacing Wall Street. Google alone has 1,200 employees who formerly worked for large U.S. investment banks, and migration from the Big Apple to California is now at its highest level since 2006.

    Much of the appeal of the Bay Area is a result of happy coincidence of history and geography. The Bay Area—where I went to school and got my start in journalism, and where parts of my family have resided since the ’50s—has been blessed with excellent higher education and is centered around what is arguably America’s most beautiful city. Good weather, beautiful vistas, and access to nature have made the Bay Area a natural lure for people who can afford to live wherever they want.

    The Energy Capital

    Houston, where I have been working as a consultant, hardly qualifies as one of the most physically attractive or temperate cities. San Francisco may well have been, as Neil Morgan suggested a half century ago, “the Narcissus of the West,” but Houston, in most accounts, has been widely disparaged as hot, steamy, ugly and featureless. Yet despite this, its ascendency is no less compelling than that of the Bay Area.

    Houston’s trump card, like the Bay Area’s, resides in its control of one strategic industry, in this case energy. The majority of traded foreign oil majors, such as London-based Shell and British Petroleum, have their U.S. headquarters in Houston, and even companies based elsewhere boast a significant Houston presence. For example, Exxon, although it has its headquarters in Dallas-Fort Worth, is opening a massive Houston campus that will be home to 10,000 employees. Additionally, a majority of the world’s largest oil services companies, such as Baker Hughes, Schlumberger, and FMC Technologies, are based in Houston.

    Altogether, more than 5,000 energy-related companies call Houston home. The city employs three times more people in energy than its second place rival, Dallas-Ft. Worth, and more than the next five cities combined. This growth is likely to accelerate because foreign companies, notably from Germany, have begun buying up energy firms in the area, including Siemens’s recent $7.6 billion dollar purchase of the Dresser Rand Group, an energy equipment firm.

     Houston has added more than 10 percent more jobs since 2008, almost twice the increase in the Bay Area. Since 2000 Houston’s employment figures have shot up 32 percent, while the Bay Area has grown by barely 4 percent. And it’s not just energy that’s driving things—Houston is now the nation’s largest export port and boasts the world’s largest medical center. It has also become, by some measurements, the most ethnically diverse (PDF) region in the country. In the last decade, for example, Houston increased its foreign-born population by 400,000, second only to New York and well ahead of much larger Los Angeles.

    The big losers: LA and Chicago—but also New York

    In the past century New York and Los Angeles have dominated American media. This is being severely undermined by the Bay Area’s digital economy. Since 2001, notes Mark Schill at Praxis Strategy (where I am a senior fellow), book, periodical, and newspaper publishing—all traditionally concentrated in the New York area—have lost some 250,000 jobs, while Internet publishing and portals generated some 70,000 new positions, many of them in the Bay Area or Seattle.

    Google and Yahoo are already among the largest media companies in the world. (Yahoo now refers to itself as a digital media company rather than a technology company). With the ubiquity of its iTunes platform, Apple exercises ever greater control over consumer distribution of entertainment products such as music and video; Netflix, Hulu, and YouTube could become the studios of the future. This could shift global media decision-making from its familiar New York-Los Angeles axis to the Bay Area.

    This is particularly bad news for Los Angeles, whose grip on the entertainment industry was weakening even before Silicon Valley’s rise. Since 2004, LA’sentertainment industry lost roughly 11 percent of its jobs, as production shifted to Canada, Louisiana, and other locales.

    The decline in media employment comes on the heels of a rapid industrial decline—the area has lost more than 90,000 aerospace jobs since the end of the Cold War. The situation is so dismal that a report issued by many of the region’s top business and political leaders concluded that the city “is barely treading water while the rest of the world is moving forward.”

    Chicago’s situation is arguably even worse, but it is more threatened by Houston, which has already passed the Windy City in numbers of corporate headquarters. Since 2010, when U.S. industry began recovering, Houston manufacturing employment expanded by more than 17 percent, compared to flat growth in Chicago.

    “Houston is the Chicago of this era—like the old Chicago,” remarks David Peebles, who runs the Texas office of Odebrecht, a $45 billion engineering firm based in Brazil. “In the ’60s you had to go to Chicago, Cleveland, and Detroit. Now Houston is the place for new industry.”

    With its industrial base eroding, Chicago is no longer a strategic hub for any key industry. Outside of trading commodities, it also no longer serves as a major global financial center. Regional population growth has been meager over the past decade, and the city’s own pension issues may be worse than Detroit’s.

    Chicago retains its brilliant skyline, great cultural institutions, powerful political influence, and a strong business community. But its days of America’s number two city are long gone, and, as we enter the mid-2000s, it is falling behind not only Los Angeles and New York but the two rising Texas cities, Houston and Dallas, both expected to pass the “city of big shoulders” in population by mid-century, or earlier.

    Engineering the Future

    In the coming decades, New York will remain the nation’s top global city, due to its remarkable urban legacy, the power of Wall Street, and the entrenched traditional media. But its Achilles heel is a lack of the engineering power necessary to address key challenges such as the digitization of industry, energy efficiency or climate change. New York is profoundly weak in engineering talent (PDF)—ranking 78th out of 85 metropolitan areas in engineers per capita.

    In contrast, the Bay Area represents the epitome of engineering power, with the San Jose area boasting the largest per capita concentration of engineers of any major metropolitan area. The Bay Area’s power to develop new technologies and its almost unfathomable wealth will continue to undermine traditional institutions, from Hollywood and Wall Street to business services, tourism, automotive, and even aerospace industries.

    Far less appreciated, Houston, rather than being a southern city of duller wits, actually ranks second in engineers per capita. If the Bay Area is master of the digital economy, Houston ranks as the technological leader of the material one; it is the capital for the energy-driven revival of U.S. industry, not only in Texas but throughout the old industrial heartland. Revealingly, Houston actually has seen far more rapid growth in both college educated and millennial population since 2000 than the Bay Area, as well as New York, Chicago, and Los Angeles.

    Rival Approaches to Urbanism

    The Bay Area, for all its vaunted progressivism, increasingly resembles a “gated community” whose high prices repel most potential newcomers, particularly families. Already by far the nation’s least affordable city—only 14 percent of current residents can possibly afford to buy a home—it represents a growth model that is by definition exclusive, almost a throwback to medieval forms where the rich clustered inside the city gates.

    High housing prices, notes economist Jed Kolko, account for the fact that, despite the boom, population growth in the Bay Area remains well below national averages. From 2000 to 2013, the region lost approximately 550,000 domestic migrants. Despite sizable immigration, the regional population growth rate has fallen below the national average.

    In contrast, Houston is among the fastest growing regions in the country, with rapid increases both in domestic migrants and newcomers from abroad. This stems from both lower housing prices and a growth model that is far more amenable to higher paid blue collar and middle management positions. Since 2000, Houston’s population has grown by 30 percent compared, three times that of the Bay Area.

    Ironically, Houston’s growth has been more egalitarian than that of the notionally super-progressive San Francisco region. A recent Brookings report found that income inequality has increased most rapidly in what is probably the most left-leaning big city in America, where the wages of the poorest 20 percent of all households have actually declined amid the dot com billions.

    This inequality has a distinct racial element. The Bay Area gap between white residents (who dominate the tech economy) and minorities is among the highest in the nation while, during the boom, income has fallen for Hispanics and African-Americans, according to Joint Venture Silicon Valley.

    This racial divergence is far less pronounced in Houston, while the growth of poverty since 2000 has been slower, increasing at one third the rate of New York and San Francisco, and half that of Los Angeles. The Texas city may lack the great views of San Francisco, but Houston has turned out to be a better city for middle class minorities. Homeownership among African Americans stands at 42 percent and for Latinos at more than 53 percent; this compares to 32 and 37 percent in the Bay Area.

    Perhaps the biggest differences can be seen in families. Of the nation’s 52 largest metropolitan areas, the Bay Area has the lowest percentage, 11.5 percent, of people ages 5 to 14. In Houston, 23 percent of the population fits this age category. In particular San Francisco is notoriously inhospitable to families, with the lowest percentage of kids of any major city.

    The two regions also reflect very different urban forms. The Bay Area’s leadership has opted to favor dense “in fill” growth and sought to restrict suburbandevelopment. Houston has taken a different tack. As its population has expanded, so too has the metropolitan area. This includes the development of many planned communities that appeal to middle class families and many immigrants. In 2013, Houston alone had more housing starts than the entire state of California.

    But it would be wrong to dismiss Houston’s model as merely “sprawl.” Instead it is better seen as simply expansive. In fact, arguably no inner ring in the country has seen more rapid growth, with high-rise, mid-rise and townhouse development in many long neglected districts. The increase in high-density housing tracts (more than 5,000 per square mile) since 2000 has been almost ten times higher than the Bay Area.

    The Political Battle for the Future

    Increasingly America’s future will be determined by these two cities, with the issue of addressing climate change at the fore. Much of the Bay Area’s leadership—led by the likes of Google Chairman Eric Schmidt and investor Tom Steyer—have all but declared war on the oil and gas industry. Several colleges and universities in the region, including Stanford, have shed their energy holdings, and Silicon Valley has nurtured movements such as Bill McKibben’s 350.org that seek to revoke the “social license” of big oil, a tactic used previously against the tobacco companies and firms that did business in apartheid South Africa.

    The elites of Silicon Valley and San Francisco are not just interested in saving the earth; they wish to profit from a change in the nation’s energy economy. Google, Sun Microsystems founder Vinod Khosla, and top venture capitalists such as John Doerr have bolstered their already ultra-thick wallets by capitalizing on “green energy” subsidies and outright grants from various levels of government. Given these investments, it’s easier to understand the Valley’s support for draconian climate change legislation, complete with attempts to demonize “Texas oil.” (One won’t see such populist zeal on , say, increasing capital gains rates.)

    The Valley’s hostility to fossil fuel energy, and its jihad to destroy an entire industry, is only barely recognized in Houston. I also have never heard anyone there suggest that Silicon Valley should be closed down as a danger to the planet (or at least a threat to the attention span of younger Americans). Houstonians, particularly in the energy industry, generally lack media savvy, which is one reason why energy is widely rated as the country’s least popular industry. Also missing, thankfully, is the sense of entitlement and self-congratulation one finds in the Bay Area. But once the intention to devastate the oil and gas industry is better understood, expect the energy capital to square off against the tech center, generating what may be the regional battle royal of our era.

    This piece originally appeared at The Daily Beast.

    Joel Kotkin is executive editor of NewGeography.com and Roger Hobbs Distinguished Fellow in Urban Studies at Chapman University, and a member of the editorial board of the Orange County Register. His newest book, The New Class Conflict is now available at Amazon and Telos Press. He is author of The City: A Global History and The Next Hundred Million: America in 2050. His most recent study, The Rise of Postfamilialism, has been widely discussed and distributed internationally. He lives in Los Angeles, CA.

    Photos courtesy of University of Texas Health Science Center at Houston Office of Communications and Vincent Bloch.

  • Success and the City: Houston’s Pro-growth Policies Producing an Urban Powerhouse

    David Wolff and David Hightower are driving down the partially completed Grand Parkway around Houston. The vast road, when completed, will add a third freeway loop around this booming, 600-square-mile Texas metropolis. Urban aesthetes on the ocean coasts tend to have a low opinion of the flat Texas landscape—and of Houston, in particular, which they see as a little slice of Hades: a hot, humid, and featureless expanse of flood-prone grassland, punctuated only by drab office towers and suburban tract houses. But Messrs. Wolff and Hightower, major land developers on Houston’s outskirts for four decades, have a different outlook.

    “We may not have all the scenery of a place like California,” notes the 73-year-old Mr. Wolff, who is also part owner of the San Francisco Giants. “But growth makes up for a lot of imperfections.”

    A host of newcomers—immigrants and transplants from around the United States—agree. The city’s low cost of living and high rate of job growth have made Houston and its surrounding metro region attractive to young families. According to Pitney Bowes,PBI +2.11% Houston will enjoy the highest growth in new households of any major city between 2014 and 2017. A recent U.S. Council of Mayors study predicted that the American urban order will become increasingly Texan, with Houston and Dallas-Fort Worth both growing larger than Chicago by 2050.

    Houston’s economic success over the past 20 years—and, more remarkably, since the Great Recession and the weak national recovery—rivals the performance of any large metropolitan region in the U.S. For nearly a decade and a half, the city has added jobs at a furious pace—more than 600,000 since early 2000, and 263,000 since early 2008.

    The much more populous greater New York City area has added 103,000 jobs since 2008, and Los Angeles, Chicago, Phoenix, Atlanta and Philadelphia remain well below their 2008 levels in total jobs. Los Angeles and Chicago, like Detroit, have fewer jobs today than they did at the turn of the millennium.

    Many of Houston’s jobs pay well, too. Using Praxis Strategy Group calculations that factor in the cost of living as well as salaries, Houston now has among the highest, if not the highest, standard of living of any large city in the U.S. The average cost-of-living-adjusted salary in Houston is about $75,000, compared with around $50,000 in New York and $46,000 in Los Angeles.

    Since 2001, the energy industry has been directly responsible for an increase of 67,000 jobs in Houston, and it now employs more than 240,000 people in the area. These include many technical positions, one reason the region now boasts the highest concentration of engineers outside Silicon Valley. The jobs should keep coming: University of Houston economist Bill Gilmer estimates that $25 billion to $40 billion in new petrochemical facilities is on its way to Greater Houston.

    Houston also has seen a surge in mid-skills jobs (usually requiring a certificate or a two-year degree) in fields such as manufacturing, logistics and construction, as well as energy. Many of these jobs pay more than $100,000 a year. And according to calculations derived from the Bureau of Labor Statistics by the Praxis Strategy Group’s Mark Schill, since 2007 Houston has led the 52 major metropolitan areas in creating these jobs, at a rate of 6.6% annually. In contrast, mid-skills jobs have declined by more than 10% in New York, Los Angeles, Chicago, and San Francisco, which have not been friendly to such industries.

    Houston’s growth is more than oil-industry luck; it reflects a unique policy environment. The city and its unincorporated areas have no formal zoning, so land use is flexible and can readily meet demand. Getting building permits is simple and quick, with no arbitrary approval boards making development an interminable process. Neighborhoods can protect themselves with voluntary, opt-in deed restrictions or minimum lot sizes.

    The flexible planning regime is also partly responsible for keeping Houston’s housing prices relatively low. On a square-foot basis, according to Knight Frank, a London-based real-estate consultancy, the same amount of money buys almost seven times as much space in Houston as it does in San Francisco and more than four times as much as in New York. Houston has built a new kind of “self-organizing” urban model, notes architect and author Lars Lerup, one that he calls “a creature of the market.”

    Housing-market flexibility has also benefited some of the city’s historically neglected areas. The once-depopulating Fifth Ward has seen a surge of new housing—much of it for middle-income African-Americans, attracted by the area’s long-standing black cultural vibe and close access to downtown as well as the Texas Medical Center. Rather than worry about gentrification, many locals support the change in fortunes. “In Houston, we don’t like the idea of keeping an image of poverty for our neighborhood,” explained Rev. Harvey Clemons, chairman of the Fifth Ward Community Redevelopment Corporation. “We welcome renewal.”

    Houston’s explosive economic growth has engendered another kind of boom: a human one. Between 2000 and 2013, Greater Houston’s population expanded by 35%—while New York, Los Angeles, Boston, Philadelphia, and Chicago grew by 4% to 7%. According to a 2012 Rice University study, Greater Houston is now the most ethnically diverse metro region in America, as measured by the balance between four major groups: African-American, white, Asian and Hispanic. “This place is as diverse as California,” notes David Yi, a Korean-American energy trader who moved to Houston from Los Angeles in 2013. “But it is affordable, with good schools.”

    The growth-friendly attitude is what holds everything together in Houston, and it will be crucial whenever the next slowdown comes—when oil prices could drop, say, to below $100 a barrel. It remains to be seen whether a large influx of newcomers to Greater Houston from the ocean coasts will clamor, as they have elsewhere—notably, in Colorado—for a more controlled, high-regulation urban environment. For now, though, most Houstonians see the city as a place that works—for minorities and immigrants, for suburbanites and city dwellers—and few want to fix what isn’t broken.

    This article first appeared in the Wall Street Journal.

    Joel Kotkin is executive editor of NewGeography.com and Distinguished Presidential Fellow in Urban Futures at Chapman University, and a member of the editorial board of the Orange County Register. He is author of The City: A Global History and The Next Hundred Million: America in 2050. His most recent study, The Rise of Postfamilialism, has been widely discussed and distributed internationally. He lives in Los Angeles, CA.

    Tory Gattis is a Social Systems Architect, consultant and entrepreneur with a genuine love of his hometown Houston and its people. He covers a wide range of Houston topics at Houston Strategies – including transportation, transit, quality-of-life, city identity, and development and land-use regulations – and have published numerous Houston Chronicle op-eds on these topics.

    Houston photo by BigStockPhoto.com.

  • Focusing on People, Not Sprawl

    For seven decades urban planners have been seeking to force higher urban population densities through urban containment policies. The object is to combat "urban sprawl," which is the theological (or ideological) term applied to the organic phenomenon of urban expansion. This has come at considerable cost, as house prices have materially increased relative to incomes, which is to be expected from urban containment strategies that ration land (and thus raise its price, all things being equal).

    Smart Growth America is out with its second report that rates urban sprawl, with the highest scores indicating the least sprawl and the lowest scores indicating the most (Measuring Sprawl 2014).

    Metropolitan Areas and Metropolitan Divisions

    For the second time in a decade Smart Growth America has assigned a "sprawl" rating to what it calls metropolitan areas. I say "what it calls," because, as a decade ago, the new report classifies "metropolitan divisions" as metropolitan areas (Note 1). Metropolitan divisions are parts of metropolitan areas. This is not to suggest that a metropolitan division cannot have a sprawl index, but metropolitan divisions have no place in a ranking of metropolitan areas. Worse, metropolitan areas with metropolitan divisions were not rated (New York, Los Angeles, Chicago, Dallas-Fort Worth, Philadelphia, Washington, Miami, San Francisco, Detroit, and Seattle).

    This year’s highest rating among 50 major metropolitan areas (over 1,000,000 population) goes to part of the New York metropolitan area (the New York-White Plains-Wayne metropolitan division) at 203.36. The lowest rating (most sprawling) is in Atlanta, at 40.99. This contrasts with 2000, when the highest rating was in part of the New York metropolitan area (the New York PMSA), at 177.8, compared to the lowest, in the Riverside-San Bernardino PMSA portion of the since redefined Los Angeles metropolitan area, at 14.2. Boston is excluded due to insufficient data (Note 2)

    Rating Sprawl

    The sprawl ratings are interesting, though obviously I would have done them differently.

    Overall urban population density would seem to be a more reliable indicator (called urbanized areas in the United States, built-up urban areas in the United Kingdom, population centres in Canada, and urban areas just about everywhere else). For example, the Los Angeles metropolitan area (combining its two component metropolitan divisions), has an index indicating greater sprawl than Springfield, Illinois. Yet, the Los Angeles urban area population density is about four times that of Springfield (6,999 residents per square mile, compared to 1747 per square mile, approximately the same as bottom ranking Atlanta). The implication is that if Los Angeles were to replicate the individual ratings that make up its index, and covered (sprawled) over four times as much territory, it would be less sprawling than today.

    This case simply illustrates the fact that sprawl has never been well defined. Indeed, the world’s most dense major urban area, Dhaka (Bangladesh), with more than 15 times the urban density of Los Angeles and 65 times the urban density of Springfield, has been referred to in the planning literature as sprawling.

    Housing Affordability

    The principal problem with the report lies with its assertions regarding housing affordability. Measuring Sprawl 2014 notes that less sprawling areas have higher housing costs than more sprawling areas (Note 3). However, it concludes that the lower costs of transportation offset much more all of the difference. This conclusion arises from reliance the US Department of Housing and Urban Development (HUD) and US Department of Transportation (DOT) Location Affordability Index, which bases housing affordability for home owners on median current expenditures, not the current cost of buying the median priced home. Nearly two thirds of the nation’s households are home owners, and most aspire to be.

    HUD-DOT describes its purpose as follows:

    "The goal of the Location Affordability Portal is to provide the public with reliable, user-friendly data and resources on combined housing and transportation costs to help consumers, policymakers, and developers make more informed decisions about where to live, work, and invest." 

    Yet, a consumer relying on the Location Affordability Index could be seriously misled. The HUD-DOT index (Note 4) does not begin to tell the story to people seeking to purchase homes. The costs are simply out of pocket housing costs, regardless of whether the mortgage has been paid off and regardless of when the house was bought (urban containment markets have seen especially strong house price increases).An index including people who have no mortgage and people who have lower mortgage payments as a result of having purchased years ago cannot give reliable information to consumers in the market today.

    A household relying on this source of information would be greatly misled. For example, comparing Houston with San Jose, according to HUD-DOT, owned housing and transportation consume virtually the same share of the median household income in each of the two metropolitan areas. In Houston, 52.5 percent of income is required for housing and transportation, while the number is marginally higher than San Jose (52.9 percent).

    But the HUD-DOT numbers reflect nothing like the actual costs of housing in San Jose relative to Houston. The median price house in Houston was approximately $155,000, 2.8 times the median household income of $55,200 (this measure is called the median multiple) during the 2006-10 period used in calculating the HUD-DOT index. In San Jose, the median house price was approximately $675,000, 7.8 times the median household income of $86,300 (Figure 1).

    If the Location Affordability Index reflected the real cost for a prospective home owner (HUD-DOT costs including a market rate mortgage for the house), a considerable difference would emerge between San Jose and Houston. The combined San Jose Location Affordability Index for home owners would rise to 85 percent of median household income, a full 60 percent above the Houston figure, rather than the minimal difference of less than one percent indicated by HUD-DOE (Figure 2).

    Under-Estimating the Cost of Urban Containment

    There is a substantial difference between the HUD–DOT housing and transportation cost and the actual that would be paid by prospective buyers. Five selected urban containment markets indicate a substantially higher actual housing cost than reflected in the HUD–DOT figures. On the other hand, in the selected liberally regulated markets (or traditionally regulated markets), the HUD–DOE figure is much closer to the current cost of home ownership (Figure 3). This is a reflection of the greater stability (less volatility) of house prices in liberally regulated markets. Overall, based on data in the 50 major metropolitan areas, owned housing costs relative to incomes rise approximately 6 percent for each 10 percent increase in the sprawl index – that is, less sprawl is associated with higher house prices relative to incomes (Note 6).

    The increasing impacts of urban containment’s housing cost increases have been limited principally to households who have made recent purchases. The effect will become even more substantial in the years to come as the turnover of the more expensive housing stock continues.

    Granted, the 2006 to 2010 housing data includes part of the housing bubble and its higher house prices. However, house prices relative to incomes have returned to levels at or above that recorded during the period covered by Measuring Sprawl 2014 in "urban containment" markets, such as San Francisco, San Jose, Los Angeles, San Diego, Seattle, Portland, and Washington.

    Economic Mobility and Human Behavior

    Another assertion requires attention: economic mobility is greater in less sprawling metropolitan areas. The basis is research by Raj Chetty and Nathaniel Hendren of Harvard University and Patrick Kline and Emmanuel Saez of the University of California, Berkeley. However, the realities of domestic migration suggest caution with respect to the upward mobility conclusions, as is indicated in Distortions and Reality About Income Mobilityand in commentary by Columbia University urban planner David King.

    Virtually all urban history shows city growth to have occurred as people have moved to areas offering greater opportunity. Jobs, not fountains, theatres and art districts, drive nearly all the growth of cities. This means that there should be a strong relationship between the cities net domestic migration and the economic mobility conclusions of the research. The strongest examples show the opposite relationship.

    Domestic migration is strongly away from some metropolitan areas identified in the research as having the greatest upward income mobility also had substantial net domestic migration losses. For example, despite claims of high economic mobility New York, Los Angeles and the San Francisco Bay area, each lost approximately 10 percent of their population to net domestic migration in the 2000s. On the other hand, some metropolitan areas scoring the lowest in upward economic mobility drew substantial net domestic migration gains. For example, low economic mobility Charlotte and Atlanta gained 17 percent and 10 percent due to net domestic migration in the 2000s. Thus, the results of the economic research appear to be inconsistent with expected human behavior (Note 7).

    Sprawl: An Inappropriate Priority

    The new sprawl report is just another indication that urban planning policy has been elevated to a more prominent place than appropriate among domestic policy priorities. The usual justification for urban containment is a claimed sustainability imperative for its densification and anti-mobility policies. Yet, these policies are hugely expensive and thus ineffective at reducing greenhouse gas emissions, and thus have the potential to unduly retard economic growth (read "the standard of living and job creation"). Far more cost-effective alternatives are available, which principally rely on technology.

    There is a need to reverse this distortion of priorities. Little, if anything is more fundamental than improving the standard of living and reducing poverty (see Toward More Prosperous Cities). Housing is the largest element of household budgets and policies of that raise its relative costs necessarily reduce discretionary incomes (income left over after paying taxes and paying for basic necessities). There is no legitimate place in the public policy panoply for strategies that reduce discretionary incomes.

    London School of Economics Professor Paul Cheshire may have said it best, when he noted that urban containment policy is irreconcilable with housing affordability.

    ———

    Note 1: The previous Smart Growth America report used primarily metropolitan statistical areas (PMSAs), which have been replaced by metropolitan divisions. The primary metropolitan statistical areas were also subsets of metropolitan areas (labor market areas). This is problem is best illustrated by the fact that the Jersey City PMSA, composed only of Hudson County, NJ, is approximately one mile across the Hudson River from Manhattan in New York. Manhattan is the world’s second largest central business district and frequent transit service connects the two. Obviously, Jersey City is a part of the New York metropolitan area (labor market area), not a separate labor market.

    Note 2: Because of incomplete data, Boston is not given a sprawl rating in Measuring Sprawl 2014. A different rating system in the previous edition resulted in a Boston rating among the least sprawling. Yet, the Boston metropolitan area is characterized by low density development. Outside a 10 mile radius from downtown, the population density within the urban area is slightly lower than that of Atlanta (same square miles of land area used).

    Note 3: Higher house prices relative to household incomes are more associated with policies to control urban sprawl (such as urban growth boundaries and other land rationing devices), than with the extent of sprawl. More compact (less sprawling) urban areas do not necessarily have materially higher house prices. For example, in 1970, the Los Angeles urban area was one of the most dense in the United States, yet it was within the historical affordability range (a median multiple of less than 3.0). The emergence of Los Angeles as the nation’s most dense urban area in the succeeding decades (and 30 percent increase in density) is largely the result of a change in urban area criteria. Through 1990, the building blocks of urban areas were municipalities, which meant that many square miles of San Gabriel Mountains wilderness were included, because it was in the city of Los Angeles. Starting in 2000, the building blocks or urban areas became census blocks, which are far smaller and thus exclude the large swaths of rural territory that were included before in some urban areas.

    Note 4: The transport costs from the Location Affordability Index are accepted for the purposes of this article.

    Note 5: The current purchase housing cost is based on the average price to income multiple over the period of 2006 to 2010, relative to the median household income (calculated from quarterly data from the Joint Center for Housing Studies of Harvard University, State of the Nation’s Housing 2011). It is assumed that the buyer would finance 90 percent of the house cost at the average 30 year fixed mortgage rate with points over the period. The 10 percent down payment is allocated annually in equal amounts over the 360 months (30 years). The final annual cost estimate is calculated by adding the monthly mortgage payment and down payment allocation to the median monthly housing cost in each metropolitan area for households without a mortgage.

    HUD-DOT uses the "selected monthly owner cost" from the American Community Survey (ACS) for its cost of home ownership. According to ACS, “Selected monthly owner costs are calculated from the sum of payment for mortgages, real estate taxes, various insurances, utilities, fuels, mobile home costs, and condominium fees."

    Note 6: This is based on a two-variable regression estimation (log-log) with the sprawl index as the independent variable and the substituted housing share of income as the dependent variable for the 50 largest metropolitan areas (excluding Boston), It is posited that most of the variation in housing costs is accounted for by variation in land costs. Other significant factors, such as construction costs and financing costs in this sample vary considerably less. A sprawl index for each metropolitan areas represented by metropolitan divisions (not provided in the sprawl report) is estimated by population weighting.

    Note 7: Another difficulty with that research is that it measured geographic economic mobility at age 30, well before people reach their peak earning level. This is likely to produce less than reliable results, since those who achieve the highest incomes as well as the most educated such as medical doctors and people with advanced degrees) are likely to have larger income increases after age 30 than other workers.

    Wendell Cox is principal of Demographia, an international public policy and demographics firm. He is co-author of the “Demographia International Housing Affordability Survey” and author of “Demographia World Urban Areas” and “War on the Dream: How Anti-Sprawl Policy Threatens the Quality of Life.” He was appointed to three terms on the Los Angeles County Transportation Commission, where he served with the leading city and county leadership as the only non-elected member. He was appointed to the Amtrak Reform Council to fill the unexpired term of Governor Christine Todd Whitman and has served as a visiting professor at the Conservatoire National des Arts et Metiers, a national university in Paris.

    Suburban neighborhood photo by Bigstock.

  • Forget What the Pundits Tell You, Coastal Cities are Old News – it’s the Sunbelt that’s Booming

    Ever since the Great Recession ripped through the economies of the Sunbelt, America’s coastal pundit class has been giddily predicting its demise. Strangled by high-energy prices, cooked by global warming, rejected by a new generation of urban-centric millennials, this vast southern region was doomed to become, in the words of the Atlantic, where the “American dream” has gone to die. If the doomsayers are right, Americans must be the ultimate masochists. After a brief hiatus, people seem to, once again, be streaming towards the expanse of warm-weather states extending from the southeastern seaboard to Phoenix.

    Since 2010, according to an American Community Survey by demographer Wendell Cox, over one million people have moved to the Sunbelt, mostly from the Northeast and Midwest.

    Any guesses for the states that have gained the most domestic migrants since 2010? The Sunbelt dominates the top three: Texas, Florida and Arizona. And who’s losing the most people? Generally the states dearest to the current ruling class: New York, Illinois, California and New Jersey.  Some assert this reflects the loss of poorer, working class folks to these areas while the “smart” types continue to move to the big cities of Northeast and California. Yet, according to American Community Survey Data for 2007 to 2011, the biggest gainers of college graduates, according to Cox, have been Texas, Arizona and Floria; the biggest losers are in the Northeast  (New York), the Midwest (Illinois and Michigan).

    For the most part, notes demographer Cox, this is not a movement to Tombstone or Mayberry, although many small towns in the south are doing well, this is a movement to Sunbelt cities. Indeed, of the ten fastest growing big metros areas in America in 2012, nine were in the Sunbelt. These included not only the big four Texas cities—Austin, Houston, Dallas-Ft. Worth, San Antonio—but also Orlando, Raleigh, Phoenix, and Charlotte.

    Perhaps the biggest sign of a Sunbelt turnaround is the resurgence of Phoenix, a region devastated by the housing bust and widely regarded by contemporary urbanists as the “least sustainable” of American cities. The recovery of Phoenix, appropriately named the Valley of the Sun, is strong evidence that even the most impacted Sunbelt regions are on the way back. 

    A look at the numbers on domestic migration undermines the claim that most Americans prefer, like the pundit class, to live in and near the dense Northeastern urban cores. People simply continue to vote with their feet. Since 2000, more than 300,000 people have moved to Atlanta, Dallas, Houston, and Charlotte; in contrast a net over two million left New York and 1.4 million have deserted the LA area while over 600,000 net departed Chicago and almost as many left the San Francisco Bay region. These trends were slowed, but not reversed, by the Great Recession.

    The Sunbelt’s recovery seems likely to continue in the future. Immigrants, who account for a rising proportion of our population growth, are increasingly heading there. New York remains the immigrant leader, with the foreign-born population increasing by 600,000 since 2000 but second place Houston, a relative newcomer for immigrants, gained 400,000, more than Chicago and the Bay Area combined. The regions experiencing the highest rate of newcomers were largely in the south; Charlotte and Nashville saw their foreign-born populations double as immigrants increasingly beat a path to the Sunbelt cities.

    The final demographic coup for the Sunbelt lies in its attraction for families. Eight of the eleven top fastest growing populations under 14, notes Cox, are found in the Sunbelt with New Orleans leading the pack. Generally speaking, roughly twenty percent or more of the population of Sunbelt metros are under 14, far above the levels seen in the rustbelt, the Left Coast, or in the Northeast.

    This all suggests that the Sunbelt is cementing, not losing, its grip on America’s demographic future. By 2012 and 2017, according to a survey by the manufacturing company Pitney Bowes nine of the ten leading regions in terms of household growth will be in the Sunbelt.

    If the population growth rates predicted by the US Conference of Mayors continue, Dallas-Ft. Worth will push Chicago out of third place among American metropolitan areas in 2043, with Houston passing the Windy City eight years later. Now seventh place Atlanta would move up to sixth place and Phoenix to 8th. Of America’s largest cities then, five would be located in the Sunbelt, and all are expected to grow much faster than New York, Los Angeles or the San Francisco area. Overall, the South would account for over half the growth in our major metropolitan areas in 2042, compared to barely 3.6 percent for the Northeast and 8.7 percent in the Midwest.

    What drives the change? Not just the sun, but the economy, stupidos!

    From the beginning of the Sunbelt ascendency, sunshine and warm weather have been important lures and this may even be more true in the near future. But the key forces driving people to the Sunbelt are largely economic—notably job creation, lower housing prices and lower costs relative to incomes.

    Until the housing bust, states like Arizona, Nevada and Florida were typically among the leaders in creating new jobs but their performance fell off with the decline of construction. But other Sunbelt locales, notably Texas, Louisiana and Oklahoma have picked up much of the slack. This resurgence has been centered in Texas, which created nearly a million new jobs between 2007 and 2013. In contrast, arch-rival California has lost a half a million.

    Many other Sunbelt states have yet to recover jobs lost from the recession, but most of their big metros have shown strong signs of recovery. Since 2007 five of the seven fastest growing jobs markets among the twenty largest cities were in Sunbelt states. Looking forward, recent estimates of job growth between 2013 and 2017, according to Forbes and Moody’s project employment to grow fastest in Arizona, followed by Texas. Also among the top ten are several states hit hard by the Recession, notably Florida, Georgia and Nevada. No Northeastern state appeared anywhere on the list; nor did California.

    For all its shortcomings, including what some may consider the overuse of tax breaks and incentives, the much-dissed Sunbelt development model continues to reap some significant gains. The area’s history of lagging economically has long spurred Sunbelt economic developers to utilize a policy of light regulation, low taxes and lack of unions to lure businesses to their area. Sunbelt states—Texas, Florida, the Carolinas, Tennessee, Arizona—dominate the ranks of the most business friendly states in the union, notes Chief Executive magazine, findings they often cite when courting footloose businesses.

    The clear economic capital of the Sunbelt is now Houston, with some stiff competition from Dallas-Ft. Worth. Houston, the energy capital, now ranks second only to New York in new office construction and is the overall number one for corporate expansions. There are fifty new office buildings going up in the city, including Exxon Mobil’s campus, the country’s second largest office complex under construction (after New York’s Freedom Tower). Chevron, once Standard Oil of California, has announced plans to construct a second tower for its downtown Houston campus while Occidental Petroleum, founded more than fifty years ago in Los Angeles, is moving its headquarters to Houston.

    Houston’s ascendance epitomizes the shift in the geographic and economic center of the Sunbelt. The “original in the Xerox machine” for Sunbelt style growth, Los Angeles’ rise was powered by new industries like entertainment and aerospace and oil, ever expanding sprawl and a strong, tightly knit business elite. Pleasant weather and Hollywood glitz still inform the image of Los Angeles, but under a regime dominated by government employee unions, greens and developers of dense housing, it suffers unemployment almost four points higher than Houston . Nine million square feet of space is currently being built in Houston, compared to just over one million in Los Angeles-Orange which has more than twice the population. It is not in the rising Sunbelt but in places like Southern California, where jobs lag amidst high costs, that the American dream now seems most likely to die.

    Movin’ on Up

    In Houston particularly but throughout the Sunbelt, job growth critically is not tied to cheap labor, but to  industries like energy which pay roughly $20,000 more than those in the information sector. According to EMSI, a company that models labor market data, energy has  generated some 200,000 new jobs in Texas alone over the past decade. Although Houston is the primary beneficiary, the American energy boom is also sparking strong growth in other cities, notably Dallas-Ft. Worth, San Antonio, and Oklahoma City.

    Once dependent on low-wage industries such as textiles and furniture, the energy boom is pacing a  Sunbelt move towards generally better paying heavy manufacturing. Texas and Louisiana already lead the nation in large new projects, many of them in petrochemicals and other oil-related production. Of the biggest non-energy investments, three of the top four, according to the Ernst and Young Investment Monitor, are in Tennessee, Alabama and South Carolina, which are becoming the new heartland of American heavy manufacturing, notably in automobiles and steel. Since 2010, Birmingham, Houston, Nashville and Oklahoma city all have enjoyed double digit growth in high paying industrial jobs that used to be the near exclusive province of the Great Lakes, California and the Northeast.

    The Sunbelt resurgence is important in part because it offers some hope to millions of Americans who may not have gone to Harvard or Stanford, but have work skills and ambition. The region’s growth in what might be called “middle skilled jobs” that pay $60,000 or above has been impressive.

    It may come as a surprise to some, but the Sunbelt is also pulling ahead in high tech jobs. In a recent analysis of STEM (science, technology, engineering and mathematics) job growth for Forbes we found that out of out of the 52 largest regions, the four most rapid growers over the past decade were Austin, Raleigh, Houston and Nashville, with Jacksonville, Phoenix and Dallas also in the top fifteen. In contrast New York ranked #36th out of 52 and Los Angeles, a long-time tech superpower, now a mediocre #38.

    In another example of how much things are changing, when college students in the South now graduate, noted a recent University of Alabama study, they do go to the “big city” but their top four choices outside the state are in the Sunbelt—Atlanta, Houston,  Nashville, Tenn., and Dallas—and followed then by New York. The biggest net gains in people with BAs and higher are primarily in the sunbelt, led by Phoenix,   Houston, Dallas-Ft. Worth, Austin, Houston and San Antonio; the biggest losers, according to Cox’s calculations, have been New York, Los Angeles, Chicago and, surprisingly given its reputation, Boston.

    These trends may become more pronounced as the current millennial generation starts settling down into family life. Housing costs could prove a decisive factor. In terms of the median multiple, median housing cost as share of median household income, Sunbelt cities tend to be about half as expensive as New York, Boston or Los Angeles, and one third of the Bay Area.  

    To be sure, many of the “best and brightest” will continue to flock to New York, the Bay Area or Los Angeles, but many more—particularly those without Ivy degrees or wealthy parents—may migrate to those places where their paycheck stretches the furthest. The Sunbelt, with its job growth, strong middle class wages and lows housing costs, is a good bet for the future.  

    What will the future bring?

    Prosperity, Herodotus reminded us, “never abides long in one place.” Certainly the Sunbelt economy could lose its current momentum but fortunately, having been schooled by the housing bust, many Sunbelt communities are increasingly focused on improving their basic economy—jobs, income growth, and skills-based education. Tennessee and Louisiana, for example, have led the way on expanding working training, and some of most ambitious education reform is taking place in New Orleans and Houston.

    Yet, there are many threats to continued growth, both internal and external. Given his penchant for executive orders and his close ties to wealthy green donors, President Obama could take steps—for example clamping down on fossil fuel development—that could reverse the steady growth along the Gulf Coast. Any draconian shift on climate change policies would be most detrimental to the energy sector Sunbelt states.

    But President Obama will not be in office forever. In the long run, the biggest threat to the Sunbelt ascendency is internal. Some fear that as more easterners and Californians flock to the area, they will bring with them a taste for the very regulatory and tax policies that have stifled growth in the states they left behind . Most worryingly, so called “smart growth” regulations could drive housing costs up, as occurred in Florida and several other states in the last decade, and erode some of the Sunbelt’s competitive advantage.

    Perhaps the most immediate threat comes from the angry, reactionary elements on the right, who tend to be more powerful in the sunbelt than elsewhere. These groups, sometimes including the Tea Party, have taken   positions on issues like immigration and gay rights that local business leaders fear could deprive their regions of energetic and often entrepreneurial newcomers. Equally important, the right’s anti-tax orthodoxy, although perhaps not as devastating as the huge burdens placed on middle class individuals in the North and California, could delay critical outlays in transportation, parks and other essential infrastructure in regions that are growing rapidly. This is particularly true of education, a field in which most Sunbelt cities, while gaining ground, remain below the national average.

    Whatever one thinks of the motivations of the green clerisy, there are clearly environmental measures, particularly in the Sunbelt’s western regions, that these cities need to enact to protect future growth. This includes reducing the amount of concrete that creates “heat islands,” expanding parks, and shifting to more drought resistant plants.

    Fortunately, many leaders throughout the Sunbelt, particularly in its cities, are aware of these challenges, and are looking for ways to tackle them. This is driven not by the doomsday environmentalism common in California and Northeast, but grows instead out of a practical concern with stewarding critical resources and creating the right amenities to foster continued growth.

    Combined with basics like lower housing costs and taxes, it’s a common optimism about the future that really underlies the resurgence now occurring from Phoenix to Tampa. The long-term shifts in American power and influence that have been underway since the 1950s have not been halted by the housing bust. Disdained by urban aesthetes, hated by much of the punditry, and largely ignored except for their failings in the media, the Sunbelt seems likely to enjoy the last laugh when it comes to shaping the American future.

    This story originally appeared at The Daily Beast.

    Joel Kotkin is executive editor of NewGeography.com and Distinguished Presidential Fellow in Urban Futures at Chapman University, and a member of the editorial board of the Orange County Register. He is author of The City: A Global History and The Next Hundred Million: America in 2050. His most recent study, The Rise of Postfamilialism, has been widely discussed and distributed internationally. He lives in Los Angeles, CA.

    Houston skyline photo by Bigstock.

  • How Houston’s Missing Media Gene Hobbles Its Global City Ambitions

    In an upcoming study I am working on with Chapman University’s Center for Demographics and Policy, we show that San Francisco and Houston are North America’s “emerging” global cities. They are also rival representative champions and exemplars of two models of civic development. San Francisco is the world’s technology capital; focused on the highest levels of the economic food chain; paragon of the new, intangible economy; and promoter environmental values and compact development.  Houston is the closest thing to American laissez-faire; unabashed embracer of the old economy of tangible stuff, including unfashionable, but highly profitable, industries like oil, chemicals, and shipping.

    San Francisco embraces development restrictions that it sees as environmentally sustainable — and not coincidentally produced the highest housing costs compared to income in the nation, rendering the region unaffordable to all but the elite — whereas Houston has risen as an “opportunity city” for the non-elite; and the land of no-zoning and unrestricted development.  Somewhat unexpectedly, both cities are remarkably socially tolerant. Houston has an openly lesbian Democratic mayor and is extremely diverse, and while San Francisco may be a bit more free wheeling with its Folsom Street Fair and such, it’s also more strictly enforces its intellectual and political orthodoxy.

    Yet to date the competition between these two emerging models has been non-existent, at least from Houston’s perspective. Simply put, the Bay Area has played its hand brilliantly, and is lavished with praise in the media. In contrast Houston seems to be missing the self-promotion gene, at least outside what it has to pay for with advertising. The Bay Area has built its own image, often with the avid support of journalists who grant tech moguls demi-god status, and understandably prefer San Francisco’s spectacular scenery, mild weather and world-class restaurants to flat, steamy Houston, whose exciting food scene is typically housed in nondescript strip malls.

    In conventional (that is New York or London) terms it’s easy to see San Francisco as a global capital. It has long been established as an elite national center, the financial capital of the West Coast, as well as the traditional center, along with parts of New York, of the American counter-culture. With the comparative decline of Los Angeles, the Bay Area reigns supreme on the west coast. Its technology industry strides the globe like a colossus, its tech titans have managed, at least to date, to play simultaneously the roles of both modern day robber barons and populist heroes.

    Houston is less obvious. Though the energy capital of the world, Houston is still emerging as a prominent national and global city. It’s less mature, and was a small, obscure city when San Francisco was already emerging as the uncontested capital of the west coast.  And unlike San Francisco, whose only real rival is much smaller Seattle, Houston competes with an equally large, and in many ways also rising rival in Dallas-Ft. Worth.

    Unlike tech, energy has produced few rockstars, but many who are castigated as demons. Although there are 5,000 energy companies and 26 Fortune 500 headquarters in Houston, few of its leaders have achieved public prominence apart from Dick Cheney and Enron’s Jeff Skilling and Ken Lay — not exactly folk heroes.

    This is not to say some energy people don’t deserve celebration. For example, few Americans noticed the recent death of George Mitchell, the father of the fracking revolution that has driven America’s greenhouse gas emissions down at the fastest rate in the world, and one of America’s premier developers of master planned developments in the form of The Woodlands near Houston. The Economist said of this son of poor Greek immigrants, “Few businesspeople have done as much to change the world as George Mitchell.”  (Most people hearing the name would probably think of former Maine Senator George Mitchell).

    The maturity curve alone isn’t enough to account for the difference. Two additional factors are at work. First, the Bay Area self-consciously sees itself as a leader and moral exemplar. It wants to world to follow where it leads. Houston it seems, perhaps in line with its laissez-faire approach, wants to leave others alone, and be left to its own.  It may boast of having a great model, but whether others adopt has been of no particularly great local concern.

    The second big divergence relates to media. After all, the media, understood broadly, is how we come to have knowledge about or opinions of many things. Simply put, San Francisco and the tech industry get the power of media, while Houston doesn’t.

    The content creators may still prefer a New York, LA, or DC but the tech moguls are circling the last redoubts of entertainment and information.   Apple now has a dominant position in content distribution for music and is expanding in other areas.  Google generates huge advertising revenues that are greater than the entire newspaper and magazine industry.  Despite its many troubles, Yahoo remains one of the most-visited news sites. Meanwhile in just last year or two, Facebook co-founder Chris Hughes has bought the venerable New Republic while Seattle’s Jeff Bezos  recently bought the Washington Post. Pierre Omidyar, founder of Ebay, recently announced a $250 million new media venture featuring Glenn Greenwald and other well-known leftist media types.

    This isn’t just hubris, it’s good business. With Silicon Valley magnates starting to come under the same scrutiny as their 1% peers in other industries, it pays to have the means to control the narrative. Glenn Greenwald helped break the story on NSA snooping, but now that he’s on Silicon Valley’s payroll, how likely is it that he’ll take a similarly tough line on tech company privacy matters?  Give the Bay Area/tech crowd their due – they know what they are doing.

    Houston, by contrast, has close to zero media influence or impact and seems not to care. It’s much less an influencer of media than one whose reputation has been shaped by it, and often not in a good way. Though there are many sprawl dominated metropolises in America, it’s Houston that has become the bête noire of urbanists.

    It’s easy to understand historically why Houston has so little media influence, but harder to understand why the city is so blasé about it.  Tory Gattis, a former McKinsey consultant and local Houston blogger, suggests that it has to do with the DNA of the energy industry.  Most energy companies in Houston are B2B operations, so have little need for mass media. Energy has always been a political game and the industry’s approach has been a fairly direct one: employ a phalanx of lobbyists and former politicians around the world to help secure deals.  Also, unlike with the latest smart phone or social media app, you don’t need to convince anybody to fill up his gas tank or turn on his furnace in the winter.  The product is already completely understood by the end customer and literally sells itself.

    This mindset explains why the city has a blind spot, a missing gene if you will, that keeps it from understanding the necessity of having a robust media presence as part of its ambition to become a true global city. The Bay Area tech community may have been slow to the party when it comes to lobbying, but they are spending big to catch up fast and many of their executives have political as well as media aspirations. But despite its incredible wealth and surfeit of billionaires, Houston is absolute nowhere when it comes to media or thought leadership, and seems indifferent to the fact.

    Beyond merely asserting a role on the stage, getting in the media game is critical to the survival of Houston and its model.  The Bay Area sees itself as a model for a future America and world. It is spending big, lobbying big, and invading politics to create the kind of future it wants to see. Its mindset is to dominate.

    Houston may be content to let San Francisco go its own way but the reverse does not hold.  Silicon Valley has its sights set on overturning the fossil fuel industry through big investments (and good ol’ government pork) in green tech companies. Legal mandates that favor their investments are popular. It should be no surprise that folks like Bay Area billionaire Thomas Steyer have been vocal opponents of the KeystoneXL pipeline. (Such opposition is not uniform. Mark Zuckerberg’s Fwd.us organization supports KeystoneXL. But there’s clearly a lot of Silicon Valley support for policies that aren’t great for the Houston model).

    Houston can brag all its wants about its legitimate accomplishments in important areas like job and population growth and in providing middle-class opportunity. But if it wants to claim the mantle of global city, or even just head off threats to its way of doing business, it needs, like the Bay Area, to self-consciously stake out the role of leader.  For starters, that means putting its bigtime financial and intellectual muscle behind getting its message out. That means, like it or not, investing not only in oil wells, but inkwells.

    Aaron M. Renn is an independent writer on urban affairs and the founder of Telestrian, a data analysis and mapping tool. He writes at The Urbanophile.

    Photo by telwink.

  • American Cities May Have Hit ‘Peak Office’

    Despite some hype and a few regional exceptions, the construction of office towers and suburban office parks has not made a significant resurgence in the current recovery. After a century in which office space expanded nationally with every uptick in the economy, we may have reached something close to “peak office” in most markets.

    The amount of new office space in development is extraordinarily low by historical standards, outside of a handful of markets. Back in the mid-1980s, according to the commercial real-estate research firm CoStar, upward of 200 million square feet of office space was built annually. After dropping precipitously in the early 1990s, construction rose again to 200 million square feet a year in the early 2000s before dropping well under 150 million square feet in 2006, and lower after that. This year, in what is purported to be the middle of an economic recovery,  we will add barely 30 million square feet,according to Reis Inc.

    Even with this paltry construction, vacancy rates nationwide have barely moved, hovering around 17%. This is nowhere near low enough to justify much more construction in the vast majority of markets, where office rents remain well below 2007 levels.

    Indeed, the trend in real estate remains to convert office spaces to other uses,particularly residential. Large-scale office construction is happening in just a handful of markets; New York and Houston are the only ones with 10 million square feet being built, with smaller amounts in the works in Boston, Washington, Dallas-Ft. Worth and the San Francisco Bay Area.

    Most of the current anemic growth is happening outside downtown areas. Silicon Valley, which is essentially a sprawling suburb, currently has about as much construction as San Francisco. In Houston, another big metro area with robust job growth, there is a new 47-story high-rise being developed downtown, but much of the action is taking place on the periphery, notably in the Energy Corridor. ExxonMobil’s massive new campus, at 3 million square feet, ranks with One World Trade Center in Manhattan as the nation’s largest new office projects.

    Through the third quarter this year, the amount of new office space under construction in suburban areas was roughly double the amount being built in central business districts, by CoStar’s count. Furthermore, only 7.1 million square feet of office space was absorbed downtown in the first nine months of 2013, compared to 51.5 million in suburban areas, CoStar says. But overall there is still 100 million square feet less space being used today than in 2007, and at current absorption rates, it could take six or seven years just to get back to where we were before the recession.

    The Weak Economy

    The key question here is not the geography of office space but why so little is being built. As long as economic growth is modest, don’t expect much change in the skyline in most downtowns, or suburbs. Job growth has been mediocre at best, and much of that has been in the low-wage and part-time category. McJobs and part-time workers do not generally fill office towers.

    The dirty little secret of this recovery is that labor participation rates are at the lowest level since 1978. Underemployment is rife, at around 18% to 20%, and much of that likely includes large numbers of people who used to work in offices.

    This is true even in New York City, where the rate of “office-using employment” has been dropping since the late 1960s and even in the recovery, has yet to rebound to the levels of 2000.

    Changing Use of Space

    Just as we have gotten used to more fuel-efficient cars, companies now utilize space more efficiently than before, largely through information technology. This is a trend many companies plan to accelerate. In the past, for example, your average mid-level executive had his own secretary; now it’s more common to have perhaps one aide for several managers. Historically office developers assumed that each worker would require 250 square feet of space; by the end of the decade this could drop to 100 to 125 square feet.

    Even the most notoriously bureaucratic of professions, law, is scaling back. A recent Cushman and Wakefield survey  found that most firms — many already downsizing — were working to reduce their office footprint per attorney from 800 to 500 square feet. Almost two out of five expect to use “hoteling,” or the sharing of offices among attorneys, something very rare a decade ago.

    At the same time, some of the sectors that are the best bets for expansion, such as information technology and media, are increasingly seeking out unconventional office space. Mayor Mike Bloomberg’s drive to upzone large parts of Midtown Manhattan to create ever-taller towers works operates on the assumption that new users will be much like the old ones. But some experts, such as New York-based architect Robert Stern, suggest that ultra high-rise development does not appeal to either creative businesses and tourists, while preserving older districts, with already developed buildings, does.

    Self-Employment and Home-Based Businesses

    Perhaps the biggest long-term threat lies in the shift from corporate to self-employment. From 2001 to 2012, the number of self-employed workers grew by 14%, according to a recent study by Economic Modeling Specialists. This is occurring not only in the metro areas that suffered the worst during the recession, such as Phoenix, Los Angeles and Riverside-San Bernardino, but also in the healthiest economies such as Houston and Seattle.

    Some of these now self-employed workers may end up in small offices, but many don’t leave home at all. Working at home is growing far faster than commuting by either car or transit, and in most U.S. metro areas, far exceeds those who get to work by public conveyance, most often to downtown areas. Over the past decade the number of U.S. telecommuters expanded 41% to some 1.7 million, almost double the much-ballyhooed increase of 900,000 transit riders.

    Are We Blowing Another Bubble?

    In some specialized, fast-growing markets, new office construction may well be justified. Raleigh is seeing some new construction in its small downtown, as are hot job markets such as Austin and oil-rich Midland, Texas, where a proposed 53-story office tower would be the tallest building between Dallas and Los Angeles.

    But in New York, plans for massive new office tower construction seem to contradict an unemployment rate considerably above the national average. Financial services, the primary driver of the Manhattan market, is showing signs of economic distress, with firms moving middle-management jobs to more affordable places such as Richmond, Va.; Pittsburgh; St. Louis; and Jacksonville, Fla.

    Perhaps even more worrisome, less than half of the space in new buildings in Manhattan is preleased, compared to over 70% in both Houston and Boston, and a remarkable 92% in San Jose/Silicon Valley. This reflects an apparent dearth of large employers in New York who could conceivably afford and fill ultra-expensive office space in the coming years, a recent article in Crain’s New York points out. Tech companies might be expected to help fill the gap, but we have to remember that after the last boomlet Silicon Alley suffered asteep contraction; it has since recovered, but could be hit hard again if the current bubble pops.

    San Francisco, the other current darling of office developers, is even more dependent on the current dot-com boom. The IPOs of Frisco-based firms such as Twitter appear to suggest the prospect of a whole new generation of office occupants. By one account, there is as much as 12 million square feet of new office space in the pipeline in the city, enough to satisfy historical demand for the next 16 years.

    Yet past experience shows many of these companies will likely dissolve or merge in the next few years. They may be fewer in numbers and longer established than last time around, as some local boosters eagerly suggest, but most are still unprofitable and many may never be truly viable. Following the 2000 dot-com crash, San Francisco office occupancy dropped roughly 10 million square feet, while tech employment crashed from a high of 34,000 in 2000 to barely 18,000 four years later.  As one real-estate executive put it at the time, “The office-space market here ”reminds me of the Road Runner cartoon where the Coyote runs into the wall.”

    Observers also point out that more traditional businesses, such as banks, continue to ship jobs elsewhere, in large part due to extraordinarily high costs. The fact that pre-leasing for SF’s new office buildings is barely 33% should add to the caution.

    None of this suggests there are not some good opportunities for new construction, but the office building’s role as a key indicator of the strength of the U.S. economy has faded. In great cities, rather than a ballyhooed era of new office skyscrapers we will see more conversions and the construction of residential high-rises, as well as medical buildings. The secular trend is for the dispersion of business service employment to smaller markets, and into people’s homes. The glory days of the American office tower are over, and not likely to return soon, given technological trends and a persistently tepid economy.

    This story originally appeared at Forbes.

    Joel Kotkin is executive editor of NewGeography.com and Distinguished Presidential Fellow in Urban Futures at Chapman University, and a member of the editorial board of the Orange County Register. He is author of The City: A Global History and The Next Hundred Million: America in 2050. His most recent study, The Rise of Postfamilialism, has been widely discussed and distributed internationally. He lives in Los Angeles, CA.

    Photo by Mark Lyon — Full Floor For Rent.

  • Exporting Metros

    If there’s one thing that people of pretty much every political persuasion agree on, it’s the need to boost exports. This is true not just at the national level, but also the local one. The balance of world population and economic growth is outside the United States. McKinsey estimates that there will be an additional one billion people added to the global “consuming class” by 2025.  An economy focused solely on a domestic American or North American market is missing a huge part of the addressable market, dooming it to slower growth.

    Exports have also long been seen as a key part of economic growth in the city. Jane Jacobs noted how cities develop import substitutes. That is, cities develop replacements for goods and services they formerly imported, and subsequently start exporting these to other places. So exporting, both to domestic and to foreign destinations, is critical for cities.

    The US Department of Commerce recently released foreign export totals by metropolitan area for 2012. The data series goes back as far as 2005. A number of metro regions are exporting power houses.  There are 31 metro areas that export more than $10 billion in goods and services every year.  Here is the top ten:

    Rank

    Metro Area

    2012

    1

    Houston-Sugar Land-Baytown, TX

    110,297,753,116

    2

    New York-Northern New Jersey-Long Island, NY-NJ-PA

    102,298,029,869

    3

    Los Angeles-Long Beach-Santa Ana, CA

    75,007,521,224

    4

    Detroit-Warren-Livonia, MI

    55,387,305,415

    5

    Seattle-Tacoma-Bellevue, WA

    50,301,690,645

    6

    Miami-Fort Lauderdale-Pompano Beach, FL

    47,858,713,857

    7

    Chicago-Joliet-Naperville, IL-IN-WI

    40,567,953,537

    8

    Dallas-Fort Worth-Arlington, TX

    27,820,946,540

    9

    San Jose-Sunnyvale-Santa Clara, CA

    26,687,656,696

    10

    Minneapolis-St. Paul-Bloomington, MN-WI

    25,155,739,576

    Table 1: Dollar Value of Exports, 2012

    Unsurprisingly, bigger cities have more exports, but it’s not a perfect correlation. Energy and chemicals intensive Houston ranks #1, and places like #5 Seattle (home to Boeing and Microsoft) and #6 Miami (the hub of Latin American trade) punch above their weight.

    But perhaps a better measure of the export intensity of an economy is exports per capita. Here’s a map of US metro areas for that metric:


    Map 1: Export dollar value per capita, 2012.

    Here are the top ten metros in America among those with a population greater than one million:

    Rank

    Metro Area

    2012

    1

    New Orleans-Metairie-Kenner, LA

    20209.1

    2

    Houston-Sugar Land-Baytown, TX

    17778.0

    3

    Seattle-Tacoma-Bellevue, WA

    14160.9

    4

    San Jose-Sunnyvale-Santa Clara, CA

    14087.7

    5

    Salt Lake City, UT

    13764.1

    6

    Detroit-Warren-Livonia, MI

    12904.6

    7

    Cincinnati-Middletown, OH-KY-IN

    9312.0

    8

    Portland-Vancouver-Hillsboro, OR-WA

    8881.9

    9

    Memphis, TN-MS-AR

    8522.5

    10

    Miami-Fort Lauderdale-Pompano Beach, FL

    8304.9

    Table 2: Top Ten Large Metros, Dollar Value of Exports Per Capita, 2012

    Here we see that some top exporters like Houston, Seattle, and Miami continue to rank well.  But some smaller metros crack the list like #1 New Orleans (another major petroleum center) and #7 Cincinnati (which has a major GE aircraft engine plant).

    And lastly, here’s a look at the growth in total exports from metro areas over the time period for which data is available:


    Map 2: Percent change in total exports, 2005-2012.

    There was extremely wide variability in the growth rates of exports among metro areas. Here is the top 10 for large metro areas:

    Rank

    Metro Area

    2005

    2012

    Percent
    Change

    1

    San Antonio-New Braunfels, TX

    2,346,954,123

    14,010,234,128

    496.95%

    2

    New Orleans-Metairie-Kenner, LA

    4,857,754,172

    24,359,505,265

    401.46%

    3

    Salt Lake City, UT

    3,912,555,433

    15,989,999,420

    308.68%

    4

    Houston-Sugar Land-Baytown, TX

    41,747,920,224

    110,297,753,116

    164.20%

    5

    Las Vegas-Paradise, NV

    716,805,170

    1,811,480,065

    152.72%

    6

    Birmingham-Hoover, AL

    796,241,450

    1,939,217,017

    143.55%

    7

    Washington-Arlington-Alexandria, DC-VA-MD-WV

    6,058,364,485

    14,609,712,467

    141.15%

    8

    Raleigh-Cary, NC

    974,832,168

    2,308,052,342

    136.76%

    9

    Miami-Fort Lauderdale-Pompano Beach, FL

    20,382,947,257

    47,858,713,857

    134.80%

    10

    Providence-New Bedford-Fall River, RI-MA

    2,667,670,867

    5,830,785,377

    118.57%

    Table 3: Large metro top ten, Percent change in total exports, 2005-2012.

    San Antonio is the champion, but Houston and New Orleans score well again.  A few unexpected metro areas like Birmingham and Providence, traditionally viewed as economic laggards, appear on the list though these are growing admittedly from small bases. What this does show is that even long struggling metros have a major opportunity to improve themselves through focusing on export growth.

    While there’s a general nod of approval in the direction of boosting exports, few urban strategies seem to focus on it. Rather, sexier items like subsidized real estate development is generally front and center. But given the positive results even struggling cities like Providence have seen with exports, this type of more basic economic blocking and tackling would seem to be a better place to focus.

    Aaron M. Renn is an independent writer on urban affairs and the founder of Telestrian, a data analysis and mapping tool. He writes at The Urbanophile.

    Great Lakes Freighter photo by BigStockPhoto.com.

  • As the North Rests on Its Laurels, the South Is Rising Fast

    One hundred and fifty years after twin defeats at Gettysburg and Vicksburg destroyed the South’s quest for independence, the region is again on the rise. People and jobs are flowing there, and Northerners are perplexed by the resurgence of America’s home of the ignorant, the obese, the prejudiced and exploited, the religious and the undereducated. Responding to new census data showing the Lone Star State is now home to eight of America’s 15 fastest-growing cities, Gawker asked: “What is it that makes Texas so attractive? Is it the prisons? The racism? The deadly weather? The deadly animals? The deadly crime? The deadly political leadership? The costumed sex fetish conventions? The cannibal necromancers?” 

    The North and South have come to resemble a couple who, although married, dream very different dreams. The South, along with the Plains, is focused on growing its economy, getting rich, and catching up with the North’s cultural and financial hegemons. The Yankee nation, by contrast, is largely concerned with preserving its privileged economic and cultural position—with its elites pulling up the ladder behind themselves.

    This schism between the old Confederacy and the Northeastern elites is far more relevant and historically grounded than the glib idea of “red” and “blue” Americas. The base of today’s Republican Party—once the party of the North—now lies in the former secessionist states, along with adjacent and culturally allied areas, such as Appalachia, the southern Great Plains, and parts of the Southwest, notably Arizona, largely settled by former Southerners.

    “In almost every species of conceivable statistics having to do with wealth,” John Gunther wrote in 1946, “the South is at the bottom.” But even as Gunther was writing, the region had begun a gradual ascendancy, now in its seventh decade. That began with a belated post-WWII push to promote industrialization, much of it in relatively low-wage industries such as textiles. “Southerners don’t have any rich relatives. God was a Northerner,” the head of the pro-development Southern Regional Council told author Joel Garreau in 1980. “Without a heritage of anything except denial, Southerners, given a chance to improve their standard of living, are doing so.”

    While the Northeast and Midwest have become increasingly expensive places for businesses to locate, and cool to most new businesses outside of high-tech, entertainment, and high-end financial services, the South tends to want it all—and is willing to sacrifice tax revenue and regulations to get it. A review of state business climates by CEO Magazine found that eight of the top 10 most business-friendly states, led by Texas, were from the former Confederacy; Unionist strongholds California, New York, Illinois, and Massachusetts sat at the bottom.

    The South’s advantages come in no small part from decisions that many Northern liberals detest—lack of unions, lower wages, and less stringent environment laws. But for many Southerners, particularly in rural areas, a job at the Toyota plant with a $15-an-hour starting salary, and full medical benefits, is a vast improvement over a minimum-wage job at Wal-Mart, much less your father’s fate chopping cotton on a tenant farm.

    And the business-friendly policies that keep costs down appeal to investors. Ten of the top 12 states for locating new plants are in the former confederacy, according to a recent study by Site Selection magazine. In 2011 the two largest capital investments in North America (PDF)—both tied to natural-gas production—were in Louisiana.

    More recently, the region—led by Texas—has moved up the value-added chain, seizing a fast-growing share of the jobs in higher-wage fields such as auto and aircraft manufacturing, aerospace, technology, and energy. Southern economic growth has now outpaced the rest of the country for a generation and it now constitutes by far the largest economic region in the country. A recent analysis by Trulia projects the edge will widen over the rest of this decade, owing to factors including the region’s lower costs and warmer weather.

    These developments are slowly reversing the increasingly outdated image of the South as hopelessly backward in high-value-added industries. Alabama and Kentucky are now among the top-five auto-producing states, while the Third Coast corridor between Louisiana and Florida ranks as the world’s fourth-largest aerospace hub, behind Toulouse, France; Seattle; and California.

    Southern growth can also be seen in financial and other business services. The new owners of the New York Stock Exchange are based in Atlanta.

    While the recession was tough on many Southern states, the area’s recovery generally has been stronger than that of Yankeedom: the unemployment rate in the region is now lower than in the West or the Northeast. The Confederacy no longer dominates the list of states with the highest share of people living in poverty; new census measurements (PDF), adjusted for regional cost of living, place the District of Columbia and California first and second. New York now has a higher real poverty rate than Mississippi.

    Over the past five decades, the South has also gained in terms of population as Northern states, and more recently California, have lost momentum. Once a major exporter of people to the Union states, today the migration tide flows the other way. The hegira to the sunbelt continues, as last year the region accounted for six of the top eight states attracting domestic migrants—Texas, Florida, North Carolina, Tennessee, South Carolina, and Georgia. Texas and Florida each gained 250,000 net migrants. The top four losers were New York, Illinois, New Jersey, and California.

    These trends suggest that the South will expand its dominance as the nation’s most populous region. In the 1950s, the Confederacy, the Northeast, and the Midwest all had about the same populations. Today the South is nearly as populous as the Northeast and the Midwest combined, and the Census projects the region will grow far more rapidly (PDF) in the years to come than its costlier Northern counterparts.

    Yankees tend to shrug off such numbers as largely the chaff drifting down. “The Feet are moving south and west,” The Atlantic’s Derek Thompson wrote in 2010, “while the Brains are moving toward coastal cities.”

    To be sure, some Yankee bastions, such as Massachusetts and Connecticut, enjoy much higher percentages of educated people than the South. Every state in the Southeast falls below the national average of percentage of residents 25 and over with at least a bachelor’s degree—but virtually every major Southern metropolitan region has been gaining educated workers faster than their Northeastern counterparts. Over the past decade, greater Atlanta added over 300,000 residents with B.A.s, more than the larger Philadelphia region and almost 70,000 more than Boston.

    The region—as recently as the 1970s defined by its often ugly biracial politics—has become increasingly diverse, as newly arrived Hispanics and Asians have shifted the racial dynamics. While the vast majority of 19th-century immigrants to America settled in the Northeast and Midwest, today the fastest-growing immigration destinations—including Nashville, Atlanta, and Charlotte—are in the old Confederacy. Houston ranked second in gaining new foreign-born residents in the past decade, just behind New York City, with nearly three times its size. And Houston and Dallas both now attract a higher rate of immigration than Boston, Chicago, Seattle, or Philadelphia.

    These immigrants are drawn to the South for the same reasons as other Americans—more jobs, a more affordable cost of living and better entrepreneurial opportunities. A 2011 Forbes ranking of best cities for immigrant entrepreneurs—measuring rates of migration, business ownership, and income—found several Southeastern cities at the top of the list, with Atlanta in the top slot, and Nashville coming in third.

    Then there’s the most critical determinant of future power: family formation. The South easily outstrips the Yankee states in growth in its 10-and-under population. Texas and North Carolina expanded their kiddie population by over 15 percent; and every Southern state gained kids except for Katrina-ravaged Louisiana. In contrast New York, Rhode Island, and Michigan lost children by a double-digit margin while every state in the Northeast as well as California suffered net losses.

    The differences are most striking when looking at child-population growth among the nation’s 51 largest metropolitan areas. Eight of the top ten cities for growth in children under 15 were located in the old Confederacy—Raleigh-Cary, Austin, Charlotte, Dallas, Houston, Orlando, Atlanta, and Nashville. New York, Los Angeles, and Boston, along with several predictable rust-belt locals, ranked in the bottom 10.

    Historically, regions with demographic and economic momentum tend to overwhelm those who lack it. Numbers mean more congressional seats and more electoral votes, and governors who command a large state budget and the national stage. Unless there is a major political change, the South’s demographic elevation will do little to help Democrats there, who, like Northern Republicans, appear to be an endangered species.

    Pundits including the National Journal’s perceptive Ron Brownstein suggest that the GOP’s Southern dominance has “masked” the party’s decline in much of the rest of the country. Other, more partisan voices, like the New Yorker’s George Packer simply dismiss Southern conservatives as overmatched by the Obama coalition of minorities, the young, and the highly educated. The even more partisan Robert Shrum correctly points out that the Southern-dominated GOP is increasingly out of step with the rest of the country on a host of social and economic issues, from income inequality to support for gay marriage.

    “A lot of sociologists have projected that the South will cease to exist because of things like the Internet and technology,” Jonathan Wells told Charlotte Magazine. An associate professor of history at UNCC and author of Entering the Fray: Gender, Culture, and Politics in the New South, Wells predicts the region “will lose its distinctive identity that it had in the past.”

    It’s unlikely, though, that the South will emulate the North’s social model of an ever-expanding welfare state and ever more stringent “green” restrictions on business—which hardly constitutes a strong recipe for success for a developing economy. It’s difficult to argue, for example, that President Obama’s Chicago, broke and with 10 percent unemployment, represents the beacon of the economic future compared to faster-growing Houston, Dallas, Raleigh, or even Atlanta. People or businesses moving from Los Angeles, New York, or Chicago to these cities will no doubt carry their views on social issues with them, but it’s doubtful they will look north for economic role models.

    Instead, you might see some political leaders, even Democrats, in states such as Pennsylvania, Ohio (a Civil War hotspot for pro-Southern Copperheads), and Michigan come to realize that pro-development policies, such as fracking, offer broader benefits than the head-in-the-sand “green” energy policy that slow growth in places like New York and California. The surviving Southern Democrats (by definition, a tough breed) like Houston Mayor Anise Parker have shown that you can blend social liberalism with “good old boy” pro-business policies.

    Politicians like Parker, along with Republicans such as former Florida governor Jeb Bush, represent the real future of the states that once made up the Confederacy. As they look to compete with the Northeast and California for the culture, and high-test and financial-service firms that are forced to endure the high cost of the coasts, Southerners are likely to at least begin shrugging off their regressive—and costly—social views on issues like gay marriage.

    Bluntly put, if the South can finally shake off the worst parts of its cultural baggage, the region’s eventual ascendancy over the North seems more than likely. High-tech entrepreneurs, movie-makers, and bankers appreciate lower taxes and more sensible regulation, just like manufacturers and energy companies. And people generally prefer affordable homes and family-friendly cities. Throwing in a little Southern hospitality, friendliness, and courtesy can’t hurt either.

    Joel Kotkin is executive editor of NewGeography.com and a distinguished presidential fellow in urban futures at Chapman University, and a member of the editorial board of the Orange County Register . He is author of The City: A Global History and The Next Hundred Million: America in 2050. His most recent study, The Rise of Postfamilialism, has been widely discussed and distributed internationally. He lives in Los Angeles, CA.

    This piece originally appeared at The Daily Beast.

    Photo by Belle of Louisville.

  • Houston Rising—Why the Next Great American Cities Aren’t What You Think

    America’s urban landscape is changing, but in ways not always predicted or much admired by our media, planners, and pundits. The real trend-setters of the future—judged by both population and job growth—are not in the oft-praised great “legacy” cities like New York, Chicago, or San Francisco, but a crop of newer, more sprawling urban regions primarily located in the Sun Belt and, surprisingly, the resurgent Great Plains.

    While Gotham and the Windy City have experienced modest growth and significant net domestic out-migration, burgeoning if often disdained urban regions such as Houston, Dallas-Ft. Worth, Charlotte, and Oklahoma City have expanded rapidly. These low-density, car-dominated, heavily suburbanized areas with small central cores likely represent the next wave of great American cities.

    There’s a whole industry led by the likes of Harvard’s Ed Glaeser, my occasional sparring partner Richard Florida and developer-funded groups like CEOs for Cities, who advocate for old-style, high-density cities, and insist that they represent the inevitable future.

    But the numbers tell a different story: the most rapid urban growth is occurring outside of the great, dense, highly developed and vastly expensive old American metropolises.

    An aspirational city, by definition, is one that people and industries migrate to improve their economic prospects and achieve a better relative quality of life. In the 19th and early 20th centuries, this aspirational spirit was epitomized by cities such as New York and Chicago and then in the decades after World War Two by Los Angeles, which for many years was the fastest-growing big city in the high-income world.

    Until the 1970s, the country’s established big cities were synonymous with aspiration—where the jobs and opportunities for broad portions of the population abounded. But as the financial markets took on an oversized role in the American economy and manufacturing receded, the cost of living in the nation’s oldest metropolises shot up far faster than the median income there—and Americans have turned elsewhere now that, as Virginia Postrel wrote in an important essay on the nation’s growing economic wall, “the promise of a better life that once drew people of all backgrounds to rich places like New York and [coastal] California now applies only to an educated elite—because rich places have made housing prohibitively expensive.”

    Like the great legacy cities during their now long-past adolescent and at times ungainly growth spurts, today’s aspirational cities often meet with little approval from travelers from other, older cities. A 19th-century Swedish visitor to Chicago described it as “one of the most miserable and ugly cities” in North America. New York, complained the French Consul in 1810, was a city where the inhabitants had “in general no mind for anything but business”; later Bostonian Ralph Waldo Emerson, granted Gotham’s entrepreneurial supremacy only to explain that his more cultured “little city” was “appointed” by destiny to “lead the civilization of North America.”

    Los Angeles, most of whose early-20th-century migrants came from the Midwest, became a favorite object of scorn from sophisticates. William Faulkner in the 1930s described the city of angels as “the plastic asshole of the world.” As the first great city built largely around the automobile, mainstream urbanists detested it; their icon Jane Jacobs called it “a vast blind-eyed reservation.”

    A half century later, today’s aspirational urban centers suffer similarly poor reputations among urbanists, planners and journalists. One New York Post reporter recently described Houston as “brutally ugly” while new urbanists like Andres Duany relegate the region to a netherworld inhabited by car-centric cities such as Phoenix and Atlanta.

    Yet over the past decade the 25 fastest-growing cities have been mostly such urbanist “assholes”—Raleigh, Austin, Houston, San Antonio, Las Vegas, Orlando, Dallas-Fort Worth, Charlotte, and Phoenix. Despite hopeful claims from density advocates that the Great Recession and the housing bust ended this trend, the latest census data shows that Americans have continued choosing places that are affordable enough to offer opportunity, and space.

    One common article of faith among mainstream urbanists, at least when they stop to note this growth at all, is that these cities grow mainly because they are cheap and can house the unskilled. But in reality many of these metropolitan areas are also leading the nation in growing their number of well-educated arrivals. Houston, Charlotte, Raleigh, Las Vegas, Nashville, and San Antonio, for example, experienced increases in the number of college-educated residents of nearly 40 percent or more over the decade, roughly twice the level of growth as in “brain centers” such as Boston, San Francisco, San Jose (Silicon Valley), or Chicago. Atlanta, Houston, and Dallas each have added about 300,000 college grads in the past decade, more than greater Boston’s pickup of 240,000 or San Francisco’s 211,000.

    Once considered backwaters, these Sunbelt cities are quietly achieving a critical mass of well-educated residents. They are also becoming major magnets for immigrants. Over the past decade, the largest percentage growth in foreign-born population has occurred in sunbelt cities, led by Nashville, which has doubled its number of immigrants, as have Charlotte and Raleigh. During the first decade of the 21st century, Houston attracted the second-most new, foreign-born residents, some 400,000, of any American city—behind only much larger New York and slightly ahead of Dallas-Ft. Worth, but more than three times as many as Los Angeles. According to one recent Rice University study, Census data now shows that Houston has now surpassed New York as the country’s most racially and ethnically diverse metropolis.

    Why are these people flocking to the aspirational cities, that lack the hip amenities, tourist draws, and cultural landmarks of the biggest American cities? People are still far more likely to buy a million dollar pied à terre in Manhattan than to do so in Oklahoma City. Like early-20th-century Polish peasants who came to work in Chicago’s factories or Russian immigrants, like my grandparents, who came to New York to labor in the rag trade, the appeal of today’s smaller cities is largely economic. The foreign born, along with generally younger educated workers, are canaries in the coal mine—singing loudest and most frequently in places that offer both employment and opportunities for upward mobility and a better life.

    Over the decade, for example, Austin’s job base grew 28 percent, Raleigh’s by 21 percent, Houston by 20 percent, while Nashville, Atlanta, San Antonio, and Dallas-Ft. Worth saw job growth in the 14 percent range or better. In contrast, among all the legacy cities, only Seattle and Washington D.C.—the great economic parasite—have created jobs faster than the national average of roughly 5 percent. Most did far worse, with New York and Boston 20 percent below the norm; big urban regions including Philadelphia, Los Angeles, and, despite the current tech bubble, San Francisco have created essentially zero new jobs over the decade.

    Another common urban legend maintains these areas lag in terms of higher-wage employment, lacking the density essential for what boosters like Glaeser and Florida describe as “knowledge-intensive cities.” Defenders of traditional cities often cite Santa Fe Institute research that they say links innovation with density—but actually does nothing of the kind. Rather, that research suggests that size, not compactness, constitutes the decisive factor. After all, it’s hard to define Silicon Valley, still the nation’s premier innovation region, as anything other than large, sprawling, and overwhelmingly suburban in form.

    Size does matter and many of the fastest growth areas are themselves large enough to sport a major airport, large corporate presences and other critical pieces of economic infrastructure. The largest gains in GDP (PDF) in 2011 were in Houston, Dallas and, surprisingly, resurgent greater Detroit (and that despite its shrinking urban core). None of these areas are characterized by high density yet their income growth was well ahead of Seattle, San Francisco, or Boston, and more than twice that of New York, Washington, or Chicago.

    But in fact neither density nor size necessarily determine which regions generate new high-end jobs. The growth in STEM—or science-technology-engineering and mathematics-related—employment in Houston, Raleigh, Nashville, Austin, and Las Vegas surpassed that in San Francisco, Los Angeles, Boston, or New York. One reason: most STEM jobs are not found in fashionable fields like designing social media or videogames but in more prosaic activities tied to medicine, manufacturing, agriculture and (horror of horrors) natural resource extraction, including fossil fuel energy. In this sense, technology reflects the definition of the French sociologists Marcel Mauss as “a traditional action made effective.”

    This pattern also extends to growth in business and professional services, the nation’s biggest high-wage job category. Since 2000, Houston, Dallas-Fort Worth, Charlotte, Austin and Raleigh expanded their number of such jobs by twenty percent or more—twice the rate as greater New York, the longtime business-service capital, while Chicago and San Jose actually lost jobs in this critical category.

    Finally there is the too often neglected topic of real purchasing power—that a dollar in New York doesn’t go nearly as far as one in Atlanta, for example. My colleague Mark Schill at the Praxis Strategy group has calculated the average regional paycheck, adjusted for cost of living. Houston led the pack in real median pay in, and seven of the 10 cities with the highest adjusted salary were aspirational ones (the exceptions were San Jose-Silicon Valley, Seattle, and the greater Detroit region). Portland, Los Angeles, New York, and San Diego all landed near the bottom of the list.

    Conventional urbanists—call them density nostalgists—continue to see the future in legacy cities that, as the University of Washington demographer Richard Morrill notes, were built out before the dominance of the car, air-conditioning and with them the prevalence of suburban lifestyles.

    Looking forward, it is simply presumptuous and ahistorical to dismiss the fast-growing regions as anti-cities, as 60s-era urbanists did with places like Los Angeles. When tradition-bound urbanists hope these sprawling young cities choke on their traffic and exhaust fumes, or from rising energy costs, they are reflecting the classic prejudice of city-dwellers of established urban centers toward upstarts.

    The reality is that most urban growth in our most dynamic, fastest-growing regions has included strong expansion of the suburban and even exurban fringe, along with a limited resurgence in their historically small inner cores. Economic growth, it turns out, allows for young hipsters to find amenable places before they enter their 30s, and affordable, more suburban environments nearby to start families.

    This urbanizing process is shaped, in many ways, by the late development of these regions. In most aspirational cities, close-in neighborhoods often are dominated by single-family houses; it’s a mere 10 or 15 minute drive from nice, leafy streets in Ft. Worth, Charlotte, or Austin to the urban core. In these cities, families or individuals who want to live near the center can do without being forced to live in a tiny apartment.

    And in many of these places, the historic underdevelopment in the central district, coupled with job growth, presents developers with economically viable options for higher-density housing as well. Houston presents the strongest example of this trend. Although nearly 60 percent of Houston’s growth over the decade has been more than 20 miles outside the core, the inner ring area encompassed within the loop around Interstate 610 has also been growing steadily, albeit at a markedly slower rate. This contrasts with many urban regions, where close-in areas just beyond downtowns have been actually losing population.

    Even as Houston has continued to advance outwards, the region has added more multiunit housing over the past decade than more populous New York, Los Angeles or Chicago. With its economy growing faster and producing wealth faster than any other region in the country, urban developers there usually do not need subsidies or planning dictates to be economically viable.

    Modern urban culture also is spreading in the Bayou City. In what has to be a first, my colleagues at Forbes recently ranked Houston as America’s “coolest city,” citing not only its economy, but its thriving arts scene and excellent restaurants. Such praise may make some of us, who relish Houston’s unpretentious nature, a little nervous—but it shows that hip urbanism can co-exist with rapidly expanding suburban development.

    And Houston’s not the only proverbial urban ugly duckling having an amenity makeover. Oklahoma City has developed its central “Bricktown” into a centerpiece for arts and entertainment. Ft. Worth boasts its own, cowboy-themed downtown, along with fine museums, while its rival Dallas, in typical Texan fashion, boasts of having the nation’s largest arts district.

    More important still, both for families and outdoor-oriented singles, both cities are developing large urban park systems. At an expense of $30 million, Raleigh is nearing the completion of its Neuse River Greenway Trail, a 28-mile trail through the forested areas of Raleigh. Houston has plans for a series of bayou-oriented green ways. For its part, Dallas is envisioning a vast new 6,000 acre park system, along the Trinity River that will dwarf New York’s 840-acre Central Park.

    To be sure, there’s no foreseeable circumstance in which these cities will challenge Paris or Buenos Aires, New York, or San Francisco as favored destinations for those primarily motivated by aesthetics that are largely the result of history. Nor are they likely to become models of progressive governance, as poverty and gaps in medical coverage become even more difficult problems for elected officials without a well-entrenched ultra-wealthy class to cull resources from.

    Finally, they will not become highly dense, apartment cities — as developers and planners insist they “should.” Instead the aspirational regions are likely to remain dominated by a suburbanized form characterized by car dependency, dispersion of job centers, and single-family homes. In 2011, for example, twice as many single-family homes sold in Raleigh as condos and townhouses combined. The ratio of new suburban to new urban housing, according to the American Community Survey, is 10 to 1 in Las Vegas and Orlando, 5 to 1 in Dallas, 4 to 1 in Houston and 3 to 1 in Phoenix.

    Pressed by local developers and planners, some aspirational cities spend heavily on urban transit, including light rail. To my mind, these efforts are largely quixotic, with transit accounting for five percent or less of all commuters in most systems. The Charlotte Area Transit System represents less a viable means of commuting for most residents than what could be called Manhattan infrastructure envy. Even urban-planning model Portland, now with five radial light rail lines and a population now growing largely at its fringes, carries a smaller portion of commuters on transit than before opening its first line in 1986.

    But such pretentions, however ill-suited, have always been commonplace for ambitious and ascending cities, and are hardly a reason to discount their prospects. Urbanistas need to wake up, start recognizing what the future is really looking like and search for ways to make it work better. Under almost any imaginable scenario, we are unlikely to see the creation of regions with anything like the dynamic inner cores of successful legacy cities such as New York, Boston, Chicago or San Francisco. For better or worse, demographic and economic trends suggest our urban destiny lies increasingly with the likes of Houston, Charlotte, Dallas-Ft. Worth, Raleigh and even Phoenix.

    The critical reason for this is likely to be missed by those who worship at the altar of density and contemporary planning dogma. These cities grow primarily because they do what cities were designed to do in the first place: help their residents achieve their aspirations—and that’s why they keep getting bigger and more consequential, in spite of the planners who keep ignoring or deploring their ascendance.

    Joel Kotkin is executive editor of NewGeography.com and a distinguished presidential fellow in urban futures at Chapman University, and a member of the editorial board of the Orange County Register. He is author of The City: A Global History and The Next Hundred Million: America in 2050. His most recent study, The Rise of Postfamilialism, has been widely discussed and distributed internationally. He lives in Los Angeles, CA.

    This piece originally appeared in the The Daily Beast.

    Photo by telwink.