Tag: Indianapolis

  • Moving from the Coast

    For years both government and media have been advancing the notion that   America’s coastal counties are obtaining most of the population growth at the expense of interior counties. For example, the National Oceanic and Atmospheric Administration reported in the 1990s: Coastal areas are crowded and becoming more so every day. More than 139 million people–about 53% of the national total–reside along the narrow coastal fringes.

    NOAA went on to say that the population of the coastal counties is expected to increase by an average of 3600 people per day and noted further that the coastal counties were growing faster than the nation as a whole. NOAA has designated 673 counties on four coasts (Atlantic, Gulf, Pacific and Great Lakes) in the contiguous United States, Hawaii and Alaska as coastal counties.

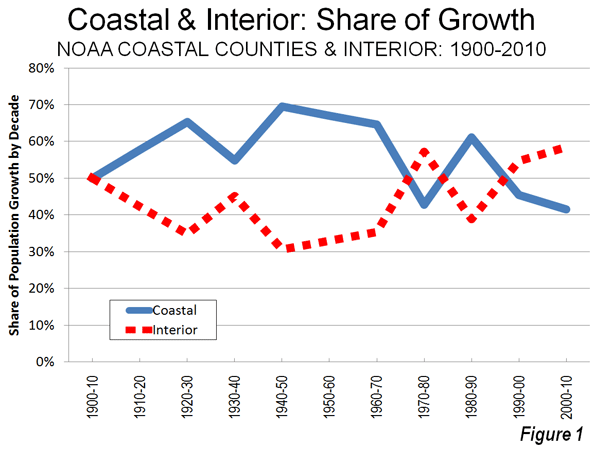
    Population Growth: In fact, coastal counties are not growing faster than the nation as a whole and were not when NOOA issued the 1990s report. For most of the last 40 years, the nation’s interior counties have been adding more population. From 1970 to 2010, interior counties added 55.7 million new residents, compared to 49.7 million new residents in coastal counties. This is a reversal from 1940 to 1970, when two thirds of the nation’s population growth was in the coastal counties.

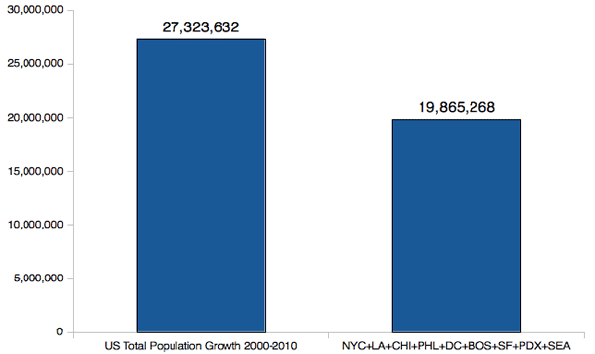
    The trends today actually have become more favorable for the interior than at any time in a century. From 2000 to 2010, the interior counties captured more of the nation’s growth than in any decade since 1900 (Table). From 2000 to 2010, the interior counties added 16.0 million residents, 59.6 percent of the nation’s growth compared to 11.4 million new residents in the coastal counties.

    Coastal and Interior Population: Counties
    1900-2010
    Coastal Counties Interior Counties United States
    Year Population Share Change Population Share Change Population Change
    1900         30.2 39.7%         46.0 60.3%         76.2
    1910         38.2 41.4%           8.0         54.0 58.6%           8.0         92.2         16.0
    1920         46.2 43.6%           8.0         59.8 56.4%           5.8       106.0         13.8
    1930         57.4 46.6%         11.2         65.8 53.4%           6.0       123.2         17.2
    1940         62.3 47.1%           4.9         69.8 52.9%           4.0       132.2           9.0
    1950         75.2 49.9%         12.9         75.5 50.1%           5.7       150.7         18.5
    1960         94.4 52.6%         19.2         85.0 47.4%           9.5       179.3         28.6
    1970       109.9 54.0%         15.6         93.5 46.0%           8.5       203.4         24.1
    1980       119.8 52.9%           9.9       106.7 47.1%         13.2       226.5         23.2
    1990       133.4 53.6%         13.6       115.3 46.4%           8.6       248.7         22.2
    2000       148.2 52.7%         14.9       133.2 47.3%         17.9       281.4         32.7
    2010       159.6 51.7%         11.4       149.1 48.3%         16.0       308.7         27.3
    Population in Millions
    Calculated from US Census Bureau Data
    Coastal counties designated by NOAA (673 counties)
    Totals may vary due to rounding


    As of 2010, the coastal counties have 51.7 percent of the nation’s population, having dropped from 52.7 percent in 2000 and a peak of 54.0 percent in 1970 (Figure 1). Rather than adding 3600 new people every day, coastal counties added 3100 people per day, while interior counties added 4400 per day during the 2000s. A smaller sample of 559 counties that was examined by economists Jordan Rapaport and Jeffrey Sachs in the early 2000s experienced an even more pronounced movement away from the coasts between 2000 and 2010, with more than 60 percent of the nation’s growth taking place in the interior counties.

    There may also be some concern about density in coastal counties.   Yet Malthusian fears need not grip coastal residents. With a population density of approximately 315 per square mile (120 per square kilometer), the coastal counties of the contiguous United States have only a slightly higher density than the post-enlargement 27-nation European Union. The coastal counties have a density one-half that of Germany. In contrast, the interior counties are far less dense, at 60 persons per square mile.

    There has also been significant change in coastal population trends since the middle 1990s. The largest Pacific Coast metropolitan areas, such as Los Angeles, San Francisco, San Diego, San Jose and Seattle have seen their growth slow considerably. In the 1990s, NOAA was projecting huge population increases for Los Angeles and San Diego counties. It appears likely that these 2015 projections will fall at least 600,000 short in both counties. Even Seattle, arguably the healthiest economically among the west coast metropolitan areas, is now growing more slowly than former laggards Oklahoma City, Indianapolis and Columbus in the interior.

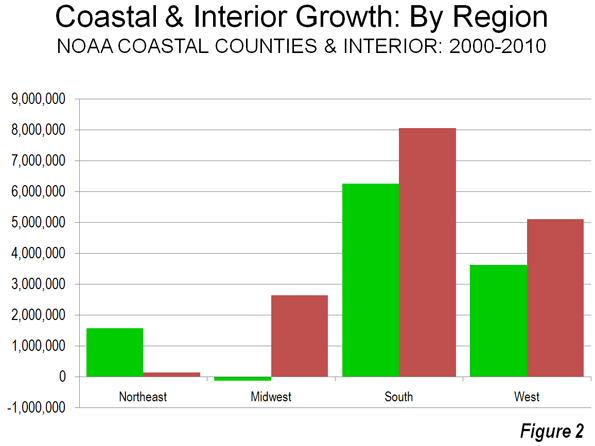
    Regional Population Growth: There was significant variation in growth among the varied regions of the country. In the Northeast, there was much stronger growth on the coast, which added 1.6 million people, compared to a gain of less than 150,000 in the interior. In the Midwest, the coastal counties (along the Great Lakes) lost 120,000 people, while the interior counties gained 2.7 million. In the South, the interior grew more, at 8.1 million, slightly more than 6.3 million in coastal counties.  In the West, interior counties gained 5.1 million people, while the coastal counties gained 3.7 million (Figure 2). This drop in coastal growth was a principal reason why the West grew less quickly than the South, which experienced the most robust coastal growth. For this reason, the West failed to be the nation’s fastest growing region for the first time since 1900.

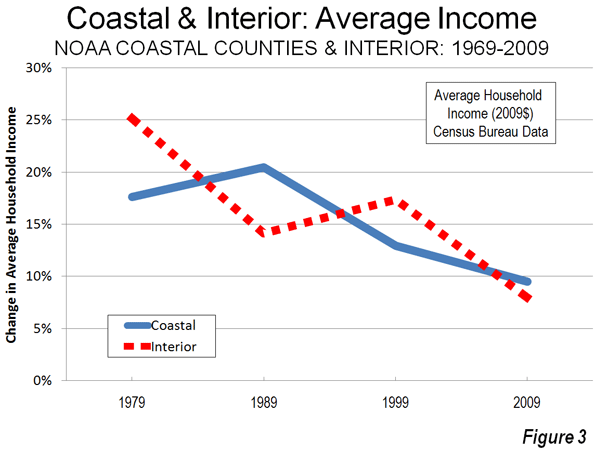
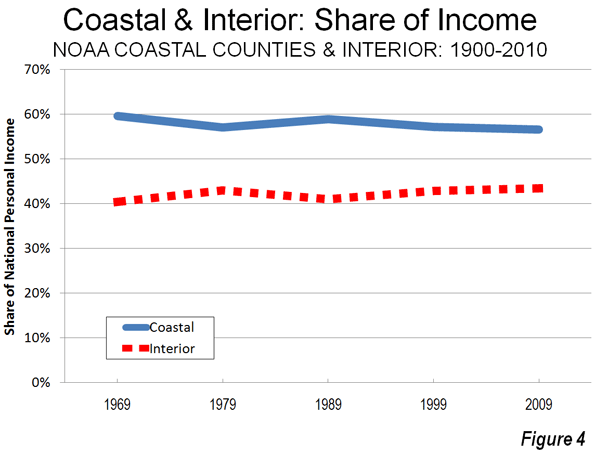
    Personal Income: Rappaport and Sachs noted in their early 2000s work that the density of economic activity was far greater in the coastal counties. Of course this is to be expected, due to their greater population density. However the data with respect to the distribution of personal income is less clear. Since 1969, coastal and interior counties have been alternating leadership in personal income growth per capita. During the 2000s, interior counties experienced average personal income growth slightly less than that of the coastal counties (Figure 3). However, average per capita income since 1970 has risen 81 percent, compared to a lower 75 percent in the coastal counties (adjusted for inflation).  Overall, the share of income in the interior counties has been growing modestly (Figure 4).

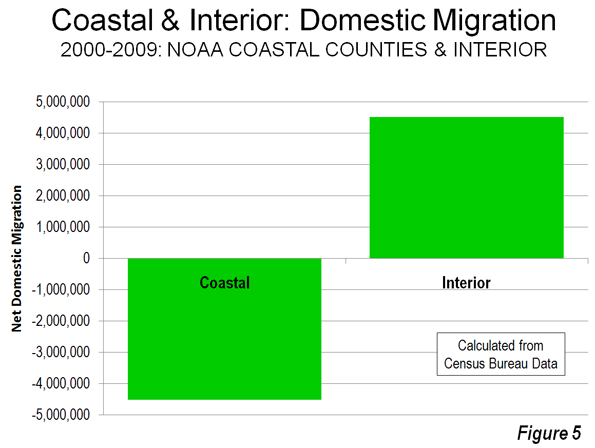
    Domestic Migration: The most important factor in the growth of the interior counties in the 2000s lies with net domestic migration, with more residents moving from the coastal counties to the interior counties. Between 2000 and 2009, 4.5 million people moved to the interior counties, while 4.5 million people moved away from the coastal counties, according to Census Bureau estimates (Figure 5).

    Rappaport and Sachs had theorized that the greater concentration of population and economic activity in the coastal counties could be reflective of a more attractive quality of life. The domestic migration data would suggest that, at least over the last decade, people are opting for the interior, perhaps sensing that the coastal quality of life may not be as affordable and accessible as in the past.  

    Cost of Living: The key here lies with the cost of living, which has become far higher on the coasts then in the interior. The most significant cost of living differences for households are in the cost of housing.   

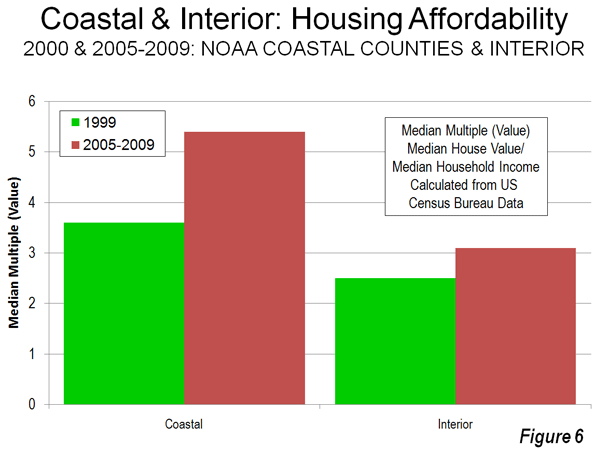
    From 2000 to 2009, housing affordability deteriorated markedly in the coastal counties. Census Bureau data indicates that the Median Multiple (median house founded divided by median household income) rose from 3.6 to 5.4 in the coastal counties (population weighted). By contrast, housing affordability worsened far less in the interior counties, where the Median Multiple rose from 2.5 to 3.1. Thus, the median household saw owned housing increase 22 months worth of income in value in coastal counties, compared to seven months worth of income in interior counties (Figure 6). At the same time, these higher coastal house prices developed as demand for housing was dropping substantially, with 4.5 million people moving away from coastal counties (above).

    Many of the coastal counties have strong land use regulation (smart growth or urban containment regulation), especially in California, Oregon, Washington, Florida and the metropolitan areas of Boston, New York and Washington. A considerable body of research, both econometric and descriptive, has associated more restrictive land use regulation (called smart growth, urban consolidation or urban containment) with higher house price increases, reaching back at least to the seminal 1970s work by Sir Peter Hall and his associates in the United Kingdom. It thus seems likely that the deterioration of housing affordability in coastal counties is materially associated with their less robust growth. The quality of life on the coasts may simply have become too expensive.

    The Future? It is unclear whether the recent higher population growth rates, stronger migration trends and improved economic performance of the interior will continue into the future. The 1940 to 1970 dominance of the coastal counties surged as coastal metropolitan areas, especially in Florida and California, grew much more quickly. Now that pattern has been reversed.  More favorable trends over the past 40 years in the interior counties seem likely continue, unless coastal house prices and the cost of living begin to swing back toward the national norm.

    —-

    Note: Complete county data is at County Coastal Population (also attached to this article)

    Photograph: San Diego, which experienced greater domestic outmigration than Pittsburgh in the 2000s.

  • The Next Boom Towns In The U.S.

    What cities are best positioned to grow and prosper in the coming decade?

    To determine the next boom towns in the U.S., with the help of Mark Schill at the Praxis Strategy Group, we took the 52 largest metro areas in the country (those with populations exceeding 1 million) and ranked them based on various data indicating past, present and future vitality.

    We started with job growth, not only looking at performance over the past decade but also focusing on growth in the past two years, to account for the possible long-term effects of the Great Recession. That accounted for roughly one-third of the score.  The other two-thirds were made up of a a broad range of demographic factors, all weighted equally. These included rates of family formation (percentage growth in children 5-17), growth in educated migration, population growth and, finally, a broad measurement of attractiveness to immigrants — as places to settle, make money and start businesses.

    We focused on these demographic factors because college-educated migrants (who also tend to be under 30), new families and immigrants will be critical in shaping the future.  Areas that are rapidly losing young families and low rates of migration among educated migrants are the American equivalents of rapidly aging countries like Japan; those with more sprightly demographics are akin to up and coming countries such as Vietnam.

    Many of our top performers are not surprising. No. 1 Austin, Texas, and No. 2 Raleigh, N.C., have it all demographically: high rates of immigration and migration of educated workers and healthy increases in population and number of children. They are also economic superstars, with job-creation records among the best in the nation.

    Perhaps less expected is the No. 3 ranking for Nashville, Tenn. The country music capital, with its low housing prices and pro-business environment, has experienced rapid growth in educated migrants, where it ranks an impressive fourth in terms of percentage growth. New ethnic groups, such as Latinos and Asians, have doubled in size over the past decade.

    Two advantages Nashville and other rising Southern cities like No. 8 Charlotte, N.C., possess are a mild climate and smaller scale. Even with population growth, they do not suffer the persistent transportation bottlenecks that strangle the older growth hubs. At the same time, these cities are building the infrastructure — roads, cultural institutions and airports — critical to future growth. Charlotte’s bustling airport may never be as big as Atlanta’s Hartsfield, but it serves both major national and international routes.

    Of course, Texas metropolitan areas feature prominently on our list of future boom towns, including No. 4 San Antonio, No. 5 Houston and No. 7 Dallas, which over the past years boasted the biggest jump in new jobs, over 83,000. Aided by relatively low housing prices and buoyant economies, these Lone Star cities have become major hubs for jobs and families.

    And there’s more growth to come. With its strategically located airport, Dallas is emerging as the ideal place for corporate relocations. And Houston, with its burgeoning port and dominance of the world energy business, seems destined to become ever more influential in the coming decade. Both cities have emerged as major immigrant hubs, attracting on newcomers at a rate far higher than old immigrant hubs like Chicago, Boston and Seattle.

    The three other regions in our top 10 represent radically different kinds of places. The Washington, D.C., area (No. 6) sprawls from the District of Columbia through parts of Virginia, Maryland and West Virginia. Its great competitive advantage lies in proximity to the federal government, which has helped it enjoy an almost shockingly   ”good recession,” with continuing job growth, including in high-wage science- and technology-related fields, and an improving real estate market.

    Our other two top ten, No. 9 Phoenix, Ariz., and No. 10 Orlando, Fla., have not done well in the recession, but both still have more jobs now than in 2000. Their demographics remain surprisingly robust. Despite some anti-immigrant agitation by local politicians, immigrants still seem to be flocking to both of these states. Known better s as retirement havens, their ranks of children and families have surged over the past decade. Warm weather, pro-business environments and, most critically, a large supply of affordable housing should allow these regions to grow, if not in the overheated fashion of the past, at rates both steadier and more sustainable.

    Sadly, several of the nation’s premier economic regions sit toward the bottom of the list, notably former boom town Los Angeles (No. 47). Los Angeles’ once huge and vibrant industrial sector has shrunk rapidly, in large part the consequence of ever-tightening regulatory burdens. Its once magnetic appeal to educated migrants faded and families are fleeing from persistently high housing prices, poor educational choices and weak employment opportunities. Los Angeles lost over 180,000 children 5 to 17, the largest such drop in the nation.

    Many of L.A.’s traditional rivals — such as Chicago (with which is tied at No. 47), New York City (No. 35) and San Francisco (No. 42) — also did poorly on our prospective list.  To be sure,  they will continue to reap the benefits of existing resources — financial institutions, universities and the presence of leading companies — but their future prospects will be limited by their generally sluggish job creation and aging demographics.

    Of course, even the most exhaustive research cannot fully predict the future. A significant downsizing of the federal government, for example, would slow the D.C. region’s growth. A big fall in energy prices, or tough restrictions of carbon emissions, could hit the Texas cities, particularly Houston, hard. If housing prices stabilize in the Northeast or West Coast, less people will flock to places like Phoenix, Orlando or even Indianapolis (No.11) , Salt Lake City (No. 12) and Columbus (No. 13). One or more of our now lower ranked locales, like Los Angeles, San Francisco and New York, might also decide to reform in order to become more attractive to small businesses and middle class families.

    What is clear is that well-established patterns of job creation and vital demographics will drive future regional growth, not only in the next year, but over the coming decade.  People create economies and they tend to vote with their feet when they choose to locate their families as well as their businesses.  This will prove   more decisive in shaping future growth   than the hip imagery and big city-oriented PR flackery that dominate media coverage of America’s changing regions.

    Cities of the Future Rankings
    Rank Metropolitan Area
    1 Austin, TX
    2 Raleigh, NC
    3 Nashville, TN
    4 San Antonio, TX
    5 Houston, TX
    6 Washington, DC-VA-MD-WV
    7 Dallas-Fort Worth, TX
    8 Charlotte, NC-SC
    8 Phoenix, AZ
    10 Orlando, FL
    11 Indianapolis, IN
    12 Salt Lake City, UT
    13 Columbus, OH
    14 Jacksonville, FL
    15 Atlanta, GA
    16 Las Vegas, NV
    16 Riverside, CA
    18 Portland, OR-WA
    19 Denver, CO
    20 Oklahoma City, OK
    21 Baltimore, MD
    22 Louisville, KY-IN
    22 Richmond, VA
    24 Seattle, WA
    25 Kansas City, MO-KS
    26 San Diego, CA
    27 Miami, FL
    28 Tampa, FL
    29 Sacramento, CA
    30 Birmingham, AL
    31 New Orleans, LA
    32 Philadelphia, PA-NJ-DE-MD
    33 Minneapolis, MN-WI
    34 St. Louis, MO-IL
    35 Cincinnati, OH-KY-IN
    35 New York, NY-NJ-PA
    37 Boston, MA-NH
    38 Memphis, TN-MS-AR
    39 Pittsburgh, PA
    40 Virginia Beach, VA-NC
    41 Rochester, NY
    42 Buffalo, NY
    42 San Francisco, CA
    44 Hartford, CT
    45 Milwaukee, WI
    45 San Jose, CA
    47 Chicago, IL-IN-WI
    47 Los Angeles, CA
    49 Providence, RI-MA
    50 Detroit, MI
    51 Cleveland, OH

    This piece originally appeared at Forbes.com.

    Joel Kotkin is executive editor of NewGeography.com and is a distinguished presidential fellow in urban futures at Chapman University, and an adjunct fellow of the Legatum Institute in London. He is author of The City: A Global History. His newest book is The Next Hundred Million: America in 2050, released in February, 2010.

    Photo by Exothermic Photography

  • Rethinking Urban Dynamics: Lessons from the Census

    Much has been made of the vaunted “back to the city” movement by “the young and restless,” young professionals, the creative class, empty nesters and others were voting with their feet in favor of cities over suburbs.  Although there were bright spots, the Census 2010 results show that the trend was very overblown, affecting mostly downtown and near downtown areas, while outlying ones bled population.  One culprit for this discrepancy seems to be that the intra-census estimates supplied by the Census Bureau were inflated – in some cases very inflated.

    Looking at selected core cities for major US metropolitan areas, many of them were materially over-estimated:


    One particularly egregious case relates to Atlanta. Its huge projected population increase in the 2000s led me to describe it as “one of America’s top urban success stories.”  The reality proved to be quite different. Rather than strong population growth in the city, the population growth turned out to be basically flat, quite a different story.  Other declines might be more predictable, such as Detroit, or those who had previously challenged estimates like Cincinnati and St. Louis.  Still, even urban cores in rapidly growing regions like Dallas and Houston were not immune from this trend.

    There were some exceptions. Cities like Indianapolis, Columbus, and Oklahoma City came in slightly ahead of expectations, but the number of cities with misses and the sizes of the positive and negative misses tilted towards the down direction.

    It seems clear now that the justification for much of the “back to the city” story reflected bad estimates. People can’t be faulted for relying on the official government numbers – I did. But the reality of the 2010 Census, as demonstrated by Wendell Cox and others, is that the 1990s were actually better for urban population growth in America than the 2000s in many respects.

    One legitimate bright spot for cities lay in the growth of downtown and near downtown areas.  Though often starting from low bases, these areas often showed impressive increases.  For example, St. Louis showed good growth downtown despite a very disappointing decline in total city population:

    The poster child for this phenomenon was Chicago, where a fairly expansive area in the greater core showed large population growth.  Areas that were formerly almost all commercial, such as the Loop, added significant residential population, while areas that were nearly derelict like the near South Side have blossomed into thriving upscale neighborhoods.


    The problem, from places ranging from Chicago to Cleveland, is that the gains in the “core of the core” have been more than offset by losses elsewhere, especially the flight of blacks and other minorities – many of them immigrants – to the increasingly diverse suburbs.

    Cities across America have invested enormous sums into downtown redevelopment and major projects in selected districts.  The good news: these investments have shown some ability to move the needle in terms of attracting young professionals downtown.  The bad news lies with the fact that these developments have been extremely costly, and have not transformed the overall demographic or economic climates of the cities that tried them.  This demonstrates the limits of the policies.  Those who aren’t in the young professional, empty nester, or creative class demographic have rightly figured out that they are no longer the target market of city leadership. No surprise then that many of them    have decided to vote with their feet.

    Given the resulting overall negative swings, cities may want to revisit their strategy of putting all their chips in the downtown redevelopment basket in favor of less glamorous improvements in basic neighborhood safety, services, schools and other critical elements.  A handful of elite enclaves and talent hubs may be able to thrive on a “favored demographic quarter” strategy, but for most places there just aren’t enough young professionals and artists to go around.

    Aaron M. Renn is an independent writer on urban affairs based in the Midwest. His writings appear at The Urbanophile.

    * Actual population minus projected population as of 4/1/2010 using a run rate projection based on the 2008-2009 estimated population growth.
    ** Base is the projected 4/1/2010 population above.

    Photo by Ian Freimuth

  • What The Census Tells Us About America’s Future

    With the release of results for over 20 states, the 2010 Census has provided some strong indicators as to the real evolution of the country’s demography. In short, they reveal that Americans are continuing to disperse, becoming more ethnically diverse and leaning toward to what might be called “opportunity” regions.

    Below is a summary of the most significant findings to date, followed by an assessment of what this all might mean for the coming decade.

    Point One: America is becoming more suburban.

    For much of the past decade, there has been a constant media drumbeat about the “return to the cities.” Urban real estate interests, environmentalists and planners have widely promoted this idea, and it has been central to the ideology of the Obama administration, the most big-city dominated in at least a half century. “We’ve reached the limits of suburban development,” Housing Secretary Shaun Donovan opined last February, “People are beginning to vote with their feet and come back to the central cities.”

    Donavan and others cite such things as the energy price spike in the mid-aughts as well as the mortgage crisis as contributing to the “back to the city” trend. Yet in reality the actual numbers suggest that Donavan and his cronies may need a serious reality check. The Census reveals that, contrary to the “back to the city” rhetoric, suburban growth continues to dominate in most regions of the country, constituting between 80% and 100% of all growth in all but three of the 16 metropolitan areas reporting.

    This includes sprawling regions like Houston, “smart growth areas like Seattle and Portland  (where suburbs accounted for more than 80% of all growth over the decade) and Midwestern regions like St. Louis, which like Chicago saw a sharp decline in the urban population. The only exceptions have been Oklahoma City, Austin or San Antonio, with vast expanses still allowing for much of new development to take place within the city limits.

    To be sure, no one should pretend that urban fortunes have sunk to their 1970s nadir. Yet overall, central cities, which accounted for a 11% of metropolitan growth in the 1990s, constituted barely 4% of the growth in the last decade.  Some core cities, notably Chicago, have shrunk after making gains in the ’90s. Indeed Chicago — the president’s adopted hometown and the poster child of the urban “comeback” — took what analyst Aaron Renn humorously dubbed “a Census shellacking,” losing some 200,000 people, while the outer suburban ring continued to grow and diversify their populations. The Windy City’s population is now down to the lowest level since the 1910 Census.

    Point Two: America is becoming more diverse, and the diversity is spreading.

    The racial reordering of America is proceeding apace. Nowhere is this more clear than in Texas, where Hispanic and Asian populations have driven much of the state’s demographic growth. Latinos alone now account for roughly 38% of all Texans. Immigration rates in Dallas and Houston  are now higher than for Chicago, Washington, Seattle and Atlanta. Texas, notes long-time observer Candace Evans, is becoming the country’s premier laboratory for promoting a successful diversity.

    There are other major shifts in ethnic demographics. For one thing, minorities continue to head to the suburban rings around most major cities. African-Americans and even Latinos may be fleeing places like Chicago, but they continue to move in large numbers to suburban locales in surrounding Illinois counties. , especially south of the city.  Others appear to  have headed to places like the traditional black-opportunity magnet of Atlanta and or other southern hubs, such as Nashville.

    Another trend appears to be the migration of ethnic minorities to areas that, in the past, have been primarily white. This is clear in the thriving Indianapolis area, where the African-American population grew by 28% and the Hispanic population by 161%, or some 56,000 souls.   Look for more minority growth in such areas which have the advantage of affordable housing, robust economies and better than average job growth.

    3. The Shift to “Opportunity Regions”

    As the economy slid in the last years of the decade, population growth slowed, particularly in some Sun Belt states, such as Florida and Nevada, that thrived during the bubble. In contrast newcomers flocked to places, notably in the Texas cities, that offered better prospects. Austin, San Antonio, Houston and Dallas-Ft. Worth regions all grew by 20% or more over the decade.

    The key here seems to be affordability and jobs. As economist Mark Sharpe has illustrated, Texas private sector job growth last year was 2.7%, compared with 1% nationally. Unfortunately, unemployment remains over 8%, since of this growth was absorbed by newcomers. In contrast, places with the slowest, or negative growth, tend also to be losing jobs. For example, although the residential population of Chicago’s loop tripled in the past decade to 20,000,the famed business district lost almost 65,000 jobs.

    But it’s not just Sun Belt cities that are gaining on places like Chicago.  Indianapolis has emerged as a different kind of “opportunity region.” It lacks the dynamism and diversity of the Texas cities, but it has continued to attract people from all over the country, including the surrounding rural or old Rust Belt parts of the state. Overall the Indianapolis region grew nearly 15% over the decade, roughly 50% higher than the national average, as much as Portland and more than Seattle.

    In contrast, growth seems to be slowing in some formerly hot areas. Population increases for Seattle, Portland and Denver were around 14%,  about half the rate of the previous decade. Part of this may have to do with high unemployment, particularly in Oregon, and high housing prices. Still, these three areas continue to grow much faster than regions such as Chicago, St. Louis or Baltimore where growth struggled in the single digits

    Possible Long-term Implications

    These shifts suggest that the Obama administration might want to rethink its high-density and urban-oriented strategy. Despite all the media focus on an imagined “back to the city” movement, Americans continue to disperse to “opportunity regions” and toward the suburbs. As a result, expect generally conservative-leaning suburbs and exurbs to gain more power after reapportionment and core city influence to decline further.

    Yet the Census numbers also have some unsettling aspects for Republicans. The increasing minority population even in heartland states such as Indiana, not to mention Texas, could undermine GOP gains, particularly if the party listens to its strong nativist wing. Diversification in the suburbs could ultimately turn some of these areas to the center or even left.

    The new American generation arising in the census will be increasingly diverse. A growing portion will consist of the children of immigrants, and they will be predominately English-speaking.  This suggests a more active and engaged minority population, perhaps susceptible to a pro-growth GOP message and the economy of “opportunity regions” but likely hostile to overtly anti-immigrants posturing.

    Whatever your politics or economic interests, the Census suggests that the country is changing in dramatic way– if not always in the ways often predicted by pundits, planners or the media. It usually makes more sense  to study  the actual numbers, than follow the wishful thinking of largely urban-centric, big-city-based and often quite biased analysts.

    This piece originally appeared at Forbes.com

    Joel Kotkin is executive editor of NewGeography.com and is a distinguished presidential fellow in urban futures at Chapman University, and an adjunct fellow of the Legatum Institute in London. He is author of The City: A Global History. His newest book is The Next Hundred Million: America in 2050, released in February, 2010.

    Indianapolis Photo by IndySawmill

  • Census 2010: Urbanizing Indiana

    The first Census results for Indiana were recently released, painting a picture of an increasingly metropolitan state.  Indianapolis continues to be the growth champion as its strong economy attracted people from the rest of the state, as well as increasingly diverse populations.  Although  the core of Indianapolis fell well below expectations, its population did not fall like that of Chicago. In a switch from some other regions, the outer suburbs also lagged expectations while inner suburbs boasted a robust performance.

    Population Change in Indiana

    The map below shows how Indiana’s counties faired between Census 2000 and 2010, with counties gaining population in black, and those losing population it in red.

    Many rural and small industrial counties either shrank or posted anemic population growth while most metro counties, especially suburban ones, were standouts.  This is particularly illustrated by this map highlighting only those counties that grew faster than the statewide average:


    This list features heavily counties in suburban Indianapolis, Cincinnati, Louisville, and Chicago, as well as areas near midsized cities like Fort Wayne and Evansville.  Big Ten college towns Bloomington and Lafayette also did well.

    Metro Indianapolis: Indiana’s Growth Champion

    But the clear population winner was metro Indianapolis, which grew at a rate 15.2%, nearly double the US average and well above that of the state:

    The growth even extended even to the central city/county, with Marion County breaking the 900,000 barrier.   The 231,137 people added by metro Indy was fully 57% of total statewide growth, even though that region only contained 25% of the state’s population in 2000.  Unsurprisingly, metro Indy added 15,000 jobs during the last decade  while the rest of the state shed nearly 200,000 of them.

    Indy Suburban Migration Missed Expectations, But No Core Renaissance Either

    Indianapolis showed some of the same urban core patterns as Chicago, which bodes ill for the back to the city story at the national level.  There is a city-county consolidation in effect which muddies the waters here, but the old township boundaries that are still reported by the Census Bureau as minor civil divisions can serve as a proxy for old boundaries.  Center Township covers most of what used to be the old City of Indianapolis, while the remaining townships constitute the Inner Suburbs and the collar counties the Outer Suburbs.

    Those of us who are urban boosters were excited that the Census Bureau estimates showed Center Township’s decades long population slide ending and even hitting an inflection point during the 2000s. Alas, these Census results demolished that notion as Center Township was shown to have lost 24,268 people, falling well short of estimated population in 2009.  Like Chicago, the inner city also featured a large black exodus.

    But the Outer Suburbs didn’t fare that well either, especially Hamilton County.  Long ranked among the fastest growing in the entire United States, I had been waiting to see if growth there might have been slightly above trend as in the past and put them over the 300,000 mark. It turns out to be a very different story, as Hamilton County’s 2010 population was 274,659, actually coming in below the 279,287 the Census Bureau had estimated in 2009. Still, the majority of regional growth was still in the Outer Suburbs, although less than estimated.

    This of course means that the Inner Suburbs did better than expected, particularly the southern ones of Perry and Franklin Townships, which still have some greenfield development opportunities left.  As in cities across the US, older Inner Suburbs of Indy have been experiencing their own problems as they aged. But this shows that the problems may not be as bad as feared.  Though the economy doubtlessly affected this, nevertheless it still buys additional time for transformations driven by demographic growth and entrepreneurship among immigrants and a burgeoning black middle class to take root.

    More Diversity, But Still Not That Diverse

    Indianapolis and Indiana grew more diverse during the 2000s particularly with Hispanic immigration. But again the changes were concentrated in metro areas.  And Indianapolis, long a very white city with a black minority, showed very strong growth in diversity, but still not enough to make this a truly diverse place in the manner of New York or Los Angeles.

    As in Chicago, the core lost black-only population, but other than that it was a very different story.  Metro Indy added 48,824 new blacks, a growth rate of 22.8% that outpaced overall growth.  This boosted black population share by nearly one percentage point.   Unlike Chicago, where local journalists are asking what happened to the city’s incredible shrinking black population, leading Indy black talk show host Amos Brown issued a press related titled “Blacks Fueled Indy’s Growth in 2010 Census Reports” to trumpet the black numbers there. One big reason might be: in contrast to Chicago, Indianapolis’ African-Americans did not have to flee south for jobs or affordable housing.

    The black core population decline in Indy seems less driven by gentrification than the prosaic concerns that generally drive suburbanization, such as safer streets,  better housing and schools.  This migration pattern is very evident in places like the Inner Suburban Lafayette Square area, which in addition to becoming a thriving immigrant business district is also home to large numbers of black owned businesses that are helping to transform this once decaying area.

    The state’s black population as a whole remains heavily concentrated in large urban areas, with Marion and Lake Counties accounting for 62% of the state’s total black population.

    Indy’s Hispanic growth surged as well, with 66,715 new Hispanics representing a 161% increase, though this is less than some expected. Hispanic population growth was more evenly spread, though from a total numbers perspective Indy and northern Indiana dominated the growth, as illustrated by the following chart of total Hispanic population growth in the last decade:

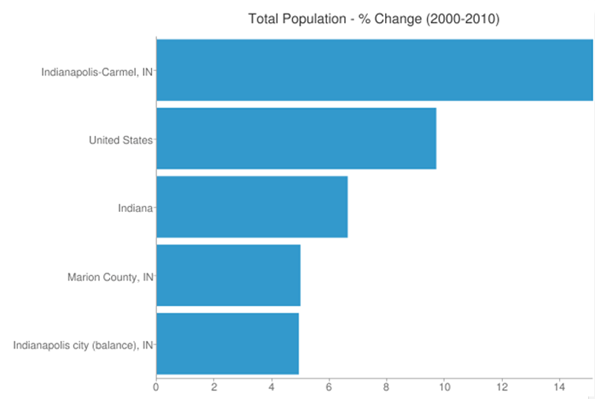
    Indy’s Asian population also more than doubled to almost 40,000..  Add this all up and the metro area non-Hispanic white-only population share dropped by six percentage points, but remains at 74.6%.  The city of Indianapolis itself is pushing 40% minority, however.  Regardless, this is still a material change and shows that metro Indy is a strong magnet not just for whites, but for pretty much everybody.  Its challenge is to continue building on this for the future, while the state’s challenge will be to  pull itself up to Indy’s level of demographic and economic performance.

    Aaron M. Renn is an independent writer on urban affairs based in the Midwest. His writings appear at The Urbanophile.

    Photo by Carl Van Rooy

  • The Still Elusive “Return to the City”

    Metropolitan area results are beginning to trickle in from the 2010 census. They reveal that, at least for the major metropolitan areas so far, there is little evidence to support the often repeated claim by think tanks and the media that people are moving from suburbs to the historical core municipalities. This was effectively brought to light in a detailed analysis of Chicago metropolitan area results by New Geography’s Aaron Renn. This article analyzes data available for the eight metropolitan areas with more than 1 million population for which data had been released by February 20.

    Summary: Summarized, the results are as follows. A detailed analysis of the individual metropolitan areas follows (Table 1).

    • In each of the eight metropolitan areas, the preponderance of growth between 2000 and 2010 was in the suburbs, as has been the case for decades. This has occurred even though two events – the energy price spike in mid-decade and the mortgage meltdown – were widely held to have changed this trajectory. On average, 4 percent of the growth was in the historical core municipalities, and 96 percent of the growth was in the suburbs (Figure 1).
    • In each of the eight metropolitan areas, the suburbs grew at a rate substantially greater than that of the core municipality. The core municipalities had an average growth from 2000 to 2010 of 3.2 percent. Suburban growth was 21.7 percent, nearly 7 times as great.  Overall, the number of people added to the suburbs was 14 times that added to the core municipalities.
    Table 1:
    Metropolitan Area Population: 2000-2010
    2000 Population
    Historical Core Municipality Suburbs Metropolitan Area
    Austin              656,562            593,201         1,249,763
    Baltimore              651,154         1,901,840         2,552,994
    Chicago           2,895,671         6,053,068         8,948,739
    Dallas-Fort Worth           1,188,580         3,972,964         5,161,544
    Houston           1,953,631         2,761,776         4,715,407
    Indianapolis              860,454            664,650         1,525,104
    San Antonio           1,144,646            567,057         1,711,703
    Washington              572,059         4,181,934         4,753,993
    Total           9,922,757       20,696,490       30,619,247
    2010 Population
    Austin              790,390            925,899         1,716,289
    Baltimore              620,961         2,089,528         2,710,489
    Chicago           2,695,598         6,599,081         9,294,679
    Dallas-Fort Worth           1,197,816         5,173,957         6,371,773
    Houston           2,099,451         3,846,449         5,945,900
    Indianapolis              903,393            852,848         1,756,241
    San Antonio           1,327,407            815,101         2,142,508
    Washington              601,723         4,883,034         5,484,757
    Total         10,236,739       25,185,897       35,422,636
    Change: 2000-2010
    Austin              133,828            332,698           466,526
    Baltimore              (30,193)            187,688           157,495
    Chicago             (200,073)            546,013           345,940
    Dallas-Fort Worth                 9,236         1,200,993         1,210,229
    Houston              145,820         1,084,673         1,230,493
    Indianapolis               42,939            188,198           231,137
    San Antonio              182,761            248,044           430,805
    Washington               29,664            701,100           730,764
    Total              313,982         4,489,407         4,803,389
    Percentage Change: 2000-2010
    Austin 20.4% 56.1% 37.3%
    Baltimore -4.6% 9.9% 6.2%
    Chicago -6.9% 9.0% 3.9%
    Dallas-Fort Worth 0.8% 30.2% 23.4%
    Houston 7.5% 39.3% 26.1%
    Indianapolis 5.0% 28.3% 15.2%
    San Antonio 16.0% 43.7% 25.2%
    Washington 5.2% 16.8% 15.4%
    Total 3.2% 21.7% 15.7%
    Chicago excludes Kenosha County, WI
    Washington excludes Jefferson County, WV
    Indianapolis core municipality: Indianapolis & Marion County

    Analysis of Individual Metropolitan Areas: The major metropolitan areas for which data is available are described below in order of their population size (Figure 2 and Table 1).

    Chicago:The core municipality of Chicago lost 200,000 residents between 2000 and 2010. Suburban growth was 546,000, adding up to total metropolitan area growth of 346,000 people. The suburbs accounted for 158 percent of the metropolitan area growth. The core municipality decline was stunning in the face of the much ballyhooed urban renaissance in that great city. Yet this renaissance was limited enough as to not lead to an expanding population.

    The decline in the core municipality population represents a major departure from the 2009 Bureau of the Census estimates, which would have implied a 2010 population at least 170,000 higher (assumes the growth rate of 2008 two 2009).

    Instead all of the growth was in the outer suburbs, beyond the inner suburbs of Cook County.

    Dallas-Fort Worth: The historical core municipality of Dallas had a modest population increase of 9000, or less than 1 percent between 2000 and 2010. In contrast, the suburbs experienced an increase of 1.2 million, or 30 percent. Thus, approximately 1 percent of the metropolitan area growth was in the core municipality, while 99 percent was in the suburbs, most of it in the outer suburbs. The inner suburbs added 14 percent to their 2000 population, while the outer suburbs added 36 percent.

    The population figure for the core municipality of Dallas – consistently among the strong core areas –  was surprisingly low, at 9 percent below (117,000) the expected level. The suburban population was 1 percent (71,000) below expectations.

    Houston: The historical core municipality of Houston had comparatively strong population growth, adding 146,000 and 8 percent to its 2000 population. However this figure was 8 percent, or 174,000 below the expected figure. By contrast, the suburban growth was 39 percent, more than five times that of the central jurisdiction. The suburban population growth was 1,085,000, more than six times that of the core jurisdiction. The suburban population was 4 percent or 144,000 higher than expected.

    The core jurisdiction of Houston accounted for 12 percent of the metropolitan area growth while the suburbs s accounted for 88 percent. This was evenly distributed between the inner suburbs of Harris County and the outer suburbs. The inner suburbs added 38 percent to their population while the outer suburbs added 41 percent.

    Washington:Reversing a decade’s long trend, the historical core jurisdiction of Washington (DC) had a small population gain between 2000 and 2010. But the Washington, DC gain of 30,000 pales by comparison to the suburban gain, which was more than 20 times greater, at 700,000. The core jurisdiction accounted for 4 percent of the population gain, while the suburbs accounted for 96 percent.

    More than 60 percent of the growth in the metropolitan area was outside the inner suburban jurisdictions that border Washington, DC (Arlington County and Alexandria in Virginia, together with Montgomery County and Prince George’s County in Maryland), while the inner suburbs accounted for 36 percent of the growth. The population increase in the inner suburbs was 9 percent, compared to 37 percent in the outer suburbs.

    Jefferson County in West Virginia was not included in the analysis because data is not yet available.

    Baltimore: The historical core municipality of Baltimore, the site of another ballyhooed urban comeback, lost 30,000 people, or 5 percent of its 2000 population. Baltimore’s 2010 population was 4 percent or 16,000 below the expected level. The suburbs experienced a 10 percent or 188,000 person increase.  The region’s population increase was roughly equal in numbers between the inner suburbs and the outer suburbs, although the exurban percentage increase was nearly twice as large.

    San Antonio:The historical core municipality of San Antonio experienced the largest population increase among the eight metropolitan areas, at 183,000, a roughly 16 percent population jump. The city of San Antonio accounted 43 percent of the growth while suburbs in Bexar County and further out accounted for a larger 57 percent. However, the suburban population increase was 248,000 or 44 percent. This is something of a turnaround in trends that favored the city of San Antonio in the past because of its vast sprawl and predominant share of the metropolitan population.

    The city of San Antonio population was 5 percent or 65,000 people short of the expected 2010 level. The suburban population was 15 percent more or 104,000 more than the expected level.

    Indianapolis:The historical core area of Indianapolis and Marion County (including enclaves within Indianapolis) grew 5 percent and accounted for 19 percent of the metropolitan area growth. In contrast, the surrounding suburbs grew 28 percent, representing r 81 percent of the metropolitan area growth. Overall, the core municipality added 44,000 people, while the suburbs added more than four times as many, at 188,000.

    Austin:The historical core municipality of Austin experienced the greatest growth of any core jurisdiction in the eight metropolitan areas, at 20 percent. Even so, growth in the suburban areas was nearly 3 times as high at 56 percent. The city of Austin accounted for 29 percent of the metropolitan area population growth, while the suburbs accounted for 71 percent. Overall, the central municipality grew 134,000, while the suburbs grew 2.5 times as much, at 333,000.

    Generally it is fair to say that, so far, suburban areas are growing far faster than urban cores. In addition, most of the fastest growing core municipalities are those areas that are themselves largely suburban, particularly in relatively young cities like San Antonio, Houston and Austin.
     
    Among the eight metropolitan areas analyzed, the older core jurisdictions (with median house construction dates preceding 1960) tended to either lose population or grow modestly. This is illustrated by the city of Chicago, with a median house construction date of 1945, Baltimore with a median house construction date of 1946 and Washington with a median house construction date of 1949 (Table 2). Generally, the central jurisdictions with greater suburbanization (with median house construction dates of 1960 or later) grew more quickly. For example, highly suburban central jurisdictions like Austin with a median house construction date of 1983 and San Antonio, with a median house construction date of 1970, grew fastest. So much for the long forecast, and apparently still elusive, “return to the city”.

    Table 2:
    Historical Core Municipalities: Growth & Median House Age
    Historical Core Municipality
    Growth: 2000-2010 Share of Metropolitan Growth Median House Construction Year
    Austin 20.4% 28.7% 1983
    Baltimore -4.6% -19.2% 1946
    Chicago -6.9% -57.8% 1945
    Dallas-Fort Worth 0.8% 0.8% 1974
    Houston 7.5% 11.9% 1975
    Indianapolis 5.0% 18.6% 1967
    San Antonio 16.0% 42.4% 1979
    Washington 5.2% 4.1% 1949
    Average 3.2% 3.7%

    Wendell Cox is a Visiting Professor, Conservatoire National des Arts et Metiers, Paris and the author of “War on the Dream: How Anti-Sprawl Policy Threatens the Quality of Life

  • Chicago Takes a Census Shellacking

    The Census results are out for Illinois, and it’s bad news for the city of Chicago, whose population plunged by over 200,000 people to 2,695,598, its lowest population since before 1920.  This fell far short of what would have been predicted given the 2009 estimate of 2,851,268. It’s a huge negative surprise of over 150,000, though perhaps one that should have been anticipated given the unexpectedly weak numbers for the state as a whole that were released in December.

    The American Community Survey data from last year show a clear improvement in items like college degree attainment (up 7.6 percentage points since the 2000 Census) and median household income (up 18%, which trailed the nation slightly, but beat Cook County and the state).  These data points show the very real improvements that have swept over a portion of the city, the visible gentrification that envelops the greater core area has now been shown to have been unable to power overall population growth, or to restrain the rampant exurbanization in the region.

    White and Black Flight

    The non-Hispanic White Only population of the city actually declined by 52,449, or 5.78%.  The “minority” population declined even further, -147,969 or 7.44%, meaning the city actually grew its white population share by 0.38 percentage points, perhaps indicating the early stages of the “Europeanization” of Chicago as the core gentrifies and disadvantaged groups and the white working class are pushed further to the fringe.

    Indeed, the Black Only population plunged by 177,401 as blacks increasingly moved to suburbs, especially southern ones  like Matteson, Lansing, Calumet City, Park Forest, and Richton Park, each of which added thousands of new black residents.  Some indications are that a significant number of black residents left the region altogether.  The traditional black magnet of Atlanta – which struggled through much of the decade – was a top five destination for people leaving Chicagoland over the past decade, and Chicago was the #2 source of in-migrants to Memphis, another black hub, according to IRS data.

    Hispanic population was the bright spot for Chicago, as the city added Hispanic residents to the tune of 25,218, or 3.35%.  Hispanics boosted their population share in the city by nearly 3 percentage points.  But even this growth isn’t that impressive.  The city of Indianapolis, at less than a third Chicago’s population, added over 45,000 Hispanics on a much smaller base.

    Demographic Reality: Massive Exurbanization

    Much has been made of Chicago’s legitimate and real urban core renaissance, but the cold reality remains that this is one of America’s most sprawling regions. Regional growth continued to be heavily focused not in the city or established inner suburbs, but the exurbs.  Kendall County more than doubled in population, and counties like Grundy, Boone, and Kane also made the top five in the state. Cook County, which is about half made up of the city of Chicago, as a whole actually lost population. And traditional suburban powerhouse DuPage has flattened, while Lake County, Illinois fell just short of the national average in growth. During the last decade, a net of over 25,000 people moved from metro Chicago to metro Rockford, making that city the #2 destination for those leaving Chicagoland. Given that Rockford is hardly an economic mecca, clearly exurbanization is spreading far beyond traditional metro boundaries. Sprawl of the most intense kind is alive and well in Chicagoland.

    The following map illustrates this, with a five bucket sort of 2000-2010 population percentage change, growing counties in black, shrinking in red:


    The raw data on regional growth speaks for itself:

    Core+Suburb vs. Exurb

    2000

    2010

    Total Change

    Pct Change

    Core + Established Suburb (Cook, DuPage, Lake Counties)

    6,925,258

    6,815,061

    -110,197

    -1.6%

    Exurb (Other IL Metro Chicago Counties)

    1,347,510

    1,771,548

    424,038

    31.5%

    This sprawl might be more understandable in rapidly growing cities like Atlanta and Houston that can both densify the core and grow outwards simultaneously.  But the Chicago-Joliet-Naperville-IL Metropolitan Division (the full MSA is not yet available since Wisconsin hasn’t been released yet) grew at less than half the national average. This means that the exurbanization trend in Chicagoland is almost entirely loss of population share by the core to the fringe.

    To put an even starker view on the concentration of growth in Illinois as a whole, this map highlights only those counties that grew faster than the already anemic statewide average:


    Other than a handful of counties, the group of fastest growing counties in the state is dominated by suburban and especially exurban Chicago and St. Louis counties.

    For those of us who’ve chosen to plant our flag in the city, these results are most unwelcome news, no two ways about it. This is especially true as underfunded pensions and city budget gaps loom large, and where the per capita load only goes up as the population goes down.  This report should be a call to arms to the next mayor and the city as a whole to make the promise of revitalization a reality, and bring growth and prosperity to the city as a whole, not just a the upscale core. Cities like Chicago have to become more aspirational; places of upward mobility to broad sections of the middle and working classes. The city and Cook County can’t afford another decade like this one.

    Aaron M. Renn is an independent writer on urban affairs based in the Midwest. His writings appear at The Urbanophile.

    Photo by Gravitywave

  • America’s Biggest Brain Magnets

    For a decade now U.S. city planners have obsessively pursued college graduates, adopting policies to make their cities more like dense hot spots such as New York, to which the “brains” allegedly flock.

    But in the past 10 years “hip and cool” places like New York have suffered high levels of domestic outmigration. Some boosters rationalize this by saying the U.S. is undergoing a “bipolar migration”–an argument recently laid out by Derek Thompson in The Atlantic. On the one hand the smart “brains” head for cool, coastal cities like New York and Boston, while “families” and “feet”–a term that seems to apply to the less cognitively gifted–trudge to the the nation’s southern tier–a.k.a. the Sun Belt–for cheap prices and warm weather. “College graduates with bachelor’s degrees or higher,” Thompson notes, “have been moving to the coasts, like salmon swimming against the southwesterly current.”

    However, this analysis–no matter how widely accepted in the media–is grossly oversimplified, perhaps even misleading. Indeed, college graduates, for the most part, are heading not to the big cities on the coasts, but to smaller, less dense and quite often Sun Belt cities.

    To come up with our list of the country’s biggest brain magnets, we took the 52 largest metropolitan areas (all those over 1 million population) and ranked them by gains in people with college educations compared to the population over 25 years of age between 2007 and 2009, using the latest data from the American Community Survey provided by demographer Wendell Cox. It turns out that none of the top 10 gainers were large Northeastern cities, but largely Southern or Midwestern. New Orleans; Raleigh, N.C.; Austin, Texas; Nashville; Birmingham, Ala.; Kansas City, Mo.-Kan.; and Columbus, Ohio, all scored high marks. Only one California city, San Diego, made the top 10. Perennial “brain gainers” Denver, Colo., and Seattle round out the top 10.

    Among those metropolitan statistical areas with populations over 5 million, the best ranking went to the Philadelphia region (No. 12 overall), arguably the least glitzy and most affordable of the large northeast cities. The San Francisco metropolitan area, long a leader in its percentage of college-educated adults, held the next spot at No. 13. On the other hand, supposed “brain” magnets Boston and Chicago managed middling rankings, right behind Charlotte, N.C., and just ahead of San Antonio, Texas. Both fell well behind such overlooked “brain gain” areas as Jacksonville, Fla.; St. Louis, Mo.-Ill.; and Indianapolis. New York, the nation’s intellectual capital, ranked a mediocre 29th and Los Angeles an even worse 37th. To put in perspective, Nashville’s rate of college educated migration growth was 3.7%, compared with 1.4% for New York and a measly 0.7% for Los Angeles.

    Rather than following a clear path to the world of the “hip and cool,” college graduates appear influenced by a more nuanced and complex series of factors in terms of their location. New Orleans’ No. 1 ranking, for example, is likely product of the continuing recovery of its shrunken population, where the central city appears to be somewhat more attractive to professionals than before Katrina while the suburban populations have recovered more quickly from the disaster. The strong showing of Birmingham may likely be traced not to changes in the core city itself, but to the rapid growth in its surrounding suburban counties and the rapid expansion of the region’s medical complex.

    This reflects something not often mentioned: the spreading out of intelligence. Conventional theory suggests that the new generation of college graduates will go to the largest, densest places, eschewing, as The Wall Street Journal put it snidely, their parent’s McMansions for small abodes in the inner city. Yet the ACS numbers indicate that, overall, college migrants tend to choose less dense places. In the two years we covered, the growth rate in urban areas with lower urban area densities (2,500 per square mile) boasted a 5% increase in college-educated residents, compared with roughly 3.5% for areas twice as dense.

    This can be seen in the pattern of migration toward relatively low-density metropolitan areas like Nashville, Columbus, Raleigh or Kansas City as opposed to more packed regions like New York, Los Angeles or San Francisco. And wherever these college graduates migrate, they are at least as likely to settle outside the urban core. Another overlooked fact: Most places with the highest percentages of college-educated people are in suburbs. Only two of the 20 most-educated counties in the country are located in the urban core: New York (Manhattan) and San Francisco. Virtually all the rest are suburban.

    Another somewhat surprising statistic revolves around affordability and job growth. The college-educated, particularly in this tepid economy, are not immune to reality. They may want to go one place–for example, ever-alluring New York or sunny Los Angeles–but may soon find they can find neither a good job there nor an affordable place to live in order to stay there. Overall our analysis shows that many end up in places with lower housing prices. Areas with the highest price housing experienced college-educated growth at a rate only 60% of those with more affordable real estate. This is one thing that makes an Austin or Raleigh, even a Columbus or Kansas City, more attractive than a Boston, New York or Los Angeles

    Finally we have to consider employment trends. For the most part college graduates, like most folks, preferred cities with lower unemployment and more job growth. Some top gainers, such as Raleigh, Columbus and Kansas City, all boast lower than average unemployment and appear to be recovering from the recession. But this is not always the case: Some relatively poor performers on the job front, like Portland, Ore., and San Diego, have managed to maintain their appeal–for now.

    As the economy recovers these patterns are likely to accelerate, although they could also shift a bit as regions gain or lose employment momentum. Meanwhile, the best strategy for attracting graduates lies in creating jobs, as well as in offering both affordable housing and a range of housing options, including both reasonably priced urban and lower-density living. Generally speaking an area that is economically vital as well as physically or culturally appealing will do best. In the next decade advantages will also fall to family-friendly regions, particularly as the current crop of millennial-generation graduates starts entering en masse their family-forming years. These factors, more than hipness or dense urbanity, may well be more influential in determining which regions do best in the ongoing war for talent.

    —-

    No. 1: New Orleans-Metairie-Kenner, La.

    Grad Gain: 36,666

    Gain as a Share of Total 25+ 2007 Population: 5.42%

    New Orleans’ No. 1 ranking is likely due to former exiles returning after Hurricane Katrina. A recent report from the Census Bureau estimates that area’s population in the past decade has shrunk 29%. Recovery in the urban core has remained patchy, but suburban populations have recovered more quickly from the disaster.

    No. 2: Raleigh-Cary, N.C.

    Grad gain: 28,748

    Gain as a Share of Total 25+ 2007 Population: 4.27%

    Even in hard times Raleigh-Durham–the fastest-growing metro area in the country–has repeatedly performed well on Forbes’ list of the best cities for jobs. The area is a magnet for technology companies fleeing the more expensive, congested and highly regulated northeast corridor. Affordable housing and short commute times are no doubt highly attractive to millennials seeking to start a family. Indeed, a 2010 Portfolio.com/bizjournals survey ranked the city the third-best for young adults.

    No. 3: Austin-Round Rock, Texas

    Grad gain: 42,117

    Gain as a Share of Total 25+ 2007 Population: 4.23%

    Brains are flocking to Austin for good reason. Forbes ranked it the best large urban area for jobs in 2010. Along with Raleigh-Durham, Austin is emerging as the next Silicon Valley, luring lots of brains who would have previously headed toward the West Coast. Austin owes much both to its public-sector institutions (the state government and the main campus of the University of Texas) and its expanding ranks of private companies–including foreign ones–swarming into the city’s surrounding suburban belt. Its vibrant cultural scene certainly helps in attracting college-educated millennials.

    No. 4: Nashville-Davidson-Murfreesboro-Franklin, Tenn.

    Grad gain: 36,975

    Gain as a Share of Total 25+ 2007 Population: 3.68%

    A high quality of life, a vibrant cultural and music scene and a diverse population make Nashville a desirable place to live. Low housing costs drive down the cost of living, which is even lower than in other affordable cities like Raleigh, Austin or Indianapolis. Nashville is also home to a growing health care industry: More than 250 health care companies have operations in Nashville, and 56 are headquartered there.

    No. 5: Kansas City, Mo./Kan.

    Grad gain: 38,398

    Gain as a Share of Total 25+ 2007 Population: 2.96%

    The two-state Kansas City region boasts strong population growth and net in-migration– and for good reason. The city has one of the lowest costs of living, one of the highest personal-income growth rates and one of the healthiest real estate markets in the country. Short commute times also add to the attractiveness of the city for families. The city is the second-largest rail hub in the U.S. and is actively growing its life science and technology sectors.

    No. 6: Birmingham-Hoover, Ala.

    Grad gain: 21,111

    Gain as a Share of Total 25+ 2007 Population: 2.86%

    Birmingham’s strong showing on this list is likely due to the rapid growth in its surrounding suburban counties. One big development sure to lure brains: the rapid expansion of the University of Alabama’s medical center and surrounding private medical industry.

    No. 7: San Diego-Carlsbad-San Marcos, Calif.

    Grad gain: 51,151

    Gain as a Share of Total 25+ 2007 Population: 2.71%

    The only MSA from the "hip and cool" state of California to make the top 10, despite high levels of out-migration and a relatively poor performance in the job front. For now, at least, the area’s beautiful beaches and idyllic weather manage to attract plenty of college graduates, but it will need to get out of its slump in order to retain them.

    No. 8: Denver-Aurora-Broomfield, Colo.

    Grad gain: 43,853

    Gain as a Share of Total 25+ 2007 Population: 2.69%

    A perennial magnet for college graduates, and one of the "hip and cool" cities to make the top of our list, Denver was one of the darlings of the information age, and its suburbs have long incubated tech companies. Its technology sector is still strong, but higher prices and greater regulation have driven companies to regions like Austin and Raleigh, which are more business-friendly and cheaper.

    No. 9: Columbus, Ohio

    Grad gain: 29,515

    Gain as a Share of Total 25+ 2007 Population: 2.6%

    While the recession has taken a huge toll on the rest of Ohio, Columbus has been thriving, thanks to being home of the state capital, a booming startup culture and the largest college campus in the country–Ohio State University, a major employer and information center. Forbes named the Columbus metropolitan area–home to 1.8 million residents– one of America’s best housing markets, as well as one of the best places for businesses and careers. The city enjoys below-average unemployment and a strong tech presence that includes Battelle Memorial Institute, which oversees laboratories for several federal agencies.

    No. 10: Seattle-Tacoma-Bellevue, Wash.

    Grad gain: 53,869

    Gain as a Share of Total 25+ 2007 Population: 2.39%

    Seattle has long been one of the big winners in the brain battle as well. It has some of the country’s most important cutting-edge firms–Microsoft, Costco, Amazon, Starbucks–one of the country’s best arrays of urban and suburban neighborhoods. Housing is no longer cheap, but remains far less expensive than its main rival, the San Francisco Bay Area.

    —-

    Photo by Jeanette Runyon

    This piece originally appeared in Forbes.

    Joel Kotkin is executive editor of NewGeography.com and is a distinguished presidential fellow in urban futures at Chapman University, and an adjunct fellow of the Legatum Institute in London. He is author of The City: A Global History. His newest book is The Next Hundred Million: America in 2050, released in February, 2010.

  • Yes, We Do Need to Build More Roads

    Road are clearly out of fashion in urban planning circles. Conventional wisdom now decries roads in favor of public transit, walking or biking in developments designed to mimic traditional 19th century urbanism. Common refrains are “we can’t build our way out of congestion” or “widening roads to cure congestion is like loosening your belt to cure obesity.” Also frequently noted is the vehicle miles traveled has – at least until recently – outpaced population growth.

    But this piece of conventional wisdom is also deeply flawed. It obscures the bigger point that in a growing country we need to expand infrastructure to keep pace. The recent 2010 Census results put this in stark relief. The rate of growth from 2000 to 2010 slowed considerably from the previous decade, but still at a robust 9.7%, or 27.3 million new Americans. It would have been physically impossible to house all those people in traditional urban communities well-served by transit. The 27.3 million number is more than the combined 2009 population of the cities of New York, Los Angeles, Chicago, Philadelphia, Washington, Boston, San Francisco, Portland, and Seattle.

    In fact, this national growth is greater than the combined population of the 12 largest municipalities in the country.

    That’s just one decade’s worth of growth. America’s traditional urban areas couldn’t contain this, even if they were emptied of all their current residents. And the United States is projected to add an additional 90 million people by 2050. Where are all those people going to go? And how would they get to work even if they could live in these cities, given that much of America’s job growth has been suburban?

    Keep in mind also that much of this urban and transit infrastructure must be seen as more legacy than a reflection of modern choices. It was largely compete 50 or more years ago. Only Portland and Washington, DC have really managed to build new transit friendly urban core cities in the modern era. And despite their growing populations, these two places can only absorb a relatively small amount of new population every year. In Washington, it’s less population growth than gentrification – the replacement of largely poor African Americans with more affluent whites – that is the most outstanding demographic trend.

    That’s not to say America can’t invest more in transit or build more transit friendly cities. It can and it should. In particular, large, already dense urban areas like New York, Chicago, and Washington with large core area employment require major investment to upgrade their systems.

    Even smaller cities need better transit options and more urban neighborhoods. They are simply not well positioned to compete head on with newer suburban areas built from the ground up to support an auto-oriented lifestyle. But this will be difficult since they will have to build transit largely from scratch, and given anticipated cutbacks in new federal transit funding. this suggests they would be well-advised to avoid costly boondoggle mega-projects in favor of unglamorous but basic activities like running a quality urban bus system.

    But even if we achieve our potential in transit, America still needs to build more roads. We’ve got an interstate system originally designed for a 1960 population of 180 million and we are now well over 300 million and going up. By 2050 we’ll have more than double the 1960 population. This will require a major expansion of infrastructure, and that includes highway infrastructure.

    Just as one example, consider a moderate growth area like the Indianapolis-Carmel MSA. Its interstate system was mostly designed and completed circa 1970. The region had a population of a bit over 1.1 million then. Today it is over 1.7 million, an increase of 52%, or 596,000 people. A county the size of that increase would be the second largest county in the state of Indiana, well exceeding that of today’s #2, Lake County, a heavily urbanized county in Northwest Indiana.

    Yet until recently there had been almost no expansion of the Indianapolis freeway system. Fortunately, it was over-designed when built, but that is no longer the case. Thanks to a fortuitous lease of the Indiana Toll Road however, over 50 miles of freeway in the region are now being widened. Without this, the region would have faced decades of commuting misery.

    Unfortunately, that’s the bind where most cities now find themselves: managing growth with funding for roadway expansion and even maintenance running dry nationally.

    Keep in mind that tomorrow’s roads need not resemble yesterday’s monstrosities. The days of simplistically adding lanes while neglecting basics like enclosed drainage, sidewalks and paths, bus shelters, and aesthetics are likely over in many parts of the country. We need to provide room for the traffic we need to accommodate without excessive over-designs for a 15 minute peak of the peak, or dehumanizing roadway design approaches. Reform of our civil engineering educational system is eminently doable as plenty of great examples of suburban roadway design already exist. Federal standards need a revamp as well. We need to build not just more, but also better roads.

    With a botched stimulus, huge deficits at the federal and state level, and a public that has decisively turned against those deficits, a major construction program seems unlikely at this time. But in a couple years the economy should be back and a plan for fiscal recovery put in place and under execution. If not, we’ll have much bigger problems than roads.

    But assuming we get past this moment, we need to be laying the groundwork for a major continuation of the long history of American investment in infrastructure, from the Erie Canal to the interstate highway system. This includes not only a significant boost in urban transit spending where appropriate, but also a major program of both roadway repair and quality expansion, particularly in our growing metro regions. And as the Indiana example of a Toll Road lease shows, this doesn’t all have to come from tax dollars. Without this investment, our critical transport networks will ultimately seize up and America cannot hope to be competitive globally over the long haul.

    Aaron M. Renn is an independent writer on urban affairs based in the Midwest. His writings appear at The Urbanophile.

    Photo of a suburban road in Carmel, IN by author.

  • Greetings From Recoveryland: Ten Places to Watch Coming Out of the Recession

    Like a massive tornado, the Great Recession up-ended the topography of America. But even as vast parts of the country were laid low, some cities withstood the storm and could emerge even stronger and shinier than before. So, where exactly are these Oz-like destinations along the road to recovery? If you said Kansas, you’re not far off. Try Oklahoma. Or Texas. Or Iowa. Not only did the economic twister of the last two years largely spare Tornado Alley, it actually may have helped improve the landscape.

    We have compiled a list of the 10 American cities best situated for the recovery. These are places where the jobs are plentiful, and the pay, given the lower cost of living, buys more than in bigger cities. In other words, places unlike much of the rest of the country. The cities, most of which lie in the red-state territory of America’s heartland, fall into three basic groups. There’s the Texaplex—Austin, Dallas, San Antonio, and Houston—which has become the No. 1 destination for job-seeking Americans, thanks to a hearty energy sector and a strong spirit of entrepreneurism. There are the New Silicon Valleys—Raleigh-Durham, N.C.; Salt Lake City; and urban northern Virginia—which offer high-paying high-tech jobs and housing prices well below those in coastal California. And then there are the Heartland Honeys—Oklahoma City, Indianapolis, and Des Moines, Iowa—which are enjoying a revival thanks to rising agricultural prices and a shift toward high-end industrial jobs.

    Unlike the Sun Belt states and cities along the East and West coasts, these locales not only grew during the boom of the mid-2000s, they suffered least in the Great Recession. The fact that they are mostly in red states should give the newly ascendant GOP comfort as it tries to deliver on its election-year promise to right the economy. That isn’t to say all the blue states will remain weather-beaten. Wall Street, heady with cheap money, has sparked a return to opulence. And the strong demand for high-tech products and services will likely keep places like Boston, San Francisco, and San Diego from devolving into fancy versions of Detroit. Yet given the results of last week’s election and the increasing odds against another bailout of state governments, the near-broke and highly regulated blue states will be hard-pressed to generate much new employment.

    Of course, not everyone living in our Top 10 cities has avoided the heartache. And the continued slow pace of the economic recovery could hamper expansion even in the most-favored cities. If energy tanks as a result of a renewed global slowdown, it could hurt Texas and Oklahoma; dropping agricultural prices would hit some of the Heartland Honeys hard. But relatively—and that is the operative word in this tough economy—our 10 cities should fare better than most anywhere in America. And they could offer us a road map for what the nation’s economy will look like once the dust settles.

    THE TEXAPLEX

    For sheer economic promise, no place beats Texas. Though the Lone Star State’s growth slowed during the recession, it didn’t suffer nearly as dramatically as the rest of the country. Businesses have been flocking to Texas for a generation, and that trend is unlikely to slow soon. Texas now has more Fortune 500 companies—58—than any other state, including longtime corporate powerhouse New York.

    Austin boasted the strongest job growth in our Top 10, both last year and over the decade. Home to the state capital and the ever-expanding University of Texas, the city is arguably the best-positioned of the nation’s emerging tech centers. It enjoys good private-sector growth, both from an expanding roster of homegrown firms and outside companies, including an increasing array of multinationals such as Samsung, Nokia, Siemens, and Fujitsu.

    Yet Austin’s newfound prosperity isn’t simply a product of its university culture or its synergetic collection of technology firms. Its success owes a great deal to simply being in Texas—a state itching to eclipse its historic archrival, the increasingly troubled California. Indeed, Texas is becoming to the Golden State what Arizona, Nevada, and Oregon were in the last decade: a refuge for workers and companies fed up with California’s high unemployment, cost of living, and dysfunctional state government.

    The Texas economy has benefited from widening diversification. Houston has a robust energy business and medical-services industry, and thriving international trade—all long-term growth areas. Dallas enjoys an expanding tech sector and well-developed business-service industries tied to a powerful corporate base. San Antonio has a strong military connection and an expanding manufacturing capacity, and it is a key locale for the growing Latino marketplace. What’s more, Texas offers pro-business policies and relatively low taxes, and the physical infrastructure in the cities is generally as good or better than in many East and West coast metropolitan areas.

    People are voting with their feet. All four Texas cities are enjoying strong immigration from the rest of the country and abroad. Houston and Dallas have higher rates of immigration than Chicago, and if the job picture stays the same, those cities could someday rival New York and Los Angeles in terms of ethnic diversity.

    THE NEW SILICON VALLEYS

    Although Massachusetts and California are lauded as the places “where the brains are,” neither ranked high in the growth of tech jobs over the past decade. More important is where the brains are headed.

    A lot of them are going to North Carolina, Virginia, and Utah. The population of Raleigh-Durham grew faster than any major U.S. metropolitan area during the recession, and the city ranked third on our list in terms of job growth over the last decade. To the north, in Virginia, lies another Silicon Valley wannabe, stretching across Alexandria, Arlington, and Fairfax counties. And then there’s Salt Lake City and its environs, buoyed by the arrival of such big names as Adobe, Twitter, and Electronic Arts. The Greater Salt Lake region, which follows the Wasatch Mountains from Provo to Ogden, has much to attract tech companies: short commutes, decent public schools, spectacular nearby recreation, and, perhaps most important, affordable housing. Roughly 75 percent of households in Salt Lake can afford a median-priced house, as compared with 45 percent in Silicon Valley and roughly half that in New York City and San Francisco. The cost advantages of cities like Salt Lake and the other high-tech hubs are expected to prove especially attractive to millennials—the generation born after 1982—as they begin forming families and buying homes en masse.

    None of these Silicon Valleys may ever reach the critical mass of the real thing in California, but they will become increasingly more effective competitors and take an expanding market share of the nation’s technology business.

    THE HEARTLAND HONEYS

    The oft-ignored center of the country boasts a thriving economy that seems poised for further expansion. The region is well positioned to take advantage of growing markets for agricultural commodities and farm machinery in fast-growing countries such as India and China. The Great Plains and parts of the southern Midwest have also attracted new investments in manufacturing, both from domestic and foreign firms.

    Having largely missed out on the housing bubble, the region also avoided the hangover. As a result, after watching generation after generation move away, several heartland cities are enjoying a noticeable uptick in domestic migration as well as immigration. During the Great Depression, it was Oklahomans who moved to California to escape the Dust Bowl. Now there are considerably more people moving from California to Oklahoma than the other way around.

    Indianapolis, once written off as “Indiana no-place,” is one emerging hotspot. The area’s housing affordability now stands at a remarkable 90-plus percent. Although the recession has hit some of Indiana’s manufacturing-oriented northwest corner, over the past decade Indianapolis’s population grew at a rate 50 percent greater than the national average, notes urban analyst Aaron Renn. Much of this success is due to an aggressively pro-business attitude that promotes growing clusters such as life sciences, motor sports, and Internet marketing.

    Oklahoma City and Des Moines have also enjoyed steady growth in both jobs and net migrants over the past decade. Des Moines was recently rated the No. 1 spot in the country for business and careers by Forbes magazine, thanks to a surging agricultural sector and strength in the business-services segment. And Oklahoma City—which enjoys low unemployment as a result of its steadily growing energy and aerospace sectors—has been ranked among the best job markets for young people, ahead of Dallas, Seattle, and even New York (having Kevin Durant lead the NBA’s Oklahoma City Thunder for the foreseeable future can only improve the buzz).

    Of course, none of the cities in our list competes right now with New York, Chicago, or L.A. in terms of art, culture, and urban amenities, which tend to get noticed by journalists and casual travelers. But once upon a time, all those great cities were also seen as cultural backwaters. And in the coming decades, as more people move in and open restaurants, museums, and sports arenas, who’s to say Oklahoma City can’t be Oz?

    Job Growth
    Net Domestic Migration
    Total 2010
    2009
     
    10yr
    7yr
    2yr
    1yr
    9yr
    6yr
    2yr
    1yr
    Emplymt
    Population
    Northern Virginia 13.8% 11.5% -1.0% 1.2% 12.3 3.2 10.1 8.3 1,309,675 2,558,256
    Raleigh 13.5% 13.7% -4.9% -0.4% 236.7 186.6 47.2 18.4 496,900 1,125,827
    Salt Lake City, Ogden, Provo 7.7% 8.5% -6.7% -1.4% 9.2 15.9 7.4 2.4 961,900 2,227,413
    Austin 14.1% 17.8% -0.9% 1.7% 177.2 136.5 37.3 15.5 768,500 1,705,075
    Dallas-Fort Worth 3.7% 8.1% -3.6% 0.8% 59.3 44.8 14.3 7.2 2,876,925 6,447,615
    Houston 11.7% 10.9% -3.6% -0.5% 51.2 42.9 15.5 8.7 2,518,675 5,867,489
    San Antonio 11.4% 10.8% -2.7% -0.2% 102.1 86.4 21.3 9.3 833,325 2,072,128
    Oklahoma City 4.9% 6.7% -2.2% 1.0% 37.8 32.7 11.6 7.3 561,125 1,227,278
    Des Moines 7.8% 7.4% -3.5% -0.9% 63.6 56.2 14.0 6.1 316,975 562,906
    Indianapolis 1.6% 0.3% -5.5% -0.3% 45.9 34.6 8.0 4.1 870,850 1,743,658
    New York -1.5% 0.3% -4.1% -0.5% -104.7 -82.6 -13.8 -5.8 8,288,300 19,069,796
    Los Angeles -6.2% -5.2% -8.0% -1.0% -107.9 -89.0 -15.7 -6.3 5,118,950 12,874,797
    San Francisco -13.1% -6.0% -8.9% -2.6% -83.1 -57.6 3.4 1.9 1,853,350 4,317,853
    Chicago -8.0% -4.8% -7.4% -1.7% -60.0 -45.8 -8.8 -4.2 4,235,175 9,580,567
    Nation -1.2% 0.4% -4.9% -0.1%   130,690,750  
    Areas are Metroplitan Statistical Areas
    Northern Virginia, Va. includes Arlington, Clarke, Fairfax, Fauquier, Loudoun, Prince William, Spotsylvania, Stafford, and Warren Counties and Alexandria, Fairfax, Falls Church, Fredericksburg, Manassas, and Manassas Park Cities in Virginia.
    Salt Lake City region includes Ogden and Provo Metroplitan Statistical Areas
    Job growth uses May-August average for each year.
    Job data:  U.S. Bureau of Labor Statistics, Current Employment Survey
    Migration data:  U.S. Census Population Estimates.  Migration is cumulative over 10, 7, 2, or 1 yr period.  Number is rate per 1,000 residents in base year.

    —————-

    This article originally appeared in Newsweek.

    Praxis Strategy Group and Zina Klapper provided research for this article.

    Joel Kotkin is executive editor of NewGeography.com and is a distinguished presidential fellow in urban futures at Chapman University and an adjunct fellow with the Legatum Institute in London. He is author of The City: A Global History. His newest book is The Next Hundred Million: America in 2050, released in February, 2010.

    Photo: Jeanette Runyon