Tag: Kansas City

  • Why Affordable Housing Matters

    Economists, planners and the media often focus on the extremes of real estate — the high-end properties or the foreclosed deserts, particularly in the suburban fringe. Yet to a large extent, they ignore what is arguably the most critical issue: affordability.

    This problem is the focus of an important new study by Demographia. The study, which focuses largely on English-speaking countries, looks at the price of housing relative to household income. It essentially benchmarks the number of years of a region’s household income required to purchase a median-priced house.

    Overall, the results are rather dismal in terms of affordability, particularly in what Wharton’s Joe Gyourko dubs “superstar cities.” These places — such as London, New York, Sydney, Toronto and Los Angeles — generally tend to be more expensive than second-tier regions commonly found in the American South and heartland.

    Even with their usually higher incomes, these regions, for the most part, still have a ratio of five years median income to median house price; this is far higher than the historical ratio of three. In some areas the ratios are even more stratospheric. Sydney and Melbourne, for example, have ratios over nine; London, New York, San Jose and Los Angeles approach six or more.

    Urbanists often assume that these high prices — unprecedented in a tepid economy — reflect the greater attractiveness of these regions. This is somewhat true, particularly for parts of London and New York, which can survive high ratios because their markets are less national and middle-income and more tied to the global upper classes.

    In places like Mayfair or New York’s Upper East Side, the buying “public” extends beyond the local market to high-income markets in places like the United Arab Emirates, Moscow, Shanghai, Singapore or Tokyo. Many owners are not full-time residents and consider a home in such places as just another expression of their wealth and privilege.

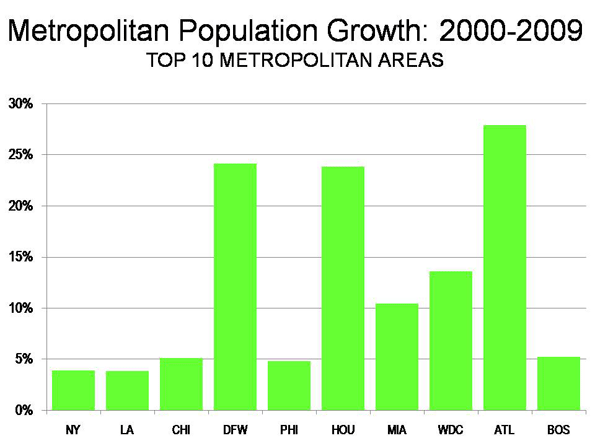
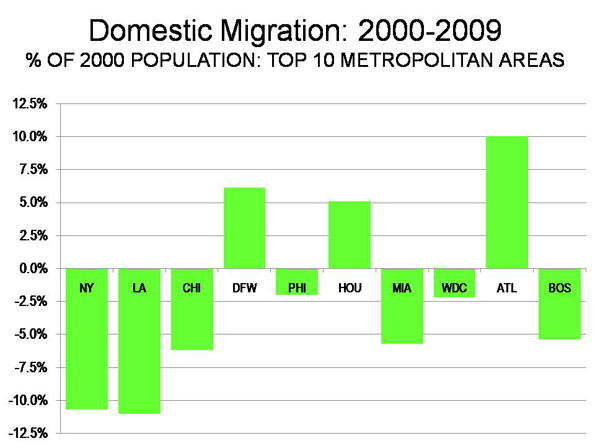
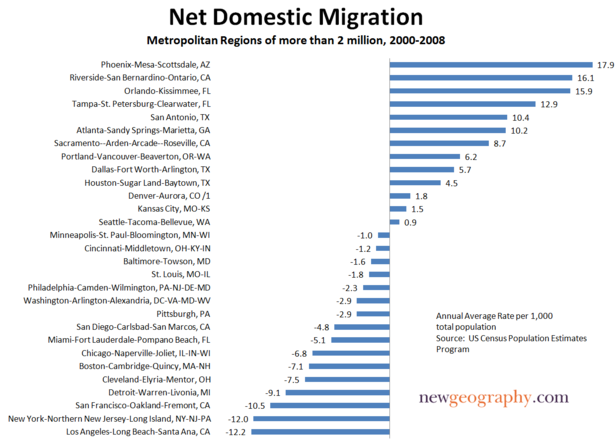
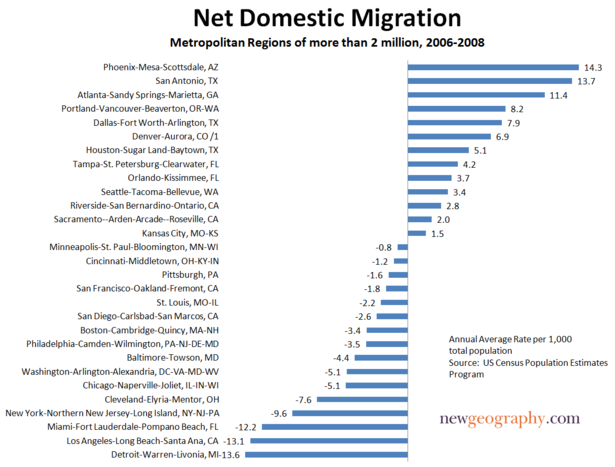
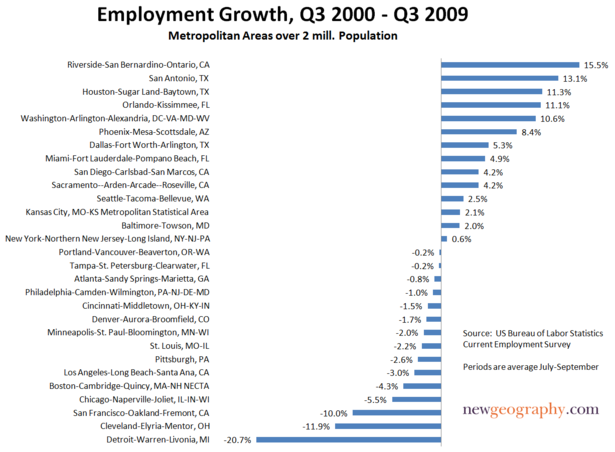
    Yet such markets are exceptional. In most regions, the vast preponderance of homebuyers are either natives or long-term migrants. Their less glamorous tastes — notably access to affordable single-family dwellings — drives migration  from one region to another. Over the past decade, and even since the crash, this has meant a general trend of migration from high-end, unaffordable markets to less expensive regions. In the U.S., for example, people have been flocking to the South, particularly the large metropolitan areas of Texas.

    One factor driving this migration, the Demographia study reveals, is differing levels of regulation of land use between regions. In many markets advocacy for “smart growth,” with tight restrictions on development on the urban fringe, has tended to drive up prices even in places like Australia, despite the relatively plentiful supply of land near its major cities.

    More recently, “smart growth” has been bolstered by claims, not always well founded, that high-density development is better for the environment, particularly in terms of limiting greenhouse gases. Fighting climate change (aka global warming) has given planning advocates, politicians and their developer allies a new rationale for “cramming” people into more dense housing, even though most surveys show an overwhelming preference for less dense, single-family houses in most major markets across the English-speaking world.

    Limits on the kind of residential living most people prefer inevitably raises prices. As the Demographia study shows, the highest rise in prices relative to incomes generally has taken place in wherever strong growth controls have been imposed by local authorities.

    Perhaps the poster child for “smart growth” has been the U.K. Long before the climate change debate, both of England’s major parties embraced the notion of strict constraints on suburban development — not only in London, but across the country. As a result, even places with weak economies are not as affordable as they should be. Liverpool, Newcastle and the Midlands have affordability rates higher than Toronto, Boston, Miami and Portland — and not much lower than those of New York or Los Angeles.

    But the most remarkable impact of “smart growth” policies has been in Australia, which once had among the most affordable housing prices in the English-speaking world. Houses in Sydney and Melbourne, for example, are now less affordable than in London or San Francisco.  Even secondary markets like Adelaide and Perth are more expensive than Toronto, New York, Los Angeles or Chicago. Most recently these policies have even caught the attention of the OECD, which linked overly regulated housing markets not only to the Great Recession, but to a continued slow economic recovery.

    Compared with the U.K. and Australia, the U.S. housing market is more hopeful, with a host of regions — notably Houston, Dallas, Austin, San Antonio, Phoenix and Kansas City — with affordability rates around three and under. Low prices by themselves, of course, are no guarantor of success; in economically challenged places like Detroit and Cleveland, out-migration and high unemployment have driven prices down.

    But in many, if not most, cases affordability has promoted economic and demographic growth.  Generally speaking, affordable markets tend to draw migrants from overpriced ones, for example to Houston or Austin from Los Angeles or New York.

    Nor is this necessarily a case of “smart” people heading to dense, expensive cities while the less cognitively gifted head to the low-cost regions — as news outlets like The Atlantic have claimed. In fact, the American Community Survey reveals that between 2007 and 2009 college graduates generally gravitated toward lower-cost, less dense markets — such as Austin, Houston and Nashville — than to the highly constrained, denser ones. Overall  growth in affordable markets — with a ratio of three or four — among college graduates was roughly 5%; in the more expensive places , it was barely 3%.

    How could this be, if everyone with an above-a-room-temperature IQ supposedly favors hip, cool, dense cities? Perhaps it’s because of factors often too small or mundane for urban pundits to acknowledge. Most people, particularly as they enter their 30s, aspire to a middle-class lifestyle — and being able to afford a house constitutes a large part of that.

    So what does this tell us about future growth? Clearly affordability matters. Areas that combine strong income and job growth, along with affordable housing, are poised to do best. This will be particularly true once the economy recovers and a new generation of millennial buyers, entering their 30s in huge numbers over the next decade, start their search for a place where they can settle down and start raising families.

    This piece originally appeared in Forbes.

    Joel Kotkin is executive editor of NewGeography.com and is a distinguished presidential fellow in urban futures at Chapman University, and an adjunct fellow of the Legatum Institute in London. He is author of The City: A Global History. His newest book is The Next Hundred Million: America in 2050, released in February, 2010.

    Photo by Je Kemp

  • SPECIAL REPORT: Metropolitan Area Migration Mirrors Housing Affordability

    On schedule, the annual ritual occurred last week in which the Census Bureau releases population and migration estimates and the press announces that people are no longer moving to the Sun Belt. The coverage by The Wall Street Journal was typical of the media bias, with a headline “Sun Belt Loses its Shine.” In fact, the story is more complicated – and more revealing about future trends.

    Domestic Migration Tracks Housing Affordability: There have been changes in domestic migration (people moving from one part of the country to another) trends in the last few years, but the principal association is with housing affordability.

    Severe and Not-Severe Bubble Markets: Overall, the major metropolitan markets with severe housing bubbles (a Median Multiple rising to at least 4.5, see note) lost nearly 3.2 million domestic migrants (all of these markets have restrictive land use regulation, such as smart growth or growth management) from 2000 to 2009. However, not all markets with severe housing bubbles lost domestic migrants. “Safety valve” bubble markets drew migration from the extreme bubble markets of coastal California, Miami and the Northeast. These “safety valve” markets (including Phoenix, Las Vegas, Portland, Seattle, Riverside-San Bernardino, Orlando, Tucson and Tampa-St. Petersburg), gained a net 2.2 million from 2000 to 2009, while the other bubble markets lost 5.3 million domestic migrants from 2000 to 2009 (See Table below, metropolitan area details in Demographia US Metropolitan Areas Table 8). At the same time, the markets that did not experience a severe housing bubble (those in which the Median Multiple did not reach 4.5) gained a net 1.5 million domestic migrants.

    The burst of the housing bubble explains the changes in domestic migration trends. Housing affordability has improved markedly in the extreme bubble markets, so that there was less incentive to move. Then there was the housing bust-induced Great Recession, which also slowed migration since people had more trouble selling their homes or finding anew job. As a result, the migration to the “safety valve” markets and to the smaller markets dropped substantially.

    • During 2009, the “safety valve” markets gained only 51,000 net domestic migrants, one-fifth of the annual average from 2000 to 2008.
    • At the same time, the other severe housing bubble markets lost 236,000 domestic migrants in 2009, compared to the average loss of 638,000 from 2000 to 2008.
    • Areas outside the major metropolitan areas also experienced a significant drop in domestic migration, dropping from an annual average of 203,000 between 2000 and 2008 to 23,000 in 2009.
    • The major metropolitan markets that did not experience a severe housing bubble gained 161,000 domestic migrants in 2009, little changed from the 169,000 average from 2000 to 2008. These markets are concentrated in the South and Midwest. Indianapolis, Kansas City, Nashville, Louisville and Columbus as well as the Texas metropolitan areas continued their positive migration trends.
    Domestic Migration by Severity of the Housing Bubble
    Metropolitan Areas over 1,000,000 Population
    2000-2008
    Metropolitan Areas 2000-2009 2009 2000-2008 Average
    Withouth Severe Housing Bubbles     1,509,870         160,514      168,670
    With Severe Housing Bubbles    (3,161,514)        (184,486)     (372,129)
       Not "Safety Valve" Markets    (5,347,211)        (235,838)     (638,922)
       "Safety Valve" Markets     2,185,697           51,352      266,793
    Outside Largest Metropolitan Areas     1,651,644           23,972      203,459
    Severe housing bubbles: Housing costs rose to a Median Multiple of 4.5 or more (50% above the historic norm of 3.0). 
    Median Multiple: Median House Price/Median Household Income
    "Safety Valve" refers to markets with severe housing bubbles that received substantial migration from more expensive markets (coastal California, Miami and the Northeast). These markets include Las Vegas, Phoenix, Riverside-San Bernardino, Sacramento, Portland, Seattle, Orlando, Tucson and Tampa-St. Petersburg.

    Moreover, the Census Bureau revised its previous domestic migration figures for 2000 to 2008 to add more than 110,000 from the markets without severe housing bubbles, while taking away more than 150,000 domestic migrants from the markets with severe housing bubbles. This adjustment alone rivals the 2009 domestic migration loss of 183,000 in these markets

    Population Growth: The Top 10 Metropolitan Areas: Sun Belt metropolitan areas continued to experience the greatest population growth. Between 2000 and 2009, the fastest growing metropolitan areas were Atlanta, Dallas-Fort Worth and Houston, In 2009, Washington, DC was added to the list (Details in Demographia US Metropolitan Areas, Table 2).

    New York: The New York metropolitan area remains the nation’s largest, now reaching a population of over 19 million. More than 700,000 new residents have been added since 2000. However, New York’s population growth has been the second slowest of the 10 largest metropolitan areas since 2000 (Figure 1). Moreover, New York’s net domestic out-migration has been huge. New York has lost 1,960,000 domestic migrants, which is more people than live in the boroughs of The Bronx and Richmond combined. Overall, 10.7% of the New York metropolitan area’s 2000 population left the metropolitan area between 2000 and 2009. More than 1,200,000 of this domestic migration was from the city of New York. Between 2008 and 2009, New York’s net domestic out-migration slowed from the minus 1.32% 2000-2008 annual rate to minus 0.58%., reflecting the smaller migration figures that have been typical of the Great Recession.

    Los Angeles: For decades, Los Angeles has been one of the world’s fastest growing metropolitan areas. Growth had ebbed somewhat by the 1990s, when Los Angeles added 1.1 million people. The California Department of Finance had projected that Los Angeles would add another 1.35 million people between 2000 and 2010. Yet, the Los Angeles growth rate fell drastically. From 2000 to 2009, Los Angeles added barely one-third the projected amount (476,000) and grew only 3.8%. Unbelievably, fast growing Los Angeles became the slowest growing metropolitan area among the 10 largest. In 2009, Los Angeles had 12.9 million people. Los Angeles lost 1.365 million domestic migrants, which is of 11.0% of its 2000 population, and the most severe outmigration among the top 10 metropolitan areas (Figure 2).

    Chicago: Chicago continues to be the nation’s third largest metropolitan area, at 9.6 million population, a position it has held since being displaced by Los Angeles in 1960. Chicago has experienced decades of slow growth and continues to grow less than the national average, at 5.1% between 2000 and 2009 (the national average was 8.8%). Yet, Chicago grew faster than both New York and Los Angeles. Chicago also lost a large number of domestic migrants (561,000), though at a much lower rate than New York and Chicago (6.2%). Even so, Chicago is growing fast enough that it could exceed 10 million population in little more than a decade, by the 2020 census.

    Dallas-Fort Worth: Dallas-Fort Worth has emerged as the nation’s fourth largest metropolitan area, at 6.4 million, having added 1,250,000 since 2000. In 2000, Dallas-Fort Worth ranked fifth, with 500,000 fewer people than Philadelphia, which it now leads by nearly 500,000. Dallas-Fort Worth added more population than any metropolitan area in the nation between 2008 and 2009 and has been the fastest growing of the 10 top metropolitan areas since 2006. As a result, Dallas-Fort Worth has replaced Atlanta as the high-income world’s fastest growing metropolitan area with more than 5,000,000 population. Dallas-Fort Worth added a net 317,000 domestic migrants between 2000 and 2009.

    Philadelphia: Philadelphia is the nation’s fifth largest metropolitan area, at just below 6,000,000 population. Like Chicago, Philadelphia has had decades of slow growth, yet has grown faster in this decade than both New York and Los Angeles (4.8%). Philadelphia has lost a net 115,000 domestic migrants since 2000, for a loss rate of 2.2%, well below that of New York, Los Angeles and Chicago.

    Houston: Houston ranks sixth, with 5.9 million people and is giving Dallas-Fort Worth a “run for its money.” Like Dallas-Fort Worth, Houston has added more than 1,000,000 people since 2000. Over the same period, Houston has passed Miami and Washington (DC) in population. Houston has added a net 244,000 domestic migrants since 2000, and added 50,000 in 2008-2009, the largest number in the country. Like Dallas-Fort Worth, Houston accelerated its annual domestic migration growth rate in 2008-2009. At the current growth rate, Houston seems likely to pass Philadelphia in population shortly after the 2010 census.

    Miami: Miami (stretching from Miami through Fort Lauderdale to West Palm Beach) is the seventh largest metropolitan area, with 5.6 million people. Miami has added more than 500,000 people, for a growth rate of 10.4%. However, Miami has suffered substantial domestic migration losses, at 287,000, a loss rate of, 5.7% relative to its 2000 population.

    Washington (DC): Washington recaptured 8th place, moving ahead of Atlanta, which had temporarily replaced it. Washington’s population is 5.5 million and added 655,000 between 2000 and 2009, for a growth rate of 13.6%. However, Washington lost a net 110,000 domestic migrants, 2.2% of its 2000 population. That trend was reversed in 2008-2009, when a net 18,000 domestic migrants moved to Washington, perhaps reflecting the increased concentration of economic power in the nation’s capital.

    Atlanta: Atlanta is the real surprise this year. For more than 30 years, Atlanta has had strong growth, however, this year it slowed. Atlanta is the 9th largest metropolitan area in the nation, at 5.5 million. Since 2000, Atlanta has added 1.2 million people, though added only 90,000 last year. Atlanta has added a net 429,000 domestic migrants since 2000, though the rate slowed to only 17,000 in 2008-2009.

    Boston: Boston is the nation’s 10th largest metropolitan area, with 4.6 million people. During the 2000s, Boston has added nearly 200,000, growing by 4.2%. Yet, Boston has also experienced a net domestic migration loss of 236,000, or 5.4% of its 2000 population. In 2008-2009, Boston, like Washington, reversed its domestic migration losses, adding 7,000.

    Trends by Size of Metropolitan Area: As throughout the decade, the slowest growing areas of the nation have been metropolitan areas over 10,000,000 population (New York and Los Angeles), which grew 3.9% and non-metropolitan areas, which grew 2.6% during the decade Metropolitan areas that had between 2.5 and 5.0 million population in 2000 boasted the biggest jump (these include fast growing Houston and Atlanta, which are now more than 5 million), at 13.4% for the decade. All of the other size classifications grew between 8.9% and 11.3% over the decade (see Demographia US Metropolitan Areas, Table 1). Metropolitan areas that began the decade with between 5,000,000 and 10,000,000 population gained 10.0%. Those with 250,000 to 500,000 grew 10.4%, those with 500,000 to 1,000,000 grew 10.2% and the smallest metropolitan areas, those from 50,000 to 250,000 grew 8.9%

    Metropolitan areas over 1,000,000 population lost 2.19 million domestic migrants during the decade, but smaller metropolitan areas added 2.24 million domestic migrants. Non-metropolitan areas lost 50,000 domestic migrants. In 2009, the smaller metropolitan areas gained 125,000 domestic migrants, while the larger metropolitan areas lost 30,000. Non-metropolitan areas lost more than 90,000 domestic migrants. As noted above, these smaller figures for 2009 reflect the more stable housing market and the extent to which the Great Recession has reduced geographic mobility (See Demographia US Metropolitan Areas, Tables 1 and 3).


    Note: The Median Multiple is the median house price divided by the median household income. The historic standard has been 3.0.

    Photograph: Dallas

    Wendell Cox is a Visiting Professor, Conservatoire National des Arts et Metiers, Paris. He was born in Los Angeles and was appointed to three terms on the Los Angeles County Transportation Commission by Mayor Tom Bradley. He is the author of “War on the Dream: How Anti-Sprawl Policy Threatens the Quality of Life.

  • Midwest Success Stories

    Most observers do not associate the Midwest with urban success, but quite the opposite in fact. But while there are plenty of places that are legitimately suffering, there are also plenty of success stories out there that don’t always get the mindshare or press they deserve.

    First on my list of Midwest success stories is Des Moines, Iowa. This is a smaller,, largely under the radar city, but it has emerged as one of the strongest performers anywhere in the United States. This city defines the term “easy living”, while still managing to be home to major industries like insurance. Being smaller has proven an asset here, as Des Moines has avoided many of the large scale boondoggles like pro sports stadiums cities sometimes engage in to try to prove they are “major league”.

    Instead of competing for bragging rights, Des Moines instead has grown its job base significantly during the “lost decade” of the 2000s. Between 2001 and 2009, it added over 25,000 jobs – a healthy 8.9% clip – and boasts a close to rock bottom (for these times) 6.5% unemployment rate. Des Moines metro grew its population at 15.5% between 2000 and 2008, nearly double the national average, belying the notion that no one wants to live in Iowa. Despite this growth, labor shortages remain a long term local concern. That’s called a nice problem to have.

    Indianapolis is another standout, with a profile closer to the Sun Belt than the Rust Belt. It grew its population at a rate 50% greater than the national average, and also had strong net in-migration,with almost 65,000 net people deciding to pack up and move to Indy. Its demographic and economic stats are very comparable to Portland, Oregon, the urban policy poster child. In fact, Indianapolis actually added more jobs than Portland – where job growth has been largely in the suburban periphery – last decade thanks to an aggressive pro-business attitude and local industry clusters like life sciences, motorsports, and internet marketing.

    Indianapolis may also be the least expensive major housing market in America, but it maintains a full range of urban amenities and is only three hours drive from Chicago for those things it lacks. This is one reason Business Week just named the large suburb of Fishers the best affordable suburb in the United States. Indy has also quietly established a position as an urban innovator, with unique to the nation projects like a downtown urban trail. It is also a leader in modern roundabouts, with suburban Carmel having 5% of all the modern roundabouts in the entire United States.

    Head east on I-70 and three hours later you’ll arrive in Columbus, Ohio, Indy’s “twin city”. Like Indianapolis, an artificially chosen state capital, Columbus is thriving in a struggling state. Like Indy, it also has strong population growth and net in-migration, and a below average unemployment rate. It’s home to powerhouse Ohio State University, which boasts the nation’s largest college campus, and stunning historic neighborhoods like German Village. Columbus is home to a thriving LGBT community, and the second largest gay pride parade in the Midwest after Chicago, one of the top ten in the country, attracting over 100,000 attendees.

    West along I-70 is Kansas City. Described as a “zone of sanity”, Kansas City avoided the housing boom and thus largely the bust, remaining another affordable and attractive place to live. It too has had strong population growth and net in-migration, along with below average unemployment. The city is the second largest rail hub in the United States after Chicago, but lacks that city’s legendary rail congestion. Unsurprisingly, rail carriers are investing heavily there. With rail connectivity to Mexican ports, and sitting along I-35, Kansas City is looking to be one of the winners of NAFTA. Plentiful fountains and miles of lush parkways make Kansas City a lovely city. It is also a cultural hub, with the respected Nelson-Aktins Museum at the high end and the thriving Crossroads Art District on the grass roots side.

    Madison, Wisconsin is one of the rare Midwest cities that actually gets national respect. Its location along a narrow isthmus creates a charming physical setting and compact urban core. Home to the University of Wisconsin, its progressive credentials are unimpeachable. But it is also an economic success story, with strong job growth of 6.6% from 2001-2009, along with impressive population growth. Part of this is the university’s powerhouse researchers, who attracted the likes of Google to open an office. The city is also the state capital. Despite being a smaller city, it boasts amenities worthy of America’s elite metropolises, including super-high end denim retailer Context Clothing and the luxurious Candinas Chocolatier.

    Despite its reputation for frigid weather and its geographically peripheral location, Minneapolis-St. Paul offers both economic strength and high quality of life. Its residents embrace the recreational opportunities provided by numerous nearby lakes, including several inside the Minneapolis city limits, as well as the winter. The region was early to the starchitect game, with Frank Gehry designing the metallic Weisman Art Center before the Bilbao Guggenheim. But it’s not all fun and games there. The region has an unemployment rate well below average and a GDP per capita well above it. It is home to numerous household name firms like Target, Best Buy, and 3M. And it is a center for the medical device industry.

    These six cities show that there’s a lot more to the Midwest than rusted steel mills, shuttered auto plants, and abandoned houses. It is also home to healthy cities and thriving suburban communities that are outpacing the nation demographically and economically. These places offer affordability and a high quality of life, but still manage to feature many more urban amenities and innovations than commonly assumed. These characteristics make them well-positioned to be among the urban winners in the 21st century.

    Aaron M. Renn is an independent writer on urban affairs based in the Midwest. His writings appear at The Urbanophile.

    Photo by Carl Van Rooy (vanrooy_13)

  • Forced March To The Cities

    California is in trouble: Unemployment is over 13%, the state is broke and hundreds of thousands of people, many of them middle-class families, are streaming for the exits. But to some politicians, like Sen. Alan Lowenthal, the real challenge for California “progressives” is not to fix the economy but to reengineer the way people live.

    In Lowenthal’s case the clarion call is to take steps to ban free parking. This way, the Long Beach Democrat reasons, Californians would have to give up their cars and either take the bus or walk to their local shops. “Free parking has significant social, economic and environmental costs,” Lowenthal told the Los Angeles Times. “It increases congestion and greenhouse gas emissions.”

    Scarily, his proposal actually passed the State Senate.

    One would hope that the mania for changing how people live and work could be dismissed as just local Californian lunacy. Yet across the country, and within the Obama Administration, there is a growing predilection to endorse policies that steer the bulk of new development into our already most-crowded urban areas.

    One influential document called “Moving Cooler”, cooked up by the Environmental Protection Agency, the Urban Land Institute, the Environmental Defense Fund, Natural Resources Defense Council, the Environmental Protection Agency and others, lays out a strategy that would essentially force the vast majority of new development into dense city cores.

    Over the next 40 years this could result in something like 60 million to 80 million people being crammed into existing central cities. These policies work hard to make suburban life as miserable as possible by shifting infrastructure spending to dense areas. One proposal, “Moving Cooler,” outdoes even Lowenthal by calling for charges of upwards of $400 for people to park in front of their own houses.

    The ostensible justification for this policy lies in the dynamics of slowing climate change. Forcing people to live in dense cities, the reasoning goes, would make people give up all those free parking opportunities and and even their private vehicles, which would reduce their dreaded “carbon imprint.”

    Yet there are a few little problems with this “cramming” policy. Its environmental implications are far from assured. According to some recent studies in Australia, the carbon footprint of high-rise urban residents is higher than that of medium- and low-density suburban homes, due to such things as the cost of heating common areas, including parking garages, and the highly consumptive lifestyles of more affluent urbanites.

    Moreover, it appears that even those who live in dense places may be loath to give up their cars. Over 90% of all jobs in American metropolitan regions are located outside the central business districts, which tend to be the only places well suited for mass transit.

    Indeed, despite the massive expansion of transit systems in the past 30 years, the percentage of people taking public transportation in major metropolitan regions has dropped from roughly 8% to closer to 5%. Even in Portland, Ore.–the mecca for new wave transit consciousness–the share of people using transit to get to work is now considerably less than it was in 1980. In recent months overall transit ridership nationwide has actually dropped.

    These realities suggest that densification of most cities–with the exceptions of New York, Washington and perhaps a few others–cannot be supported by transit. Furthermore, drivers in dense cities will be confronted with not less congestion, but more, which will likely also boost pollution. The most congested cities in the country tend to be the densest, such as Los Angeles, Sen. Lowenthal’s bailiwick, which is in an unenviable first place.

    Then there is the little issue of people’s preferences. Urban boosters have been correct in saying that until recently there have been too few opportunities for middle-class residents to live in and around city cores. But over the past decade many cities have gone for broke with dense condo and rental housing and have produced far more product, often at very high cost, than the market can reasonably bear.

    Initially, when the mortgage crisis broke, the density advocates built much of their case on the fact that the biggest hits took place in suburban areas, particularly on the fringe. Yet as suburban construction ended, cities continued building high-density urban housing–sometimes encouraged by city subsidies. As a result, in the last two years massive foreclosures have plagued many cities, and many condominiums have been converted to rentals. This is true in bubble towns like Las Vegas and Miami; “smart-growth” bastions like Portland and Seattle; and even relatively sane places such as Kansas City, Mo. All these places have a massive amount of high-density condos that are either vacant or converted into lower-cost rentals.

    Take Portland. The city’s condo prices are down 30% from their original list price. The 177-unit Encore, one of the fanciest new towers, has closed sales on 12 of its units as of March, while another goes to auction. Meanwhile in New York half-completed structures dot Brooklyn’s once-thriving Williamsburg neighborhood, while the massive Stuyvesant Town apartment complex in Manhattan teeters at the edge of bankruptcy.

    Finally, it is unlikely that cities would be able to accommodate the massive growth promoted by urban boosters, land speculators and policy mavens. Aaron Renn, who writes the influential Urbanophile blog, says that most American cities today struggle to maintain their current infrastructure. They also have limited options to zone land for high-density construction, due in part to grassroots opposition to existing residential neighborhoods. Overall they would be hard-pressed to accommodate much more than 10% of their region’s growth, much less 50% or 60%.

    Given these realities, and the depth of the current recession, one might think that governments would focus more on basics like jobs and fixing the infrastructure–in suburbs as well as cities–than reengineering how people live. Yet it is increasingly clear that for many “progressives” the real agenda is not enabling people to achieve their dreams–especially in the form of a suburban single-family house. It is, instead, forcing them to live in what is viewed as more ecologically and socially preferable density.

    In the next few months we may see more of the kind of hyperregulation proposed by the likes of Sen. Lowenthal. It is entirely possible that a hoary coalition of HUD, Department of Transportation and EPA bureaucrats could start trying to restrict future housing development along the lines suggested in “Moving Cooler.”

    Yet over time one has to wonder about the political efficacy of this approach. Right now Americans are focused primarily on simply economic growth–and perhaps a touch less on the intellectual niceties of the “smart” form. In addition they are increasingly skeptical about climate change, which serves as the primary raison d’etre behind the new regulatory schema.

    Given the zealousness of the density advocates, perhaps the only thing that will slow, and even reverse, this process will be the political equivalent of a sharp slap across the face. Unless the ruling party begins to reacquaint itself with the preferences and aspirations of the vast majority of Americans, they may find themselves experiencing repeats of their recent humiliating defeat–manufactured largely in the Boston suburbs–in true-blue Massachusetts.

    Americans–suburban or urban–may resist a return to unbridled and extreme Republicanism, whether on social issues or in economic policy. But forced to choose between Neanderthals, who at least might leave them alone in their daily lives, and higher-order intellects determined to reengineer their lives, they might end up supporting bipeds lower down the evolutionary chain, at least until the progressive vanguard regains a grip on common sense.

    This article originally appeared at Forbes.com.

    Joel Kotkin is executive editor of NewGeography.com and is a distinguished presidential fellow in urban futures at Chapman University. He is author of The City: A Global History. His newest book is The Next Hundred Million: America in 2050, released in Febuary, 2010.

    Photo: Creativity+ Timothy K Hamilton

  • Numbers Don’t Support Migration Exodus to “Cool Cities”

    For the past decade a large coterie of pundits, prognosticators and their media camp followers have insisted that growth in America would be concentrated in places hip and cool, largely the bluish regions of the country.

    Since the onset of the recession, which has hit many once-thriving Sun Belt hot spots, this chorus has grown bolder. The Wall Street Journal, for example, recently identified the “Next Youth-Magnet Cities” as drawn from the old “hip and cool” collection of yore: Seattle, Portland, Washington, New York and Austin, Texas.

    It’s not just the young who will flock to the blue meccas, but money and business as well, according to the narrative. The future, the Atlantic assured its readers, did not belong to the rubes in the suburbs or Sun Belt, but to high-density, high-end places like New York, San Francisco and Boston.

    This narrative, which has not changed much over the past decade, is misleading and largely misstated. Net migration, both before and after the Great Recession, according to analysis by the Praxis Strategy Group, has continued to be strongest to the predominately red states of the South and Intermountain West.

    This seems true even for those seeking high-end jobs. Between 2006 and 2008, the metropolitan areas that enjoyed the fastest percentage shift toward educated and professional workers and industries included nominally “unhip” places like Indianapolis, Charlotte, N.C., Memphis, Tenn., Salt Lake City, Jacksonville, Fla., Tampa, Fla., and Kansas City, Mo.

    The overall migration numbers are even more revealing. As was the case for much of the past decade, the biggest gainers continue to include cities such as San Antonio, Dallas and Houston. Rather than being oases for migrants, some oft-cited magnets such as New York, Boston, Los Angeles and Chicago have all suffered considerable loss of population to other regions over the past year.

    Much the same pattern emerges when you look at longer-term state demographic patterns. A recent survey by the Empire Center for New York State Policy found that the biggest net losers in terms of per capita outmigration between 2000 and 2008 were, with the exception of Louisiana, all blue state bastions. New York residents lead in terms of rate of exodus, closely followed by the District of Columbia, Michigan, Pennsylvania, Massachusetts and California.

    An even greater shock to the sensibilities of the insular, Manhattan-centric media, the report found that most of the movement from the Empire State was not from the much-dissed suburbia, but from that hip and cool paragon, New York City. This can not be ascribed as a loss of the unwanted: According to the report, those leaving the city had 13% higher incomes than those coming in.

    How can this be, when everyone who’s smart and hip is headed to the Big Apple? This question was addressed in a report by the center-left, New York-based Center for an Urban Future. True, considerable numbers of young, educated people come to New York, but it turns out that many of them leave for the suburbs or other states as they reach their peak earning years.

    Indeed, it’s astonishing given the many clear improvements in New York that more residents left the five boroughs for other locales in 2006, the peak of the last boom, than in 1993, when the city was in demonstrably worse shape. In 2006, the city had a net loss of 153,828 residents through domestic out-migration, compared to a decline of 141,047 in 1993, with every borough except Brooklyn experiencing a higher number of out-migrants in 2006.

    Of course, blue state boosters can point out that the exodus has slowed with the recession, as opportunities have dried up elsewhere. True, the flood of migration has slowed across the nation. Yet it has only slowed, not dried up. When the economy revives, it’s likely to start flowing heavily again.

    More important, the key group leaving New York and other so-called “youth-magnets” comprises the middle class, particularly families, critical to any long-term urban revival. This year’s Census shows that the number of single households in New York has reached record levels; in Manhattan, more than half of all households are singles. And the Urban Future report’s analysis found that even well-heeled Manhattanites with children tend to leave once they reach the age of 5 or above.

    The key factor here may well be economic opportunity. Virtually all the supposedly top-ranked cities cited in this media narrative have suffered below-average job growth throughout the decade. Some, like Portland and New York, have added almost no new jobs; others like San Francisco, Boston and Chicago have actually lost positions over the past decade.

    In contrast, even after the current doldrums, San Antonio, Orlando, Houston, Dallas and Phoenix all boast at least 5% more jobs now than a decade ago. Among the large-narrative magnet regions only one–government-bloated greater Washington–has enjoyed strong employment growth.

    The impact of job growth on the middle class has been profound. New York City, for example, has the smallest share of middle-income families in the nation, according to a recent Brookings Institution study; its proportion of middle-income neighborhoods was smaller than that of any metropolitan area except Los Angeles.The same pattern has also emerged in what has become widely touted as America’s “model city”–President Obama’s adopted hometown of Chicago.

    The likely reasons behind these troubling trends are things rarely discussed in “the narrative”–concerns like high costs, taxes and regulations making it tough on industries that employ the middle class. One clear culprit: out of control state spending. State spending in New York is second per capita in the nation (anomalous Alaska is first); California stands fourth and New Jersey seventh. Illinois is down the list but coming up fast. Over the past decade, while its population grew by only 7%, Illinois’ spending grew by an inflation-adjusted 39%.

    The problem here is more than just too-large government; it lies in how states spend their money. Massive public spending increases over the past decade in California, New Jersey, Illinois and New York have gone overwhelmingly into the pockets and pensions of public employees. It certainly has not flowed into such basic infrastructure as roads, bridges and ports that are needed to keep key industries competitive.

    The American Association of State Highway Transportation, for example, ranked New York 43rd in the country and New Jersey dead last in terms of quality of roads. Some 46% of the Garden State’s roads were rated in poor condition, compared with the national average of 13%, even as the state’s spending reached new highs. The typical New Jersey driver spends almost $600 a year in auto repairs necessitated by the poor conditions of the roads.

    In contrast, states in the South and parts of the Plains tend to pour their public resources into productive uses. Cities like Mobile, Ala., Houston, Charleston, S.C., and Savannah, Ga., have been investing in port facilities to take advantage of the planned widening of the Panama Canal. The primary goal is to take business away from the increasingly expensive, overregulated and under-invested ports of the Northeast and West Coast. Similarly, places like Kansas City and the Dakotas are looking to boost their basic rail and road networks to support export-heavy industries.

    Even in the face of the Obama administration’s strongly urban-centric, blue state-oriented economic policy, these generally less than hip places appear poised to grow as the economy recovers. Virtually all the top 10 economies that have withstood the recession come from outside the “youth-magnet” field: San Antonio; Oklahoma City; Little Rock, Ark.; Dallas, Baton Rouge, La.; Tulsa, Okla., Omaha, Neb.; Houston and El Paso, Texas. The one exception to this rule, Austin, also benefits from being located in solvent, generally low-tax Texas.

    This continued erosion of jobs and the middle class from the blue states and cities is not inevitable. Many of these places enjoy enormous assets in terms of universities, strategic location, concentrations of talented workers and entrenched high-wage industries. But short of a massive and continuing bailout from Washington, the only way to reverse their decline will be a thorough reformation of their governmental structure and policies. No narrative, no matter how well spun, can make up for that reality.

    This article originally appeared at Forbes.com.

    Joel Kotkin is executive editor of NewGeography.com and is a distinguished presidential fellow in urban futures at Chapman University. He is author of The City: A Global History. His next book, The Next Hundred Million: America in 2050, will be published by Penguin Press early next year.

  • The White City

    Among the media, academia and within planning circles, there’s a generally standing answer to the question of what cities are the best, the most progressive and best role models for small and mid-sized cities. The standard list includes Portland, Seattle, Austin, Minneapolis, and Denver. In particular, Portland is held up as a paradigm, with its urban growth boundary, extensive transit system, excellent cycling culture, and a pro-density policy. These cities are frequently contrasted with those of the Rust Belt and South, which are found wanting, often even by locals, as “cool” urban places.

    But look closely at these exemplars and a curious fact emerges. If you take away the dominant Tier One cities like New York, Chicago and Los Angeles you will find that the “progressive” cities aren’t red or blue, but another color entirely: white.

    In fact, not one of these “progressive” cities even reaches the national average for African American percentage population in its core county. Perhaps not progressiveness but whiteness is the defining characteristic of the group.

    The progressive paragon of Portland is the whitest on the list, with an African American population less than half the national average. It is America’s ultimate White City. The contrast with other, supposedly less advanced cities is stark.

    It is not just a regional thing, either. Even look just within the state of Texas, where Austin is held up as a bastion of right thinking urbanism next to sprawlvilles like Dallas-Ft. Worth and Houston.

    Again, we see that Austin is far whiter than either Dallas-Ft. Worth or Houston.

    This raises troubling questions about these cities. Why is it that progressivism in smaller metros is so often associated with low numbers of African Americans? Can you have a progressive city properly so-called with only a disproportionate handful of African Americans in it? In addition, why has no one called these cities on it?

    As the college educated flock to these progressive El Dorados, many factors are cited as reasons: transit systems, density, bike lanes, walkable communities, robust art and cultural scenes. But another way to look at it is simply as White Flight writ large. Why move to the suburbs of your stodgy Midwest city to escape African Americans and get criticized for it when you can move to Portland and actually be praised as progressive, urban and hip? Many of the policies of Portland are not that dissimilar from those of upscale suburbs in their effects. Urban growth boundaries and other mechanisms raise land prices and render housing less affordable exactly the same as large lot zoning and building codes that mandate brick and other expensive materials do. They both contribute to reducing housing affordability for historically disadvantaged communities. Just like the most exclusive suburbs.

    This lack of racial diversity helps explain why urban boosters focus increasingly on international immigration as a diversity measure. Minneapolis, Portland and Austin do have more foreign born than African Americans, and do better than Rust Belt cities on that metric, but that’s a low hurdle to jump. They lack the diversity of a Miami, Houston, Los Angeles or a host of other unheralded towns from the Texas border to Las Vegas and Orlando. They even have far fewer foreign born residents than many suburban counties of America’s major cities.

    The relative lack of diversity in places like Portland raises some tough questions the perennially PC urban boosters might not want to answer. For example, how can a city define itself as diverse or progressive while lacking in African Americans, the traditional sine qua non of diversity, and often in immigrants as well?

    Imagine a large corporation with a workforce whose African American percentage far lagged its industry peers, sans any apparent concern, and without a credible action plan to remediate it. Would such a corporation be viewed as a progressive firm and employer? The answer is obvious. Yet the same situation in major cities yields a different answer. Curious.

    In fact, lack of ethnic diversity may have much to do with what allows these places to be “progressive”. It’s easy to have Scandinavian policies if you have Scandinavian demographics. Minneapolis-St. Paul, of course, is notable in its Scandinavian heritage; Seattle and Portland received much of their initial migrants from the northern tier of America, which has always been heavily Germanic and Scandinavian.

    In comparison to the great cities of the Rust Belt, the Northeast, California and Texas, these cities have relatively homogenous populations. Lack of diversity in culture makes it far easier to implement “progressive” policies that cater to populations with similar values; much the same can be seen in such celebrated urban model cultures in the Netherlands and Scandinavia. Their relative wealth also leads to a natural adoption of the default strategy of the upscale suburb: the nicest stuff for the people with the most money. It is much more difficult when you have more racially and economically diverse populations with different needs, interests, and desires to reconcile.

    In contrast, the starker part of racial history in America has been one of the defining elements of the history of the cities of the Northeast, Midwest, and South. Slavery and Jim Crow led to the Great Migration to the industrial North, which broke the old ethnic machine urban consensus there. Civil rights struggles, fair housing, affirmative action, school integration and busing, riots, red lining, block busting, public housing, the emergence of black political leaders – especially mayors – prompted white flight and the associated disinvestment, leading to the decline of urban schools and neighborhoods.

    There’s a long, depressing history here.

    In Texas, California, and south Florida a somewhat similar, if less stark, pattern has occurred with largely Latino immigration. This can be seen in the evolution of Miami, Los Angeles, and increasingly Houston, San Antonio and Dallas. Just like African-Americans, Latino immigrants also are disproportionately poor and often have different site priorities and sensibilities than upscale whites.

    This may explain why most of the smaller cities of the Midwest and South have not proven amenable to replicating the policies of Portland. Most Midwest advocates of, for example, rail transit, have tried to simply transplant the Portland solution to their city without thinking about the local context in terms of system goals and design, and how to sell it. Civic leaders in city after city duly make their pilgrimage to Denver or Portland to check out shiny new transit systems, but the resulting videos of smiling yuppies and happy hipsters are not likely to impress anyone over at the local NAACP or in the barrios.

    We are seeing this script played out in Cincinnati presently, where an odd coalition of African Americans and anti-tax Republicans has formed to try to stop a streetcar system. Streetcar advocates imported Portland’s solution and arguments to Cincinnati without thinking hard enough to make the case for how it would benefit the whole community.

    That’s not to let these other cities off the hook. Most of them have let their urban cores decay. Almost without exception, they have done nothing to engage with their African American populations. If people really believe what they say about diversity being a source of strength, why not act like it? I believe that cities that start taking their African American and other minority communities seriously, seeing them as a pillar of civic growth, will reap big dividends and distinguish themselves in the marketplace.

    This trail has been blazed not by the “progressive” paragons but by places like Atlanta, Dallas and Houston. Atlanta, long known as one of America’s premier African American cities, has boomed to become the capital of the New South. It should come as no surprise that good for African Americans has meant good for whites too. Similarly, Houston took in tens of thousands of mostly poor and overwhelmingly African American refugees from Hurricane Katrina. Houston, a booming metro and emerging world city, rolled out the welcome mat for them – and for Latinos, Asians and other newcomers. They see these people as possessing talent worth having.

    This history and resulting political dynamic could not be more different from what happened in Portland and its “progressive” brethren. These cities have never been black, and may never be predominately Latino. Perhaps they cannot be blamed for this but they certainly should not be self-congratulatory about it or feel superior about the urban policies a lack of diversity has enabled.

    Aaron M. Renn is an independent writer on urban affairs based in the Midwest. His writings appear at The Urbanophile.

  • Go to Middle America, Young Men & Women

    A few weeks ago, Eamon Moynihan reviewed economic research on cost of living by state in a newgeography.com article. The results may seem surprising, given that some of the states with the highest median incomes rated far lower once prices were taken into consideration. The dynamic extends to the nation’s 51 metropolitan areas with more than 1,000,000 population (See Table).

    There is a general perception that the most affluent metropolitan areas are on the east coast and the west coast. Indeed, 8 of the 10 metropolitan areas with the highest nominal per capita income in 2006 were on the two coasts. These included San Francisco, San Jose and Seattle on the west coast and Washington, Boston, New York, Hartford and Philadelphia on the east coast. Middle-America is represented by Denver and Minneapolis-St. Paul. However, as anyone who has lived on the coasts and Middle America knows, a dollar in New York or San Francisco does not buy nearly as much as a dollar in Dallas-Fort Worth or Cincinnati.

    Per Capita Income: Purchasing Power Parity
    US Metropolitan Areas over 1,000,000 Population
        2006 Per Capita Income  
    Rank Metroplitan Area Purchasing Power Adjusted Nominal Nominal Rank
    1 San Francisco $46,287 $57,747 1
    2 Washington $45,178 $51,868 3
    3 Denver $44,798 $44,691 8
    4 Minneapolis-St. Paul $44,326 $44,237 9
    5 Houston $42,815 $43,174 11
    6 Boston $42,571 $50,542 4
    7 Pittsburgh $41,716 $38,550 20
    8 St. Louis $41,613 $37,652 27
    9 Milwaukee $41,572 $39,536 19
    10 Baltimore $41,451 $43,026 12
    11 Seattle $41,448 $45,369 6
    12 Kansas City $41,329 $37,566 28
    13 Hartford $41,104 $44,835 7
    14 New Orleans $40,935 $40,211 16
    15 Philadelphia $40,725 $43,364 10
    16 Dallas-Fort Worth $40,643 $39,924 17
    17 Cleveland $39,997 $37,406 30
    18 Indianapolis $39,843 $37,735 26
    19 Chicago $39,752 $41,591 14
    20 Richmond $39,282 $38,233 22
    21 New York $39,201 $49,789 5
    22 Birmingham $39,057 $37,331 31
    23 Cincinnati $38,691 $36,650 36
    24 Nashville $38,680 $37,758 25
    25 Detroit $38,670 $38,119 24
    26 Charlotte $38,632 $38,164 23
    27 Miami $38,555 $40,737 15
    28 San Jose $38,505 $55,020 2
    29 Jacksonville $38,413 $37,519 29
    30 Louisville $38,262 $36,000 41
    31 Oklahoma City $38,156 $35,637 42
    32 Las Vegas $37,691 $38,281 21
    33 Salt Lake City $37,381 $35,145 45
    34 San Diego $37,358 $42,801 13
    35 Rochester $37,066 $36,179 38
    36 Columbus $37,058 $36,110 39
    37 Atlanta $36,691 $36,060 40
    38 Memphis $36,501 $35,470 44
    39 Tampa-St. Petersburg $36,260 $35,541 43
    40 Portland $36,131 $36,845 35
    41 Buffalo $36,091 $33,803 48
    42 Norfolk (Virginia Beach metropolitan area) $35,418 $34,858 46
    43 Raleigh $35,087 $37,221 32
    44 San Antonio $34,913 $32,810 50
    45 Providence $34,690 $37,040 34
    46 Austin $33,832 $36,328 37
    47 Phoenix $33,809 $34,215 47
    48 Sacramento $32,750 $37,078 33
    49 Los Angeles $32,544 $39,880 18
    50 Orlando $32,095 $33,092 49
    51 Riverside-San Bernardino $25,840 $27,936 51
    Source:        
    http://www.bea.gov/scb/pdf/2008/11%20November/1108_spotlight_parities.pdf

    Purchasing Power Parity: Things change rather dramatically when purchasing power is factored in. Some years ago, international economic organizations, such as the Organization for Economic Cooperation and Development, the World Bank and the International Monetary Fund began using costs of living by nation to compare national economic performance, rather than currency exchange rate. This practice, called “purchasing power parity” is based upon the recognition that there may be substantial differences in the cost of living between nations.

    This can be illustrated by comparing Switzerland and the United States. For years, Switzerland has had a higher per capita GDP than the United States on an exchange rate basis. Switzerland’s gross domestic product per capita was $53,300 in 2006, nearly 30% above that of the United States ($42,000). However price levels in Switzerland are so high that incomes do not go nearly as far as the exchange rate would suggest. Once adjusted for purchasing power parity, the Swiss GDP per capita in 2006 drops to $39,000, well below that of the United States. Much of the difference has to do with regulation. The more liberal economy of the United States produces a lower cost economy than in Switzerland, or for that matter most of Western Europe. The US economic advantage would be even greater measured on a household basis, since US households include nearly 10% more members (generally children) than those in Western Europe.

    The same concept was applied by the Department of Commerce Bureau of Economic Analysis researchers in their review of purchasing power parities between US metropolitan areas in 2006. When purchasing power is factored in, five of the top metropolitan areas in nominal per capita income (not adjusted for purchasing power) drop out and are replaced by other metropolitan areas rarely thought of as among the nation’s most affluent.

    Among the three west coast nominal leaders, San Francisco remains as #1, in both nominal and purchasing power adjusted per capita income. Seattle dropped from 6th to 11th position. However, the real surprise is San Jose, which dropped from 2nd position to 28th.

    The east coast regions ranked among the top 10 metropolitan areas in nominal income also were decimated by their high costs, with only Washington (which rose from 3rd to 2nd) and Boston (which fell from 4th to 6th) remaining. New York fell from 5th to 21st, Hartford from 7th to 13th and Philadelphia from 10th to 16th.

    The two non-coastal metropolitan areas in the nominal top 10 remain, with Denver rising from to 3rd and Minneapolis-St. Paul rising from 9th to 4th.

    It can be argued that Middle-America replaced the five metropolitan areas dropping out of the top ten. Houston, long one of the most disparaged metropolitan areas among urbanists, occupies the 5th position (compared to its 11th ranking in the nominal list). Three of the new entrants are confirmed members of the Rust Belt: Pittsburgh (7th), St. Louis (8th) and Milwaukee (9th). Finally, there is a new east coast entrant, blue-collar Baltimore (10th).

    The Impact of Taxes: But that is just the beginning. Taxes also diminish the purchasing power of households. Unfortunately, there is virtually no readily available information on state and local taxation by metropolitan area. There is, however state and local government taxation data at the state level. If it is assumed that this data is representative of metropolitan differences (weighted proportionately by state in multi-state metropolitan areas), there would be changes in rank among the top 10. Denver would displace Washington in the number two position, closing more than one-half the gap with San Francisco. Even more surprisingly, St. Louis would move ahead of both Boston and Pittsburgh to rank 6th. Kansas City would leap over #11 Seattle, Baltimore, Milwaukee and Pittsburgh to rank 8th, trailing #7 Boston by $25, not much more than the price of a Red Sox standing room ticket. Pittsburgh would occupy the #9 position and Milwaukee #10 (See Figure).

    More than Housing: The largest differences in purchasing power stem from housing, with east coast and west coast metropolitan areas having generally higher housing costs. As a result of the housing bust and the larger house price drops in those areas, purchasing power adjusted incomes could recover relative to those of Middle America. However, the high cost of living on the east and west coasts extend to more than housing prices. Generally, according to proprietary (and for sale) ACCRA cost of living data, the west coast and east coast metropolitan areas have higher costs of living even without housing. These differences are largely in grocery costs, which probably reflects the anti-big box store planning regulations and politics that exist in many of these areas. Grocery costs in the more affluent middle-American metropolitan areas tend to be lower.

    Other Surprises: Outside the top 10 most affluent metropolitan areas, there are other surprises. Urban planning favorite Portland ranks 40th, just above Buffalo. Rust Belt Cleveland ranks 17th, a few positions above New York. Kansas City, with its highly decentralized civic architecture, ranks 12th, just behind Seattle. Indianapolis (17th) is more affluent than Chicago (18th) and both are more affluent than New York.

    Five of the bottom 10 metropolitan areas are in the south, including Virginia Beach, Raleigh, Austin, San Antonio and Orlando. But perhaps the biggest surprise of all is that four of the five lowest ranking metropolitan areas are in the southwest: Phoenix (47th), Sacramento (48th), Los Angeles (49th) and Riverside-San Bernardino (51st).

    The Dominance of Middle America: But among the 10 most affluent metropolitan areas in the nation, six or seven may be counted as Middle-America (depending on how Baltimore is classified). Only three are from the original group that supplies 8 of the top metropolitan areas when purchasing power is not considered.


    Related articles:
    Gross Domestic Product per Capita, PPP: World Metropolitan Regions
    Gross Domestic Product per Capita, PPP: China Metropolitan Regions

    Photograph: Pittsburgh

    Wendell Cox is a Visiting Professor, Conservatoire National des Arts et Metiers, Paris. He was born in Los Angeles and was appointed to three terms on the Los Angeles County Transportation Commission by Mayor Tom Bradley. He is the author of “War on the Dream: How Anti-Sprawl Policy Threatens the Quality of Life.

  • The Successful, the Stable, and the Struggling Midwest Cities

    The Midwest has a deserved reputation as a place that has largely failed to adapt to the globalized world. For example, no Midwestern city would qualify as a boomtown but still there remain a diversity of outcomes in how the region’s cities have dealt with their shared heritage and challenges. Some places are faring surprisingly well, outpacing even the national average in many measures, while others bring up the bottom of the league tables in multiple civics measures.

    Let us examine the health of various cities, using population growth as a heuristic proxy for overall civic health. Looking at population change from 2000 to 2008, we will classify a city as “successful” if its metro area population growth exceeded the national average growth rate of 8% during that period, as “stable” if it had a population growth rate between 3% and 8%, and as “struggling” if its growth was less than 3%. Let us also put Chicago into its own category of “global city”. It is simply one of a kind in the Midwest, a colossus of nearly 10 million people, and not easily measured against the other cities. Indeed, it is really three cities in one, a prosperous urban core, an archipelago of successful upscale suburbs and edge based growth to the west and north, with a sea of deteriorating city neighborhoods and stagnant to declining suburbs surrounding them. On our scale, Chicago would be “stable” – its inner core has grown but the city overall has lost population, while the outer ring has grown strongly. As a region, it has grown somewhat below the national average.

    Here are the results of our tiering, including all cities in the Midwest* with metro areas exceeding 500,000 in population:

    Global City
    Chicago (5.2%)

    Successful Cities
    Des Moines (15.6%)
    Indianapolis (12.5%)
    Madison (11.9%)
    Columbus (9.9%)
    Kansas City (9.0%)
    Minneapolis-St. Paul (8.8%)

    Stable Cities
    Cincinnati (7.2%)
    Grand Rapids (4.9%)
    St. Louis (4.4%)
    Milwaukee (3.2%)

    Struggling Cities
    Akron (0.5%)
    Detroit (-0.6%)
    Dayton (-1.4%)
    Toledo (-1.5%)
    Cleveland (-2.8%)
    Youngstown (-6.1%)

    These tiers, based only on a single criterion and arbitrary boundaries, nevertheless basically conform to how these cities are performing both economically and in terms of perceptions.

    A few interesting things emerge:

    1. There are a surprisingly large number of Midwestern cities that are growing faster than the US average population. This indicates pockets of strength, in its larger metros at least, seldom associated with the Midwest.
    2. The clear dominance of the successful list by state capitals. This is so pronounced that I have put forth what I call the “Urbanophile Conjecture”, which is that if you want to be a successful Midwestern city, it helps to be a state capital with a metro area population of over 500,000. The only successful city on the list that is not a state capital is Kansas City.
    3. The 500,000 barrier seems to be important as well. The state capitals below that threshold – Lansing, Springfield, and Jefferson City – would not qualify as successful on this list. Note too that the presence or absence of the major state university does not appear to be a decisive factor. Des Moines and Indianapolis are not home to their states’ flagship universities. The home of the academic powerhouse that is the University of Michigan is the Ann Arbor metro area, which was not included in this list because its population is only about 350,000. Notwithstanding, its growth rate would have put it into the stable category.
    4. In a region in which there is such divergence between the performance of cities, a diversity of city specific policies are required. There is no one size fits all for the Midwest. There may indeed be a base of pan-Midwest policies worth pursuing – improvements in education, attractiveness to migrants, better conditions for innovative entrepreneurship, etc – but successful approaches will be those most tailored to uniquely local conditions. For example, a state capital or University town may have different needs than a place that has neither.

    Some suggested areas to investigate by city tier are:

    • Chicago. How can it ease the gap between the thriving global city of Chicago – largely located around the Loop as well as the northern and western suburbs – and the parts of the region that are falling behind, largely the western city neighborhoods and southern edge of metropolis? How do you do this without sacrificing its overall competitiveness? Can the policies appropriate to each be reconciled?
    • Successful Cities. Their policy focus should be on maintaining favorable demographic and economic conditions, and dealing with decaying areas of their urban cores and the potential for decay in some inner ring suburbs. Should the civic aspiration be desirous of it, tuning the engine to attempt to shift the growth rate into high gear to target a profile closer to the Sunbelt boomtowns would be a further focus area. Each city would need to examine which specific policy levers it could pull to attempt to do this. Clearly modernizing and expanding infrastructure to keep up with growth in these places and maintain their high quality of life is a clear imperative.
    • Stable Cities. Their challenge is to bring growth rates up to average or above average levels. It would be worthwhile for them to study the successful areas, and ask what policies and approaches might be adopted. Kansas City offers the best encouragement here. It has managed to maintain a strong growth rate despite not being a state capital and being part of a bi-state metro region. Kansas City features lows costs, high quality of life, a relatively stable housing marketing, and a pro-business culture. It is clearly a standout and worthy of further study for that reason. It may hold the key for moving the stable cities up into the successful tier. Geographically, it is notable that Kansas City is a border state on the far edge of the Midwest, and could arguably be called a Great Plains city. Is that a factor? Some type of peer city comparison with the successful cities, and especially Kansas City, might be warranted here.
    • Struggling Cities. Unfortunately, there isn’t a magic bullet to solve the long festering problems in these places. All of them were heavily industrialized and have borne the brunt of globalization, particularly in manufacturing. This is especially the case in cities linked to the domestic automobile industry, which is clearly in a state of crisis. Until the automobile industry completes its restructuring, and out migration right sizes some of these areas, there does not seem to be a clear path to restart growth. Youngstown, which brings up the bottom of our league table, perhaps offers the best road forward. It is trying to right-size itself to a permanently smaller, but more sustainable, future population based on an aggressive controlled shrinkage plan that has received extensive national notice. This type of plan is likely something all of these cities need to be actively considering as the large fixed costs support a population base that no longer exists will become increasingly unaffordable as the population further shrinks. These cities likely also will need special state and federal help to back this shrinkage plan.

    * The Midwest is defined as Illinois, Indiana, Iowa, Michigan, Minnesota, Missouri, Ohio, and Wisconsin.

    Aaron M. Renn is an independent writer on urban affairs based in the Midwest. His writings appear at The Urbanophile.

  • What Does Urban Success Look Like?

    What does urban success look like? Ask people around the country and they’ll probably say it looks something like Chicago.

    Arguably no American city over the past decade has experienced a greater urban core renaissance than Chicago. It is a city totally transformed. The skyline has been radically enhanced as dozens of skyscrapers were added to the greater downtown area. Millennium Park opened as a $475 million community showplace full of cutting edge contemporary architecture and art. There has been an explosion in upscale dining and shopping options, as well as large numbers of new art galleries, hotels, clubs and restaurants.

    But perhaps nothing shows the transformation of Chicago more than the huge condo boom, with thousands of new units coming online every year. This sent development waves rippling out from the Loop and North Lakefront, often into places that just a short time ago were no man’s lands. If you told someone 15 years ago you lived in the South Loop, they would have said, “Huh?” If you had told them you lived by the old Chicago Stadium, they would have thought you had lost your mind. These and other neighborhoods that were once derelict or dangerous, as well as some that were low key ethnic enclaves, have been transformed into bustling yuppie playgrounds for the new “creative class”.

    But there has been a downside to this for Chicago as well. The influx of the educated elite into the city has significantly raised housing prices in large parts of the city, rendering it unaffordable to others. Supporting the amenities demanded by the city’s new residents costs money, so taxes have gone up, doubling the squeeze on the city’s traditional residents, forcing many of them out.

    So in the end, despite its building boom, it is actually losing people. The Census Bureau estimates the city of Chicago’s population declined by about 60,000 people since 2000. That’s not much on a percentage basis, but, considering the urban core boom, it is telling. While Chicago’s metropolitan area continues to grow, it is doing so slower than the national average and has significant domestic out-migration. Chicago’s metropolitan area saw net domestic out-migration of 42,000 in 2008 and 57,000 in 2007. To put this in perspective, the poster child metro for urban decline, Detroit, Michigan, only lost 62,000 and 58,000 people in those years respectively. Only Chicago’s continued appeal as an immigrant magnet kept it from posting large overall migration losses as it had very high international in-migration.

    Chicago is an incredible urban success story, but only for some. International immigrants and the creative class are flocking, but everyone else is leaving.

    But there is another group of cities in the Midwest, much smaller cities, that are often overlooked, but which offer an alternative model. Places like Columbus, Indianapolis, and Kansas City provide a mirror image of Chicago. Their downtowns have resurged, if not from their glory days in the 1950s, then since their nadir in the 1970s. There is also significant condo construction in their cities. But, beyond these superficial similarities, they are nothing like Chicago. They lack the urban energy of that colossus, its huge inventory of swanky shops and high-end fine dining. They haven’t had a skyscraper boom. Most of their downtown development still requires significant tax subsidies. They feature largely vanilla brand images that don’t give them the coolness factor. And they continue to struggle in attracting top talent to live there.

    Yet in many ways these cities show signs of demographic and economic health that Chicago could only dream about. The Columbus, Indy, and KC regions are all growing faster than the national average in population and, unlike the vast bulk of the Midwest, have significant domestic in-migration. They are outperforming the nation in employment. In fact, it can be argued that they have as much in common with the Sun Belt as the Rust Belt. People are voting with their feet to move to these places. Between 2000 and 2005, about 7,000 net people moved from the Chicago metro area to Indianapolis, for example.

    One key to this lies in affordability. For years Indianapolis has been ranked as the least expensive major housing market in America. Blessed with few natural barriers and pro-private sector governments, housing supply in these cities has grown along with population. Yet at the same time the negative impacts of sprawl have been mitigated by their modest – compared say to Dallas, Phoenix or Houston – growth rates and relatively small size. This leaves them attractive, affordable, and offering a very high quality of life to people without elite professional incomes.

    In short, these cities are just as successful as Chicago; they just do it their own way and serve a different market.

    Indeed what we can see is that there are different forms of urban success. In an ever more diverse America, people define the good life differently. Too much urban policy is focused on one size fits all solutions that assume cities should look and function something like Chicago. But America’s cities are very diverse and require tailored policies to suit the local landscape, and the unique local geography, demography, history, culture, and values that our cities bring to the table. Great cities, like great wines, have to express their terroir.

    As with the consumer market, cities too need to recognize our increasingly complex and diverse population, and sharpen their strategic focus to the target segments they best serve. Chicago is tailoring its offerings to where it believes it can most effectively compete – new immigrants and world class talent. Places like Columbus, Indianapolis, and Kansas City are focusing on a broader middle class. Neither way is right or wrong. Both types of places, and others too, can all find success by offering unique places for people to realize their own personal American Dream.

    Aaron M. Renn is an independent writer on urban affairs based in the Midwest. His writings appear at The Urbanophile.