Tag: Los Angeles

  • Elusive Population Growth in the City of Los Angeles

    How many times can a city reach 4 million population for the first time? I submit that Los Angeles (my birthplace), now near its fourth such celebration, is the undisputed champion, with each of the first three having not actually been reached.

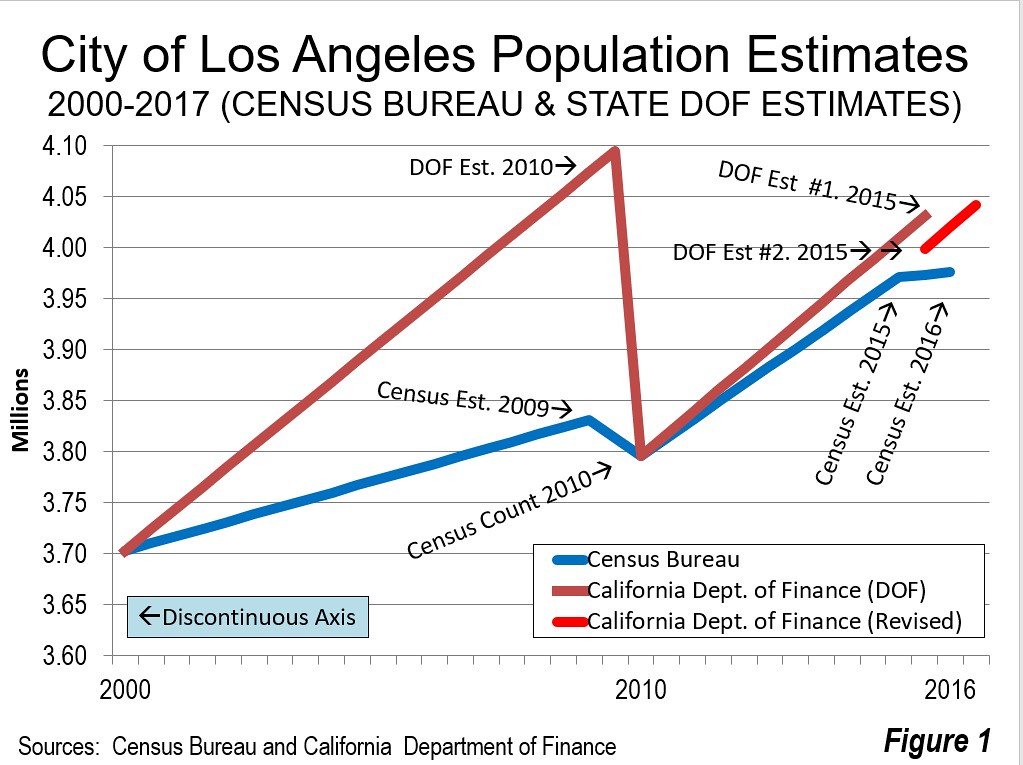
    The first time was in 2008, when the California Department of Finance estimated the city’s population to have jumped to 4,046,000 from the 2006 figure of 3,996,000. The reported population growth continued to 2010, when the Department of Finance estimated that the city had reached 4,095,000 residents. But when it came to counting people, the 2010 United States Census found only 3,793,000. Thus, between 2000 and 2010, the city of Los Angeles population rose 98,000, not the four times higher of 400,000 that the state had estimated.

    Since only the U.S. Census Bureau actually counts all of the nation’s people, it is the authoritative source for population data. The state Department of Finance appropriately recalibrated its 2010 data to equal the census number for 2010.

    The Second and Third First Times

    The second cause for celebration came in 2016, as the LA Weekly headline trumpeted, “Thanks, Millennials: L.A.’s Population Tops 4 Million for the First Time,” reporting on the just released 2016 state Department of Finance estimate of 4,031,000 city residents.

    The third celebration was held just a year later, when the 2017 state Department of Finance population estimate was released, prompting a Los Angeles Times headline, “Los Angeles hits a milestone: 4 million people and counting.” Reaching this milestone the third time was possible again, because the state Department of Finance had revised its 2016 city population estimate to just shy of 4,000,000 (3,999,237), a reduction of 32,000. When releasing its January 2017 estimate of 4,042,000, the Times did not mention either of the two previous times the “milestone” had been reportedly reached. They don’t do history much in newsrooms these days.

    But the U.S. Census Bureau still places the city’s population at below 4,000,000 (3,976,000), as of July 2016. So a fourth first time could be on the horizon (Figure 1).

    Revised U.S. Census Bureau Estimates: 2015

    The reduction in the state estimated population for the city may have been in response to revised 2015 U.S. Census Bureau estimates for virtually all of the nation’s jurisdictions, issued as its 2016 estimates were released (see The Urban Inversion is Over). The city of Los Angeles did poorly in these revisions. The city of Los Angeles had a 22,700 reduction compared to the original estimate, the second greatest in the nation. The city of New York did worse, with a loss of 33,900, though with more than double the population of Los Angeles, actually performed better proportionally.

    Southern California also did poorly in the census recalibrations. Los Angeles County, the nation’s largest, had the greatest reduction, at 58,000. This was more than four times the second largest loss (13,400), which was in Cook County, Illinois (Chicago). The Los Angeles County downward revision was 0.57 percent, while the Cook County reduction was less than one half that, at 0.26 percent. Orange County, the other county in the Los Angeles metropolitan area, had the third greatest reduction out of the more than 3,100 counties, at 13,300, a 0.42 percent loss. The five counties of the larger Los Angeles metropolitan region (the combined statistical area or CSA that includes Los Angeles, Orange, Riverside, San Bernardino and Ventura counties) had a downward reduction of 87,800. Overall, the national reduction was 520,000. Thus, Los Angeles CSA represented 17 percent of the national downward adjustment, nearly three times its six percent share of the population.

    The revisions, even in the Los Angeles area, were small. However, they are further evidence of weakness in California’s population growth. So far this decade, California has grown approximately 12.1 percent less than projected, and, remarkably, grew less than the national average over the past year, a rare, if ever, occurrence. The even greater 27.5 percent shortfall in Los Angeles County means that there will be 175,000 fewer people than projected by 2020, if the current population growth rate continues.

    For the better part of two decades, Los Angeles County has led the nation in domestic migration losses —- the number of people moving out compared to those moving in. Just since 2010, the county has lost 350,000 net domestic migrants, equal to the population of Glendale and Pomona combined.

    All of this will be unwelcome news to people expecting the population growth explosion necessary to support planning “pack and stack” densification dreamss. There are just not enough people moving to Los Angeles, and the horrendous housing costs encourage more to move away.

    The Challenge of Estimating Population

    Ultimately, estimating population is not simple and its accuracy can only be fully known by the actual counts taken in the United States every ten years in the census. The experience of the Census Bureau itself indicates the difficulty. In 2009, the Census Bureau estimated the population of the city of Atlanta at 541,000, a full 120,000 above the actual count taken a year later. Its New York City estimate in 2009 was more than 200,000 above the 2010 census count. The city of Chicago estimate was more than 150,000 high. Similar cases could arise once the 2020 census data is in.

    The Fourth First Time

    Meanwhile, maybe the fourth time will be “for real” and Los Angeles will pass 4,000,000 residents for good. But, even if it actually achieves the milestone a decade after the initial announcement, a good deal less bravado is called for by the trends.

    Wendell Cox is principal of Demographia, an international public policy and demographics firm. He is a Senior Fellow of the Center for Opportunity Urbanism (US), Senior Fellow for Housing Affordability and Municipal Policy for the Frontier Centre for Public Policy (Canada), and a member of the Board of Advisors of the Center for Demographics and Policy at Chapman University (California). He is co-author of the “Demographia International Housing Affordability Survey” and author of “Demographia World Urban Areas” and “War on the Dream: How Anti-Sprawl Policy Threatens the Quality of Life.” He was appointed to three terms on the Los Angeles County Transportation Commission, where he served with the leading city and county leadership as the only non-elected member. He served as a visiting professor at the Conservatoire National des Arts et Metiers, a national university in Paris.

    Photograph: Los Angeles City Hall (by author)
    http://www.newgeography.com/files/imagecache/Chart_Story_Inset/lacityhall2.PNG

  • The Great Transit Rip-Off

    Over the past decade, there has been a growing fixation among planners and developers alike for a return to the last century’s monocentric cities served by large-scale train systems. And, to be sure, in a handful of older urban regions, mass transit continues to play an important — and even vital — role in getting commuters to downtown jobs. Overall, a remarkable 40 percent of all transit commuting in the United States takes place in the New York metropolitan area — and just six municipalities make up 55 percent of all transit commuting destinations.

    But here’s an overlooked fact: Transit now serves about the same number of riders as it did in 1907, when the urban population was barely 15 percent of what it is today. Most urban regions, such as Southern California, are nothing like New York — and they never will be. Downtown Los Angeles may be a better place in which to hang out and eat than in the past, but it sorely lacks the magnetic appeal of a place like Manhattan, or even downtown San Francisco. Manhattan, the world’s second-largest employment center, represents a little more than 20 percent of the New York metropolitan area’s employment. In Los Angeles, by contrast, the downtown area employs just 2 percent.

    Transit is failing in Southern California

    As we demonstrate in a new report for Chapman University, our urban form does not work well for conventional mass transit. Too many people go to too many locales to work, and, as housing prices have surged, many have moved farther way, which makes trains less practical, given the lack of a dominant job center. But in its desire to emulate places like New York, Los Angeles has spent some $15 billion trying to evolve into what some East Coast enthusiasts call the “next great transit city.”

    The rail lines have earned Mayor Eric Garcetti almost endless plaudits from places like the New York Times. Yet, since 1990, transit’s work trip market share has dropped from 5.6 percent to 5.1 percent. MTA system ridership stands at least 15 percent below 1985 levels, when there was only bus service, and the population of Los Angeles County was about 20 percent lower. In some places, like Orange County, the fall has been even more precipitous, down 30 percent since 2008. It is no surprise, then, that, according to a recent USC study, the new lines have done little or nothing to lessen congestion.

    This experience is not limited to L.A. Most of the 19 metropolitan areas with new mass transit rail systems — including big cities like Atlanta, Houston, Dallas and even Portland, Ore. — have experienced a decline in transit market share since the systems began operations.

    Read the entire piece at The Orange County Register.

    Joel Kotkin is executive editor of NewGeography.com. He is the Roger Hobbs Distinguished Fellow in Urban Studies at Chapman University and executive director of the Houston-based Center for Opportunity Urbanism. His newest book is The Human City: Urbanism for the rest of us. He is also author of The New Class ConflictThe City: A Global History, and The Next Hundred Million: America in 2050. He lives in Orange County, CA.

    Wendell Cox is principal of Demographia, an international public policy and demographics firm. He is a Senior Fellow of the Center for Opportunity Urbanism (US), Senior Fellow for Housing Affordability and Municipal Policy for the Frontier Centre for Public Policy (Canada), and a member of the Board of Advisors of the Center for Demographics and Policy at Chapman University (California). He is co-author of the “Demographia International Housing Affordability Survey” and author of “Demographia World Urban Areas” and “War on the Dream: How Anti-Sprawl Policy Threatens the Quality of Life.” He was appointed to three terms on the Los Angeles County Transportation Commission, where he served with the leading city and county leadership as the only non-elected member. He served as a visiting professor at the Conservatoire National des Arts et Metiers, a national university in Paris.

    Photo: Esirgen (Own work) [CC BY-SA 3.0], via Wikimedia Commons

  • The Precariat Shoppe

    The precariat is a term coined to describe the segment of the population that lives without security or predictability. These days it often refers to the former American middle class that’s currently experiencing reduced circumstances. There’s always been a precariat, but it usually includes a minor subset of the population that no one really likes or cares about. Indentured Irish servants, black slaves, Jewish and Italian sweatshop workers, Mexican field hands, Puerto Rican cleaning ladies… It’s a long list. People are up in arms now because the “wrong people” have fallen in to the precariat that didn’t used to “belong” there. There’s been a sudden realization that sometimes the structure of the economy itself institutionalizes their personal decline. Shocking! I’m not a political animal so I’ll leave those discussions to others to hash out. Instead, I’m interested in how people adapt to the circumstances they find themselves in.

    We’re all familiar with the ice cream man whose truck rolls around with the happy music playing on hot summer days. This one is in Detroit – and it’s an ice cream lady. She bought an old delivery vehicle, did a bit of hand painting, fitted it with chest freezers, and opened for business. It’s a fast, low cost, and flexible way to get a business off the ground even in the most challenging economic environments.

    The ubiquitous food truck fills the gap between the cost, complexity, and risk of opening a brick and mortar restaurant vs. working for someone else. A well constructed food truck isn’t necessarily cheap, but it’s within the reach of many more people than anything in a building. This one is in Los Angeles.

    Here’s a twist on the mobile shop theme that’s a direct result of rising commercial rents. This woman ran a successful second hand clothing boutique for many years and was driven out when her shop rent hit $5,400 a month. You have to sell a lot of schmatta to make that nut. Now she follows various fairs and pubic gatherings with her merchandise in a repurposed school bus. She goes directly to where her customers are most likely to find her. As I’ve heard many times from shopkeepers around the world – it’s not how much money you earn, it’s how much you have left over after all the thieves are paid.

    Here’s a mobile veterinary clinic. Dogs, cats, horses… As the cost of a medical degree, insurance, and real estate have skyrocketed even doctors are taking a long hard look at the whole medical office building situation. The transition from a practice with a full team of professionals to a solo gig in a tricked out custom van can be described as a positive lifestyle change, but it’s almost certainly about money.

    I stumbled on this mobile grocery store complete with fresh produce, real bread, and dairy products. The offerings and prices were substantially better than what can be found at the alternative in this location – a classic food desert where people without access to a car have little choice but to buy low quality industrial food-like products at inflated prices at gas stations.

    Down the street I found a similar grocery truck. I chatted with the family that runs the business. There was a need in the community to bring in groceries as well as an opportunity to make money. The usual chain stores on the main arterial road don’t always work well for either customers or potential shopkeepers. The trucks do. They arrive exactly when and where they’re needed and stock what people want. I noticed health department certificates and Weights and Measures seals. Both trucks were Grade A.

    Here’s a mobile woodworker’s tool shop. These are specialty items not typically found in most hardware stores. This man has a relationship with various brick and mortar lumber yards who find his presence good for business. Social media alerts customers of his schedule. Mobile shops have the ability to specialize and cover a wider territory more economically than a stationary establishment burdened with overhead and a limited static customer base.

    The irony here is that all around the parking lots that host occasional mobile vendors are empty buildings that once housed chain pharmacies, banks, and such. Sometimes new buildings are constructed to house updated versions of the same stores in the same town. Sometimes there’s simply less need for physical operations as activity migrates to the interwebs. But repurposing the vacated spaces is hard. The size, configuration, and cost of these places is fundamentally at odds with the creation of new small scale mom and pop enterprises. The numbers don’t add up. I’ve had nearly everyone I talked to tell me some version of the same story. The combination of expenses, regulations, and the culture of distant corporate management is all agressively hostile to their efforts. And taking on a single employee is often the difference between making money and failing within the first year.

    Here’s one example of the challenges of opening a brick and mortar shop even if you have a generous budget. A prosperous California winery decided to open a tasting room in town to promote its products. The building had been a family paint store since the 1950s. The 2008 financial crash forced it to close. The new owners gave the old nondescript concrete block building a designer facelift. But it was a bumpy road. The climate controlled warehouse in the back was subject to a design review board that spent months rejecting the proposed color of the structure. White was preferred by the owner since it reflected heat most effectively. Evidently pure white was not in keeping with the character of the community. There was a back and forth with the oversight committee over various shades of off white, beige, and creme anglaise. Each time the committee rejected a color the process had to start all over again which delayed the opening of the shop by several weeks – which all costs money.

    The fire marshal insisted on the installation of this bit of plumbing that cost $65,000. I can’t think of anything more flammable than 1950s era paint – not even wine – yet somehow the building managed not to burn for sixty odd years. But no new business could open in this spot until this valve was installed. And then there was the requirement that each seat and stool in the tasting room have a corresponding parking spot on site while not interfering with the ability of a giant fire truck to completely encircle the entire property.

    Here’s the other end of the spectrum. A mother and daughter sell cold drinks at a busy bus stop from an ice chest. Totally ADA compliant!

    But the award for creative entrepreneurial capitalism goes to this mobile video game kiosk that regularly parks outside a San Francisco bar on weekend evenings. Comfortably liquified patrons settle in to folding chairs and play electronic games on the sidewalk. Free! (But please keep the tips coming.) It’s been in the same spot for so long the bar owners must not mind. This is how you work a side hustle when you’re part of the precariat.

    This piece first appeared on Granola Shotgun.

    John Sanphillippo lives in San Francisco and blogs about urbanism, adaptation, and resilience at granolashotgun.com. He’s a member of the Congress for New Urbanism, films videos for faircompanies.com, and is a regular contributor to Strongtowns.org. He earns his living by buying, renovating, and renting undervalued properties in places that have good long term prospects. He is a graduate of Rutgers University.

  • Is California About to Clobber Local Control?

    The gradual decimation of local voice in planning has become accepted policy in Sacramento. The State Senate is now considering two dangerous bills, SB 35 and SB 167, that together severely curtail democratic control of housing.

    SB 35: Housing Accountability and Affordability Act (Wiener)

    SB 35, the brainchild of San Francisco State Senator Scott Wiener, would force cities that haven’t met all their state-mandated Regional Housing Need Allocations to give by-right approval to infill market-rate housing projects with as little as 10% officially affordable housing. 

    SB 35 is anti-free speech and civic engagement. No public hearings, no environmental review, no negotiation over community benefits. Just “ministerial,” i.e., over-the-counter- approval.

    SB 35 is pro-gentrification. As a statewide coalition of affordable housing advocacy organizations has written:

    Since almost no local jurisdiction in the State of California meets 100% of its market rate RHNA goal on a sustained basis, this bill essentially ensures by-right approval for market-rate projects simply by complying with a local inclusionary requirement [for affordable housing] or by building 10% affordable units.

    The practical result is that all market rate infill development in most every city in California will be eligible for by-right approval per this SB 35-proposed State law pre-emption.

    Berkeley Housing Commissioner Thomas Lord also has pointed out, the RHNA program itself is a pro-gentrification policy. It follows that passage of SB 35 would further inflate real estate values and worsen the displacement of economically vulnerable California residents.

    SB 35 is pro-traffic congestion. It would prohibit cities from requiring parking in a “streamlined development approved pursuant” to SB  35, located within a half-mile of public transit, in an architecturally and historically significant historic district, when on-street parking permits are required but not offered to the occupants of the project, and when there is a car share vehicle located within one block of the development. Other projects approved under the measure would be limited to one space per unit.

    Absent the provision of ample new public transit, the prohibition of parking in new development will worsen neighborhood traffic problems. SB 35 says nothing about new transit.

    The construction of on-site parking is expensive, up to $50,000 a space. A measure that exempts new development, as designated above, from including parking without requiring developers to transfer the savings to affordable housing is a giveaway to the real estate industry.

    Nor does SB 35 say anything about funding the amount of infrastructure and local services—fire and police, schools, parks—that would be required by the massive amount of development it mandates. Are local jurisdictions expected to foot the bill?

    The lineup of SB’s supporters and opponents reveals serious splits in the state’s environmental and affordable housing advocates. SB 35 has revealed serious splits among advocates for both environmental protection and affordable housing.

    Supporters include Bay Area Council, the lobby shop of the Bay Area’s biggest employers; BAC’s Silicon Valley counterpart, the Silicon Valley Leadership Group; the San Francisco and LA Chambers of Commerce; the Council of Infill Builders; several nonprofit housing organizations, including the Non-Profit Housing Association of Northern California and BRIDGE Housing; the Natural Resources Defense Council; the California League of Conservation Voters; and a panoply of YIMBY groups, including East Bay Forward and YIMBY Action.

    Opponents include the Sierra Club; the League of California Cities; the Council of Community Housing Organizations; the California Fire Chiefs Association; the Fire Districts Association of California; a handful of cities, including Hayward, Pasadena, and Santa Rosa; the Marin County Council of Mayors and Councilmembers; and many building trades organizations, including IBEW Locals 1245, 18, 465 and 551, and the Western States Council of Sheet Metal Workers.

    SB 167: Housing Accountability Act (Skinner)

    This bill, introduced by State Senator Nancy Skinner, who represents Berkeley and other East Bay cities, and sponsored by the Bay Area Renters Federation (BARF), is a companion to SB 35. It would prohibit cities from disapproving a housing project containing units affordable to very low-, low- or moderate-income renters, or conditioning the approval in a manner that renders the project financially infeasible, unless, among other things, the city has met or exceeded its share of regional housing needs for the relevant income category. (As of November 2016, HUD defined a moderate-income household of four people in Alameda County as one earning under $112,300 a year.)

    The bill defines a “feasible” project as one that is “capable of being accomplished in a successful manner within a reasonable period of time, taking into account economic environmental, social, and technological factors.” It does not define “successful” or “reasonable.”

    If a city does disapprove such a project, it is liable to a minimum fine of $1,000 per unit of the housing development project, plus punitive damages, if a court finds that the local jurisdiction acted in bad faith.

    SB 167 authorizes the project applicant, a person who would be eligible to apply for residency in the development or emergency shelter, or a housing organization, to sue the jurisdiction to enforce SB 167’s provisions. The bill defines a housing organization as

    a trade or industry group whose local members are primarily engaged in the construction or management of housing units or a nonprofit organization whose mission includes providing or advocating for increased access to housing for low-income households and have filed written or oral comments with the local agency prior to action on the housing development project [emphasis added].

    The highlighted passage was added to the existing Housing Accountability Act to encompass BARF’s legal arm, the California Renters Legal Advocacy and Education Fund (CaRLA), whose lawsuit of Lafayette recently failed. Last week CaRLA re-instituted its lawsuit of Berkeley over the city’s rejection of a project at 1310 Haskell.

    SB 167 further amends the existing Housing Accountability Act to entitle successful plaintiffs to “reasonable attorney’s fees and costs.”

    Predictably, the bill is supported by the Bay Area Council, the lobby shop for the region’s largest employers; the California Building Industry Association; the Terner Center at UC Berkeley; the San Francisco Housing Action Coalition; and YIMBY groups, including East Bay Forward, Abundant Housing LA, and of course CaRLA.

    Opponents include the California Association of Counties and the American Planning Association.

    If these bills—especially SB 35—become law, Californians will have lost a good deal of their right to a say the life and governance of the communities in which they live.

    This piece was first published in Berkeley Daily Planet and Marin Post.

    Zelda Bronstein, a journalist and a former chair of the Berkeley Planning Commission, writes about politics and culture in the Bay Area and beyond.

  • Driving Alone Hits High, Transit Hits Low in “Post-Car” City of Los Angeles

    According to The New York Times, the car used to be “king” in the city (municipality) of Los Angeles. “’A Different Los Angeles’, The City Moves to Alter its Sprawling Image,” was another story that seeks to portray the nation’s second largest municipality as having fundamentally changed. Following this now popular meme, a Slate story in 2016 referred to Los Angeles becoming “America’s next great transit city.” Los Angeles has surely become America’s greatest transit tax city, with Los Angeles County voters in 2016 approving a fourth half-cent sales tax increase principally for transit since 1980. Yet transit’s market share has fallen, not only in the nation’s largest county but even in the city of Los Angeles.

    The Ascent of Transit: A False Narrative

    The Los Angeles political establishment and media is virtually unanimous in its praise for the now quarter century old rail system. Yet, despite more than $15 billion being spent on rail transit the already meager levels of transit commuting in the city have fallen further, while solo driving has risen to an all time high. Unless platitudes are more important than results, rail’s success is a false narrative. People are driving more and using transit less according to the American Community Survey for 2015.

    The share of city of Los Angeles residents commuting by transit fell from 11.2 percent in 2010 to 9.5 percent in 2015 (Figure 1, note truncated axis). The 2010 figure was the highest decennial census year transit figure in the period starting in 1980. Just five years later, in 2015, however, the city of Los Angeles transit commuting share had fallen below 1980 levels.

    In 1980, 10.8 percent of the city’s commuters used transit, a figure that fell to 10.5 percent just before the initial Long Beach “Blue Line” opened in 1990. While new light rail lines and the Metro (subway) line opened after 1990, transit’s market share fell further, to 10.1 percent by 2010. During the 2000s, transit commuting rose 1.1 percentage points to the 11.2 percent figure, propelled by unprecedented gasoline price increases. But progress was short-lived as the share dropped to 9.5 percent in 2015.

    City of Los Angeles Surge in Driving Alone

    At the same time, commuters were turning even more to driving alone. In 2015, 69.8 percent of work trip access was by solo drivers. This represents a substantial increase from the 66.8 percent drive alone share in 2010. From 1980 to 2010, driving alone edged up slightly, much less than the increase in the last five years. In 1980, 65.1 percent of commuters drove alone. In 1990, a nearly identical 65.2 percent drove alone. In the last five years, driving alone has risen more than the entire previous 30-year increase in the city of Los Angeles.

    The news could get worse. According to new American Public Transportation (APTA) data, total ridership on all Los Angeles County MTA services dropped more than five percent from 2016. The APTA reported decline is astounding, since the highly touted extension of the Expo light rail line to downtown Santa Monica opened in 2016. Even more astounding is that the expensive, at least seven line (counted at radial line ends plus the transverse Green Line) system has added not a soul to transit ridership on the Los Angeles MTA bus and rail system since 1985. Not all MTA service is in the city of Los Angeles, however, the APTA data could presage a further transit market share decline in the city with the American Community Survey data due in the Autumn.

    All of this is consistent with the larger trend in the Los Angeles metropolitan area (which includes Los Angeles and Orange Counties). Overall, the transit work trip market share in the metropolitan area fell from 6.1 percent in 2010 to 5.1 percent in 2015. The MTA 2016 decline is likely to push this figure lower.

    The Illusion of a “Different Los Angeles”

    Yet to read the press and media accounts in Los Angeles, one might be inclined to believe an alternate reality that LA transit is ascendant.

    Christopher Hawthorne, who teaches urban and environment policy at Occidental College told The New York Times that the recent defeat of a development moratorium, along with approval of the transit tax and an affordable housing measure is “a very clear statement from the voters that they want a different Los Angeles.”

    The voters may want a different Los Angeles, but apparently commuters are sufficiently happy with driving and have been for the more than a quarter century since rail transit was restored to Los Angeles. This is not surprising, since the average commuter can reach 60 times as many jobs by car in 30 minutes in the Los Angeles metropolitan area as by transit. (30 minutes is the average one-way commute time in the metropolitan area). Data is not available for the city of Los Angeles (see: “Access in the City”).

    However, it is a generally hopeless task for transit to be an alternative to the automobile, except for trips to and from the urban core (downtown and nearby). The reality is that it could take as much as the total income, every year, of a metropolitan area to provide transit that could effectively compete with the car throughout a metropolitan area for work and other trips.

    Platitudes do not ride, people do. At least with respect to the implied transit ridership increases and forsaken cars, the “different” Los Angeles is an illusion, completely inconsistent with reality.

    Wendell Cox is principal of Demographia, an international public policy and demographics firm. He is a Senior Fellow of the Center for Opportunity Urbanism (US), Senior Fellow for Housing Affordability and Municipal Policy for the Frontier Centre for Public Policy (Canada), and a member of the Board of Advisors of the Center for Demographics and Policy at Chapman University (California). He is co-author of the “Demographia International Housing Affordability Survey” and author of “Demographia World Urban Areas” and “War on the Dream: How Anti-Sprawl Policy Threatens the Quality of Life.” He was appointed to three terms on the Los Angeles County Transportation Commission, where he served with the leading city and county leadership as the only non-elected member. He served as a visiting professor at the Conservatoire National des Arts et Metiers, a national university in Paris.

    Photo: Los Angeles City Hall (by author)

  • Hollywood’s Self-Inflicted Wounds

    No industry is more identified with Southern California than entertainment. Yet, in the past, the industry’s appeal has lain in identifying with the always-changing values and mythos of American society. But, today, that connection is being undermined, not just by technology, but also by a seemingly self-conscious decision to sever the industry’s links with roughly half of the population.

    This was painfully obvious during the Oscars — the penultimate event of the seemingly endless award season — when speaker after speaker decided to spend their moments of fame denouncing President Donald Trump. For all his personal failings, and often misguided policies, most Republicans and independents disapprove of the relentless Trump bashing in the media.

    Hollywood’s decision to make itself part of the anti-Trump resistance would make for wonderful satire, if you could get it on film. Imagine feminist icon Emma Watson fighting for “women’s empowerment” while baring her breasts in Vanity Fair. Or a host of social justice warriors, like Meryl Streep, demanding justice for the dispossessed, then returning to their estates where these victims of Trumpism are not likely to be found outside the servants’ quarters.

    The results also have a hard side: dismal ratings, down from a traditional viewership of 40 million to a mere 32 million, following a pattern that has seen it slide badly the last three years. Most Trump voters turned off the political speeches, notes one survey. But the Academy had other ways to show its contempt for its customers: None of the 10 largest grossing movies, notes USA Today’s Mitch Albom, got nominated for best picture, best actor or actress, or for supporting roles.

    The everyman era

    The preference of sophisticated opinion may be quintessential to Europe’s boutique film industry, but the blending of popular tastes with art has long propelled Hollywood’s historical success. This separation between audience and the Academy was not always the case. Films like “Gone with the Wind” (1939), “Around the World in 80 Days” (1956), “Ben-Hur” (1959), “The Sound of Music” (1965), “The Godfather” (1972), “Forest Gump” (1994) and “Titanic” (1997) all managed to be both blockbusters and best picture winners.

    Hollywood, wrote author Leo Rosten in 1940, was “the very embodiment” of “magic success,” allowing a truck driver to dream of being a hero, or a small-town waitress “to compare herself to a movie queen.” Hollywood was Middle American to the core, which appealed not just to our own audiences, but also to those around the world.

    In a political sense, Hollywood connected with Americans across the ideological spectrum. During the contentious 1930s, Hollywood could accommodate both the conservative myth of the loner — Gary Cooper and John Wayne — and also produce powerful dramas that touched on issues of class and inequality, such as “Our Daily Bread” (1934), “How Green Was My Valley” (1941) and “The Grapes of Wrath” (1940).

    Some progressive-leaning films were written by people who were later “blacklisted” during the McCarthy era, a tragedy that deprived the industry of some of its greatest talents. The industry instead favored biblical epochs like “Quo Vadis” (1951) as well as innocuous comedies starring the likes of Doris Day.

    “It was boy meets girl, lives happily ever after,” recalled former Los Angeles and Orange County Republican Congressman Bob Dornan, who grew up during this time. “There were clear-cut heroes and villains. Nazis torturing little old ladies, John Wayne landing on the beaches. … America was the bearer, the hope of the world.”

    Read the entire piece at The Orange County Register.

    Joel Kotkin is executive editor of NewGeography.com. He is the Roger Hobbs Distinguished Fellow in Urban Studies at Chapman University and executive director of the Houston-based Center for Opportunity Urbanism. His newest book, The Human City: Urbanism for the rest of us, was published in April by Agate. He is also author of The New Class ConflictThe City: A Global History, and The Next Hundred Million: America in 2050. He lives in Orange County, CA.

    Photo: BDS2006 [CC BY-SA 3.0 or GFDL], via Wikimedia Commons 

  • Los Angeles Traffic: Likely To Worsen with Higher Densities

    A few recent days driving the Los Angeles freeways impressed me with how different they are from in most other places in the country. The intensity of the traffic is astounding. Even on the weekend, travel over Sepulveda Pass on the San Diego Freeway (I-405) was highly congested. Traffic really never stopped, but frustratingly inched along for parts of the way and approached 60 miles per hour on other parts. A Saturday trip I feared might take an hour and a half was completed from Simi Valley in less than 60 minutes. Caltrans and the local officials do an admirable job of keeping the traffic moving, which was obvious from the only slight delay near Sherman Way caused by an incident that required a fire truck.

    Traffic Per Lane Mile

    The latest Federal Highway Administration data indicates that nearly 23,000 cars are handled by each freeway lane on the average day. Among the larger urban areas, only San Jose and close-by Riverside-San Bernardino have a volume of more than 20,000 daily.

    The freeway lane volume in Los Angeles is up from 16,500 cars per lane mile in the early 1980s,  a more 37 percent increase in traffic (Figure 1). This is not surprising, because the urban area, which stretches from the San Fernando Valley to Pomona and Orange County to San Clemente has added almost the same percentage of residents. The city of Los Angeles itself, which covers virtually the same area as it did more than three decades ago has become significantly more dense, also adding about one third to its population.

    At the same time, public policy in California is calling for significant urban densification that will put an even greater strain on the roadway network. Any assumption that a more dense Los Angeles will be anything less than an even more horrific traffic environment is simply folly.

    Billions Spent on Rail: Yet Traffic is Much Worse

    Some, including me while I was on the Los Angeles County Transportation Commission, believe (or in my case “believed”) that an expansion of transit — especially adding urban rail service, would relieve traffic congestion. Los Angeles has now had nearly three decades of experience with that strategy. Yet, traffic has only become more intense.

    Indeed, despite the addition of a substantial urban rail system in Los Angeles County has been accompanied by a general decline in transit ridership on the Metropolitan Transportation Authority services compared to predecessor services operated by the Southern California Rapid Transit District in 1985. In 2016, ridership was even lower than the year before, despite the extensions of rail service to Santa Monica on the Expo Line and to Azusa on the Gold Line.

    Even work trip ridership, which transit serves best, is down. In 1980, transit’s market share was 7.0 percent in Los Angeles County. By 2015, transit’s market share had fallen slightly to 6.8 percent. Meanwhile, driving alone expanded significantly from 68.7 percent in 1980 to 73.0 percent in 2015. Working at home increased from 1.5 percent in 1980 to 5.1 percent in 2015 (Figure 2).

    Why Rail has Not Attracted Drivers

    There are two principal reasons the transit has not been able to attract drivers out of their cars and reduce freeway volumes. The first is that, for the most part, you cannot get from here to there on transit. That is, most jobs and places people are traveling cannot be conveniently accessed by transit. The University of Minnesota Accessibility Laboratory has found that 43.3 percent of jobs in the Los Angeles metropolitan area can be reached by car within 30 minutes. By contrast. Only 0.7 percent of jobs can be reached by transit within 30 minutes. In other words, the accessibility provided by cars is much greater than that of transit. For every job that can be reached by transit within 30 minutes, nearly 60 times as many jobs can be reached by car (Figure 3).

    Even where jobs can be reached by transit, it takes far longer. According to the latest American Community Survey data, the average one way work trip travel time for people driving alone in the Los Angeles metropolitan area is 27.9 minutes. By contrast, the average Metro Rail rider takes 52.2 minutes to reach work (Figure 4). It is not hard to imagine why people have not traded in their faster car travel times for slower trips on transit. Excess travel time, regardless of how traveled, takes away from other necessary activities and recreation.

    Further, with all the talk about “urban villages,” with the expected improved jobs housing balance, it is well to recognize such an achievement would be unprecedented. As former principal planner of the World Bank Alain Bertaud put it: “…the urban village "model does not exist in the real world because it contradicts the economic justification of large cities: the efficiency of large labor markets." The cold water of reality is that "… the urban village model exists only in the mind of urban planners."

    Of course, talk of people living near where they work is dubious, particularly in a metropolitan area where housing affordability  is challenging both for the vast majority of renters and potential buyers. When does anyone think this will happen? In “this life” or maybe in the “life to come?”

    The bottom line, unfortunate and politically incorrect as it is, is that transit simply cannot reduce traffic congestion. Some other strategy needs to be deployed.

    Prognosis: More Density, More Traffic

    Los Angeles traffic is likely to get much worse, especially if the development becomes substantially denser. All of the 12 world urban areas in the recent Tom Tom Congestion Index that have worse traffic than Los Angeles are denser. This is consistent with the international evidence that shows a strong association between higher densities, greater traffic congestion and lengthened work trip travel times. The experience in Los Angeles shows the same thing.

    Wendell Cox is principal of Demographia, an international public policy and demographics firm. He is a Senior Fellow of the Center for Opportunity Urbanism (US), Senior Fellow for Housing Affordability and Municipal Policy for the Frontier Centre for Public Policy (Canada), and a member of the Board of Advisors of the Center for Demographics and Policy at Chapman University (California). He is co-author of the "Demographia International Housing Affordability Survey" and author of "Demographia World Urban Areas" and "War on the Dream: How Anti-Sprawl Policy Threatens the Quality of Life." He was appointed to three terms on the Los Angeles County Transportation Commission, where he served with the leading city and county leadership as the only non-elected member. He served as a visiting professor at the Conservatoire National des Arts et Metiers, a national university in Paris.

    Photo: North on the 110 Toward Downtown, AM Peak (by author)

  • Is L.A. Back? Don’t Buy the Hype.

    With two football teams moving to Los Angeles, a host of towers rising in a resurgent downtown and an upcoming IPO for L.A.’s signature start-up, Snapchat parent Snap Inc., one can make a credible case that the city that defined growth for a half century is back. According to Mayor Eric Garcetti, the Rams, Chargers and the new mega-stadium that will house them in neighboring Inglewood, show that “that this is a town that nobody can afford to pass up.”

    And to be sure, Los Angeles has become a more compelling place for advocates of dense urbanism. Media accounts praise the city’s vibrant art scene, its increasingly definitive food scene and urbanist sub-culture. Some analysts credit millennials for boosting the population of the region and reviving the city’s appeal. Long disdained by eastern sophisticates, there’s an invasion from places like New York. GQ magazine called downtown L.A. “America’s next great city” last year.

    Downtown has transformed itself into something of an entertainment district, with museums, art galleries, restaurants, and sports and concert venues. Yet it has not become, like San Francisco or New York, a business center of note. In fact, jobs in the region have continued to move out to the periphery; downtown accounts for less than 5% of the region’s employment, one-third to half the share common in older large cities.

    Downtown’s residential growth needs to be placed in perspective. Since 2000 the population of the central core has increased by only 9,500; add the  entire inner ring and the population is up a mere 23,000. Meanwhile over the same span, the L.A. suburbs have added 600,000 residents. Jobs? Between 2000 and 2014, the core and inner ring, as well as older suburbs, lost jobs, U.S. Census data show, while newer suburbs and exurbs added jobs.

    In our most recent ranking of the metro areas creating the most jobs, Los Angeles ranked a mediocre 42nd out of the 70 largest metro areas; San Francisco ranked first. That’s well behind places like Dallas, Seattle, Denver, Orlando, and even New York and Boston, cities that we once assumed would be left in the dust by L.A.

    A New Tech Hub?

    The emergence of Snap has led some enthusiasts to predict L.A.’s emergence as a hotbed of the new economy. And to be sure, there is a growing tech corridor in the Santa Monica-Marina area that may gradually gain critical mass. Talk of a growing confluence between tech and entertainment content — the signature L.A. product — and the proliferation of new entertainment venues, could position the area for future growth. At the same time, the presence of Elon Musk’s Space X in suburban Hawthorne, near LAX, has excited local boosters.

    Yet despite these bright spots, Los Angeles’ current tech scene is almost piteously small. One consistent problem is venture capital. Despite the massive size of its economy, and huge population, Los Angeles garners barely 5% of the nation’s venture capital, compared to 40% for the Bay Area, 10% for New York and Boston. Companies that were born in L.A. often end up moving elsewhere, like virtual reality pioneer Oculus, which was frog marched to the Bay Area after being acquired by Facebook.

    Indeed, despite bright spots like Snap, since 2001 STEM employment in the L.A. metro area has been flat, in sharp contrast to high rates of job growth in the San Francisco Bay Area, Austin, Houston and Dallas, and the 10% national increase. Tech employment per capita in the L.A. area hovers slightly below the national average, according to a recent study I conducted at Chapman University. Los Angeles County, once the prodigious center of American high-tech, is also now slightly below the national average of engineers per capita.

    The Poverty Economy

    The regional economy, notes a recent Los Angeles Development Corporation report, continues to produce largely numbers of low-wage jobs, mostly in fields like health, hospitality and services. Sixty percent of all new jobs in the area over the next five years will require a high school education or less, the report projects.

    At the same time in the year ending last September, employment dropped in three key high-wage blue collar sectors: manufacturing, construction and wholesale trade notes the EDC The largest gains were in lower-wage industries like health care and social assistance, hospitality and food service.  Since 2007 Los Angeles County has 89,000 fewer manufacturing jobs, which pay an average of $54,000, but 89,000 more in food service that pay about $20,000. No surprise more than one out every three L.A. households have an income under $45,000 a year.

    All this works well for the people who are increasingly coming to enjoy L.A.’s great restaurants, hipster enclaves and art venues. The football teams will add to this mixture, offering employment selling peanuts, popcorn and hot dogs to generally affluent fans in the stands.

    Yet low wages could prove catastrophic in a region that lags only the Bay Area in housing costs. Some 45,000 are homeless throughout the metro area, concentrated downtown but spreading throughout the region all the way to Santa Ana, in the south. Housing prices have risen to five times median household income, highest in the nation and more than twice the multiple in New York, Chicago, Houston or Dallas-Ft. Worth. L.A. leads the nation’s big metro areas in a host of other negative indicators, including the percentage of income spent on housing, overcrowding and homelessness. A city which once epitomized middle class upward mobility is increasingly bifurcated between a wealthy elite, mostly Anglo and Asian, and a largely poor Latino and African-American community.

    A recent United Way study, for example, found that 37% of L.A. families can barely make ends meet, well above the 31% average for the state; the core city’s south and east sides have among the largest concentrations of extreme poverty in the state. Once a beacon for migrants from all over America, L.A. now has a similarly high rate of mass out-migration as New York. But unlike New York, where immigrants continue to pour in, newcomers to the U.S. are increasingly avoiding Los Angeles – it had the lowest growth in its immigrant population of any major metropolitan area over the past decade. Perhaps even more revealing, the Los Angeles area has endured among the largest drops in the number of children since 2000,notes demographer Wendell Cox,  more than New York, Chicago and San Francisco.

    Altered DNA

    The writer Scott Timberg notes that L.A.’s middle class, was once “the envy of the world.” L.A. used to be a place where firemen, cops and machinists could own houses in the midst of a great city. Dynamic, large aerospace firms, big banks and giant oil companies sustained the middle class.

    But the city has lost numerous major employers over the years, most recently longtime powerhouse Occidental Petroleum, and the U.S. headquarters of both Toyota and Nestle. The regional aerospace industry, which provided nearly 300,000 generally high-wage jobs in 1990, is now barely a third that size. High housing cost have devastated millennials, whose home ownership rate has dropped 30% since 1990, twice the national average.

    Many urbanists hail the emergence of a transit-oriented, dense city. Since 1990, Los Angeles County has added seven new urban rail lines and two exclusive busways at the cost of some $16 billion. Yet ridership on the Metropolitan Transportation Authority rail and bus services is now less than its predecessor Southern California Rapid Transit District bus services in 1985, before any rail services were opened. The share of work trips on transit in the entire five-county Los Angeles metropolitan region, has also dropped, from 5.1% in 1980 and 4.5% in 1990 to 4.2% in 2015. Meanwhile the city endures the nation’s worst traffic.

    Some longtime Angelenos are mounting a fierce ballot challenge — known as Measure S — to slow down ever more rapid densification. The ballot measure would bar new high-density construction projects for the next two years. “The Coalition to Preserve L.A.,” which is funding the measure, claims to be leading in the polls for the March 7 vote, but faces well-financed opposition from politically connected large developers, Mayor Garcetti, both political parties, virtually the entire city council, and much of the academic establishment. The L.A. Times denounced Proposition S as a “childish middle finger to City Hall” and its architecture critic Christopher Hawthorne, has urged the citizenry “to move past the building blocks of post-war Los Angeles, including the private car, the freeway, the single-family house and the lawn.”

    Proposition S proponents include many neighborhood and environmental groups, as well progressives and conservatives, including former Mayor Richard Riordan. The people controlling Los Angeles may dream of being the “next” New York but many residents, notes longtime activist Joel Fox, “are tired of the congestion and development and feel that more building will only add to congestion.”

    Renewing La La Land

    Of course, slowing or banning development by popular proposition is probably not the ideal  way to get control over the deteriorating situation. Yet it is clear that the current trajectory towards more dense housing is not addressing the city’s basic problems. Los Angeles, as the movie “La La Land so poetically portrays, remains a “city of dreams” but that mythology is clearly being eroded by a delusional desire to be something else.

    In my old middle-class neighborhood in the San Fernando Valley, heavily populated by people from the creative industry, the worsening congestion, the upsurge of ever taller buildings and ever more present homeless did not reflect the giddiness of “La La Land.”

    Yet despite all these problems, Los Angeles has the potential to make a great comeback. It has a dispersed urban form that allows for innovation and diversity, and an unparalleled physical location on the Pacific Rim. Its ethnic diversity can be an asset, if somehow it can generate higher wage employment to stop the race to the bottom. The basics are all there for a real resurgence, if the city fathers ever could recognize that the City of Angels needs less a new genome but  should build on its own inimitable DNA.

    This piece first appeared in Forbes.

    Joel Kotkin is executive editor of NewGeography.com. He is the Roger Hobbs Distinguished Fellow in Urban Studies at Chapman University and executive director of the Houston-based Center for Opportunity Urbanism. His newest book, The Human City: Urbanism for the rest of us, was published in April by Agate. He is also author of The New Class ConflictThe City: A Global History, and The Next Hundred Million: America in 2050. He lives in Orange County, CA.

    Photo: AdamPrzezdziek

  • Transportation Game-changers

    Here is the L.A. Times noting that LA Metro ridership is still falling — even though billions have been (mis)spent on extra capacity over the last 30+ years. By my count that’s the second time this year that the Times has broached this tender topic. As a member in good standing of the LA “good government” (googoo) establishment, the paper had for many years chosen to tip-toe around the bad news.

    Readers may know that some of us began flogging the dead horse in the mid-1970s. Go to the attached proceedings and read the contribution by the late UCLA Prof. George Hilton. He was among the first to write sensibly and clearly that LA is not NY — and trying to make it so would be a phenomenal waste. But even LA Times coverage will be for naught. Billions more will be spent. Pouring good money after bad is what the great and the good in city hall do for a living.

    We are in the the early years Uber/Lyft and all manner of ICT information sharing.  These are the game-changers. For the past two months, my wife and I have graduated from a two-car household to a one-car-plus-Uber-plus-walkable-neighborhood HH. The game-changers are here. Conventional transit was never a game-changer.

  • How Silicon Valley’s Oligarchs Are Learning to Stop Worrying and Love Trump

    The oligarchs’ ball at Trump Tower revealed one not-so-well-kept secret about the tech moguls: They are more like the new president than they are like you or me.

    In what devolved into something of a love fest, Trump embraced the tech elite for their “incredible innovation” and pledged to help them achieve their goals—one of which, of course, is to become even richer. And for all their proud talk about “disruption,” they also know that they will have to accommodate, to some extent, our newly elected disrupter in chief for at least the next four years.

    Few tech executives—Peter Thiel being the main exception—backed Trump’s White House bid. But now many who were adamantly against the real-estate mogul, such as Clinton fundraiser Elon Musk, who has built his company on subsidies from progressive politicians, have joined the president-elect’s Strategic and Policy Forum. Joining Musk will be Uber’s Travis Kalanick, who half-jokingly threatened to “move to China” if Trump was elected.

    These are companies, of course, with experience making huge promises, and then changing those promises to match new circumstances. Uber, for instance, touted itself as a better deal than a cab for both riders and drivers before it prepared to tout a better deal for riders by replacing its own soon-to-be obsolete drivers with self-driving cars.

    Silicon Valley and its leading mini-me, the Seattle area, did very well under Barack Obama, and expected the good times to continue under Hillary Clinton. Tech leaders were able to emerge as progressive icons even as they built vast fortunes, largely by adopting predictably politically correct issues such as gay rights and climate change, which doubled as a perfect opportunity to cash in on Obama’s renewable-energy subsidies. Increasingly tied to the ephemeral economy of software and media, they felt little impact from policies that might boost energy costs or force long environmental reviews for new projects.

    No wonder Silicon Valley gave heavily to Obama and then Clinton. In 2016, Google was the No. 1 private-sector source of donations to Clinton, while Stanford was fifth. Overall the electronics and communications sector gave Democrats more than $100 million in 2016, twice what they offered the GOP. In terms of the presidential race, they handed $23 million to Hillary, compared to barely $1 million to Trump.

    Yet, there is one issue on which the Valley has not been “left,” and that is, predictably, wealth. It may have liked Obama’s creased pants and intellectually poised manner, but it did not want to see the Democrats become, God forbid, a real populist party. That is one reason why virtually all the oligarchs favored Clinton over Sanders, who had little use for their precious “gig economy,” the H-1B high-tech indentured-servants program, or their vast and little-taxed wealth.

    Jeff Bezos, the Amazon founder with a net worth close to $70 billion, used his outlet, The Washington Post, to help bring down Bernie, before being unable, despite all efforts, to stop Trump. So now Bezos sits by Trump’s side, hoping perhaps that the president-elect’s threats to unleash antitrust actions against Amazon will be conveniently forgotten as an artful “deal” is struck.

    For these and other reasons, there’s little doubt that the tech elite would have been better off under Clinton, who likely would have, like Obama, disdained antitrust actions and let them keep hiding untaxed fortunes offshore. Now, they will have to share the head table with the energy executives they’d hoped to replace with their own climate-change-oriented activities.

    The tech oligarchs have long had a problem with what many would consider social justice. Although the tech economy itself has expanded in the current period, its overall impact on the economy has been less than stellar. For all of its revolutionary hype, it’s done little to create a wide range of employment gains or boost worker productivity.

    To be sure, there have been large surges of employment in the Bay Area, Seattle, and a handful of other places. California alone has more billionaires than any country in the world except China, and nearly half of America’s richest counties.

    But for much of the country, notably those areas that embraced Trump, the tech “disruption” has been anything but welcome news. This includes heavily Latino interior sections, home to many of America’s highest employment rates. Overall, the “booming” high-wage California economy celebrated by progressive ideologues like Robert Reich does not extend much beyond the Valley. In most of California, job gains have been concentrated in low-wage professions.

    Despite its vast wealth, California has the highest cost-adjusted poverty rate in the country, with a huge percentage of the state’s Latinos and African Americans barely able to make ends meet. California metropolitan areas, including the largest, Los Angeles, account for six of the 15 metro areas with the worst living standards, according to a recent report from demographer Wendell Cox. Meanwhile, the middle and working class, particularly young families, continue to leave, with more people exiting the state for other ones than arriving to it from the, in 22 of the past 25 years.

    Even in Silicon Valley itself the boom has done little for working-class people, or for Latinos and African Americans—who continue to be badly underrepresented at the top tech firms as many of those same firms aggressively promote diversity. A study out of the California Budget and Policy Center (PDF) concluded that with housing costs factored in, the poverty rate in Santa Clara County soars to 18 percent, covering nearly one in every five residents, and almost one-and-a half times the national poverty rate. Since 2007, amidst an enormous boon, adjusted incomes for Latinos and African Americans in the area actually dropped (PDF).

    Much of this has to do with change in the Valley’s industrial structure, which has shifted from manufacturing to software and media. The result has been a kind of tech alt-dystopia, with massive levels of homelessness, and housing costs that are prohibitive to all but a small sliver of the local population.

    With a president whose base is outside the Bay Area, and dependent on support in areas where jobs are the biggest issue, the tech moguls will need to find ways to fit into the new agenda. The old order of relentless globalization, offshoring, and keeping profits abroad may prove unsustainable under a Trump regime that has promised to reverse these trends. In some senses the Trump constituency is made up of people who are the target of Silicon Valley’s “war on stupid people.” Inside the Valley, such people are seen as an obstacle to progress, who should be shut up with income supports and subsidies.

    So can Silicon Valley make peace with Donald Trump, the self-appointed tribune of the “poorly educated”? There are two key areas where there could be a meeting of minds. One is around regulation. One of the great ironies of the tech revolution is that the very places that are home to many techies—notably blue cities such as San Francisco, Austin, and New York—also tend to be the very places most concerned with the economic impacts of the industry.

    Opposition to disruptive market makers in the so-called sharing economy like Uber, Lyft, and Airbnb is greatest in these dense, heavily Democratic cities. What’s left of the private-sector union movement and much of the progressive intelligentsia is ambivalent if not downright hostile to the “gig” economy. Ultimately, resistance to regulations relating to this tsunami of part-time employment could be something that Trump’s big business advisers might share in common with the techies.

    More important will be the issue of jobs. It may not work anymore for firms to lower tech wages by offshoring jobs or importing lots of foreign workers under the H-1B visa program, since Trump has denounced it. IBM’s Ginni Rometty, who had been busily replacing U.S. workers with ones in India, Brazil, and Costa Rica, has now agreed to create 25,000 domestic jobs. Other tech companies—including Apple—have also been making noises shifting employment to the United States from other countries. Trump may well feel what “worked” with Carrier can now be expanded to the most dynamic part of the U.S. economy.

    If the tech industry adjusts to the new reality, they may find the Trump regime, however crude, to be more to their liking than they might expect. Companies like Google may never again have the influence they had under Obama, but many techies may be able to adjust. As long as the new president “deals” them in, the techies may be able to stop worrying about Trump and begin to embrace, if not love, him.

    This article first appeared on The Daily Beast.

    Joel Kotkin is executive editor of NewGeography.com. He is the Roger Hobbs Distinguished Fellow in Urban Studies at Chapman University and executive director of the Houston-based Center for Opportunity Urbanism. His newest book, The Human City: Urbanism for the rest of us, was published in April by Agate. He is also author of The New Class ConflictThe City: A Global History, and The Next Hundred Million: America in 2050. He lives in Orange County, CA.

    Photo by Gage Skidmore from Peoria, AZ, United States of America (Donald Trump) [CC BY-SA 2.0], via Wikimedia Commons

    Photo: MCR World