Tag: Los Angeles

  • Los Angeles Metro Bus System Compares Favorably With its Peer Group

    As the Los Angeles County Metropolitan Transportation Authority (Metro) prepared for its most recent round of major bus operations reductions, Metro CEO Art Leahy has been quoted:

    "(T)oo many bus lines with excessive service has led to regular budget deficits1."

    "How full are Metro buses today? Overall, Metro buses are running at an average of 42 percent capacity. Of course, that doesn’t mean that all Metro buses are less than half full. Another measure to gauge bus usage is called ‘load ratio’ — the ratio of passengers to bus seats at the most crowded part of a bus route. By that count Metro’s average load factor is an average of 1.2. (For example, 48 passengers on a 40 seat bus). Many other large transit agencies are running load factors of 1.5 to 1.72 ."

    The "42 percent" capacity is evidently the average passenger load (APL) divided by the number of seats – in other words, on average for the full year, each 40-seat MTA bus had about 17 passengers on board.

    Forty-two percent might appear to be a low value, particularly in comparison to other modes of transportation like scheduled airlines, where it is common to have a 100% load factor on some flights.  However, Lufthansa doesn’t stop at Wilshire/Vermont to pick up passengers between LAX and JFK – transit service is scheduled for peak load factor; that is, attempting to approach, but not exceed, a maximum load factor at the point on the line where the number of people on board is largest.

    In the second quote, we have a mixture of load factors terms and data.  Almost all transit operators have load factor standards, which they set for each mode of service (bus, light rail), time of day, day of week, and type of service (main line arterial bus service, long-haul commuter, neighborhood circulator).  For Metro, the peak load factor criterion had been 1.20 – the 48 passengers on a 40-seat bus – since this was imposed by the Consent Decree that settled Labor/Community Strategy Center v MTA in late 1996 until very recently.

    In that quote, Metro is comparing services standards to actual performance.  It is certainly true that, until the passage of the new policy a few months ago, Metro’s 1.20 service standard was one of the lowest in the industry for larger city operators.  However, Metro routinely failed to meet this standard, which was a major source of complaints by the plaintiffs in L/CSC v MTA – and MTA’s overall average passenger loads have among the highest in the industry for decades.

    Comparing actual results to actual results is far more meaningful than comparing service standards to service standards.  Is 42 percent low, high, or what?  The standard methodology for determining this is peer group comparison.  The Federal Government makes transit data available though its National Transit Database – which we used for the 2009 reporting year3.

    We then constructed our peer group, the twenty largest U.S. transit operators by annual unlinked passenger trips that operate both bus and rail service4 and developed the data for: 

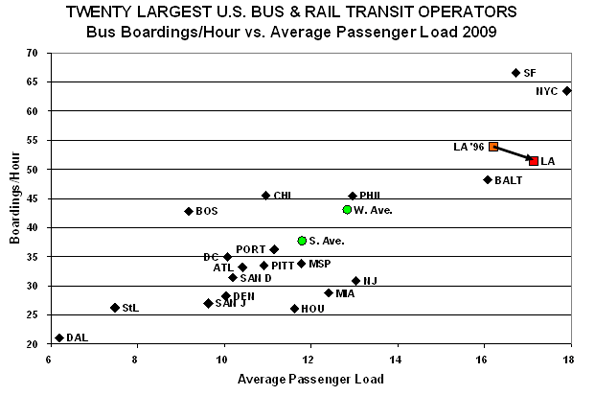
    APL:  Average Passenger Load
    BHr:   Boardings/Hour
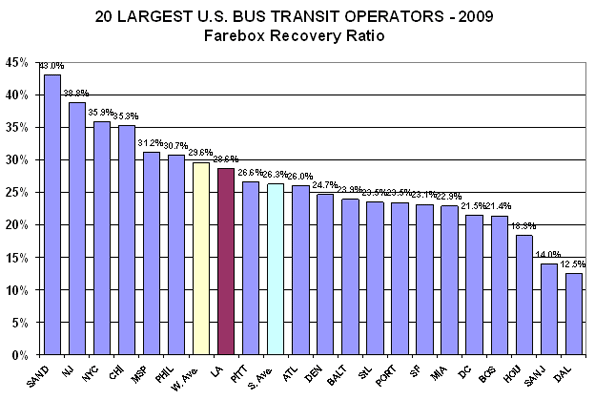
    FRR:   Farebox Recovery Ratio
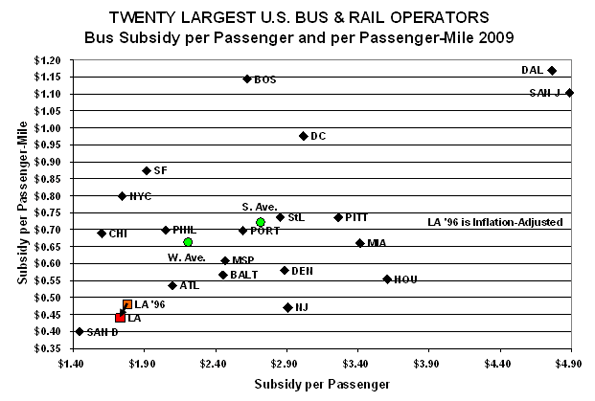
    SP:       Subsidy/Passenger
    SPM:   Subsidy/Passenger Mile

    The results are:

    1.         FRR: Higher is better – but, this statistic can often be misunderstood.  For example, a high cost operator with high fare can have a higher FRR than a low cost operator, but the low cost operator will be providing a better deal, financially, for both the riders and the taxpayers.

    2.  APL/BHr: Appearing and to the right on the next graph indicates higher load factors.  Higher is better; however, at some point, overcrowding impacts service quality and reliability.

    3.  SP/SPM: On this graph, lower is better, so down and the left is superior – except that, at some point, low cost can indicate concerns about quality of service and safety.

    While Metro is not among the highest in FRR, it has more than twice as many ranked below it (13) than above it (six).  Considered with the subsidy metrics, Metro bus service is a fair deal to the riders and a great deal for the taxpayers.

    On the service utilization graph, Metro is second highest in APL, beaten by NYC, and third on BHr, beaten by NYC and SF.  We added, "LA ’96," for 1996, the year before the Consent Decree went into effect part-way through Metro’s 1997 fiscal year.  BHr has decreased slightly (53.9 to 51.4, or ~4.6%), while APL has increased slightly (16.2 to 17.1, or ~5.6%).  The increase in APL is interesting because Metro’s on-going replacement of primarily 43-seat "hi-floor" with 40-seat "low-floor" buses means that Metro is carrying more people in smaller buses.

    Metro bus service again does well on cost-effectiveness.  San Diego beats Metro on both SP and SPM and Chicago beats Metro on SP.  Metro reduced both of these from 1996 to 2009 after adjusting for inflation5.

    Finally, we decided to do a combined performance index, based on Metro’s own "Route Performance Index" (RPI), which Metro utilizes to eliminate low performers6:

    We have adapted METRO’s RPI in three ways:

    1.  We use it for bus system performance, rather than route performance.

    2.  The "standard" is Metro’s performance on each individual indicator.  The overall score is set at 1.00 for Metro, broken into four components, each of which Metro scores .25.  Operators scoring better on an indicator receives a score higher than .25; performing poorer, lower than .25, with the specific score a direct ratio against Metro’s score (remember that, for subsidy, lower is better, while for route utilization, higher is better).

    3.  Metro utilizes three metrics in its RPI, SP, BHr, and APL.  We added SPM.

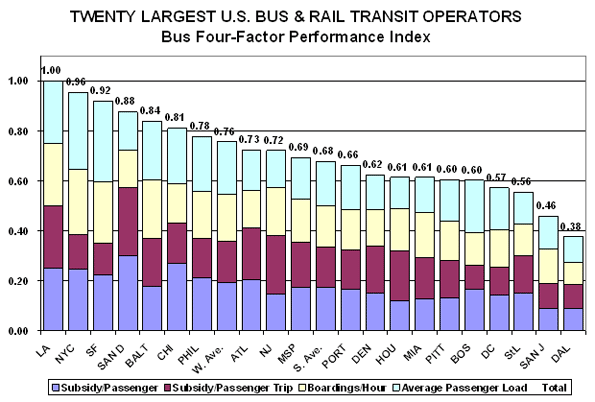
    What we see is Metro rated the highest overall among its peers.  Metro does not win on any single criterion, but its two seconds and two thirds put it ahead of the rest overall.

    Metro’s Transit Service Policy (page 32) states:

    "Lines with an RPI lower than 0.6 are defined as performing poorly and targeted for corrective action.  Lines that been subjected to correction actions and do not meet the 0.60 productivity index after six additional months of operations may be cancelled  …"

    If this .60 cut-off is applied to the 20 bus systems, several would be in major trouble.  Dallas (.38), San Jose (.46), Saint Louis (.56), and Washington, DC, (.57) are below the cut-off.  Boston and Pittsburgh (both at .60) are right on the line, and Miami (.61), Houston (.61), and Denver (.62) only slightly above.

    If one takes the Metro RPI and applies it to the nation’s Top 20, nine of the 20 are either below or very close to the cut-off point. This implies that a high portion of the individual lines, a majority in at several cases, are below the Metro route-by-route cutoff point.

    Circling back to Metro routes, this could mean that many of the routes that Metro would cut, using its RFI procedure, would be average or even above-average routes for many of the nation’s larger bus systems.  Failing to meet the Metro average is actually a very high cut-off point when compared to the national performance.

    This is not to say that no Metro service should ever be cut or eliminated.  What we are saying is, don’t make the cut-off point too high; there is a lot of well-utilized service, by national standards, that does not pass Metro’s methodology.  More important, where there are bus lines with service reduced, put that back on the many, many Metro bus lines that are underserved – which is the usual condition.

    From the above, we see Metro working very hard to cut to reduce the service operated by the most cost-effective and productive major city bus system in the nation – why?  Unlike most other U.S. transit operators, it is not due to lack of funding – but the explanation will have to wait for my next blog entry.

    1           Steve Hymon, "Metro Proposes Bus Service Changes in June, The Source (Metro’s blog), January 3, 2011, access July 9, 2011:
    http://thesource.metro.net/2011/01/03/metro-proposes-bus-service-changes-in-june/

    2               Ibid.

    3               National Transit Database, accessed July 7, 2011:
    http://www.ntdprogram.gov/ntdprogram/data.htm

    4           American Public Transportation Association, 2011 Public Transportation Fact Book, Table 3: 50 Largest Transit Agencies Ranked by Unlinked Passenger Trips and Passenger Miles, Report Year 2009 (Thousands), page 8, accessed July 7, 2011.
    http://www.apta.com/resources/statistics/Documents/FactBook/APTA_2011_Fact_Book.pdf

    5               U.S. Department of Labor, Bureau of Labor Statistics, CPI-U for LA/Riverside-Orange County, accessed July 7, 2011:
    http://data.bls.gov/pdq/SurveyOutputServlet?data_tool=dropmap&series_id=CUURA421SA0,CUUSA421SA0

    6           Metro, 2011 Metro Transit Service Policy, page 31 and Appendix F, accessed July 7, 2011
    http://www.metro.net/board/Items/2011/02_February/20110224RBMItem9.pdf

  • California Wages War On Single-Family Homes

    In recent years, homeowners have been made to feel a bit like villains rather than the victims of hard times, Wall Street shenanigans and inept regulators. Instead of being praised for braving the elements, suburban homeowners have been made to feel responsible for everything from the Great Recession to obesity to global warming.

    In California, the assault on the house has gained official sanction. Once the heartland of the American dream, the Golden State has begun implementing new planning laws designed to combat global warming. These draconian measures could lead to a ban on the construction of private residences, particularly on the suburban fringe. The new legislation’s goal is to cram future generations of Californians into multi-family apartment buildings, turning them from car-driving suburbanites into strap-hanging urbanistas.

    That’s not what Californians want: Some 71% of adults in the state cite a preference for single-family houses. Furthermore, the vast majority of growth over the past decade has taken place not in high-density urban centers but in lower-density peripheral areas such as Riverside-San Bernardino. Yet popular preferences mean little in a state where environmental zealotry increasingly dictates how people should live their lives.

    Some advocates do cite market forces to justify their policies. Economists on the left and right have cited the recent housing bust as proof that homes are not great investments, suggesting people would be better off leaving their money to the tender mercies of Wall Street speculators. Some demographers also suggest that young people will choose to live in high-density regions throughout their lives and that as boomers age they too will opt out of suburbs for urban apartment living.

    These “facts” may be more grounded in academic mythology than reality. Some widely quoted experts, like the Anderson Forecast at UCLA, cite Census information to say that demographics are shifting demand from single-family homes to condos and apartments, although the Census asked no such question. These experts also fail to address why condo prices have dropped even more in the major California markets than single-family home prices; the percentage of starts that come from single-family houses shifts from year to year, but last year’s number tracks around the same level as seen in the 1980s.

    Perhaps the biggest weakness in the analysis lies with long-term demographic factors. As I wrote last week, many of the “young and restless” folks whom city planners try to court tend to move into suburbs and affordable low-density regions as they grow older and begin starting families. Similarly, the vast majority of boomers, according to AARP, want to remain in their old homes as long as possible. Most of those homes are located in suburban, low- to medium-density neighborhoods.

    But who needs facts when you have religion? Take the Association of Bay Area Governments (ABAG) and Metropolitan Transit Commission’s (MTC) new “sustainable communities strategy,” a document designed to meet the requirements of the state’s draconian anti-greenhouse gas legislation.

    This “strategy” seeks to all but reduce growth in the region’s lower-density outer fringe – eastern Contra Costa County as well as the Napa, Vallejo and Santa Rosa metropolitan areas — which grew more than twice as fast as the core and inner suburbs. Instead the ABAG-MTC projects a soaring increase in demand for high-density housing and its latest “vision” report calls for 97% of all the region’s future housing be built in urban areas, virtually all of it multi-family apartments, to accommodate an estimated 2 million residents

    The projections underpinning ABAG’s strategy are absurd. Over the past decade the population of the region’s historic core cites San Francisco and Oakland — where much of the dense growth would be expected to take place — increased by 1.7%, compared with 6.5% for the suburbs. Overall regional growth stood at a modest 5.1%, roughly half that of the previous decade and just about half of the national and state averages.

    Given this record, a more reasonable assumption would be population growth at something closer to 1 million, half the projected amount. Assumptions about the economy to support even this growth are also dubious. The ABAG report, for example, fantasizes that by 2030 the Bay Area will increase its employment by 900,000 — a neat trick for an area that overall lost 300,000 positions over the past decade.

    So, why wage war on the house? Some greens seem to regard the single-family house as an assault on eco-consciousness. Yet in many cases, these objections are overstated. Research supporting higher-density housing , for example, has routinely excluded the greater emissions from construction material extraction and production, building construction itself and& greenhouse gas emissions from common areas like parking levels, entrances and elevators.

    Further, higher densities are associated with greater congestion, which retards fuel efficiency and increases greenhouse gas emissions, a factor not sufficiently considered. Given that less than 10% of Bay Area residents take transit — and barely 3% in its economic engine Silicon Valley — higher density likely would create greater, not fewer, emissions.

    The ABAG report also studiously avoids mentioning the potential greenhouse gas reductions to be had by expanding telecommuting, which is growing six times faster than the fervently pushed transit commuting in the region. The Silicon Valley already has 25% more telecommuters than transit users. Clearly, by pushing telecommuting, you could get big reductions in GHG without a “cramming” agenda.

    Ultimately the density agenda reflects less a credible strategy to reduce GHG than a push among planners to “force” Californians, as one explained to me, out of their homes and into apartments. In pursuit of their “cramming” agenda planners have also enlisted powerful allies – or perhaps better understood as ”useful idiots” — developers and speculators who see profit in the eradication of the single family by forcibly boosting the value of urban core properties.

    In the end, however, substituting religion for markets and people’s preferences is counterproductive. For one thing, people “forced” to live densely will find other places to live the way they like — even if it means leaving California. This is already happening to middle class families in places like San Francisco and may soon be true of California’s traditionally middle-class-friendly interior as well.

    In the end, two markets are likely to grow in the Bay Area. One is low-end rental housing for students and an expanding servant class — after all Google millionaires need people to walk their dogs and paint their toenails. The other is luxury retirement facilities for the region’s growing population of aging affluents. Once a self-consciously “cool” youth magnet, Marin County, for example, is now one of the country’s oldest urban counties, with a median age of 44.5; San Francisco is headed in the same direction.

    Developers can drool over the prospects of building high-end assisted living joints for all those aging hippies who made their bundle during the state’s glory days and settled into places like Mill Valley. After all, unlike young families, these affluent oldsters will be able to afford indulging in the state’s mild climate, natural food restaurants and brilliant scenery. And with easily accessible medical marijuana and a good sound system for playing Grateful Dead recordings, the gray-ponytail set could be in for a hell of a good time, at least as long as it lasts.

    This piece originally appeared at Forbes.com.

    Joel Kotkin is executive editor of NewGeography.com and is a distinguished presidential fellow in urban futures at Chapman University, and an adjunct fellow of the Legatum Institute in London. He is author of The City: A Global History. His newest book is The Next Hundred Million: America in 2050, released in February, 2010.

    Photo by Mike Behnken

  • Learning the right lessons from LA’s “Carmageddon”

    Carmageddon has come and gone, and the world didn’t end. The catalyst for the predicted disaster was the closure of Interstate 405 in Los Angeles for construction for the weekend of the 16th and 17th of July. Freeway closures aren’t all that unusual, but the 405 is not a regular freeway. It is both the busiest, and most congested road in America. The 405 carries an estimated half million vehicles per weekday. Had traffic been even close to normal volumes—even weekend volumes—the event would have earned the nickname. However, less people drove. Way less people. In fact, the roads were unusually empty.

    There are two lessons that one might be tempted to take home from this:

    1. Persuasion can cause people to drive less.
    2. America could do with less freeways.

    These are the wrong lessons to take away. Using moral suasion or fear to alter people’s behavior can work under certain circumstances, but it hasn’t helped alter people’s day to day commuting patterns. People drive more now than ever, even though the glamorization of automobiles has diminished, and the appeal of urban living has increased. There are plenty of people who choose urban, auto-free living, but that’s a choice that isn’t made by public interest campaigns. It may be the case that there are compelling arguments for stalling the growth of urban freeways, but using Carmageddon to make that point would be disingenuous.

    The two real lessons of Carmageddon are:

    1. Persuasion can convince people to drive less under unusual circumstances–temporarily.
    2. When faced with the right incentives, people will drive less.

    The fear stirred up about the closure for months obviously worked. Billboards went up; the media counted down; celebrities Tweeted warnings at the behest of the city; Mayor Villaraigosa advised people to “go on vacation,” and councilor Paul Koretz told people to “stay the Hell away.” But this only works in acute situations, where there is a credible threat. The fact that the apocalyptic term Carmageddon caught on certainly helped permeate the public consciousness. But everyone knows LA traffic is usually incredibly bad, yet they endure it on a daily basis. People in LA are grudgingly willing to tolerate the country’s worst traffic, but they’re not willing to venture into the city with Interstate 405 closed unless they have to. Since it was on a weekend, most of them didn’t. Many radio shows even pre-taped segments to keep their guests from getting stuck in traffic. Several film and television productions were shut down for the weekend. These types of deferrals can be arranged, but rarely, and with sufficient notice. Citing Carmageddon as an example of how we can do with less automobile traffic is like pointing to a blackout as an example of how we can reduce electricity consumption.

    The most important lesson, though, is that people respond to incentives. Since the city obviously doesn’t want people to “stay the Hell away” forever, they’re going to have to come up with another way to use incentives if they want to tackle gridlock. LA drivers spend over half a billion hours per year stuck in excess traffic delays, which costs the economy roughly $12 billion dollars. Adding more freeway lanes seems like an obvious solution, except for the fact that it doesn’t work. Studies have shown that every percentage increase in roads leads to an equal percentage increase in driving. In other words, more roads mean more driving. There are certainly exceptions to this, since the optimal level of roads isn’t zero, but it does illustrate the fact that we can’t just build our way out of traffic congestion. Instead, we need to introduce strong incentives other than fear to reduce congestion. That incentive is congestion pricing.

    While road tolls aren’t the most appealing thing to drivers, electronic tolls can reduce the amount of discretionary driving, and convince some number of people to take transit rather than driving. Some would describe this approach as a “War on Drivers,” but the reality is that the intention is precisely the opposite. It is an attempt to make sure that drivers can actually get where they need without soul crushing traffic. If that means they’ll have to pay $2 to drive to the store to get bread, maybe they’ll walk to the corner store instead. Incentives are important, and even small incentives can radically shift people’s behavior. Goading people into changing their behavior rarely works. Otherwise no one would drink cola, or eat trans-fats.  On ordinary days, people need to get places, and for most people, driving is more convenient. The number of people for which driving is the most convenient choice will decline if the urban renaissance being predicted does materialize, but we can’t count on the majority of existing drivers to abandon their cars and move to city cores. Acknowledging that cars will be the dominant mode of transportation for the foreseeable future, and that people drive more than they need to when it is free are key to addressing traffic congestion. Otherwise, everybody will continue to sit in traffic.

    This piece originally appeared at the Frontier Centre for Public Policy Blog.

    Steve Lafleur is a public policy analyst with the Frontier Center for Public Policy.

  • The Next Boom Towns In The U.S.

    What cities are best positioned to grow and prosper in the coming decade?

    To determine the next boom towns in the U.S., with the help of Mark Schill at the Praxis Strategy Group, we took the 52 largest metro areas in the country (those with populations exceeding 1 million) and ranked them based on various data indicating past, present and future vitality.

    We started with job growth, not only looking at performance over the past decade but also focusing on growth in the past two years, to account for the possible long-term effects of the Great Recession. That accounted for roughly one-third of the score.  The other two-thirds were made up of a a broad range of demographic factors, all weighted equally. These included rates of family formation (percentage growth in children 5-17), growth in educated migration, population growth and, finally, a broad measurement of attractiveness to immigrants — as places to settle, make money and start businesses.

    We focused on these demographic factors because college-educated migrants (who also tend to be under 30), new families and immigrants will be critical in shaping the future.  Areas that are rapidly losing young families and low rates of migration among educated migrants are the American equivalents of rapidly aging countries like Japan; those with more sprightly demographics are akin to up and coming countries such as Vietnam.

    Many of our top performers are not surprising. No. 1 Austin, Texas, and No. 2 Raleigh, N.C., have it all demographically: high rates of immigration and migration of educated workers and healthy increases in population and number of children. They are also economic superstars, with job-creation records among the best in the nation.

    Perhaps less expected is the No. 3 ranking for Nashville, Tenn. The country music capital, with its low housing prices and pro-business environment, has experienced rapid growth in educated migrants, where it ranks an impressive fourth in terms of percentage growth. New ethnic groups, such as Latinos and Asians, have doubled in size over the past decade.

    Two advantages Nashville and other rising Southern cities like No. 8 Charlotte, N.C., possess are a mild climate and smaller scale. Even with population growth, they do not suffer the persistent transportation bottlenecks that strangle the older growth hubs. At the same time, these cities are building the infrastructure — roads, cultural institutions and airports — critical to future growth. Charlotte’s bustling airport may never be as big as Atlanta’s Hartsfield, but it serves both major national and international routes.

    Of course, Texas metropolitan areas feature prominently on our list of future boom towns, including No. 4 San Antonio, No. 5 Houston and No. 7 Dallas, which over the past years boasted the biggest jump in new jobs, over 83,000. Aided by relatively low housing prices and buoyant economies, these Lone Star cities have become major hubs for jobs and families.

    And there’s more growth to come. With its strategically located airport, Dallas is emerging as the ideal place for corporate relocations. And Houston, with its burgeoning port and dominance of the world energy business, seems destined to become ever more influential in the coming decade. Both cities have emerged as major immigrant hubs, attracting on newcomers at a rate far higher than old immigrant hubs like Chicago, Boston and Seattle.

    The three other regions in our top 10 represent radically different kinds of places. The Washington, D.C., area (No. 6) sprawls from the District of Columbia through parts of Virginia, Maryland and West Virginia. Its great competitive advantage lies in proximity to the federal government, which has helped it enjoy an almost shockingly   ”good recession,” with continuing job growth, including in high-wage science- and technology-related fields, and an improving real estate market.

    Our other two top ten, No. 9 Phoenix, Ariz., and No. 10 Orlando, Fla., have not done well in the recession, but both still have more jobs now than in 2000. Their demographics remain surprisingly robust. Despite some anti-immigrant agitation by local politicians, immigrants still seem to be flocking to both of these states. Known better s as retirement havens, their ranks of children and families have surged over the past decade. Warm weather, pro-business environments and, most critically, a large supply of affordable housing should allow these regions to grow, if not in the overheated fashion of the past, at rates both steadier and more sustainable.

    Sadly, several of the nation’s premier economic regions sit toward the bottom of the list, notably former boom town Los Angeles (No. 47). Los Angeles’ once huge and vibrant industrial sector has shrunk rapidly, in large part the consequence of ever-tightening regulatory burdens. Its once magnetic appeal to educated migrants faded and families are fleeing from persistently high housing prices, poor educational choices and weak employment opportunities. Los Angeles lost over 180,000 children 5 to 17, the largest such drop in the nation.

    Many of L.A.’s traditional rivals — such as Chicago (with which is tied at No. 47), New York City (No. 35) and San Francisco (No. 42) — also did poorly on our prospective list.  To be sure,  they will continue to reap the benefits of existing resources — financial institutions, universities and the presence of leading companies — but their future prospects will be limited by their generally sluggish job creation and aging demographics.

    Of course, even the most exhaustive research cannot fully predict the future. A significant downsizing of the federal government, for example, would slow the D.C. region’s growth. A big fall in energy prices, or tough restrictions of carbon emissions, could hit the Texas cities, particularly Houston, hard. If housing prices stabilize in the Northeast or West Coast, less people will flock to places like Phoenix, Orlando or even Indianapolis (No.11) , Salt Lake City (No. 12) and Columbus (No. 13). One or more of our now lower ranked locales, like Los Angeles, San Francisco and New York, might also decide to reform in order to become more attractive to small businesses and middle class families.

    What is clear is that well-established patterns of job creation and vital demographics will drive future regional growth, not only in the next year, but over the coming decade.  People create economies and they tend to vote with their feet when they choose to locate their families as well as their businesses.  This will prove   more decisive in shaping future growth   than the hip imagery and big city-oriented PR flackery that dominate media coverage of America’s changing regions.

    Cities of the Future Rankings
    Rank Metropolitan Area
    1 Austin, TX
    2 Raleigh, NC
    3 Nashville, TN
    4 San Antonio, TX
    5 Houston, TX
    6 Washington, DC-VA-MD-WV
    7 Dallas-Fort Worth, TX
    8 Charlotte, NC-SC
    8 Phoenix, AZ
    10 Orlando, FL
    11 Indianapolis, IN
    12 Salt Lake City, UT
    13 Columbus, OH
    14 Jacksonville, FL
    15 Atlanta, GA
    16 Las Vegas, NV
    16 Riverside, CA
    18 Portland, OR-WA
    19 Denver, CO
    20 Oklahoma City, OK
    21 Baltimore, MD
    22 Louisville, KY-IN
    22 Richmond, VA
    24 Seattle, WA
    25 Kansas City, MO-KS
    26 San Diego, CA
    27 Miami, FL
    28 Tampa, FL
    29 Sacramento, CA
    30 Birmingham, AL
    31 New Orleans, LA
    32 Philadelphia, PA-NJ-DE-MD
    33 Minneapolis, MN-WI
    34 St. Louis, MO-IL
    35 Cincinnati, OH-KY-IN
    35 New York, NY-NJ-PA
    37 Boston, MA-NH
    38 Memphis, TN-MS-AR
    39 Pittsburgh, PA
    40 Virginia Beach, VA-NC
    41 Rochester, NY
    42 Buffalo, NY
    42 San Francisco, CA
    44 Hartford, CT
    45 Milwaukee, WI
    45 San Jose, CA
    47 Chicago, IL-IN-WI
    47 Los Angeles, CA
    49 Providence, RI-MA
    50 Detroit, MI
    51 Cleveland, OH

    This piece originally appeared at Forbes.com.

    Joel Kotkin is executive editor of NewGeography.com and is a distinguished presidential fellow in urban futures at Chapman University, and an adjunct fellow of the Legatum Institute in London. He is author of The City: A Global History. His newest book is The Next Hundred Million: America in 2050, released in February, 2010.

    Photo by Exothermic Photography

  • The New State of Coastal California?

    In 2009, former California legislator Bill Maze proposed dividing his state, hiving off thirteen counties as Coastal (or Western) California (see map). Maze, a conservative from the agricultural Central Valley, objects to the domination of state politics by the left-leaning Los Angeles and San Francisco metropolitan areas. The initial impetus for his proposal was the passage by state voters in 2008 of Proposition 2, requiring larger pens and cages for farm animals. Agricultural interests denounced the measure, arguing that it would increase their costs and threaten their livelihoods. Meanwhile, the state’s on-going water crisis, which largely pits farmers against environmentalists, widens the divide. Unforgiving invective marks both sides of the debate. A post in Politics Daily characterized secessionist farmers as dolts fighting against “liberal Hollywood types [who] don’t understand the importance of torturing animals.” The Downsize California website, on the other side, fulminates against coastal “radicals” who are “infatuated with nature over mankind and are sympathetic to illegals and criminals.”

    The desire to divide unwieldy California may be quixotic but it is nothing new; at least 27 divisional schemes have been proposed since statehood in 1850. Most have sought to split the state along north-south lines. In the mid 1800s, southern California secessionists felt marginalized and ill-served by a state government based in the distant Sacramento. By the mid 1900s, the tables had been turned, as northern Californians came to resent the demographically and economically dominant greater Los Angeles (LA) area. The California State Water Project, with its vast pipes snaking over the Tehachapi Mountains, was a particular irritant. As a child growing up in northern California’s Bay Area in the 1960s, I almost never heard positive statements about LA, which was widely condemned as a vast suburban wasteland inhabited by shallow people scheming to “steal our water.” Such naked regional bigotry was spouted by people who would have been ashamed to say anything remotely smacking of racial or religious prejudice.

    Economic and political evolution, coupled with substantial immigration and emigration, gradually reduced the tensions between the Los Angeles and San Francisco metropolitan areas while accentuating the division between urban coastal and interior agricultural regions. But as the 2004 “voter index map” reproduced above shows, the state’s actual political divide is far more complex than that. Close inspection reveals a Democratic voting zone essentially split between coastal northern California and the Los Angeles area, with a few interior outliers in college towns, urban cores, Hispanic rural areas, and mountainous recreation sites. Contrasting to this area is a spatially larger and more contiguous but demographically smaller Republican-voting block covering the rest of the state.

    Maze’s scheme places several relatively conservative countries (Ventura, San Luis Obispo) in liberal Coastal California, doing so largely for reasons of geographical contiguity. Less explicable is his exclusion of the left-voting northern coastal countries of Sonoma, Mendocino, and Humboldt. These may be relatively rural counties, but where the main crops are wine grapes and marijuana one should not expect conservative voting patterns. Note that certainly highly rural and relatively remote regions have solidly left electoral records, an unusual pattern. These include the Big Sur coast in Monterrey County, with its artistic heritage, and the counter-cultural “hippy” centers of Mendocino and southern Humboldt counties, such as Willits and Garberville.

    Martin W. Lewis has taught college-level geography for 20 years, and is currently a senior lecturer at Stanford University. He is a co-author on two leading textbooks in world geography, Diversity Amid Globalization and Globalization and Diversity. He is also the author of Green Delusions: An Environmentalist Critique of Radical Environmentalism, and Wagering the Land: Ritual, Capital, and Environmental Degradation in the Cordillera of Northern Luzon, and is co-author of The Myth of Continents.

  • Blight Envy – How Development Works in LA

    I never thought I’d say this, but I think I want to live in a blighted neighborhood. Well, actually, a community redevelopment area (CRA). They used to be one and the same, but no longer. Apparently you have to live or do business in a redevelopment area to get any “love” in Los Angeles … love being when the government takes your tax dollars and gives them to someone else no more needy.

    Let me explain.

    The City Council of Los Angeles just approved a program to loan CRA money to businesses in the Hollywood redevelopment area, which extends from Franklin Avenue south to Santa Monica Boulevard. If borrowers meet certain conditions, loans for storefront improvements never have to be paid back … wow, free money!

    As a card-carrying member of the Los Angeles Area Chamber of Commerce, I certainly don’t begrudge businesses financial support to help improve their prospects, including the streetscape, when the whole community benefits.

    But let’s be real: Many parts of the Hollywood redevelopment area, which includes the Hollywood & Highland complex, Sunset + Vine and the Roosevelt Hotel, are no more blighted than any other part of the city.

    That includes my neighborhood council district, which lies south of the designated redevelopment area and encompasses Melrose Avenue, West Third Street and Wilshire Boulevard on the Miracle Mile. But there’s no money for our businesses. Or businesses on West Pico Boulevard. Or businesses on Van Nuys Boulevard. We are chopped liver.

    There is a place for redevelopment, to be sure, but this program illustrates exactly why the CRA has so many critics. In this case, the problem isn’t the program — storefront improvement loans are a great idea. The problem is in the execution. This should be a citywide program, with funds shared among all Council districts in Los Angeles and doled out based on objective criteria.

    It’s time to rethink redevelopment.

    Cary Brazeman, a former executive with CB Richard Ellis in Los Angeles, is a neighborhood council member and founder of LA Neighbors United. Contact him through www.LAneighbors.org

  • Outlawing New Houses in California

    UCLA’s most recent Anderson Forecast indicates that there has been a significant shift in demand in California toward condominiums and apartments. The Anderson Forecast concludes that this will cause problems, such as slower growth in construction employment because building multi-unit dwellings creates less employment than building the detached houses that predominate throughout California and most of the nation. The Anderson Forecast says that this will hurt inland areas (such as the Riverside-San Bernardino area and the San Joaquin Valley) because their economies are more dependent on construction than coastal areas, such as Los Angeles, the San Francisco Bay Area and San Diego.

    Detached Housing Permits Remain Strong in the Historic Context: The Anderson Forecast reports that multi-unit building permits have recovered more quickly than building permits for detached housing. However, any such shift is likely to be highly volatile. Since the peak of the bubble, the distribution of building permits between detached and multi-unit in California has been on a roller coaster. Indeed the Anderson Forecast characterizes the "2010 US Census" as "showing a significant shift in demand toward condominiums and apartments." Actually, the 2010 US Census asked no question from which such a conclusion about housing types or any question from which such a conclusion could be drawn.

    The trends in the building permit data are not completely clear. In 2005, the year before prices started to collapse, 75 percent of building permits in California were for detached housing. This trended downward, reaching a low of 52 percent in 2008. In 2009, the detached housing recovered to account for 73 percent of all housing building permits. Then the figure fell back to 59 percent in 2010.

    With these erratic trends, it is tricky to forecast longer term market trends and consumer demand.  Economic projections in 1934 would have suffered from a similar problem, as the Great Depression was continuing and no one could really tell when it would end. Today’s continuing housing depression may be similar.

    Moreover, as the Anderson Forecast notes, detached housing construction declined in the early 1980s, dropping to 42 percent in 1985. In fact, over the 25 years between 1960 and 1985, detached houses accounted for an average of only 54 percent of new housing construction in California, well below the 2010 figure of 59 percent (Figure 1).

    Equally important, the condominium market remains in a deep depression. In 2010, less than four percent of houses built for sale in the United States were multi-unit buildings, including condominiums (Figure 2), as an increasing majority of multi-unit buildings have been built as rentals (Figure 3). Comparable California data is not available, but from the peak of the bubble (2006/7) to 2009, there was a loss of more than 3,000 owner occupied  multi-unit dwellings with 10 or more units, while owner occupied detached houses increased by nearly 100,000 (Note 1).

    If there is an intrinsic pent-up preference for condominium living, it is not evident in the poor performance of high-density developments even in such theoretically desirable places as Santa Monica, San Francisco, Oakland, San Jose and North Hollywood. Condominium prices, for example, have fallen 52 percent in the major California metropolitan areas, compared to 48 percent for single-family houses (Figure 4). Naïve developers, relying too much on the much promoted notion that suburban empty-nesters were chomping at the bit to move to new housing in the core area, often watched their empty units liquidated at $0.50 or less on the dollar or turned into rentals.  Further, if people are moving to apartments, it’s not for love of density but more likely due weakening economic circumstances.

    Inland California Continues to Grow Faster: The Anderson Forecast also suggests that growth in interior California will suffer because "workers are less likely to move inland into an apartment and commute toward the coast." This assumption of slower inland growth reflects the conventional wisdom that areas outside the large coastal metropolitan areas have stopped growing since the burst of the housing bubble as people flock towards the coastal urban core (Note 2). The reality is different, as interior California and the peripheral metropolitan areas of the larger metropolitan regions (Note 3) continue to grow more strongly even in bad economic times. After the burst of the bubble, from 2008 to 2010 (Figure 5):

    • In the Los Angeles area, the adjacent Riverside-San Bernardino ("Inland Empire") and Oxnard metropolitan areas, combined, have grown at seven times the rate of the core Los Angeles metropolitan area.
    • In the San Francisco Bay area, the adjacent Napa, Santa Cruz, Santa Rosa and Vallejo metropolitan areas, combined, have grown nearly twice as quickly as the core San Francisco and San Jose metropolitan areas.
    • California’s deep interior, the San Joaquin Valley has grown even faster than the exurban areas of Los Angeles and San Francisco.

    One key reason: most people who move to interior areas do not commute toward the core.  For example, less than 10 percent of workers in the Riverside-San Bernardino metropolitan area commute into Los Angeles County, a market share that declined 15 percent between 2000 and 2007. Many also simply cannot afford the higher cost of living in the coastal metropolitan areas, which likely will continue to retard growth in the core metropolitan areas.

    The Policy Threat to New Houses : A survey by the Public Policy Institute of California suggests a vast preference (70%) for detached housing among the state’s consumers.  This continuing preference is demonstrated by detached housing prices that are generally two times historic norms relative to incomes in the coastal metropolitan areas (Los Angeles, San Francisco, San Diego and San Jose).

    Yet now, this choice is under a concerted assault by both the state and many local governments, cheered on by most media and the academic community.  For years, planning regulations have driven land prices so high that house prices have risen to well above the rest of the nation (Figure 5) under regulations referred to by terms such as "smart growth" and "urban containment." The regulations and the inevitably resulting speculation propelled a disproportionate rise (nearly $2 trillion) in California house prices compared to national norm. If California house prices had risen at the same rate relative to incomes as in more liberally regulated areas, the loss to financial markets could have been hundreds of billions of dollars less when the bubble burst (Figure 6).

    Planning for Crowding and Density: California’s assault on detached housing is taking on a distinctly religious fervor.  The state’s global warming law (Assembly Bill 32) and urban planning law (Senate Bill 375) is providing a new basis to impose draconian limits on the construction of detached housing. For example, in the San Francisco Bay area, it has been proposed that 97 percent of new housing be built within the existing urban footprint. That would mean an emphasis on multi-unit housing and little or no new housing on the urban fringe. The option of a single family home will be all but non-existent for   even solidly middle income Californians.

    Planning authorities in the Bay Area seem oblivious to the fact that destroying affordability also destroys growth, already evident by the state’s poor economic performance and ebbing demographic vigor.    Planners rosily project 2 million more people between 2010 and 2035 in the San Francisco Bay area. The growth rate over the past 10 years suggests a number less than half that (Figure 7) and given the rapid aging of the area, even this estimate may be too high. The planners also project more than 1.2 million   new jobs, something difficult to believe given the more than 300,000 job loss (Note 4) that occurred in the Bay Area between 2000 and 2010 (Figure 8).

    The Environmental "Fig Leaf:" The environmental justification for these policies is fragile . Research supporting higher density housing has routinely excluded the greater emissions from construction material extraction and production, building construction itself and common greenhouse gas emissions from energy consumption that does not appear on consumer bills. Further, higher densities are associated slower and more erratic speeds, which retards fuel efficiency and increases greenhouse gas emissions, a factor not sufficiently considered.

    The report seems to ignore any other options besides rapid densification, which as McKinsey Global Institute has pointed out is not at all necessary to reduce GHG emission reductions. They point to other factors as more fuel efficient cars.   

    Oddly, the San Francisco Bay Area proposal does not even mention working at home (much of it telecommuting), the most environmentally friendly way of accessing employment. Working at home has grown six times the rate of transit since 2000 in the Bay Area.

    Outlawing New Houses Detached housing remains the overwhelming choice of Californians. There is no indication that this preference is about to be replaced by a preference for high-density housing.  Current and future middle class Californians could be corralled into more crowded conditions, because questionable planning doctrines mandate that detached housing should be outlawed.

    —-

    Notes:

    1. Calculated from 2006, 2007 and 2009 American Community Survey data. The over ten unit category is used because is more generally reflective of the dense condominium development generally favored by densification advocates (Latest data available).

    2.  Another questionable tenet of conventional wisdom is that the price declines in the outer suburbs were greater than in the cores. When the price declines reached their nadir, core California markets were generally at least as depressed from their peak prices as suburban markets.

    3. Metropolitan region refers to combined statistical areas, which have a core metropolitan area, such as the Los Angeles MSA and include surrounding metropolitan areas, such as the Riverside-San Bernardino MSA and the Oxnard MSA.

    4. Annual, 2000 to 2010, calculated from California Economic Development Department data.

    Lead photo: Houses in Los Angeles. Photograph by author.

    Wendell Cox is a Visiting Professor, Conservatoire National des Arts et Metiers, Paris and the author of “War on the Dream: How Anti-Sprawl Policy Threatens the Quality of Life

  • California’s Green Jihad

    Ideas matter, particularly when colored by religious fanaticism, wreaking havoc even in the most favored of places. Take, for instance, Iran, a country blessed with a rich heritage and enormous physical and human resources, but which, thanks to its theocratic regime, is largely an economic basket case and rogue state.

    Then there’s California, rich in everything from oil and food to international trade and technology, but still skimming along the bottom of the national economy. The state’s unemployment rate is now worse than Michigan’s and ahead only of neighboring Nevada.  Among the nation’s 20 largest metropolitan regions, four of the six with the highest unemployment numbers are located in the Golden State: Riverside, Los Angeles, San Diego and San Francisco. In a recent Forbes survey, California was home to six of the ten regions where the economy is poised to get worse.

    One would think, given these gory details, California officials would be focused on reversing the state’s performance. But here, as in Iran, officialdom focuses more on theology than on actuality.   Of course, California’s religion rests not on conventional divinity but on a secular environmental faith that nevertheless exhibits the intrusive and unbending character of radical religion.

    As with its Iranian counterpart, California’s green theology often leads to illogical economic and political decisions. California has decided, for example,  to impose a rigid regime of state-directed planning related to global warming, making a difficult approval process for new development even more onerous.  It has doubled-down on climate change as other surrounding western states — such as Nevada, Utah and Arizona — have opted out of regional greenhouse gas agreements.

    The notion that a state economy — particularly one that has lost over 1.15 million jobs in the past decade — can impose draconian regulations beyond those of their more affluent neighbors, or the country, would seem almost absurd.

    Californians are learning what ideological extremism can do to an economy. In the Islamic Republic, crazy theology leads to misallocating resources to support repression at home and terrorism abroad. In California green zealots compel companies to shift their operations to states that are still interested in growing their economy — like Texas. The green regime is one reason why CEO Magazine has ranked California the worst business climate in the nation.

    Some of these green policies often offer dubious benefits for the environment. For one thing, forcing California businesses to move to less energy-efficient states, or to developing countries like China, could have a negative impact overall since shifting production to Texas or China might lead to higher greenhouse gas production given California’s generally milder climate.   A depressed economy also threatens many worthy environmental programs, delaying necessary purchases of open space and forcing the closure of parks. These programs enhance life for the middle and working classes without damaging the overall econmy.

    But people involved in the tangible, directly carbon-consuming parts of the economy — manufacturing, warehousing, energy and, most important, agriculture — are those who bear   the brunt of the green jihad. Farming has long been a field dominated by California, yet environmentalist pressures for cutbacks in agricultural water supplies have turned a quarter million acres of prime Central Valley farmland fallow, creating mass unemployment in many communities.

    “California cannot have it both ways, a desire for economic growth yet still overregulating in the areas of labor, water, environment,” notes Dennis Donahue, a Democrat and mayor of Salinas, a large agricultural community south of San Jose. Himself a grower, Donahue sees agricultural in California being undermined by ever-tightening regulations, which have led some to expand their operations to other sections of the country, Mexico and even further afield.

    Other key blue collar industries are also threatened, from international trade to manufacturing. Since before the recession California manufacturing has been on a decline.  Los Angeles, still the nation’s largest industrial area, has lost a remarkable one-fifth of its manufacturing employment since 2005.

    California’s ultra-aggressive greenhouse gas laws will further the industrial exodus out of the state and further impoverish Californians.  Grandiose plans to increase the percentage of renewable energy in the state from the current unworkable 20% to 33% by 2020 will boost the state’s electricity costs, already among the highest in the nation, and could push the average Californian’s bill up a additional 20%.

    Ironically California, still the nation’s third largest oil producer, should be riding the rise in commodity prices, but the state’s green politicians seem determined to drive this sector out of the state.. In Richmond, east of San Francisco, onerous regulations pushed by a new Green-led city administration may drive a huge Chevron refinery, a major employer for blue collar workers, out of the city entirely. Roughly a thousand jobs are at stake, according to Chevron’s CEO, who also questioned whether the company would continue to make other investments inside the state.

    Being essentially a religion, the green regime answers its critics with a well-developed mythology about how these policies can be implemented without economic distress.  One common delusion in Sacramento holds that the state’s vaunted “creative” economy — evidenced by the current bubble over   surrounding social media firms — will make up for any green-generated job losses.

    In reality the creative economy simply cannot  make up for losses in more tangible industries. Over the past decade, as the world digitized, the San Jose area experienced one of the stiffest drops in employment of any of the 50 largest regions of the country; its 18% decline was second only to Detroit.  Much of the decline was in manufacturing and services, but tech employment has generally suffered. Over the past decade California’s number of workers in science, technology, engineering and math-related fields actually shrank. In contrast, the country’s ranks of such workers expanded 2.3% and prime competitors such as Texas , Washington and Virginia enjoyed double-digit growth.

    So who really benefits from the green jihad? To date,  the primary winners have been crony capitalists, like President Obama’s newly proposed commerce secretary, John Bryson, who built a fantastically lucrative  career (he was once named Forbes’  “worst valued chief executive”) while  running the regulated utility Edison International. A lawyer by training, Bryson helped found the green powerhouse National Resources Defense Council. He’s been keen to promote strict  renewable energy  standards  that also happen to benefit solar power and electric car companies in which he holds large financial stakes.

    Other putative winners would be large international companies, like Siemens, that hope to build California’s proposed high-speed rail line, the one big state construction project favored by the green-crony capitalist alliance. Fortunately , the states dismal fiscal situation and  rising cost estimates for the project, from $42 to as high as $67 billion, as well as cuts in federal subsidies, are undermining support for this project even among some liberal Democrats.  Even in a theocracy, reality does, at times, intrude.

    Finally, there are the lawyers — lots of them. A hyper-regulatory state requires legal services just like a theocracy needs mobs of mullahs and bare knuckled religious enforcers. No surprise the number of lawyers in California increased by almost a quarter last decade, notes Sara Randazzo of the Daily Journal. That’s two and a half times the rate of population growth.

    The legal boom has been most exuberant along the affluent coast.  Over the past decade, the epicenter of the green jihad, San Francisco, the number of practicing attorneys increased by 17%, five times the rate of the city’s population increase. In the Silicon Valley, Santa Clara and San Mateo counties boosted their number of lawyers at a similar rate. In contrast, lawyer growth rate in interior counties has generally been far slower, often a small fraction of their overall population growth.

    If California is to work again for those outside the yammering classes, some sort of realignment with economic reality needs to take place.  Unlike Iran, California does not need a regime change, just a shift in mindset that would jibe with the realities of global competition and the needs of the middle class. But at least with California we won’t have to worry too much about national security: Given the greens anti-nuke proclivities, it’s unlucky the state will be developing a bomb in the near future.

    This piece originally appeared at Forbes.com.

    Joel Kotkin is executive editor of NewGeography.com and is a distinguished presidential fellow in urban futures at Chapman University, and an adjunct fellow of the Legatum Institute in London. He is author of The City: A Global History. His newest book is The Next Hundred Million: America in 2050, released in February, 2010.

    Photo by msun523

  • World Urbanization Update: Delhi 2nd in a World of Smaller Urbanization

    Perhaps the most surprising development in urban areas over the past year was the ascendancy of Delhi to rank second in the world in population, following only Tokyo – Yokohama. Based upon the new United Nations population estimate, the 7th annual edition of Demographia World Urban Areas places Delhi’s population at 22.6 million. Tokyo – Yokohama, however, is in no immediate jeopardy of losing its number one status, with a population estimated at 36.7 million, approximately 70 percent greater than that of Delhi (Note 1). Demographia World Urban Areas includes population estimates  for all identified urban areas in the world with 500,000 or more residents. Among these 796 urban areas, 169 are in higher income nations and 627 are in lower income nations.

    The Largest Urban Areas: For years, demographers have been watching Mumbai on the assumption that it might eventually emerge as the largest urban area outside Tokyo – Yokohama. However, Mumbai, at 21.3 million, has fallen behind faster growing Delhi and now ranks as the sixth largest urban area in the world. Seoul-Incheon, in Korea, has emerged as the number three urban area, based upon higher than anticipated  suburban growth registered in the 2010 census and now shows a population of 22.5 million. Jakarta, Indonesia’s capital, now stands as number four, with a population of 22.2 million, followed by number five Manila at 21.3 million (Note 2). The next three largest world urban areas are in the Americas with New York at 20.7 million, Sao Paulo at 20.4 million and Mexico City at 19.6 million. The world’s 10th largest urban area is Shanghai (18.7 million), which experienced larger than anticipated growth toward the end of the decade (Table).

    10 Largest Urban Areas in the World: 2011
    Rank
    Geography Urban Area
    Current Year Population Estimate
    Land Area: Square Miles
    Density
    Land Area: Km2
    Density
    Density Year
    1 Japan Tokyo-Yokohama
    36,690,000
    3,500
    10,500
    9,065
    4,000
    2011
    2 India Delhi, DL-HAR-UP
    22,630,000
    605
    37,000
    1,567
    14,300
    2011
    3 South Korea Seoul-Incheon
    22,525,000
    835
    27,000
    2,163
    10,400
    2011
    4 Indonesia Jakarta
    22,245,000
    1,075
    20,400
    2,784
    7,900
    2011
    5 Philippines Manila
    21,295,000
    550
    37,000
    1,425
    14,300
    2009
    6 India Mumbai, MAH
    21,290,000
    300
    70,300
    777
    27,100
    2011
    7 United States New York, NY-NJ-CT
    20,710,000
    4,349
    4,500
    11,264
    1,800
    2000
    8 Brazil Sao Paulo
    20,395,000
    1,125
    18,100
    2,914
    7,000
    2011
    9 Mexico Mexico City
    19,565,000
    780
    25,000
    2,020
    9,700
    2011
    10 China Shanghai
    18,665,000
    1,125
    16,500
    2,914
    6,400
    2011


    Among the top ten urban areas, New York is by far the least dense, followed by Tokyo-Yokohama. They are also the most affluent, with seven of the remaining 10 far more dense and located in lower income countries, while Seoul-Incheon is more dense, but in a nation that is among the latest entrants to higher income status (Figures 1 & 2).


    Highest Population Densities: Dhaka, the capital of Bangladesh is the most dense with 90,600 persons per square mile or 35,000 per square kilometer. Dhaka ranks 24th in population in the world and crowds its approximately 11.5 million residents into 125 square miles or 325 square kilometers (less than the land area of the municipality of Portland, Oregon). Mumbai ranks second in population density, with 70,300 per square mile or 27,100 percent per square kilometer. Among high income urban areas, Macau is the most dense, at 70,000 per square mile or 27,000 per square kilometer, slightly ahead of its neighbor across the Pearl River, Hong Kong, which is estimated to have 66,100 residents per square mile or 25,500 per square kilometer. Of course, both Hong Kong and Macau have artificially high densities, driven by their enclave status. Comparatively few urban areas in the high income world exceed 15,000 per square mile (6,000 per square kilometer).

    Largest Urban Land Area: Although we commonly identify Gotham with the density of high-rise Manhattan, New York sprawls more than any of the top urban areas. Its urban area contains far the largest  land area, stretching to cover 4,350 square miles or 11,300 square kilometers. Los Angeles, more noted for its physical expanse, has approximately one-half the land area of New York and it extends less than both Tokyo – Yokohama and Chicago. Perhaps astonishingly, the Boston urban area covers approximately 95 percent of the land area of Los Angeles, though with only one-third the population.

    Larger Urban Areas, Higher Density: As urban areas become larger, their population densities also increase. Moreover, as in the top 10 urban areas, lower income nations tend to have far higher densities than the urban areas located in the higher income nations(Figures 3 & 4).


    • Overall urban densities are approximately 9,000 per square mile (3,500 per square kilometer) in urban areas with between 500,000 and 1 million population and rise to 15,500 per square mile (6,000 per square kilometer) among urban areas with more than 10 million population.
    • Urban areas in higher income nations range from a population density of 3,800 per square mile (1,500 per square kilometer) among urban areas with from 500,000 to 1,000,000 population. Larger urban areas with more than 10 million population average o 8,900 per square mile (3,400 per square kilometer).
    • The urban areas located in lower income nations have far higher densities densities, ranging from 15,100 per square mile (6,000 per square kilometer) in the 500,000 to 1,000,000 population category and up to 22,100 residents per square mile (8,500 per square kilometer) in the over 10 million population category.           


    Population Density by  Region: There is also considerable variation in urban population densities between the regions of the world (Figures 5 & 6).


    The lowest densities are in affluent areas. The United States and Canada, at 3,600 per square mile (1,400 per square kilometer), Oceania at 4,100 per square mile (1,600 per square kilometer) and Europe at 8,400 per square mile (3,200 per square kilometer). Latin American urban densities are 15,900 per square mile (6,200 per square kilometer), followed by Africa at 18,600 per square mile (7,200 per square kilometer) and Asia, at 18,800 per square mile (7,300 per square kilometer).

    The overall population density of urban areas with more than 500,000 residents in India is estimated at 37,000 per square mile (14,400 per square kilometer), which is more than double that of China, at 17,000 per square mile (6,700 per square kilometer).

    A Smaller Urban World? A review of the size of the world urban areas shows the planet to be made up principally of rural areas and towns and cities with less than 500,000 population. In 2011, approximately 51 percent of the world is urban and 49 percent is rural. Urban areas ranging from just a few thousand residents to under 500,000 residents account for 27 percent of the world’s population, which constitutes a majority of its urban population. Among the larger urban areas, megacities (10,000,000 and larger) and the urban areas with between 1 million people and 2.5 million people each for approximately 6 percent of the world population. The other larger categories of urban areas each account for approximately 4 percent of the world’s population (Figure 5).

    The McKinsey Global Institute recently reported that the world’s megacities were growing less quickly than the other large urban areas. This development, along with the distribution of world urban population may indicate that world’s largest urban areas, especially the megacities, may not be the wave of the future; instead it may be smaller urbanized regions between 500,000 and 10 million.  These regions, with three times the population of the megacities, will likely shape urbanity over the next few decades.

    —————-

    Note 1: An urban area is an urban agglomeration or an urban footprint (area of continuous development). An urban area is the organism of the “city” in its spatial dimension. Census authorities in a number of nations have adopted similar definitions for urban areas (Examples are United States, Canada, United Kingdom, France, Norway, Sweden and Australia). Demographia World Urban Areas uses national census bureau data for both population and land area estimates where it is available and estimates urban land area from satellite imagery for all others.

    Note 2: for the purposes of this analysis, higher income urban areas are generally in nations with a gross domestic product of $20,000 per capita, purchasing power parity.

    Note 3: The urban area population estimates of Seoul-Incheon, Jakarta and Manila are considerably of love those reported by the United Nations. The United Nations data for these urban areas is based upon a far smaller definition of urbanization than is used in other urban areas. As additional explanatory notes are found in Demographia World Urban Areas.

    Photo: India Gate, Delhi (by author)

    Wendell Cox is a Visiting Professor, Conservatoire National des Arts et Metiers, Paris and the author of “War on the Dream: How Anti-Sprawl Policy Threatens the Quality of Life

  • Is The Information Industry Reviving Economies?

    For nearly a generation, the information sector, which comprises everything from media and data processing to internet-related businesses, has been ballyhooed as a key driver for both national and regional economic growth. In the 1990s economist Michael Mandell predicted cutting-edge industries like high-tech would create 2.8 million new jobs over 10 years.  This turned out to be something of a pipe dream. According to a recent 2010 New America Foundation report, the information industry shed 68,000 jobs in the past decade.

    Yet this year, information-related employment finally appears to be on the upswing, according to statistics compiled by Pepperdine University economist Michael Shires. The impact of this growth is particularly marked in such long-time tech hot beds as Huntsville, Ala., Madison, Wis., and San Jose-Sunnyvale-Santa Clara, Calif., in the heart of Silicon Valley, all of which have relatively high concentrations of such jobs.

    The San Jose area, home of Silicon Valley, arguably has benefited the most from the  information job surge. Much of this gain can be traced to the increase in social networking sites such as Facebook, LinkedIn and Twitter, all of which have been incubated in the Valley. Good times among corporations  have led many to invest heavily in software productivity tools, while those marketing consumer goods have boosted spending for software and internet-related advertising.

    The 5,000 mostly well-paying information jobs added this year was enough to boost San Jose’s standing overall among all big metros 20 places to a healthy No. 27 in our ranking of the best cities for jobs.

    But as economists enthuse over the tech surge, we need to note the limitations of information jobs even in the Valley. Software and internet jobs, which have increased 40% over the past decade, have not come close to making up for the region’s large declines in other fields, notably manufacturing, construction, business and financial services. Overall, the region has lost 18% of its jobs in the past decade — about 190,000 — the second-worst performance, after Detroit, among the nation’s largest metros. It still suffers unemployment of close to 10%, well above the national average of 9.0%.

    This dual reality can also be seen in the local real estate industry. Office vacancies may be back in the low single digits in some markets popular with social networking firms, such as Mountain View, but they remain around 14 or higher throughout the region — 40% higher than in 2008. No matter how impressive reporters find a new headquarters for high-fliers like Facebook, the surplus of redundant space, particularly in the southern parts of the Valley, suggest we are still far from a 1990s style boom.

    Some observers also warn that the long-term prospects for the Valley may not be as good as local boosters assume.  Analyst Tamara Carleton cites many long-term factors — like the financial condition of local cities and diminishing prospects for less skilled workers — that make it tougher on those who live below the higher elevations of the information economy. She also says that a precipitous decline in foreign immigration could slow future innovation.

    This dichotomy is even more evident in the other big information gainer among our large cities, Los Angeles. Although it is little known by the media or pundit class, the Big Orange actually boasts the nation’s single largest number of information jobs. Its over 5% growth in information jobs translates to roughly 10,000 new positions over the past year. In LA, the big sector for information jobs is likely not social media but traditional entertainment, one of the area’s core industries.

    Yet information growth clearly is not bailing out the overall economy. Other much larger sectors, such as manufacturing and business services, continue to shrink. The area still suffers from an unemployment rate of roughly 12%.

    Other information winners among our large metros include Boston and Seattle, both traditional centers for software-related jobs. These areas have not been as hard-hit by the real estate and industrial declines as their California counterparts, so increasing information employment does not constitute the outlier that we see in the Golden State.

    Less expected gains were notched by some of our other big information sector winners. One big surprise was New Orleans-Metairie-Kenner, whose information sector, including a growing film and television industry, expanded almost 39% in past year. As is the case with its strong overall rankings in our best cities survey, the Big Easy’s comeback from the devastation of Katrina is heartening. But we must curb our enthusiasm by pointing out that total regional employment remains 100,000 less than it was before the hurricane.

    Equally intriguing has been the strong performance of Warren-Troy-Farmington, Hills, Mich., and Detroit-Livonia, each of which has benefited from the resurgence of the American auto industry. In these areas, information jobs tend to be tied to the needs of large industrial companies. The state has also waged a major campaign for film and television jobs, as part of an attempt to diversify its economy.

    Yet for all the hype that surrounds industries like media and software, it’s critical to point out that overall this is not a huge employment sector. Even in Seattle — home to Microsoft, Amazon and other software based companies — information jobs account for barely 6% of the total. In Los Angeles, it’s 5%, compared with 10% each for manufacturing and hospitality. In media-centric New York, information accounts for barely 4% of jobs, less than half that of financial services and one-third that of the huge business service sector.

    In most other areas, including those experiencing strong growth, information jobs constitute an even smaller part of the economy. In New Orleans, Warren, Mich., and Detroit, such jobs account for less than 2% of employment . Still, the growth of this sector is a promising one for  economies that have long been dominated, like New Orleans, by the generally low-paying hospitality industry, or in the case of the Michigan cities, the volatile and often chronically hurting manufacturing sector.

    The increase in information jobs, however welcome, should not be sold as a universal elixir for  creating widespread prosperity. Over time, strong regional economies are those that rely on diverse employment sources rather than one.  Growth in high-tech and media jobs can wow impressionable reporters and earn economic developers bragging reights, but they can do only so much to lessen the recession’s impact on the vast majority of workers and the broader regional economy.

    Top Cities for Information Job Growth, 2009-2010
    New Orleans-Metairie-Kenner, LA 38.86%
    Honolulu, HI 25.11%
    Shreveport-Bossier City, LA 18.85%
    Huntsville, AL 14.71%
    Leominster-Fitchburg-Gardner, MA  13.33%
    Redding, CA 10.53%
    Madison, WI 10.20%
    San Jose-Sunnyvale-Santa Clara, CA 10.01%
    Grand Rapids-Wyoming, MI 7.63%
    Providence-Fall River-Warwick, RI-MA 6.33%
    Top Big Cities for Information Job Growth, 2009-2010
    New Orleans-Metairie-Kenner, LA 38.86%
    San Jose-Sunnyvale-Santa Clara, CA 10.01%
    Providence-Fall River-Warwick, RI-MA 6.33%
    Los Angeles-Long Beach-Glendale, CA  5.08%
    Warren-Troy-Farmington Hills, MI  3.97%
    Boston-Cambridge-Quincy, MA  3.54%
    Riverside-San Bernardino-Ontario, CA 3.46%
    Charlotte-Gastonia-Rock Hill, NC-SC 3.02%
    Detroit-Livonia-Dearborn, MI  2.48%
    Seattle-Bellevue-Everett, WA  1.47%

    Joel Kotkin is executive editor of NewGeography.com and is a distinguished presidential fellow in urban futures at Chapman University, and an adjunct fellow of the Legatum Institute in London. He is author of The City: A Global History. His newest book is The Next Hundred Million: America in 2050, released in February, 2010.

    Photo by Angelo Amboldi