In these hard times the New Zealand public is somewhat excited about the travel costs incurred by our Government Ministers and MPs. Overseas travel attracts particular rage and fury.
A particularly galling example is a proposal by Christchurch City Mayor Bob Parker, his CEO Tony Marryat, and an urban planner, to visit the US to investigate the performance of light rail in Los Angeles, San Francisco Bay Area, Seattle and Vancouver.
These cities seem unlikely to provide any relevant information, if only because their populations are many times those of Christchurch, a metropolis of roughly 370,000 and a downtown population of a mere 8000. In comparison:
- Los Angeles – 13.8 million
- San Francisco/San Jose – 5.3 million
- Seattle – 3.3 million
- Vancouver – 2.1 million
The reason the Christchurch team cannot investigate a rail system in the US serving a metropolitan area of only some 350,000 people, and with a CBD of only 8,000 people, may be that because so far, at least, even the most enthusiastic Smart Growth planners in the US are not that silly.
Randal O’Toole, who has made many studies of urban rail systems, points out in “Unlivable Strategies” that spending money on expensive forms of rail transit is fundamentally inefficient because other transportation systems cost far less to build.
Light rail, he argues, has become popular in the United States precisely because it is expensive. Congress gives transit grants to cities on a first-come, first-served basis. So the cities that build the most expensive transit systems get the largest share of federal transit funding.
Naturally, dozens of cities are in line to get their share of the pork.
But that does not prove that light rail is worthwhile. Too many cities have built expensive rail lines and then found that, due to overruns, high operations and maintenance costs, or heavy mortgages, they have to cut back bus service. The result is that rail construction has actually led to reduced transit ridership in many, if not most, cases.
The Grand Tour: My Version
Los Angeles and San Francisco Bay
Here is what the Christchurch Mayor and his team should learn from their visits to the Los Angeles and San Francisco Bay.
- Los Angeles reinforces the Portland experience (a much smaller city) where cost overruns forced Portland to raise bus fares and cut bus service during construction of its first light-rail line in the 1980s. As a result, a smaller proportion of Portlanders ride transit to work and other places today than did so in 1980. A similar situation in Los Angeles led to a 17 percent decline in transit ridership between 1985 and 1995. The NAACP sued the transit agency for cutting bus service in low-income neighborhoods while building rail to middle-class neighborhoods. The suit forced the agency to scale back its rail plans and restore bus service, which led to a recovery of ridership.
- In the San Francisco Bay Area, due to heavy rail debt, San Jose was forced to drastically cut bus and rail service in 2001 and lost 35 percent of its riders. The transit system had to make further cuts in 2007.
Furthermore, despite (or because of) several extensions of the BART line, transit ridership in the San Francisco Bay Area has fallen by more than 10 percent since 1982. Several transit advocacy groups, including the Sierra Club (Piper, 2004), the Bay Area Transportation and Land Use Coalition (BATLUC, 2003), and the Bay Rail Alliance (Carpenter, 2007), actively oppose a proposed extension of BART to San Jose because they know investments in other forms of transit are much more cost effective.
Overall, US urban areas with rail transit have not fared as well as areas with bus transit. Between 1990 and 2000, the number of people in regions with rail transit who commute to work by transit actually declined, while the number in regions with bus-only transit systems increased.
The saddest part of these stories is that the people who lose tend to be those most dependent on transit due to low incomes or an inability to drive, while the people who end up riding rail lines tend to have higher incomes and plenty of auto-mobility. (Winston and Shirley, 1998, p. 9).
Rail transit actually represents a transfer of resource from the poor to the well-off – Robin Hood at work in reverse gear.
Seattle
After getting voter approval for rail transit in 1996, Sound Transit began operating 31 miles of commuter rail service between Tacoma and Seattle in 1999. It also built a 1.6-mile streetcar line in downtown Tacoma at a cost of $50 million a mile, a third more than planned. As of December, 2003, Sound Transit also operates a 35-mile commuter rail line from Everett to Seattle.
Sound Transit’s Seattle-Tacoma commuter-rail line is one of the least productive in the nation, carrying less than one seventh as many passenger miles per route mile as the average commuter-rail line. As a result it has one of the highest operating costs per trip or per passenger mile of any commuter rail line. Despite starting out with free service, the Everett line has been running more than 70 percent empty.
Transit’s growth in travel and market share is almost entirely due to bus transit, not rail transit. But the growth in the region’s congestion is due to decisions made early in the decade to concentrate on rail transit rather than highway construction. Those decisions have harmed Seattle area residents in many ways, including cost overruns, congestion, transit’s cost ineffectiveness, and housing prices.
Future plans: The Sound Transit agency originally projected that the cost of building a 24-mile light-rail line from the Seattle-Tacoma airport to the University of Washington and Northgate would be $2.4 billion. Shortly after receiving voter approval, the agency increased this estimate to $3.6 billion.
After many stops and starts, last year voters endorsed an $18 billion Sound Transit plan for a 53 mile network which they hope will attract 25,000 daily riders by 2030.
Our Christchurch team should learn from the Seattle story that, once embarked upon, these rail plans tend to eat ever increasing amounts of money.
Vancouver
We can only wish them luck on getting useful information out of Vancouver. There seem to be no collections of the statistics on the performance of the transit systems as are available to US researchers here and here (Excel files).
However, we do note that in 2008 the operating cost of the Translink Sky Trains was C$773,737,000 and this was ‘covered’ by C$359,911,000 of fares and advertising, $262,298,000 motor fuel taxes,$255,741,000 property tax, parking site taxes $8,758,000 and others of $33,313,000.
So the transfers from motorists and property owners are greater than the fare revenues.
In 2008 the Long-term debt was C$1,822.7 million.
Grand Plans
Christchurch Mayor and his team are presumably looking at these rail systems as a means of supporting their Smart Growth plans for the Greater Christchurch area.
If the Mayor and his team ask the right questions, and collect the right data, it will be evident to Blind Freddy’s dog that if these boondoggle systems have failed in these major cities, with their major concentrations of employment, then there is no way that light rail can provide a cost effective and efficient service to Christchurch and its environs.
Sorry about that. Enjoy the trip.
Owen McShane is Director of the Centre for Resource Management Studies, New Zealand.
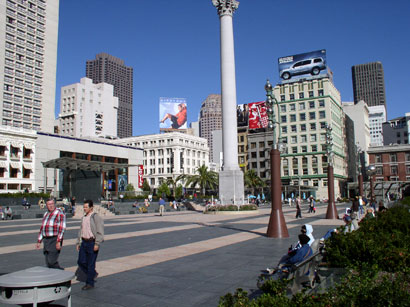 Union Square, San Francisco – Despite an expensive redesign nearly five years ago, Union Square is still not the central urban gathering space for San Francisco. Although it does serve as an incidental focus of pedestrian activity within the immediate neighborhood, the primarily hardscaped design is too fussy and too formal to encourage casual passive use and extended stays, except, perhaps, within limited zones at the fringes. The little available seating is poorly designed, intended to prevent homeless use rather than to promote use by casual park visitors. Primarily a concrete space with grass at the corners, Union Square lacks the “warmth” that makes such spaces comfortable. Imagine a Union Square with a great lawn in the middle, rather than cold (and expensive) hardscape.
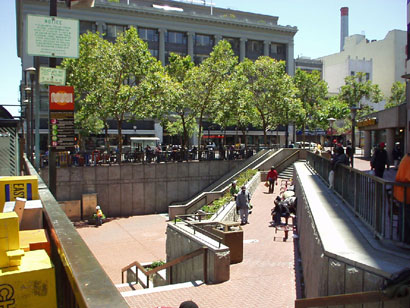 Market Street, San Francisco – Punctuated by intermittent triangular plazas along most of its downtown stretches, portions of Market Street’s public space are more the domain of homeless panhandlers than workers, residents, strollers, and the like (it should be noted, however, that some parts of Market Street, such as in the Financial District, can be pleasant at times). The plazas, quality architecture, and mix of uses create potential. But the pedestrian environment discourages extended dwell times, except by the homeless, panhandlers and drug dealers, many of whom, the city has documented, commute daily to Market Street from elsewhere in the Bay Area. The design offers little in the way of seating options and softscape. Sanitation and maintenance need to be substantially upgraded and programming is needed.
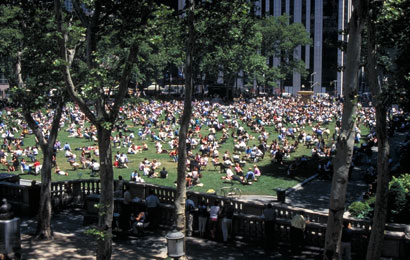 Proper seating, adequate lighting, and extensive horticultural displays would serve to populate these public spaces. Proper management and maintenance would ensure long-term success. Places such as Bryant Park in Midtown Manhattan, itself the beneficiary of a remarkable turnaround masterminded by Daniel Biederman of the Bryant Park Restoration Corporation, have shown what visionary management can do to struggling urban public spaces. [Kozloff worked for BRV Corp., Biederman’s private consulting company that is independent of the Bryant Park Restoration Corporation, from 2001-2004.] Although once run on a city budget of $200,000, Bryant Park is now managed on a privately-funded budget. Biederman turned Bryant Park – once the domain of drug dealers and other such undesirables – into Manhattan’s premier address without using public coffers.
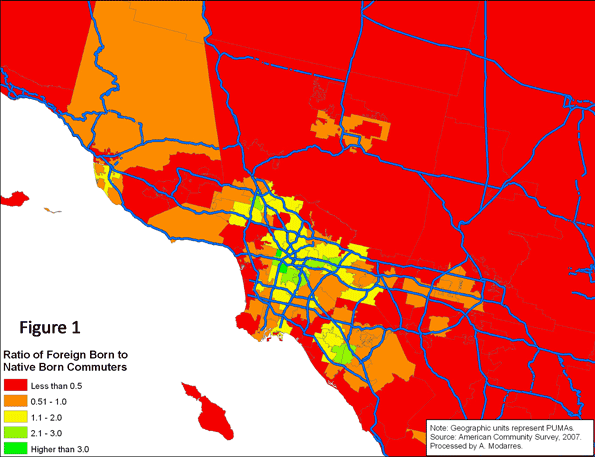
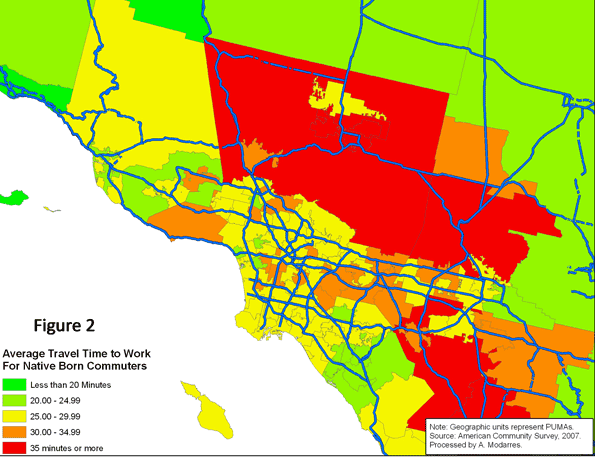
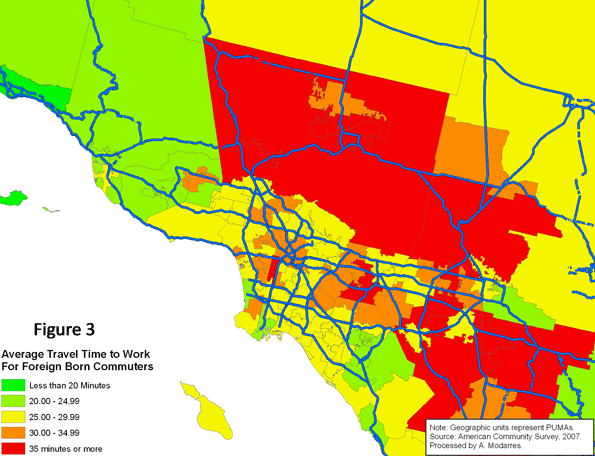
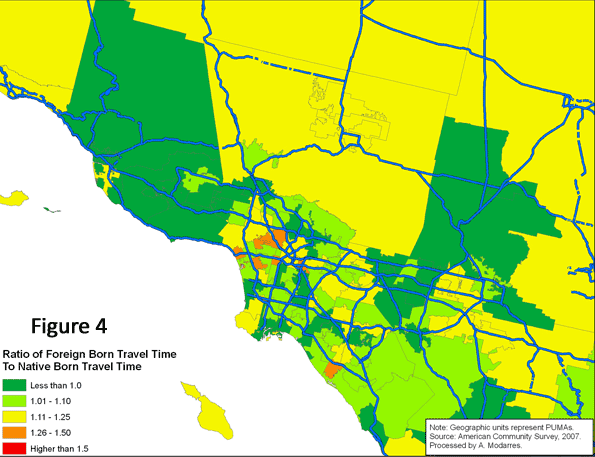
 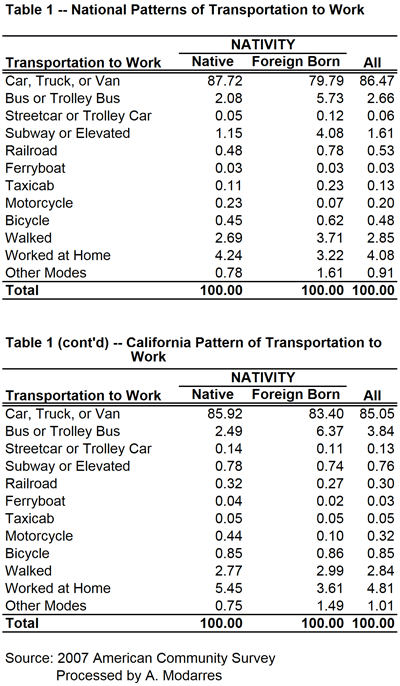 Based on the 2007 American Community Survey, 117.3 million native-born and 21.9 million foreign-born individuals commuted to work. As Table (1) illustrates, a higher percentage of immigrants rode buses (5.7% vs. 2.1%) and subways (4.1% vs. 1.2%) and many walked to work (3.7% vs. 2.7%). A much smaller percentage drove to work (79.8% vs. 87.7%). Unfortunately, despite their higher usage of alternate means of transportation to work, or perhaps because of it, the commute to work time was on average longer for the foreign-born commuters than their native-born counterparts (28.8 minutes versus 24.7).
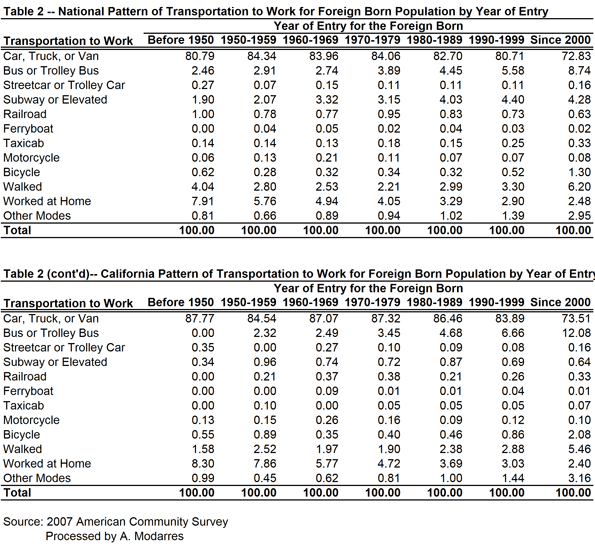
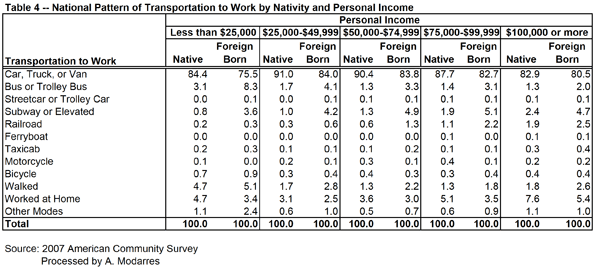
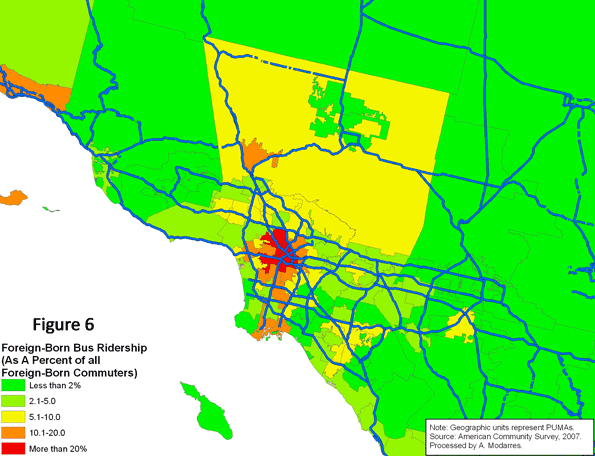
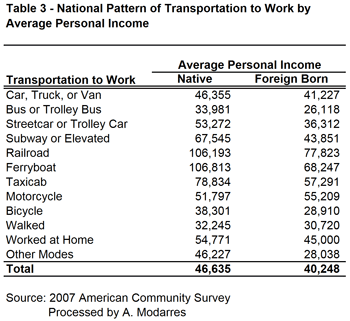 Even so, their rates are still slightly better than the native-born (compare Tables 1 and 2). This may be in part because of their lower incomes (see Table 3) yet at every level of income they are still more likely to take transit. Table (4) illustrates this point by grouping commuters into income categories and their nativity. In every income category, immigrants use their cars less and are more likely to use public transportation, even though their car ridership increases with income.