Tag: Los Angeles

  • Just How Much has Los Angeles Transit Ridership Fallen?

    Los Angeles transit ridership has fallen even more than a recent Los Angeles Times front page story indicated, according to Thomas A. Rubin, who served as Chief Financial Officer (auditor/controller) of the Southern California Rapid Transit District (SCRTD) from 1989 until 1993, SCRTD merged with the Los Angeles County Transportation Commission (LACTC) after the first new rail line was opened in the early 1990s (I served as a city of Los Angeles appointee to the board of LACTC).

    It is not that the Times misreported the story, but rather that the official data it used does not fully account for important underlying ridership data.

    Rubin’s analysis, (available here), responds to a commentary by Ethan Elkind who criticized the Los Angeles Times article for providing a misleadingly pessimistic ridership picture. Rubin shows that, in fact, a closer look at the data suggests things are even worse that suggested by the Times.

    Rubin provides compelling evidence refuting the Elkind commentary (discussed below), as well as more detailed ridership issues that require deeper analysis. Tom Rubin is among the nation’s most knowledgeable transit advocates) and his commentary provides far more information than is summarized in this article. Rubin’s commentary is necessary reading for anyone seriously interested in the history of transit in the new rail era (since 1980).

    Passenger Journeys v. Linked Trips

    Transit ridership statistics in the United States nearly exclusively rely on the concept of unlinked trips. An unlinked trip occurs every time a passenger enters a transit vehicle. Thus, if a rider takes one bus and then transfers to another bus to complete a trip, this single passenger journey counts as two unlink trips. Or, if a passenger starts the journey on the bus, transfers to a rail line, then transfers to another rail line and finally to a bus, this single passenger journey will count as four unlinked trips. So, when comparing transit ridership in the United States, it is important to keep in mind that unlinked trips, rather than passenger journeys are being counted.

    It is worth noting, that in some other countries, officials have found it relatively easy to count passenger journeys. For example, most large European transit systems count passenger journeys and thus do not report the inflated ridership figures that occur as a result of countingtransfers on a single trip.

    As Rubin points out, transfer ratios vary significantly between systems. Further, transfer ratios tend to increase as transit agencies open rail systems. As new rail lines are opened, bus routes are often truncated as agencies attempt to force more ridership on to the rail system. This means that the number of transfers increases. Data that Rubin provides indicates that the linked trip to passenger journey ratio on the former SCRTD/MTA transit system has risen from 1.66 linked trips per passenger journey in the early 1990s to 2.25 in the most recent surveys . Rubin also notes that some surveys have shown even higher transfer ratios in recent years. He uses the 2.25 transfer ratio to obtain the most conservative possible estimate of 2015 passenger journeys.

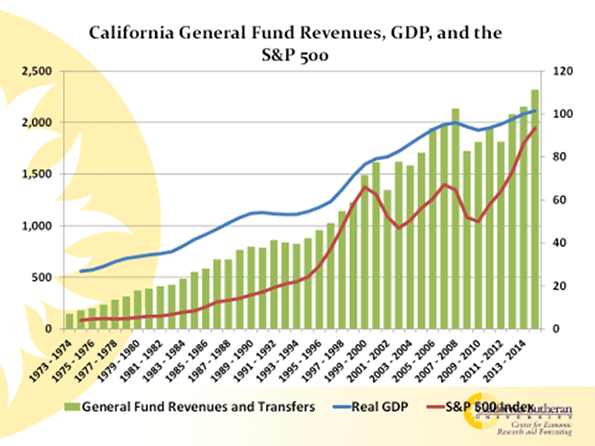
    According to the unlinked trips data reported by the Los Angeles Times, transit ridership on the SCRTD/MTA transit system declined nearly 10 percent from 1985 to 2015, despite the addition of billions of dollars worth of new rail lines. Taking Rubin’s estimate of passenger journeys based on the change in transfer rate (from 1.66 to 2.25 unlinked trips per passenger journey), the drop would be even greater, at a loss of more than 30 percent. Passenger journeys, using these ratios, would have been approximately 290 million in 1985 and 200 million in 2015 (Figure 1).

    Billions for What?
    Rubin has provided important research in his analysis of rail construction costs. Over the past 30 years. Rubin estimates that approximately $16.4 billion dollars (2016$) has been spent to build the routes that are already in service (including the Orange Line busway, but not the Silver Line busway, which he does not include) Elkind implies that this is not enough to see a “true return” on investment.

    With all the huzzahs about the rail system having made transit “the next great mass-transit city,” and the near universal praise for the rail system among the “powers that be” in Los Angeles, the Times is to be commended for courageously revealing the billions that have been spent while millions have abandoned transit, as SCRTD/MTA have placed a priority on expanding the rail services. Rubin also shows that another $9.0 billion is expected to be spent on new lines that will be opened by 2023.

    How Much is a Rail Rider Worth?

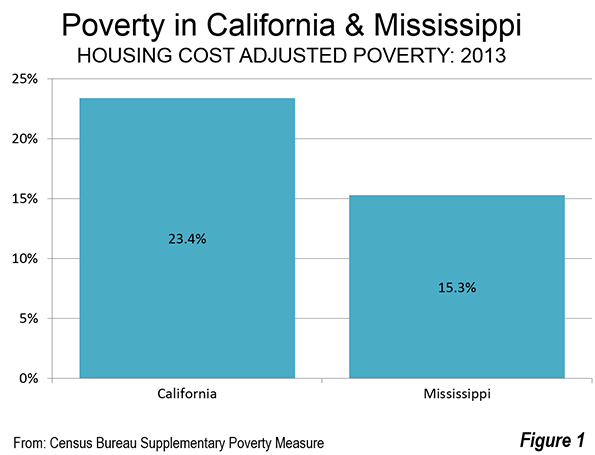
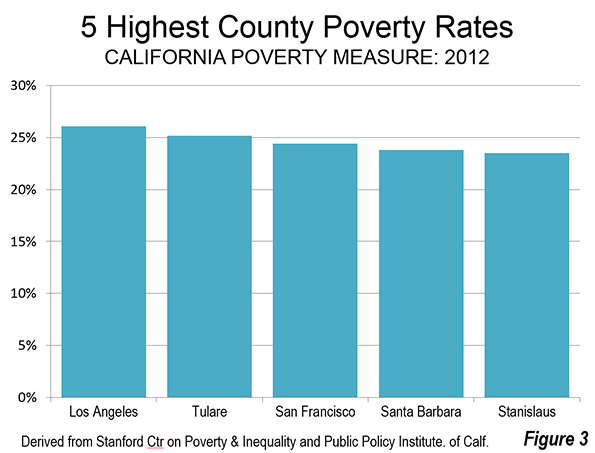
    Rubin was a principal actor in a civil rights lawsuit that forced MTA to reduce its rail spending and increase in spending on buses and lower fares after ridership had fallen about 120 million from its 1985 peak. During the period that the court oversaw MTA, was forced to add more bus service and lower bus pass prices. Rubin shows that during the period of rising ridership, from 1994 to 2007, unlinked trips nearly recovered to the 1985 peak. The ridership increase required a subsidy of $1.40 to add each new bus rider and $25.82 for each new rail rider (Figure 2). This suggests that a new rail rider is valued at nearly 20 times that of a new bus rider. This illustrates that it is far less expensive to increase ridership in Los Angeles with lower bus fares than with rail lines. It is also far more helpful to, Los Angeles transit riders, whose median income is well below that of transit riders nationally, and who need better access to jobs for the higher standard of living they seek (Figure 3).

    What About the Base Year

    Elkind suggests that the Los Angeles Times was unfair in comparing 2015 ridership to the peak year of 1985. Rubin does not accept this argument and for good reason. The principal purpose of the rail system was to increase ridership and any other outcome was, frankly, beyond the pale. The opening of 10 new rail and busway corridors is more than sufficient to have a significant increased ridership, which, as both Rubin and the Times shows, they have not (Note).

    As author of the rail funding amendment to Proposition A in 1980 that provided virtually all of the local funding for the rail system for a decade, these results fall far short of expectations. If I had doubted the ability of a large rail system to significantly increase transit ridership, I would not have offered the amendment (the only other similar amendment offered that day had already been rejected).

    Further, never in my succeeding five years on LACTC including the two years I served on the Rail Transit Committee did I ever hear another member of the Commission or a member of staff imply that there was any possibility that lower ridership could be the result. Had such a view become dominant, the “plug would probably have been pulled,” and the bus system maintained and improved. If so,  transit would be carrying many more people today, while delivering value for taxpayers.

    Photograph: John Ferraro Building, which hosted LACTC board meetings during my tenure. Los Angeles City Council President John Ferraro was the first chair of LACTC.

    Note: Each downtown oriented corridor counts as one (so that, for example, the Gold Line, which enters downtown from two directions is counted as two). Lines that do not reach downtown are counted as one.

    Wendell Cox was appointed to three terms on the Los Angeles County Transportation Commission by Los Angeles Mayor Tom Bradley. The LACTC board consisted of the Mayors of Los Angeles and Long Beach, two smaller city majors, the five county supervisors (county commissioners) and two other appointees of the Mayor of Los Angeles. Mayor Bradley routinely appointed the City Council President to fill one of these two seats as well as a private citizen (Wendell Cox). Wendell Cox chaired the Service Coordination Committee and also served on the Rail Transit and Finance Review Committees.

  • Super Bowl: Super Subsidy Sunday

    Imagine what it would cost to fly from New York to Los Angeles if the country tolerated a National Airline League? Answer: about what a “personal seat license” will cost at the new City of Champions Stadium in Los Angeles, say $28,000.

    In the latest shifting of NFL deckchairs, the League raided St. Louis, San Diego, and Oakland — cities that need things to cheer about — and told team owners that they are free to move to Los Angeles, the city of tomorrow, because of its willingness, today, to chip in on the construction of a $2.66 billion stadium in Inglewood, a city within Los Angeles, for the Rams and possibly the Chargers. Around the opulent new stadium the league will even have an NFL campus, maybe for all those ‘communications majors’ who play in the game?

    Rather than take subsides on its construction bonds, the new LA stadium prefers to limit its local taxes until “costs are amortized.” That way it can boast: “No tax dollars or public funding will be used for the construction of the City of Champions Revitalization Project, including the new stadium.” The operative phrase is “for the construction.” Afterwards, the football depletion allowance will kick in, big-time.

    The reason that the National Football League can move around its franchises is because Congress, in the Sports Broadcasting Act of 1961, deemed professional football a sacred national resource and conferred an exemption from anti-trust rules on the manufacturers of professional football.

    Instead of running a sport where there is no limit on teams or competition, the NFL is the pigskin equivalent of OPEC, and its main function isn’t to govern a league of competitive teams, but to protect monopoly pricing and practices.

    The National Football League runs on backhand payments to athletic organizations, sweetheart contracts, and monopoly pricing, in addition to screwing over its fan base by moving teams around. Its reward for urban price fixing isn’t prosecution for collusion under antitrust laws (it is exempt). Instead, it is awarded a national day of reverence, Super Sunday, during which 30 seconds of ad time costs $5 million, and the strategic national stockpile of guacamole is severely threatened.

    The owners don’t actually own teams, but are general partners in a football trust, which allows them to share equally in all television revenues and collectively ‘bargain’ with concussed players, who are only free agents after five years of indentured service. By then, most are broken men. The league’s attitude toward the declining mental of health of its retired players could be summarized as “So sue me”.

    Yes, a few stars make big money, for a while, but teams are rarely on the hook for long-term guaranteed contracts and salaries are “capped,” they say, “in the interest of competition.”

    Although NFL teams wave the flags of their home cities (best understood as their allocated captive markets), hometown fans have no sway over their local teams, which can pack up their pads in the night and move, as long as the new location is authorized by the League.

    Nevertheless, St. Louis will still get the pleasure of paying off $100 million in outstanding debt on the Rams’ Edward Jones stadium, even though the team will be playing in LA.

    What keeps NFL teams constantly on the move? Promises of state and city subsidies for new, multibillion stadiums, and then the granting of nearly all local revenues to the owner.

    The new Santa Clara stadium, home to the hype of Super Bowl 50, has $950 million in hidden public finance, even though while the deal was being made the city was laying off teachers and firefighters.

    According to Stadium Subsidy Trickle-Down Economic Theory, a new NFL stadium helps to ‘revitalize’ some downtrodden city. In reality, stadiums add little to urban life other than mountains of debt and part-time jobs for Sunday ushers and parking lot attendants.

    The reason that NFL teams do little for their home cities is that the league’s economic model is akin to strip mining or wildcat drilling. Unlike coal or natural gas, though, the price of the harvested commodity is controlled at the league’s head office, although still for the benefit of absentee landlords. National revenues are shared, while local revenues flow into the pockets of the team’s owner, often a billionaire.

    If, instead of a football trust, the US had an open market for gridiron services, when there was a demand in a growing city for a pro team tryouts would be held for players, and shareholders would gather to invest in the new franchise. Maybe when the franchise got good enough, it could compete with more established teams.

    Think about it: if the city of Green Bay (population about 104,000) can support a championship team which is owned by the fans, it means that there are 278 larger cities in the country that could well duplicate its model and host professional football. Instead, only 31 other cities have pro teams, thanks to the league’s attitude toward parity and level playing fields. Metropolitan areas with populations greater than two million that don’t have a team include San Antonio, Las Vegas, Portland (Oregon), and Orlando, St. Louis and, possibly soon, San Diego and Oakland. Many other large American cities could easily support three or four professional teams.

    All that these outlier cities can do to get a franchise is to promise the NFL ownership monopoly stadium subsidies and political tolerance for continuing the anti-trust exemption. Cities that want to keep their teams (such as San Diego) can pay ransom money in the form of a new, subsidized stadium and other favors. Challenge this payoff system and the league will vote away your team faster than you can say antidisestablishmentarianism.

    The irony of Los Angeles now becoming the holy grail of two, or even three football teams is that, in the past, the city has had several franchises —ironically, the Rams, Chargers, and Raiders — and all left because the fan base preferred the beach and the Lakers to Sunday afternoons in the archaic LA Memorial Coliseum.

    What has changed since Sid Gilman coached the Los Angeles Chargers in 1960 is that shared NFL television contracts make it irrelevant whether fans show up or not for the in-studio fan game experience, although generally most stadiums sell out.

    What of the cities that have ransomed their future to an NFL team? How have they fared? Just because Forbes Magazine values pro football franchises at between $2 and $3 billion does not mean that the citizenry sees much benefit from having a team.

    For example, the Hackensack Meadowlands Giants are now said to be worth $2.8 billion, but New Jersey taxpayers are still paying interest on the old Giants Stadium, where the end zone was rumored to be Jimmy Hoffa’s resting place, and which was torn down so that a new stadium could be built in its place (“without public money”).

    Most cities get a paltry rental stream from their subsidized ballparks, and that’s it. From the Seahawks, owned by Microsoft bigwig Paul Allen, Seattle gets $1 million a year in stadium rental income, while the team rakes in more than $200 million. And state taxpayers are on the hook for some $300 million in outstanding CenturyLink stadium bonds. (The 12th man abides.)

    No wonder Allen’s $160 million yacht has been out tearing up the coral reefs of the Caribbean. Even to Hoffa, that red zone opportunity would be worth some dabbin’.

    Matthew Stevenson, a contributing editor of Harper’s Magazine, is the author most recently of Remembering the Twentieth Century Limited, a collection of historical travel essays, and Whistle-Stopping America. His next book, Reading the Rails, will be published in 2016. He went to his first professional football game in 1960, and saw the New York Titans plays the Dallas Texans. He lives in Switzerland.

    Flickr photo by Mike Morbeck: Cam Newton of the Carolina Panthers

  • Los Angeles: City Of Losers?

    When I arrived in Los Angeles four decades ago, it was clearly a city on the rise, practicing its lines on the way to becoming the dominant metropolis in North America. Today, the City of Angels and much of Southern California lag behind not only a resurgent New York City, but also L.A.’s longtime regional rival, San Francisco, both demographically and economically.

    Forty years ago, San Francisco was a quirky, backward-looking town, a haven for the gilded rich and hippies, a quaint but increasingly insignificant town. The Dodgers and the Lakers ruled the California sporting world.

    Today things couldn’t be more different. San Francisco and its much bigger southerly neighbor, Silicon Valley, have morphed into the global epicenter of the technology industry, with 25 tech companies on the Fortune 500. In contrast, Los Angeles County, which has almost twice as many people, is home to only 15 Fortune 500 firms total.

    Meanwhile, the Giants and the Golden State Warriors have become consistent winners while the Dodgers, Angels and Clippers disappoint and the Lakers are painfully unwatchable.

    Although there is a desire to repeat L.A.’s success with the 1984 Olympics and bring football back to town, that would only put a happy veneer over the city’s core problem: the long-term decline of its business sector. In 1984, the city had a strong and highly motivated business elite highlighted by 12 Fortune 500 companies, who could help sponsor the games and provide management expertise. Now there are only three within city limits, with the departure of major corporations such as Lockheed, Northrop Grumman, Occidental Petroleum and Toyota, and the loss of hundreds of thousands of manufacturing jobs.

    In contrast, the Bay Area is full of thriving companies and successful entrepreneurs, many of them astoundingly young. Of the 30 richest people in the country, five live in the Bay Area; Southern California has only one, the Irvine Company visionary Chairman Donald Bren, and he’s in his eighties. The Bay Area accounts for the vast majority of American billionaires under 40; if not for Snapchat’s founders, Evan Spiegel and Bobby Murphy, as well Elon Musk, who lives in L.A. but spends much of his time working in Northern California, where Tesla and Solar City are located, L.A. would be off the list.

    This unfavorable contrast with the Bay Area, sadly, is not just a recent development. Since 1990 Los Angeles County has added a paltry 34,000 jobs while its population has grown 1.2 million. In contrast, the Bay Area, which added roughly the same number of people during the same time, gained a net 500,000 jobs, mostly in the suburbs. In 1990 Los Angeles had around the same number of private-sector jobs per person as the Bay Area, roughly 410 per 1,000; today Los Angeles’ private-sector jobs to population ratio has dropped to 364 per 1,000 while the Bay Area’s has grown to 415. Worse yet, while the Bay Area has increased its share of high-wage jobs to 33 percent since 1990, Los Angeles percentage fell to 27.7 percent.

    How L.A. Blew It In Technology

    As recently as the 1970s, as UCLA’s Michael Storper has pointed out, L.A. stood on the cutting edge not only in hardware, but also software. Computer Sciences Corp. was the first software company to be listed on a national stock exchange. In 1969, UCLA’s Leonard Kleinrock invented the digital packet switch, one of the keys to the Internet.

    In 1970, IT’s share of the economy in greater Los Angeles and in the Bay Area was about the same (in absolute terms it was bigger in L.A.). By 2010, IT’s share was four times bigger in the north than in the south.

    Storper links the decline in large part to the strategies of the biggest high-tech companies in the L.A. area: Lockheed Martin, Rockwell and TRW focused on defense and space, essentially becoming dependent on government spending. In contrast, the Bay Area technology community, although also initially tied to Washington, began to move into more commercial applications. In the process they also developed a huge network of venture capitalists who would continue to help found and finance fledgling firms.

    Today the San Jose area enjoys the highest percentage of workers in STEM (science technology engineering and mathematics-related jobs) in the country, over three times the national average. San Francisco and its immediate environs, largely as a result of the social media boom, now has a location quotient for STEM jobs of 1.75, meaning it has 75% more tech jobs per capita than the national average. In contrast, the Los Angeles area barely makes it to the national average.

    Southern California remains an attractive to place to live, but it’s hard to imagine it as the next Silicon Valley. L.A. had its chance, and, sadly, it blew it.

    The Growing Demographic Crisis

    Storper and other critics suggest that Los Angeles failed in part because it tried to maintain high-wage blue collar industries while the Bay Area focused on information and biotechnology. The problem now, however, are the factors in L.A. that drive industry away, such as ultra-high electricity prices and a high level of regulation. Even amidst the recent industrial boom in many other parts of the country, Los Angeles has continued to lose manufacturing jobs; Los Angeles’ industrial job count stands at 363,900, still the largest number in the nation, but down sharply from 900,000 just a decade ago.

    This decline places L.A in a demographic dilemma. Like the Midwestern states that lured African-American to fill industrial jobs during the Great Migration, L.A. attracted a large number of largely poorly educated immigrants, mostly from Mexico and Central America. These people came for jobs in factories, logistics and home-building, but now find themselves stranded in an economy with little place for them outside low-end services.

    Although inequality and racial disparities also exist in the Bay Area, the issue is far more relevant in Southern California. The Bay Area’s population is increasingly dominated by well-educated Anglos and Asians. San Francisco’s population is 22 percent black or Hispanic; in Los Angeles, this percentage approaches 60 percent.

    Poverty and lack of upward mobility are the biggest threats to the region. In Los Angeles, a recent United Way study found 35 percent of households were “struggling,” essentially living check to check, compared to 24 percent for the Bay Area.

    recent study by the Public Policy Institute of California and the Stanford Center on Poverty and Inequality found that, once adjusted for cost of living, Los Angeles has the highest level of poverty in the state, 26.1 percent. Rents are out of control for many people who are struggling in an increasingly low-wage dominated economy. In fact, Los Angeles now is the least affordable city for renters, based on income, according to a recent UCLA paper.

    Is There A Way Out?

    Despite these myriad challenges, Los Angeles, and indeed all of Southern California, is far from a hopeless case. It is unlikely to become the next Detroit and is better positioned by natural and human resources than it’s similarly troubled big city competitor Chicago. It still enjoys arguably the best climate of any major city in the world, remains the home of Hollywood, the nation’s dominant ports and a still impressive array of hospitals and universities.

    At least some of the city’s leadership has begun to recognize the challenges facing the region. “The city where the future once came to happen,” a devastating blue ribbon report recently intoned, “is living the past and leaving tomorrow to sort itself out.”

    This recognition might be the first step toward a turnaround, but the area really has increasingly little control over its own fate. Today San Francisco and its immediate environs, despite its much smaller population, is home to virtually every powerful politician in the state: both its U.S. Senators, the Governor, the Lieutenant Governor and the Attorney General. Not surprisingly, state policies on everything from greenhouse gases, urban density and transit to social issues follows lines that originate in, and largely benefit, San Francisco.

    Most troubling of all, the local leadership seems clueless about how to resuscitate the economy, or even how this vast region actually operates. Neither another Olympics nor getting a football team or two will make a difference. Even worse is the effort by Mayor Eric Garcetti to densify the city to resemble a sun-baked version of New York.

    This has been part of the agenda for developers, greens and most local academics for the better part of 30 years. But the problem remains: Los Angeles, and even more so its surrounding region, is notNew York, nor can it ever be. It is, and will remain, a car-dominated, multi-polar city for the foreseeable future. After all the vast majority of Southern California’s population growth — roughly 75 percent — came after the Second World War and the demise of the Red Cars, L.A.’s  much lamented pre-war transit system.

    Some outside observers such as progressive blogger Matt Yglesias now envision L.A. as “the next great transit city.” Yet in reality, despite spending $10 billion on new transit projects, the share of transit commuters has actually dropped since 1990; today nearly 31 percent of New York area commuters take public transportation, while 6.9 percent do so in Los Angeles-Orange County.

    People take cars because, for most, it’s the quickest way to work. Few transit trips take less time, door to door than traveling by car, not to mention the convenience of working at home. The average transit rider in Los Angeles spends 48 minutes getting to work, compared to people driving alone, at 27 minutes.

    This reflects L.A.’s great dispersion of employment, which is not compatible with a transit-driven culture. In greater New York, 20 percent of the workforce labors in the central core; in San Francisco, the percentage is roughly 10 percent. But barely 2 percent do so in Los Angeles. The current, much ballyhooed revival of downtown Los Angeles then is less a reflection of economic forces, than the preferences of a relatively small portion of population for a more urban lifestyle and as market for Asian flight capital. Its population of 50,000 is about the same as Sherman Oaks or the recently minted city of Eastvale in the Inland Empire.

    Rather than seek to become someplace else, Los Angeles has to confront its key problems, like its woeful infrastructure, particularly roads, among the worst in the country, and a miserable education system. These are among the likely reasons why people with children are leaving Los Angeles faster than any major region of the country.

    Yet Los Angeles is not without allure. Overall Los Angeles-Orange has grown its ranks of new educated workers between 25 and 34 since 2011 as much as New York and San Francisco and much more than Portland.

    Perhaps most promising is the region’s status as the number one producer of engineers in the country, almost 3,000 annually. This raw material is now being somewhat wasted, with as many as 70 percent leaving town to find work.

    What Los Angeles needs to do is to provide the entrepreneurial opportunities to keep its young at home, particularly the tech oriented. As the Bay Area has shown, it is possible to reshape an economy based on pre-existing strength. For L.A. the best regional strategy would be based on a remarkably diverse economy dominated by smaller firms, a population that, for the most part, seeks out quiet residential neighborhoods and often prefers working closer to home than battling their way to what remains a still unexceptional downtown.

    One place where Los Angeles could shine is in melding the arts and technology. Unlike New York, which has relatively few engineers, Los Angeles still has the largest supply in the country. The Bay Area may be more appealing to nerddom, but is unexceptional in the arts. This revival will not come from the remaining suits in L.A.; roughly half of workers in the arts are self-employed, according to the economic forecasting firm EMSI.

    This entrepreneurial trend will continue since, with the studio system clearly in decline, as large productions go elsewhere, digital players such as Netflix, Amazon, Apple as well as Los Angeles based Hulu have become more important. Los Angeles could expand its arts-related niche by supplying the content that these expanding digital pipelines require.

    Given the corporate exodus, and the difficult California business climate, overall L.A.’s recovery must come from the bottom up, and be dispersed throughout the region. According to Kauffman Foundation research, the L.A. area already has the second highest number of entrepreneurs per 100 people in the country, just slightly behind the Bay Area.

    The next L.A. can succeed, but not by trying to duplicate New York or San Francisco. Instead there’s a need for greater appreciation why so many millions migrated here in the first place: great weather, beaches, suburban-like living and entrepreneurial opportunities. Only when the local leadership rediscovers the uniqueness of L.A.’s DNA can the region undergo the renaissance of this most naturally blessed of places.

    This article first appeared at Forbes.

    Joel Kotkin is executive editor of NewGeography.com and Roger Hobbs Distinguished Fellow in Urban Studies at Chapman University, and a member of the editorial board of the Orange County Register. He is also executive director of the Houston-based Center for Opportunity Urbanism. His newest book, The New Class Conflict is now available at Amazon and Telos Press. He is also author of The City: A Global History and The Next Hundred Million: America in 2050. He lives in Orange County, CA.

    Photo: Downtown Los Angeles toward the Hollywood Hills and the San Fernando Valley (by Wendell Cox)

  • How Commuters Get Railroaded by Cities

    With more than $10 billion already invested, and much more on the way, some now believe that Los Angeles and Southern California are on the way to becoming, in progressive blogger Matt Yglesias’ term, “the next great transit city.” But there’s also reality, something that rarely impinges on debates about public policy in these ideologically driven times.

    Let’s start with the numbers. If L.A. is supposedly becoming a more transit-oriented city, as boosters already suggest, a higher portion of people should be taking buses and trains. Yet, Los Angeles County – with its dense urbanization and ideal weather for walking and taking transit – has seen its share of transit commuting decline, as has the region overall.

    Since 1980, before the start of subway and light-rail construction, the percentage of Angelenos taking transit has actually dropped, from 7.0 percent to 6.9 percent, while the region (including the Inland Empire and Ventura County) has seen the transit share drop from 5.1 percent to 4.7 percent. These reductions in ridership have been experienced both on the rail and bus lines.

    The simple truth is that this region is just not structured to run largely on rails. We should not prioritize our transit dollars on trying to remake our region into something resembling New York, or even San Francisco, but in serving the needs, first and foremost, of those who remain dependent on public transit.

    Read the entire piece at The Orange County Register.

    Joel Kotkin is executive editor of NewGeography.com and Roger Hobbs Distinguished Fellow in Urban Studies at Chapman University, and a member of the editorial board of the Orange County Register. He is also executive director of the Houston-based Center for Opportunity Urbanism. His newest book, The New Class Conflict is now available at Amazon and Telos Press. He is also author of The City: A Global History and The Next Hundred Million: America in 2050. He lives in Orange County, CA.

  • Neither Olympics Nor NFL Will Rescue Los Angeles

    We all tend to have fond memories of our greatest moments, and for Los Angeles, the 1984 Olympics has served as a high point in the city’s ascendency. The fact that those Summer Games were brilliantly run, required relatively little city expenditure and turned a profit confirmed all those things we Angelenos loved about our city – its flexibility and pragmatism and the power of its civic culture.

    After Boston turned down its chance to be the U.S. entrant in the sweepstakes to host the 2024 Olympics, it’s natural that Mayor Eric Garcetti and the city establishment, at least what’s left of it, desire a return engagement. But the Los Angeles of today barely resembles the vibrant, optimistic city of 30 years ago.

    “The city where the future once came to happen,” a devastating report from the establishmentarian Los Angeles 2020 Commission recently intoned, “is living the past and leaving tomorrow to sort itself out.”

    Last Best Chance?

    So rather than a bold move toward establishing the city’s preeminence, the current move smacks more of a Hail Mary pass. It also seems to embody a kind of nostalgia, a sentiment reflected not only in the desire to relive Olympic glory but also in the efforts to bring pro football back to town, including, perhaps, a return of the long-departed Rams.

    Yet ultimately, neither a third Olympics (the first was in 1932) nor the return of NFL football can alter a city’s fate. After all, the 2000 Athens Olympics did not lead to a new Greek renaissance, but may, instead, have contributed to that country’s fiscal morass. Summer Games in Montreal (1976) and Atlanta (1996) did not usher in a golden age for those cities, but periods of decline.

    Read the entire piece at The Orange County Register.

    Joel Kotkin is executive editor of NewGeography.com and Roger Hobbs Distinguished Fellow in Urban Studies at Chapman University, and a member of the editorial board of the Orange County Register. He is also executive director of the Houston-based Center for Opportunity Urbanism. His newest book, The New Class Conflict is now available at Amazon and Telos Press. He is also author of The City: A Global History and The Next Hundred Million: America in 2050. He lives in Orange County, CA.

    Olympic Torch Tower of the Los Angeles Coliseum” by unknown, U.S. Air Force – http://www.defenseimagery.mil; VIRIN: DD-SC-85-08929. Licensed under Public Domain via Wikimedia Commons.

  • When Stocks Drop, California Suffers

    I recently made a couple of tweets/Facebook posts pointing out that market declines threaten California’s budget surplus. I referenced articles in the WSJ and Bloomberg, and I thought the observation was non-controversial—almost banal.

    So I was surprised at the feedback. One person asked why. Another said it doesn’t mean anything until holders of declining assets cash out. Yet another pointed out that the wealthy were back to where they were eight months ago. Finally, one said we wouldn’t know of the impact until after the end of the next budget year.

    Let’s answer the question “Why?” first: A decline in asset prices would have a detrimental impact on California’s budget because California’s tax system is extraordinarily progressive, with the result that a few really wealthy people pay a huge proportion of California’s taxes. California’s Legislative Analyst’s Office has estimated that the top one percent of California’s population paid half of the state’s income taxes in 2012. Income taxes are California’s major revenue source, comprising about 65 percent of the state’s income.

    Since much of wealthy people’s income is from increased asset values—capital gains—rather than from wages that have been paid to them, their income, and thus California’s tax revenue, is more volatile than the economy. California revenue tracks changes in asset values more closely than it tracks changes in economic growth. See the following chart:

    The increased revenues from the dot-com boom, the 2000s asset boom, and today’s boom are readily apparent in the chart. The declines that inevitably follow booms are also apparent.

    California goes through these repeating cycles like a bad dream. Asset prices increase. California’s revenues increase. Sacramento spends that windfall as if asset prices will continue to rise forever. Worse, legislators commit to future spending as if the boom will continue forever.

    Of course, booms don’t go on forever. Inevitably, prices fall. The gains that drive California’s revenue turn into losses, and California faces yet another budget crisis. Sacramento responds by raising taxes on the wealthy, and increasing the state’s reliance on the few wealthy. This pretty much guarantees that the problem will be even worse in the next cycle.

    It’s a self-reinforcing boom and bust cycle of ever increasing revenue volatility.

    It’s amazing to me that California’s leadership continues to do this, and that Californians allow it. It can only be possible because so few Californians understand the state’s finances. The people who responded to me are relatively well informed; far better informed than most Californians. Yet, even they don’t know how California’s revenues work.

    It appears that California’s susceptibility to asset volatility is California’s best kept secret. That needs to change.

    Governor Brown was hailed as a hero when proposition 30 was passed, raising taxes on those who earn over $250,000 a year. It was even retroactive. California’s revenues soared, a result of the combination of new taxes and a huge bull market on Wall Street. It was said that Brown had solved California’s deficit problem. What he really did was sow the seeds of California’s next budget crisis.

    What about the next response I heard, the objection that losses have to be realized before they impact California’s budget? Can we be realistic? The people who pay over half of California’s income taxes have resources that are unimaginable to most of us. You can bet your net worth that, for tax purposes, they recognize losses as quickly as possible and do their best to never realize gains. The gains we’ve seen were only reluctantly recognized. The losses will be enthusiastically recognized.

    The comment about retained wealth—that the wealthy were back to where they were eight months ago—is a red herring. Wealth is irrelevant. Income taxes are paid on changes to wealth, not wealth. And, we don’t have to wait until after the fact, or until the end of the fiscal year, to know what the story will be. We don’t even need a real bust to see California’s surplus slip away. The surplus is dependent on increasing asset values. It’s not necessary for asset prices to decline for the surplus to be eliminated. All that is required is that asset values cease increasing.

    I thought it was irresponsible for people to cheer California’s surplus without at least recognizing its fragility. Ignoring the fragility now, when asset prices are especially volatile, is foolhardy. Our governor and legislators know what will become of California’s surplus when asset prices decline. They should be developing a plan.

    Of course, California’s leadership is not working on a plan. Instead, the best of them (admittedly a low hurdle) continue to pat themselves on the back and hope for the best. Some do worse by attempting to increase California’s spending even more.

    Besides developing a plan to deal with the sure-to-come deficit, Sacramento should be working on a plan to make California’s revenues more closely track broad economic activity, instead of volatile asset prices. This would require a broader tax base and a less progressive income tax. Unfortunately, that’s not likely to happen.

    Bill Watkins is a professor at California Lutheran University and runs the Center for Economic Research and Forecasting, which can be found at clucerf.org.

    Flickr photo by Thomas Hawk: The Good Life; the Ritz Carlton, Laguna Niguel, California.

  • California: “Land of Poverty”

    For decades, California’s housing costs have been racing ahead of incomes, as counties and local governments have imposed restrictive land-use regulations that drove up the price of land and dwellings. This has been documented by both Dartmouth economist William A Fischel and the state Legislative Analyst’s Office.

    Middle income households have been forced to accept lower standards of living while less fortunate have been driven into poverty by the high cost of housing.Housing costs have risen in some markets compared to others that the federal government now publishes alternative poverty estimates (the Supplemental Poverty Measure), because the official poverty measure used for decades does not capture the resulting differentials. The latest figures, for 2013, show California’s housing cost adjusted poverty rate to be 23.4 percent, nearly half again as high as the national average of 15.9 percent.

    Back in the years when the nation had a "California Dream," it would have been inconceivable for things to have gotten so bad — particularly amidst what is widely hailed as a spectacular recovery. The 2013 data shows California to have the worst housing cost adjusted poverty rate among the 50 states and the District of Columbia. But it gets worse. California’s poverty rate is now more than 50 percent higher than Mississippi, which long has set the standard for extreme poverty in the United States (Figure 1).

    The size of the geographic samples used to estimate the housing adjusted poverty rates are not sufficient for the Supplemental Poverty Measure to produce local, county level or metropolitan area estimates. However, a new similar measure makes that possible.

    The California Poverty Measure                           

    The Public Policy Institute of California and the Stanford Center on Poverty and Inequality have collaborated to establish the "California Poverty Measure," which is similar to the Supplemental Poverty Measure adjusted for housing costs.

    The press release announcing release of the first edition (for 2011) said that: "California, often thought of as the land of plenty" in the words Center on Poverty and Inequality director Professor David Grusky, is "in fact the land of poverty."

    The latest California Poverty Measure estimate, for 2012, shows a statewide poverty rate of 21.8 percent, somewhat below the Supplemental Poverty Measure and well above the Official Poverty Measure that does not adjust for housing costs (16.5 percent).

    The California Poverty Measure also provides data for most of California’s 58 counties, with some smaller counties combined due to statistical limitations. This makes it possible to estimate the California Poverty Measure for metropolitan areas, using American Community Survey data.

    Metropolitan Area Estimates

    By far the worst metropolitan area poverty rate was in Los Angeles, at 25.3 percent. The Los Angeles County poverty rate was the highest in the state at 26.1 percent, well above that of Orange County (22.4 percent), which constitutes the balance of the Los Angeles metropolitan area. However, the Orange County rate was higher than that of any other metropolitan area or region in the state (Figure 2). San Diego’s poverty rate was 21.7 percent. Perhaps surprisingly, Riverside-San Bernardino (the Inland Empire), which is generally perceived to have greater poverty, but with lower housing costs, had a rate of 20.9 percent. The two counties, Riverside and San Bernardino had lower poverty rates than all Southern California counties except for Ventura (Oxnard) and Imperial.

    The San Francisco metropolitan area had a poverty rate of 19.4 percent, more than one-fifth below that of Los Angeles. San Jose has a somewhat lower poverty rated 18.3 percent (Note 1). The metropolitan areas making constituting the exurbs of the San Francisco Bay Area had a poverty rate of 18.7 percent. This includes Santa Cruz, Santa Rosa, Stockton and Vallejo. Sacramento had the lowest poverty rate of any major metropolitan area, at 18.2 percent.

    The San Joaquin Valley, stretching from Bakersfield through Fresno to Modesto (Stockton is excluded because it is now a San Francisco Bay Area exurb) had a poverty rate of 21.3 percent, slightly below the state wide average of 21.8 percent. The balance of the state, not included in the metropolitan areas and regions described above had a poverty rate of 21.2 percent.

    County Poverty Rates

    As was noted above, Los Angeles County had the highest 2012 poverty rate in the state (Note 2), according to the California Poverty Measure (26.1 percent). Tulare County, in the San Joaquin Valley had the second-highest rate at 25.2 percent. Somewhat surprisingly, San Francisco County with its reputation for high income had the third worst poverty rate in the state at 23.4 percent. This is driven, at least in part, by San Francisco’s extraordinarily high median house price to household income ratio (median multiple). In this grisly statistic, it trails only Hong Kong, Vancouver and Sydney in the latest Demographia International Housing Affordability Survey. Wealthy Santa Barbara County has the fourth worst poverty rate in the state, at 23.8 percent. The fifth highest poverty rate is in Stanislaus County, in the San Joaquin Valley (county seat Modesto), which is already receiving housing refugees from the San Francisco Bay Area, unable to pay the high prices (Figure 3).

    The two lowest poverty rates were in suburban Sacramento counties (Note 2). Placer County’s rate was 13.2 percent and El Dorado County’s rate was 13.3 percent. Another surprise is Imperial County, which borders Mexico and has generally lower income. Nonetheless, Imperial County has the third lowest poverty rate at 13.4 percent. Shasta County (county seat Redding), located at the north end of the Sacramento Valley is ranked fourth at 14.8 percent. Two counties are tied for the fifth lowest poverty rate (16.0 percent), Marin County in suburban San Francisco and Napa County, in the exurban San Francisco Bay Area (Figure 4).

    Weak Labor Market and Notoriously Expensive Housing

    The original Stanford Center on Poverty and Inequality press release cited California’s dismal poverty rate as resulting from "a weak labor market and California’s notoriously expensive housing." These are problems that can be moderated starting at the top, with the Governor and legislature. The notoriously expensive housing could be addressed by loosening regulations that allow more supply to be built at lower cost. True, the new supply would not be built in Santa Monica or Palo Alto. But additional, lower cost housing on the periphery, whether in Riverside County, the High Desert exurbs of Los Angeles and San Bernardino Counties, the San Francisco Bay Area exurbs or the San Joaquin Valley could begin to remedy the situation.

    The improvement in housing affordability could help to strengthen the weak job market, by attracting both new business investment and households moving from other states.

    Regrettably, Sacramento does not seem to be paying attention. Liberalizing land use regulations is not only absent from the public agenda, but restrictions are being strengthened (especially under the requirements of Senate Bill 375). In this environment, metropolitan areas like Los Angeles, San Francisco, San Jose and San Diego could become even more grotesquely unaffordable, and the already high price to income ratios in the Inland Empire and San Joaquin Valley could worsen. All of this could lead to slower economic growth and to even greater poverty, as more lower-middle-income households fall into poverty.

    Note 1: San Benito County is excluded from the San Jose metropolitan area data. The California Poverty Measure does not report a separate poverty rate for San Benito County.

    Note 2: Among the counties for which specific poverty rates are provided.

    Wendell Cox is Chair, Housing Affordability and Municipal Policy for the Frontier Centre for Public Policy (Canada), is a Senior Fellow of the Center for Opportunity Urbanism (US), a member of the Board of Advisors of the Center for Demographics and Policy at Chapman University (California) and principal of Demographia, an international public policy and demographics firm.

    He is co-author of the "Demographia International Housing Affordability Survey" and author of "Demographia World Urban Areas" and "War on the Dream: How Anti-Sprawl Policy Threatens the Quality of Life." He was appointed to three terms on the Los Angeles County Transportation Commission, where he served with the leading city and county leadership as the only non-elected member. He served as a visiting professor at the Conservatoire National des Arts et Metiers, a national university in Paris.

    Photograph: Great Seal of the State of California by Zscout370 at en.wikipedia [CC BY-SA 3.0], from Wikimedia Commons

  • LA’s Tale of Two Cities

    It’s the best of times and the worst of times in Los Angeles.

    Los Angeles is now attracting notice as a so-called “global city,” one of the world’s elite metropolises. It is ranked #6 in the world by AT Kearney and tied for 10th in a report by the Singapore Civil Service College that I contributed to.  Yet it also has among the highest big city poverty rates in the nation, and was found to be one of the worst places in America for upward mobility among the poor. Newspaper columns are starting to refer to LA as a “third world city.”

    Though the Bay Area gets the headlines, the LA region likes to boast it’s coming on strong in tech.  With a diverse set of marquee names including Snapchat, Tinder, Oculus, and SpaceX, LA’s startup scene continues to grow. But tech growth overall has been middling, ranking 28th out of the country’s sixty-six largest region in information job growth, according to a recent Forbes survey.

    More disturbing, job growth has also been slow, ranking 35th overall, at a time when it’s long time rivals in the Bay Area occupy the top job and tech rankings. Some of this reflects the loss of a key industry, aerospace, but also the departure of major corporations such as Lockheed,  Northrup Grumman, Occidental Petroleum, and Toyota, which has left LA’s once vaunted corporate community but is a shell of its former self.

    Yet LA’s glitz factor remains potent. The fashion industry has gained considerable recognition.  Tom Ford set up shop and brought his runway show to the city. Locally grown brands like Rodarte have a major following.   LA also is increasingly a global center of gravity in the art world.

    Yet behind the glitz, in the city of Los Angeles, aging water mains regularly erupt and the streets and sidewalks decay, with the city’s own report estimating it has an $8.1 billion infrastructure repair backlog.

    One report chronicles the flight of cash-strapped New York creatives fleeing to sunny, liberating, and less expensive LA.  Another how high prices and the Southern California grind are sending those same creatives packing.

    What’s going on here?

    What we are witnessing is LA changing in the context of the two tier world —divided between rich and poor — that we live in. This has been made worse by a city that has excessively focused on glamour at the expense of broad based opportunity creation.

    Los Angeles may be a creative capital and a great place to live as a creative worker, but it was always much more than that. It was also a great place to build the middle class American Dream or run a business that employed people at scale. For example, it was and still today remains the largest manufacturing center in the United States.  Yet it has lost half of its manufacturing job base since 1990.  That’s over half a million manufacturing jobs lost in the region since then, with over 300,000 of those just since 2000. Unlike Detroit, Houston, Nashville and even Portland, the region has not benefited at all from the resurgence of US manufacturing since 2009.

    Manufacturing decline, of course, is hardly unique to LA, but the city’s problems are particularly acute because region is so huge and diverse, being both the second largest metro area in the country, and the most diverse major region in America.  LA has a higher share of Hispanic population than any major metro apart from San Antonio – one twice as high as the Bay Area.  The LA/Inland Empire’s 8.4 million Hispanics would by themselves be the fourth largest metro area in the country, and are more than the total number of people living in the Bay Area. The area also has over a million black residents.

    With their heavily well-educated populations the Bay Area and Boston can perhaps get away with operating as sort of luxury boutiques for upscale whites and Asians, however dubious a decision that may be. Not so LA.

    The problem is that LA and California more broadly have adopted the luxury boutique mindset.  Policies are made in ways that favor the glamorous industries like Hollywood, high tech, and the arts – industries that don’t employ a lot of aspiring middle class people, particularly Hispanics or blacks.  

    These policies include strongly anti-growth land use and environmental policies designed to produce the kind pristine playgrounds favored by glamour industries and creative elite. But they have rendered the region increasingly unaffordable to all but the highly affluent or those who were lucky enough to buy in long ago. 

    Tech firms and entertainment companies can afford to pay their key workers whatever they need to live in LA.  That’s tougher for more workaday businesses. Ditto for business regulations, where many industries don’t have the margins to spend on things like a phalanx of compliance attorneys.

    Now that high prices are starting to hurt younger hipsters who want to join the creative industries, this is starting to get attention. But if it’s a problem for young, educated Millennials, it’s a disaster for the working class. 

    LA does deserve credit for potentially opportunity expanding investments in transit. But if transit can be seen as a potential winner, most political  leaders seem more concerned with finding ways to simply attempt to politically reallocate some money to those being squeezed by their policies, all at the expense of growth. The $15 minimum wage is Exhibit A. Like rent control, a high minimum wage benefits a few lucky winners while harming others and making it harder to justify business investment that would create more jobs and entry level opportunities onto the ladder of success, while raising consumer prices. The fact that nearly half of LA’s workers might be covered by the new minimum is a damning testament to the erosion of the region’s middle class job base.

    The real measure of success for LA is not how many runway shows, startups, and elite rankings it can achieve, but whether it can recover its role as an engine of opportunity for its large and diverse population to achieve their American Dream. Local leaders would be better served looking for policies that will expand opportunity instead of the ones they are following that actually reduce it.

    Aaron M. Renn is a Senior Fellow at the Manhattan Institute for Policy Research and a Contributing Editor at its magazine City Journal.

  • The California Dream has Moved Away

    Southern California faces a serious middle income housing affordability crisis. I refer to middle income housing, because this nation has become so successful in democratizing property ownership that the overwhelming majority of middle income households own their own homes in most of the country.

    Recently I had the privilege of participating in a forum on this subject sponsored by the Urban Land Institute, Los Angeles Housing Chapter in Century City. The forum also included a presentation from USC Professor Dowell Myers and was chaired by Ehud Mouchly, who chairs the Housing Chapter. This article is adapted from my presentation.

    I am a native Angeleno, having been born near Temple and Alvarado, less than two miles from City Hall. I was appointed to three terms on the Los Angeles County Transportation Commission (LACTC) by Mayor Tom Bradley, where I played a pivotal role in the establishment of the Los Angeles rail system. LACTC and SCRTD were the two predecessors to the current Los Angeles County Metropolitan Transportation Authority (MTA).

    In addition, for 11 years, Hugh Pavletich of Christchurch, New Zealand and I have published the Demographia International Housing Affordability Survey. The latest edition was released in January and included median multiple data for 86 major metropolitan areas and nearly 300 smaller metropolitan areas in nine nations. Finally, I publish the most comprehensive annual review of world urbanization, providing population, land area and density for world urban areas with over 500,000 population (See World’s 1,000 Largest Cities: World Urban Areas 2015 Edition).

    All of this makes housing in Southern California and urban development particularly interesting to me.

    The Imperative: A Rising Standard of Living and Less Poverty

    The title of the forum was "The Changing Demographics of Southern California and Their Impact on Housing," however I think that the reverse is more significant — the impact housing is likely to have on Southern California.

    My perspective is neither ideological nor tied to any political party. It is a fundamentally pragmatic view that domestic policy should principally seek to better people’s lives, by facilitating a rising standard of living and reducing poverty. These objectives were also referenced in the G20 nations communiqué in Brisbane and adopted a announcing a dedication to improving standards of living and eradicating poverty.

    The issue is particularly ripe in California, where public policies relating to housing are having virtually the opposite effect. Housing costs have already increased poverty and reduced the discretionary income of middle-income households.

    This is not an issue of suburbs versus the urban core. I could not be more pleased by the long overdue resurgence of downtown areas as residential locations, something made possible by the huge crime reductions that began with Mayor Rudy Giuliani’s policies in New York City and similar efforts in cities like Los Angeles. It is important to recognize that a vibrant core no more needs dying suburbs then vibrant suburbs need a dying core. Both urban cores and suburbs can prosper, creating a stronger urban area.

    The Housing Crisis

    Southern California’s biggest crisis relates to housing. Housing is important to the standard of living and alleviating poverty. It is the largest element of household budgets. When housing more expensive, it leaves households with less discretionary income to purchase other goods and services. This will, other things being equal, reduce economic output from levels that would be otherwise attained.

    This has been developing for more than four decades as house price to income ratios (such as the median multiple, the median house price divided by the median household income) have doubled and tripled above historical levels and well above those of other metropolitan areas. Attention is often focused on lower income affordable housing, a problem virtually everywhere, but most parts of the country do not suffer so severe a middle-income housing affordability problem. Low-income housing affordability is important and one of the best ways to minimize it is to ensure that there is middle-income housing affordability.

    A bit of historical perspective is appropriate. For centuries nations had little or no property-owning middle class. Huge progress has been made in the last century and particularly since World War II. Following the war, housing development innovation, combined with transportation advances, led to the development of owned middle income housing in the suburbs. It started with Levittown on Long Island and spread across the nation. The most fabled Southern California example is Lakewood (see D. J. Waldie’s Holy Land: A Suburban Memoir on this). The result was a massive increase in home ownership, rising from percentages from the low 40s to 65% in the final decades of the 20th century.

    Similar progress was made in other countries, especially in Canada, Australia and New Zealand, where middle-income households purchased homes with sufficient space. In each of these nations, the median multiples were around or below 3.0 as late as 1995.

    All of this represented progress toward what the late and renown British urbanist Peter Hall called the "ideal of a property owning democracy" (See: The Costs of Smart Growth Revisited: A 40 Year Perspective).

    Sadly, affordability has diminished greatly in many metropolitan areas around the world.  House prices relative to incomes have doubled or tripled in virtually all of the metropolitan areas of Australia and New Zealand, some metropolitan areas in Canada as well as in some key metropolitan areas in the United States, with the worst in California. In each of these places, this house price escalation occurred after implementation of urban containment policies (also called smart growth or growth management), which seriously reduce the amount of land that can be used for new housing.

    The Roots of Urban Containment Policy

    Urban containment has its roots in the British 1947 Town and Country Planning Act. This act created green belts around British cities and is a proximate cause of the present housing shortage and crisis. The general philosophy of the 1947 Act is evident throughout urban planning in the United States and has been implemented in Oregon, part of Washington and California. Urban containment policy was also enacted in Florida. There, house prices had escalated at rates — if not the price levels — to near that of California during the housing bubble. However, legislators took the opportunity to repeal Florida’s urban containment policies when housing prices dropped to historical median multiple levels.

    A recent California Legislative Analyst’s report indicated that much of the problem is California’s strict land-use laws and regulations (See:  How the California Dream Became a Nightmare). A dense mesh of "urban containment" and "smart growth"  regulations have severely limited the land available for new housing, especially on the periphery, where cities grow organically. This destroys the competitive market for land, driving up its cost. This makes house prices escalate in relation to incomes.

    California: 50% More Poverty Than Mississippi

    Today, California house prices are far higher than in the rest of the nation. This is taking a toll on the standard of living and increasing poverty. The Census Bureau’s supplemental poverty measure, which adjusts for housing costs shows California’s poverty rate to be the highest in the nation. It should be of concern that California’s poverty rate is 50% above that of perennial poverty leader Mississippi (Figure).

    Because so much poverty is concentrated among minority ethnic populations, California’s urban containment policy is particularly disadvantaging Hispanics and African-Americans. The Thomas Rivera Institute at USC published a detailed examination of California’s land-use regulations and found that "Far from helping, they are making it particularly difficult for Latino and African American households to own a home."

    The Need for Reform

    The bad news is that things are likely to get much worse. Under the Sustainable Communities Strategies required under Senate Bill 375 (2008), it is likely to become nearly impossible to build traditional suburban single-family housing in California’s metropolitan areas (See: California Declares War on Suburbia). Already, median multiples in San Francisco, San Jose, Los Angeles and San Diego are approaching the highs reached at the peak of the housing bubble. House prices are likely to continue rising relative to incomes, other things being equal.

    Allowing Supply to Meet Demand

    It is often asserted that diminishing land supply in California reflects not so much regulation, but physical limits. The state is sometimes seen as ‘built out’. Yet, in fact, there is plenty of land available for development. Despite its reputation for urban sprawl, the Los Angeles urban area is the most densely populated in the United States. It covers a bit more than one half the land area of the New York urban area. Like any urban area, the greenfield land that is available for development is on the periphery, which  includes areas like the northern Antelope Valley, the Victor Valley, and Southwestern California (Temecula to Hemet) and in some closer areas. Each of these areas is closer to the urban core than some parts of the New York commuter shed.

    These areas could easily accommodate the additional population expected in the area by 2060, including the single family housing generally preferred among middle-income households. Households are not likely to raise children on high rise balconies.

    Even so, the urban footprint would continue to be much smaller than that of New York. If sufficient land were opened to development, the city would expand geographically, but people would also have better access to middle class standards of living, and there would likely be a lot less poverty. The obvious choice would be to let the city expand, while improving real incomes and reducing poverty.

    The California Dream is Now in Denver?

    During the discussion period after my talk, perhaps the most prescient comment was made by an unidentified audience member said that the California dream is now in Denver. California’s unjustifiably and artificially high housing prices are the cause. Between 1993 and 2010, there was net out-migration from California to 42 of the 50 states and the District of Columbia. Immigration to Los Angeles and Orange from abroad has also declined, as immigrants too look for more affordable alternatives. People seeking sun, glamour or a good time will continue to flourish in southern California, but it seems likely that more families, and middle class households, will continue to ebb out, seeking somewhere else the dream that was once so closely identified with Southern California.

    Wendell Cox is principal of Demographia, an international public policy and demographics firm. He is co-author of the "Demographia International Housing Affordability Survey" and author of "Demographia World Urban Areas" and "War on the Dream: How Anti-Sprawl Policy Threatens the Quality of Life." He was appointed to three terms on the Los Angeles County Transportation Commission, where he served with the leading city and county leadership as the only non-elected member. He served as a visiting professor at the Conservatoire National des Arts et Metiers, a national university in Paris. Wendell Cox is Chair, Housing Affordability and Municipal Policy for the Frontier Centre for Public Policy (Canada), is a Senior Fellow of the Center for Opportunity Urbanism and is a member of the Board of Advisors of the Center for Demographics and Policy at Chapman University.

    Photo: Central Los Angeles and the San Fernando Valley (by author)

  • Malls Washed Up? Not Quite Yet

    Maybe it’s that reporters don’t like malls. After all they tend to be young, highly urban, single, and highly educated, not the key demographic at your local Macy’s, much less H&M.

    But for years now, the conventional wisdom in the media is that the mall—particularly in the suburbs—is doomed. Here a typical sample from The Guardian: “Once-proud visions of suburban utopia are left to rot as online shopping and the resurgence of city centers make malls increasingly irrelevant to young people.”

    To be sure, there are hundreds of outmoded malls, long-in-the-tooth complexes most commonly found in working-class suburbs and inner-ring city neighborhoods. Some will never come back. By some estimates, something close to 10 to 15 percent of the country’s estimated 1,000 malls will go out of business over the next decade; many of them are located in areas where budgets have been very tight, with locals tending to shop at “power centers” built around low-end discounters such as Target or Walmart.

    But the notion that Americans don’t like malls anymore is misleading. The roughly 400 malls that service more-affluent communities—like those typically anchored by a Bloomingdale’s or Nordstrom—recovered most quickly from the recession, and now appear to be doing quite well.

    To suggest malls are dead based on failure in failed places would be like suggesting that the manifest shortcomings of Baltimore or Buffalo means urban centers are not doing well. Like cities, not all malls are alike.

    Looking across the entire landscape, it’s clear the mall is transforming itself to meet the needs of a changing society but is hardly in its death throes. Last year, vacancy rates in malls flattened for the first time since the recession. The gains from e-commerce—6.5 percent of sales last year, up from 3.5 percent in 2010—has had an effect, but bricks and mortar still constitutes upwards of 90 percent of sales. There’s still little new construction, roughly one-seventh what it was in 2006, but that’s roughly twice that in 2010.

    Shopping in stores, according to a recent study from A.T. Kearney, is preferred over online-only by every age group, including, most surprisingly, millennials, although many of them research on the web, then visit the store, and sometimes then order on line. The malls that are flourishing tend to be newer or retrofitted and are pitched at expanding demographic markets. These “cathedrals of commerce” in the past tended to reflect the mass sameness of mid-century America; those in the future focus on distinct niches—ethnic, income, even geographical—that are not only viable but highly profitable.

    This leaves us with a tale of two kinds of malls. One clear dividing line is customer base. In the ’80s and before, malls succeeded fairly universally, notes Houston investor Blake Tartt. But now it’s a matter of being in the right place. “Everything has changed and you have to be with the right demographics,” he suggests. “It’s not so much about the mall but the location that matters.”

    Old malls in declining areas, notes a recent analysis by the consultancy Costar, do truly face a “bleak future” and should look to be converted into apartments, houses, corporate headquarters, or churches.

    In contrast, affluent urban areas are becoming an unexpected hotspot for malls—even outlet malls are opening open in the urban core. You now see gigantic malls in places like Manhattan: the Shops on Columbus mall in Manhattan, the world’s fifth-most profitable mall, looks inside like it was teleported from Orange County, California, or, god forbid, Long Island.

    This is not unusual across the world. Malls are on the march in many of the world’s biggest cities, including Istanbul, Mumbai, Singapore, and Dubai. Today Asia is the site of seven of the world’s 10 largest malls, in places like Beijing, Dubai, and Kuala Lumpur.

    In the developing world, malls grow as local shopping streets either gentrify or decay. This is particularly true in fast-growing developing countries where malls are often seen as an escape from hot, humid, dirty and even dangerous urban environments. Indian novelist and Mumbai blogger Amit Varma suggests that these folks like malls “because they are relatively clean and sanitized” as opposed to the city’s pollution-choked, beggar-ridden and often foul-smelling streets.

    Ethnic Malls

    Within the U.S., demographic change is creating opportunities for a new breed of mall-maker. Across the country, savvy investors and developers have been buying older malls, which tended to serve either Anglo or African-American customers, and shifting them instead to focus on fast-growing ethnic markets. Such malls can now be found in traditional Latino areas such as Southern California and Texas, but they also exist in Atlanta, Las Vegas, Oklahoma City, and Charlotte, places that have recently become major hubs for immigrants.

    “We had a terrific recession,” notes Los Angeles-based mall maven Jose Legaspi, who has developed 12 such malls around the country. “You do well if you target specific niches that are growing. You can’t make it with a plain vanilla mall. We are creating in these places a Hispanic downtown.”

    Fort Worth’s 1.2 million-square-foot La Gran Plaza, which Legaspi manages, epitomizes the advantages of such marketing. When investor Andrew Segal bought the mall in 2005, it was a failing facility that primarily serviced a working-class Anglo population. Barely 15 percent of the mall’s tenants were both open and paying rent.

    Segal quickly recognized that the area around the mall—like much of urban Texas—was becoming more diverse, in this case largely Latino.

    Segal and Legaspi redid the once prototypical plain vanilla mall to look more like a Northern Mexican town plaza, a design pattern developed by Los Angeles architect David Hidalgo. Latino customers are drawn to amenities like large and comfortable family bathrooms, an anchor supermarket, mariachi music shows, and even Catholic masses. There is also a “swap meet” that accommodates small vendors, something that Legaspi sees as essential to creating “a carnival of retail experiences.” By 2008, when the face-lift was complete, the mall achieved 90 percent occupancy. Today La Gran Plaza is effectively “full,” says Segal, who is considering a further expansion of the mall.

    The viability of ethnic malls in hard times demonstrated their viability in better ones. When Dr. Alethea Hsu opened her Diamond Jamboree Center in Irvine, California, the state was reeling from the recession. Yet from the time she opened in 2008, her mall, which focuses on Orange County’s large and expanding Asian population, has been fully occupied. It includes various realty offices, hair salons, medical offices, a Korean supermarket, and a small Japanese department store, all primarily aimed at a diverse set of Asian customers. The biggest problem—for those interested in choosing among various kinds of Chinese, Vietnamese, Korean, or Japanese cuisine—is not that it’s deserted but that it’s often difficult to get a parking space.

    Be sure of this: The ethnic mall is no flash in the pan, at least as long as immigrants pour into this country. By 2000, one in five American children already were the progeny of immigrants, mostly Asian or Latino; today they make up as much as one-third of American kids. These kids, and their own offspring, not to mention Anglo or African-American friends, have been brought up with food and fashion tastes that often originate in Mexico, Taiwan, Japan, Korea, or China. When I was a kid growing up in New York, you went to Chinatown or Little Italy for an ethnic infusion. Now you get in your car, park, and get options not so dissimilar than what you would find—usually in a mall—in Mexico City, Mumbai, or Singapore.

    The World According to Rick

    For most of America, says Los Angeles developer Rick Caruso, the future lies in replicating the function that Main Street once served. Rather than simply a center for instant consumption and transactions, the mall is a social meeting point, says Caruso, who has 10 developments under his belt. To make it all work means adding often unconventional amenities such as live entertainment or the lighting of Christmas trees and the Chanukah menorah.

    This is part of a broader mall trend in which developers see their properities as community and entertainment centers, an approach adopted now by mainstream mall developers such as Westfield, whose projects are increasingly open-air and built around amenities such as health clubs and trendy restaurants and cafes.

    The ultimate example may be the Caruso-owned Grove, a giant open-air mall that lies next to the Farmers’ Market, one of the oldest and beloved shopping areas in Los Angeles. The world’s eighth-most profitable mall, the Grove is laid out like a Disneyesque Main Street and is particularly appealing to families and tourists. Overall, the Grove now ranks among L.A.’s leading tourist attractions. This reflects both the development’s pleasant, pedestrian-oriented design as well as proximity to the Farmer’s Market, which remains, as has been traditional, largely a collection of small, idiosyncratic stalls.

    A sense of place is what makes the Grove—and, to a lesser extent, Caruso’s other developments—work. Located in the Miracle Mile district of L.A., it attracts a huge urban population that includes old Jewish shoppers from the immediate area as well as the growing ranks of hipsters, tourists, and the rest of the vast diversity that is Los Angeles. Caruso’s other centers, like the Commons in suburban Calabasas and The Promenade in Westlake, may lack global appeal but they succeed as anchors of their communities. Without developed, large historic downtowns, these communities still need a central place, and for them, the malls, however imperfectly, come closest to delivering it.

    In today’s environment, Caruso suggests, a mall has to offer something that online retailers, power centers, or catalogs cannot provide: a social experience. “You have to differentiate yours, offer a place for people to gather for holidays. People are yearning for a place to connect with each other. We are not building just town centers, but the centers of towns.”

    Ironically these malls are fulfilling a role that some urbanists have denounced the suburbs for lacking. “What do most urbanists want?,” asks David Levinson, director of the Networks, Economics, and Urban Systems Research Group. “A lively, pedestrian realm, clean, free of automobiles, with a variety of activities, the ability to interact with others and randomly encounter friends and acquaintances. This is what the shopping mall gives.”

    The New Town Center: With Suburban Revival, New Hope for Malls

    The notion of dead malls has been connected to a similar idea about the inevitable demise of the suburbs, which appeared possible at the height of the recession, but has since been shown to be largely false. Suburbs may not be booming as in the ’90s, but they are now growing as fast as core cities, and constitute more than 70 percent of all new population and 80 percent of new job growth since 2010.

    Surprisingly, the most recent numbers suggest that the outer suburbs and exurbs, once consigned to Hades by the new urbanist crowd, have begun to roar back. Millennials, as they get older, notes Jed Kolko, now seem to be moving to what he calls “the suburbiest” areas farther out on the periphery. 

    It is in these areas that malls may have their greatest future. In communities like Irvine, where the Spectrum development has become the de facto downtown, or Sugar Land, a highly diverse outer suburb of Houston, the “town center” is essentially a mall in brick, made to look like an old Main Street but filled with chain stores and specialty restaurants. Many residents of fast-growing communities like Sugar Land, which has 83,000 residents, are relative newcomers, and for them such town centers are the focus of their communities.

    It is time to dispense with the twin memes of mall- and suburb-bashing, and begin appreciating and improving how most Americans live and shop. The malls of the future indeed may be very different in many ways—more segmented by income and ethnicity, more entertainment- and experience-oriented. But they will continue to serve an important focus for most American communities. And at a time when many of our most celebrated cities have themselves become giant malls (is there any place on Earth more boring than the area around Times Square?), the future of malls may prove brighter, and even more transformative, than commonly imagined.

    This piece first appeared at The Daily Beast.

    Joel Kotkin is executive editor of NewGeography.com and Roger Hobbs Distinguished Fellow in Urban Studies at Chapman University, and a member of the editorial board of the Orange County Register. He is also executive director of the Houston-based Center for Opportunity Urbanism. His newest book, The New Class Conflict is now available at Amazon and Telos Press. He is also author of The City: A Global History and The Next Hundred Million: America in 2050.  He lives in Los Angeles, CA.

    Photo: “Thegrove“. Licensed under CC BY-SA 3.0 via Wikipedia.