Tag: Los Angeles

  • Jerry Brown and California’s “Attractive” Poverty

    Jerry Brown is supposed to be a different kind of politician: well informed, smart, slick, and skilled.  While he has had some missteps, he’s always bounced back.  His savvy smarts have allowed him to have a fantastically successful career while generally avoiding the egregious dishonesty that characterizes so many political practitioners.

    So, I was shocked to read that he said that California’s poverty is a result of the State’s booming economy.  Here’s part of the Sacramento Bee report:

    Gov. Jerry Brown, whose pronouncements of California’s economic recovery have been criticized by Republicans who point out the state’s high poverty rate, said in a radio interview Wednesday that poverty and the large number of people looking for work are "really the flip side of California’s incredible attractiveness and prosperity."

    The Democratic governor’s remarks aired the same day the U.S. Census Bureau reported that 23.8 percent of Californians live in poverty under an alternative calculation that includes the cost of living. Asked on National Public Radio’s "All Things Considered" about two negative indicators — the state’s nation-high poverty rate and the large number of Californians who are unemployed or marginally employed and looking for work — Brown said, "Well, that’s true, because California is a magnet.

    "People come here from all over in the world, close by from Mexico and Central America and farther out from Asia and the Middle East. So, California beckons, and people come. And then, of course, a lot of people who arrive are not that skilled, and they take lower paying jobs. And that reflects itself in the economic distribution."

    This is so incredibly wrong that I’m worried that Brown has lost his head and ability to reason.   If he really believes what he said, he’s living in the past and he’s so ill informed as to be delusional.  If he doesn’t believe what he said, I’m worried that his political skills have slipped.  To my knowledge, he’s never said anything so clearly at odds with the truth in his career.

    Here are the facts:

    • California’s poverty is not where the jobs are, which is what we’d expect if what Brown said was true.  Most of California’s jobs are being created in the Bay Area, a region of fabulous wealth. By contrast, California’s poverty is mostly inland. San Bernardino, for example, has the second highest poverty rate for American cities over 200,000 population, and no, it’s not because it’s a magnet. Most of California’s Great Central Valley is a jobs desert, but the region is characterized by persistent grinding poverty and unemployment.  No one in recent years is moving to Kings County to look for a job.
    • States with opportunity have low poverty rates.  North Dakota may have America’s most booming economy.  According to the Census Bureau, North Dakota’s Supplemental Poverty Measure is 9.2 percent.  That is, after adjustments for cost of living, 9.2 percent of North Dakotans live in poverty.  The rate in Texas – a state with a very diverse population, and higher percentages of Latinos and African-Americans – is 16.4 percent.  California leads the nation with 23.8 percent of Californians living in poverty.
    • According to the U.S. Census, domestic migration (migration between California and other states) has been negative for 20 consecutive years. That is, for 20 years more people have left California for other states than have come to California from other states. Wake up, Jerry, this is no longer your Dad’s state – or that of his successor, Ronald Reagan. This is a big change from when Brown was elected governor the first time.  At that time, California was a magnet.  It had a vibrant economy, one with opportunity.  California was a place where you could have a career, afford a home, raise a family.  It was where the American Dream was realized.
    • How about the magnetic attraction for immigrants from all over the world? According to the Census Bureau, international migration to California is way down.  The number of California international immigrants has been declining for a decade at least.  Indeed, in recent years there have been about half as many international immigrants to California than we saw in the 1990s.  Over the past decade, the number of foreign born increased more in Houston than the Bay Area and Los Angeles put together. Opportunity, not  “attractiveness”, drives people to move.
    • The result of negative domestic migration and falling international migration is the total migration to California has been negative in each of the past eight years.  More people have left California than have come to California for eight consecutive years. 
    • California’s migration trends combined with falling birth rates has resulted in the lowest sustained population growth rates that California has seen.

    The data are clear: Brown’s assertions have no basis in fact.  California – with the exception only recently of the Bay Area – is not a magnet. California is not "incredibly attractive and prosperous."  People are not coming from all over the world. California may beckon, but more are leaving, and those here are having fewer children. California’s seductive charms go only so far.

    I don’t know if I’d prefer that Brown was delusional or lying. On the one hand, policy made from a delusional analysis of the world is sure to be bad policy. Brown, for example, may convince himself that Twitter, Google, and Facebook are the future of the California economy, without recognizing how few people, particularly from the working class or historically disadvantaged minorities, they employ. On the other hand, Brown is very skilled in the political arts. If someone as skilled as he has to resort to such outright misdirection, we may be in worse shape than I think.

    Bill Watkins is a professor at California Lutheran University. and runs the Center for Economic Research and Forecasting, which can be found at clucerf.org.

    Jerry Brown photo by Bigstock.

  • L.A. Ports Face Challenge from Gulf Coast

    In this strange era of self-congratulation in California, it may be seen as poor manners to point out tectonic shifts that could leave the state and, particularly, Southern California, more economically constrained and ever more dependent on asset bubbles, such as in real estate. One of the most important changes on the horizon is the shift of economic power and influence away from the Pacific Coast to the Gulf Coast – the Third Coast – a process hastened by the imminent widening of the Panama Canal. Over time, this could represent a formidable challenge to our status as a critical global region.

    It is easy to live in Southern California – particularly in the more-affluent, coastal sections or the middle-class inland valleys – and hardly know how critical international trade is to our regional economy. Invisible to denizens of Malibu or Newport Beach, the ports of Long Beach and Los Angeles together account for almost 40 percent of U.S. container imports. Along with Hollywood, and our climate, it represents arguably the region’s greatest asset.

    Overall, the ports are the critical linchpin of the roughly 500,000 jobs tied to logistics, warehousing and trade services. These jobs, notes economist John Husing, provide a wide range of generally higher-paying blue-collar employment compared with, for example, hospitality or retail. This is critical in a region with a large undereducated, but motivated, workforce.

    Southern California’s emergence as the nation’s largest trading center has been unlikely, tied more to ingenuity and ambition than natural geography. Unlike its West Coast rivals – San Diego, Seattle and, most particularly, San Francisco – the Los Angeles region does not boast a great natural harbor. Its construction, starting in the early decades of the previous century, was completely man-made and conceived.

    By the 1980s, sparked by a shift of trade from Europe to Asia, the ports of Los Angeles and Long Beach started to overtake, in merchandise trade value, New York, which had dominated U.S. trade since the first decades of the 19th century. Along with trade came business connections, direct air travel and a surge of Asian immigration. Today, Los Angeles, with roughly 1.5 million Asians, ranks first among America’s counties for Asian population, while Orange County, with more than 530,000 Asian residents, ranks third, just behind the Santa Clara-Silicon Valley region.

    Wider canal coming

    These advantages, human as well as geographic, are critical to the region’s global status. But this could change, in part due to the expansion of the Panama Canal – set for completion in late 2014 or in 2015 – which will open to Asian businesses the opportunity to send megaships directly to the Gulf Coast or the Southeast.

    “Trade will shift,” predicts Khalid Bachkar, a professor at the California Maritime Academy.

    There are other challengers to our supremacy, including port expansions in both Western Canada and Mexico that could offer newer facilities and rail connections directly within their own countries and the vast U.S. market. But the greatest challenge seems likely to come from the Gulf, which offers excellent access to trains that carry goods directly to the vast majority of the United States.

    Demographic trends will also play a role. In the 1970s and 1980s, the Pacific Coast seemed like the premier growth market, but high housing prices, taxes and regulatory restraints – and, most importantly, outmigration – have slowed regional business growth.

    In the next four years, notes Pitney Bowes, Houston is expected to have the largest household growth in the country: some 140,000 people, an increase by 6.7 percent. Most of the other fast-growth regions in the nation – Dallas-Fort Worth, Austin, Texas, Raleigh-Cary, N.C., San Antonio, Jacksonville, Fla., and Charlotte, N.C. – are located either along the Gulf or are natural markets for their ports.

    In contrast, Los Angeles is projected to grow by only 1.5 percent and Orange County by less than 2 percent the next four years.

    Critically, the Gulf is, for the first time, attracting a critical mass of Asians. Over the past decade, Houston has enjoyed some of the nation’s fastest growth in Asian population, up some 70 percent, and its Asian community is now the eighth-largest in the country. Houston’s Asian population is now growing three times as rapidly as that of the San Francisco or Los Angeles areas.

    Energy exports

    At the same time, the expansion of oil and natural gas production in Louisiana, Texas and the Plains makes the Gulf ports major players in the emergence of the U.S. as an energy exporter. The Gulf Coast also is home to many of the nation’s largest industrial investments, including from overseas. The Port of Houston, for example, posted a 28.1 percent jump in foreign trade in 2012, and trade at reached records levels at the Port of New Orleans (I work as a consultant in that city).

    Agriculture has also been on a roll in terms of exports, and 50 percent of the nation’s grain shipments through Louisiana ports. Combined with rising energy and industrial growth, the Third Coast now claims a growing share of U.S. trade. Since 2003, the value of exports from the Gulf ports has more than tripled; the region’s share of U.S. exports over that period grew from roughly 10 to nearly 16 percent.

    Once an industrial backwater, the Gulf region has attracted new steel plants, petrochemical plants and facilities involved in everything from airplanes to food processing. All these locations export such items as cars and chemicals, and all import goods, such as car parts and iron ore. According to Site Selection magazine, the Gulf includes four of the top 12 states – led by No. 1 Texas, No. 7 Louisiana, No. 10 Florida and No. 12 Alabama – in attractiveness to investors. Texas and Louisiana ranked first and third among the states for new plants.

    Standing pat

    Ultimately, this is a challenge that our region cannot afford to ignore, particularly with completion of the Panama Canal expansion in as soon as roughly a year. In anticipation, ports along the Gulf, as well as in the Southeast, are almost all improving and expanding their ports. In contrast, Southern California ports – largely because of labor and environmental concerns – may be slow to make the “intense capital improvements,” such as dredging and new road connections. This largely results from environmental pressures that, notes economist Husing, are not nearly as powerful along the Gulf or in the Southeast. A history of labor disputes by highly paid, politically powerful California port workers also has reinforced the notion that the L.A. area ports are becoming an increasingly unreliable place to do business.

    The Third Coast is also positioned to benefit from commerce with Latin America, the Gulf’s historic leading trade partner. Latin America, notes Bill Gilmer, has been home to many of the world’s fastest-growing economies. Since 2002, about 56 million people in Latin America,according to the World Bank, have risen out of poverty.

    Trade with these partners – including Mexico – are ramping up growth in Houston, as well as other Gulf ports. Brazil, notes Jimmy Lyons, has risen to become a trading partner of Mobile, Ala. Strong Latin immigration to virtually all the Gulf cities, particularly Houston and, increasingly, New Orleans, can only strengthen these economic ties.

    Southern California, with its vast Hispanic population and proximity to Mexico, also should be able to serve as a hub for this trade, but this can only happen if the region attaches greater priority to port development. Historically, this region was built by people taking risks on big infrastructure – covering everything from the water delivery systems to the port and freeways – that literally paved the way to economic progress, and growth.

    The key question now is: Do we still have the spirit and willingness to build, as our competitors are on the Third Coast, the Southeast, Mexico and Canada. If we fail to meet the challenge, Southern California could surrender desperately needed potential sources of new employment and a critical linchpin to our continuing status as one of the world’s great global centers.

    This story originally appeared at the Orange County Register.

    Joel Kotkin is executive editor of NewGeography.com and Distinguished Presidential Fellow in Urban Futures at Chapman University, and a member of the editorial board of the Orange County Register. He is author of The City: A Global History and The Next Hundred Million: America in 2050. His most recent study, The Rise of Postfamilialism, has been widely discussed and distributed internationally. He lives in Los Angeles, CA.

    Port of Los Angeles photo courtesy of NOAA’s National Ocean Service.

  • Underemployment in America

    The nation’s lackluster economic performance continues to be a concern. This is evident in stubbornly high unemployment rates (See: Suburban and Urban Core Poverty: 2012 Special Report),which continue to be well above historic norms. There is another indicator, which may be even more important – underemployment. This figure, 80 percent above the unemployment rate, can be used as a measure of the “output gap,” which a Congressional Research Service (CRS) report refers to as “the rate of actual output (economic) growth compared with the rate of potential output growth.” CRS continues: “Potential output is a measure of the economy’s capacity to produce goods and services when resources (e.g., labor) are fully utilized” (Note 1).

    Both rates are reported by the Department of Labor, Bureau of Labor Statistics (BLS). The national underemployment rate (BLS “U-6” labor underutilization measure) is far higher than the unemployment rate (BLS “U-3” labor underutilization measure). The 2012 underemployment rate was 14.7 percent, compared to the unemployment rate of 8.1 percent. The total unemployed population was 12.5 million in 2012, while the total underemployed population was 23.1 million.

    The difference between underemployment and unemployment comes by adding two groups: marginally attached workers and workers on part-time schedules for economic reasons. According to BLS, marginally attached workers are not counted as unemployed because they have not looked for work within the last four weeks, but they have sought work within the last year and are available for employment. Marginally attached workers include “discouraged” workers, who are not looking for work “because they believe there are no jobs available or there are none for which they would qualify.” In 2012, there were approximately 2.5 million marginally attached workers, including 900,000 “discouraged” workers.

    However, there was a much larger number of involuntary part time workers, at 8.1 million in 2012. This is nearly two-thirds of the 12.5 million workers unemployed in 2012.

    The number of underemployed may be higher. Gallup estimated the nation’s underemployment rate at 17.4 percent in August, well above the BLS August figure of 14.7 percent. The Gallup estimate would place underemployed workers at more than 27 million. This is approximately equal to all of the combined employment in the first and second largest states, California and Texas, as well as Colorado (Figure 1).

    Indeed, the number of underemployed could be higher yet. Economists Richard Vedder, Christopher Denhart, and Jonathan Robe at the Center for College Affordability and Productivity have estimated that 48 percent of employed college graduates hold jobs that do not require college degrees, using BLS data. None of these, as long as they are full time employees, would be included in the underemployment figures.

    Underemployment by State

    In addition to its monthly national estimates, BLS provides quarterly, year-on-year estimates by state, but only for Los Angeles County and New York City below the state level. Data is shown for 2006, the year of the best underemployment rate in the last decade, 2010, with the worst underemployment rate and the most recent year for which data is available, ending June 30, 2013 (Table).

    Underemployment Rates 
    by State, Los Angeles County & New York City
      2006 2010 2013q2* Rank
    United States 8.2% 16.7% 14.3%  
    Alabama 7.3% 17.3% 13.0% 22
    Alaska 11.8% 14.3% 12.4% 16
    Arizona 7.6% 18.4% 15.7% 42
    Arkansas 9.1% 14.5% 13.6% 25
    California 9.1% 22.1% 18.3% 50
    Colorado 7.9% 15.4% 13.8% 28
    Connecticut 7.8% 15.7% 14.6% 37
    Delaware 6.4% 14.3% 14.1% 30
    District of Columbia 9.8% 14.0% 14.1% 30
    Florida 6.2% 19.3% 15.1% 39
    Georgia 8.1% 17.9% 15.6% 40
    Hawaii 6.2% 16.9% 11.4% 12
    Idaho 6.9% 16.3% 13.6% 25
    Illinois 8.1% 17.5% 16.1% 47
    Indiana 8.1% 17.4% 14.5% 36
    Iowa 6.7% 11.6% 9.5% 5
    Kansas 7.4% 12.4% 10.9% 9
    Kentucky 9.3% 16.4% 14.3% 34
    Louisiana 8.1% 12.9% 12.5% 18
    Maine 8.2% 15.2% 14.2% 32
    Maryland 6.5% 13.0% 12.0% 15
    Massachusetts 8.2% 14.3% 13.3% 23
    Michigan 12.2% 21.0% 16.1% 47
    Minnesota 7.9% 13.8% 11.2% 11
    Mississippi 10.2% 17.6% 15.8% 45
    Missouri 8.0% 15.8% 12.4% 16
    Montana 6.9% 14.9% 12.7% 20
    Nebraska 6.1% 8.6% 8.7% 3
    Nevada 6.8% 23.6% 19.0% 51
    New Hampshire 6.1% 11.8% 11.1% 10
    New Jersey 7.8% 15.7% 15.7% 42
    New Mexico 7.5% 15.6% 13.7% 27
    New York 7.7% 14.8% 14.2% 32
    North Carolina 8.6% 17.4% 15.6% 40
    North Dakota 6.2% 7.4% 6.2% 1
    Ohio 9.7% 16.9% 13.5% 24
    Oklahoma 7.3% 11.4% 10.0% 6
    Oregon 10.4% 20.0% 16.9% 49
    Pennsylvania 8.0% 14.7% 13.8% 28
    Rhode Island 8.9% 19.2% 15.9% 46
    South Carolina 10.8% 18.1% 15.0% 38
    South Dakota 6.2% 9.7% 7.8% 2
    Tennessee 8.7% 16.6% 14.3% 34
    Texas 8.6% 14.4% 11.6% 13
    Utah 5.8% 15.1% 10.5% 7
    Vermont 6.4% 12.5% 10.5% 7
    Virginia 6.0% 12.9% 11.6% 13
    Washington 9.4% 18.4% 15.7% 42
    West Virginia 8.8% 14.0% 12.5% 18
    Wisconsin 8.1% 14.8% 12.9% 21
    Wyoming 5.8% 11.5% 9.0% 4
    Los Angeles County 9.1% 24.3% 20.5%
    New York City 8.7% 15.6% 15.1%
    Source: Bureau of Labor Statistics
    *2013q3: Year ended June 30, 2013


    Worst Performing States

    Underemployment in the states is highest in some Western and Midwestern states. For the 12 months ended June 30, Nevada had the highest underemployment rate, at 20.3 percent. California was second, at 19.3 percent, while Oregon had the third highest underemployment rate, at 16.9 percent. Michigan and Illinois were tied for fourth highest, at 16.1 percent (Figure 2).

    Over the past decade (2003 through 2012), four of these states were among the five with the highest underemployment rates. Michigan, hard hit by manufacturing losses, had the highest average underemployment rate (15.6 percent), followed by California and Oregon (both at 14.8 percent), South Carolina (13.8 percent) and Nevada (13.7 percent). For the most part, underemployment has become intractable in these states. Only Nevada, with its precipitous decline from the housing crisis ranked better than 40th worst in underemployment in any year between 2003 and 2012 (Figure 3).

    Best Performing States

    The best underemployment rates were literally concentrated in five adjacent states with strong energy sector states, principally in the Great Plains. North Dakota led the nation for the year ended June 30, 2013, with an underemployment rate of 6.2 percent, less than one-half the national rate (14.7 percent) and less than one-third the rates of Nevada and California. North Dakota’s neighbor to the south, South Dakota had the second best rate, at 7.8 percent, while   Nebraska ranked third at 8.7 percent. On Nebraska’s western border, Wyoming, the only non-Plains state in the top five, ranked fourth with an underemployment rate of 9.0 percent. Nebraska’s eastern neighbor, Iowa, ranked fifth, at 9.5 percent (Figure 4).

    As with the states with the worst underemployment rates over the last decade, those with the lowest  current figure also did best from 2003 and 2012. North Dakota is again number one, with an underemployment rate of 6.7 percent. Nebraska (7.5 percent), South Dakota (7.7 percent) and Wyoming (8.2 percent) follow, with New Hampshire ranking fifth best, at 8.8 percent (Figure 5).

    Underemployment in New York City and Los Angeles County

    For the year ended June 30, 2013, the city of New York had an underemployment rate of 15.1 percent, somewhat above the national rate of 14.3 percent. Over the past decade, the state of New York’s underemployment rate has been lower than that of the city in every year.  

    Los Angeles County is the largest county in the United States and if it were a state would rank eighth in population, between Ohio and Georgia. Further, it Los Angeles County were a state, it would have had the worst underemployment rate in every year from the 2008 to the present. For the year ended June 30 2013, Los Angeles County had an underemployment rate of 20.8 percent, nearly 1/2 higher than the national underemployment rate 14.7 percent and above the highest state rate of 20.3 percent in Nevada.

    Closing the Productivity Gap

    The productivity gap that results from underemployment constrains the US economy at a time of unusually severe financial challenges. College graduates face not only a grim employment market, but have student loan repayments that require good jobs. The nation continues to spend more than it collects in taxes. The inability of state and local governments to fund their government employee pension programs could lead, in the worst case, to much higher taxes or severe service cutbacks.

    Yet things could get worse. The soon to be implemented “Patient Protection and Affordable Care Act” (“Obamacare”) has a built-in incentives for employers to shift workers to part time status (weekly schedule of fewer than 30 hours of work per week). The law exempts them from providing health insurance for employees who work part time and so some establishments are shifting full time employees to part time status. Others establishments may substitute hiring part time employees instead of full time to reduce their expenses. This incentive is not just being executed by private companies seeking to maintain profitability. It extends to state and local government agencies, which unlike the federal government, must balance their books each year. According to a running of enterprises announcing shifts to part-time by Investors Business Daily, more than 75 percent are government agencies.

    All of this points to two important policy implications. The first is the necessity of focusing on the underemployment measure, the improvement of which is so crucial to maintaining and improving the standard of living and reducing poverty (by reducing the productivity gap). The second is that, with such a focus, policy makers from Washington to Sacramento, Lansing, and Carson City must pursue policies that encourage investment and employment.

    Wendell Cox is a Visiting Professor, Conservatoire National des Arts et Metiers, Paris and the author of “War on the Dream: How Anti-Sprawl Policy Threatens the Quality of Life.

    Note 1: A detailed comparison of the unemployment (U-3) and underemployment (U-6) rates is provided by economist Ed Dolan. A useful chart comparing the two indicators, with numbers from June 2012 will be found on qz.com.

    Note 2: Vedder, Denhart and Robe also suggest the possibility of “over-investment,” as more students may have been encouraged to higher education levels than there are likely to be correspondingly appropriate jobs. The extent of such over-investment is not known.

    Unemployed woman photo by BigStockPhoto.com.

  • Cashing in on So Cal Culture

    Southern California has always been an invented place. Without a major river, a natural port or even remotely adequate water, the region has always thrived on reinventing itself – from cow town to agricultural hub to oil city, Tinsel Town and the “Arsenal of Democracy.”

    Today, the need for the region to reinvent itself yet again has never been greater. Due in large part to regulatory pressures, as well as competitive forces both global and national, many industries that have driven the Southland economy – notably, aerospace, garments and oil – are under assault. A high cost of living, particularly for housing, stymies potential in-migration and motivates industries to look elsewhere to locate or expand.

    As a result, virtually every key Southern California industry has been either stagnating or losing ground to competitors. More important, the area in the past decade has lost much of its appeal as a destination for both immigrants and young people, drying up a huge source of potential innovation.

    To put it in vaudeville terms, Southern California needs a new shtick. We must look to leverage our natural advantages (beyond just our climate) into a new economic paradigm that can withstand competition from the rest of the world and the rest of the country. This opportunity is best seen as the commercialization of culture. These include, as one recent Los Angeles County Economic Development Corp. report stated, “businesses and individuals involved in producing cultural, artistic and design goods and services.”

    This is not largely a matter of museums or concert venues. When it comes to the “fine” arts, Southern California is an increasingly respectable player, but cannot compete on equal footing with London, Paris, New York or Chicago, locales with far older endowments and, arguably, more people with refined artistic tastes. There is also growing competition from cash-rich wannabe cities, from Houston and Dallas to Shanghai, Beijing or Singapore. Fine art has always been for sale to the highest bidder.

    Where Southern California retains a decisive edge is in the popular arts – from casual fashion and industrial design to movies, television and commercials – which could provide the basis for a broad-based economic revival. This requires political and business leadership to shift from their obsession with downtown Los Angeles and dense building projects to a focus on nurturing long-term, sustainable employment.

    This demands that we do everything to maintain the quality of life, largely a matter of our region’s spread-out neighborhoods, that has always been our primary calling card to creative talent. Los Angeles, in particular, boasts by far the largest concentration of artists in the country. Overall, the “creative industries” account, according to a recent Otis Institute study, for roughly 337,000 direct jobs in the Los Angeles-Orange County region. Adding indirect employment, the study estimated these industries employed more than 642,000 people, more than the total employment of the Sacramento area.

    Each of these economic drivers deserves a closer look:

    Fashion

    Over the past quarter century, Los Angeles, with roughly three times as many establishments, has replaced New York as the nation’s garment capital. Most of these companies are small, but, together, the fashion industry across the five-county Southland region employs more than 100,000 people.

    In recent years, apparel manufacturing has been in decline, losing some 40,000 jobs. But there has been growth in such areas as clothing design and merchandising. The region has become the de facto capital for “fast forward” fashion, paced by firms such as Forever 21 Inc., Wet Seal and Papaya. Orange County, capital of the surfwear industry, is home to firms such as Oakley, Volcom, Hurley, Gotcha International, O’Neill, Raj Manufacturing, Mossimo and Stussy.

    These firms, and the businesses serving them, are expected to experience more growth in the coming years, according to the U.S. Bureau of Labor Statistics. Aided by the “onshoring” trend – returning jobs from overseas – and a demand for quicker product turnaround, the Southern California apparel industry seems poised to solidify its hold over the country’s fashions over the coming years.

    Entertainment

    This fashion industry derives much of its success from a link with Hollywood and the rest of the entertainment world. Accounting for more than 40 percent of all creative industry jobs, the entertainment complex is increasingly critical to the region’s resurgence. Much concern has been raised about the future of this key industry, whose growth has slowed, due in part to massive tax incentives from other states and countries.

    Despite this, the industry has been on something of an upswing recently, adding more than 4,600 jobs last year, a gain of 3.7 percent. At 129,700 jobs, employment in the industry is now at its highest level in four years but still tantalizingly below its levels in 2004 (132,200 jobs) and 1999 (146,300 jobs). Growth derives not so much from studio employment but from the ranks of independent contractors, now more than 85,000, well above the prerecession level. Nearly 80 percent of all new entertainment jobs are from the ranks of independent proprietors.

    Digital Arts

    The stabilization, and hopefully resurgence, of the entertainment sector could boost other industries, like digital media, hoping to play off the region’s extraordinary concentration of artists, specialists and story-tellers. Historically, Southern California, in large part due to a relative shortage of venture capital, has been playing catch-up with the Bay Area, and to a lesser extent, Seattle.

    The key to the future is combining other assets besides Hollywood, such as having the largest number of engineers – 70,000 – of any area in the country. Much hope has been placed on the rise of the much-ballyhooed “Silicon Beach” that follows the coastline, largely in Los Angeles, which some people claim is becoming a real competitor to Silicon Valley.

    Yet this is not the first time we have heard this story. Similar growth took place in past digital media waves, only to see reductions as the inevitable cratering takes place during market shake-outs. But employing the strong ties to the Hollywood creative community, there is the real prospect for the region to achieve a critical mass that will allow digital entrepreneurs to remain comfortably here rather than head up to Silicon Valley.

    Industrial Design

    Even as manufacturing employment has declined over time, improving recently to a level of mere stagnation recently, Southern California has maintain a leading position in industrial design. This field is expected to grow, both nationally and in the Southland.

    The area has maintained its leadership as center of automotive design, with studios such as the BMW Design Works, in Ventura, and Mercedes Advanced Design, in Carlsbad, as well as GM’s Advance Design Studio in North Hollywood. The fact that many international firms – for example, Hyundai (Fountain Valley), Kia (Irvine), Honda and Toyota – maintain their North American headquarters in the Southland provides a critical link to the expanding global auto market.

    Primacy in industrial design also extends into other product lines, such as furniture and household furnishings. If this design edge can be combined with automation and the onshoring of jobs, Southern California could enjoy a broad-based resurgence more sustainable than those of more-narrowly based economies, such as in New York or the Bay Area.

    Design of Life

    As we have seen over the past decade, local industries such as entertainment – not to mention fields like fashion, digital and industrial design – are going to be subject to enormous pressure from both home and abroad. China, for example, is building a massive $8.2 billion film studio in a concerted drive to replace Hollywood as the center of the world entertainment industry.

    If we lose our stranglehold on entertainment and other creative industries, there is very little hope for a regional resurgence. We lack the deep digital bench and funding sources of the Bay Area, or New York’s financial industry and its ability to dominate the news media. We can never be as cheap, or business friendly, as our emerging cultural rivals in the South, such as New Orleans, Nashville, Tenn., Austin, Texas, or Dallas, nor can we offer the kind of bargain-basement deals that desperate places, such as Detroit or Las Vegas, might offer to creative types.

    This means we have to focus on preserving and improving those very things – our cultural legacy and a predominately low-rise and flexible-work lifestyle – that differentiates us from far more congested, structured and often far-less pleasant locales like New York – and, even more so, China. In the past, this region has won the “design wars” by being itself, not by trying to create a faux vision that seeks to mimic Manhattan or Shanghai. Ultimately, Southern California can win only by playing the same aces that for generations have led the creative and the questioning to settle in our sun-drenched metropolis.

    Joel Kotkin is executive editor of NewGeography.com and Distinguished Presidential Fellow in Urban Futures at Chapman University, and a member of the editorial board of the Orange County Register. He is author of The City: A Global History and The Next Hundred Million: America in 2050. His most recent study, The Rise of Postfamilialism, has been widely discussed and distributed internationally. He lives in Los Angeles, CA.

    This piece originally appeared at The Orange County Register.

  • Thinking Outside the Rails on Transit

    To many in the transit business – that is, people who seek to profit from the development and growth of buses, trains and streetcars – Southern California is often seen as a paradise lost, a former bastion of streetcar lines that crossed the region and sparked much of its early development. Today, billions are being spent to revive the region’s transit legacy.

    Like many old ideas that attract fashionable support, this idea, on its surface, is appealing. Yet, in reality, the focus on mass transit, however fashionable, represents part of an expensive, largely misguided and likely doomed attempt to re-engineer the region away from its long-established dispersed, multipolar and auto-dependent form.

    Traditional transit works best when a large number of commuters work in a central district easily accessible by trains or buses. New York and Washington, D.C., where up to 20 percent of the regional workforces labor downtown (the central business district), are ideal for transit. Even in those metropolitan areas, however, the auto is king.

    In contrast, less than 3 percent of Southern Californians work in downtown Los Angeles. Overall, despite all the money sunk into new rail lines around the country, Americans’ transit commuting is overwhelmingly concentrated in a few older “legacy” cities. Altogether, 55 percent of transit work trips are to six core cities: New York, Chicago, Philadelphia, San Francisco, Boston and Washington, and 60 percent of those commutes are to downtown.

    In contrast, in the Los Angeles-Orange County region, barely 6 percent of workers take transit, one-fifth the rate in New York. Yet we’re a bunch of committed strap-hangers compared with Phoenix, Atlanta, Charlotte, N.C., and Dallas-Fort Worth, where, despite surfeits of new trains and streetcars, 2 percent or less of commuters use public transit. Even in Portland, Ore., widely proclaimed the exemplar of new urbanism and transit investment, the percentage of commuters taking transit is less today than in 1980. Portland is now contemplating cutbacks that could eventually eliminate up to 70 percent of its transit service.

    Imposing Past on Future

    This miserable record reflects how trains, a largely 19th century technology, have limited utility in a contemporary setting. Indeed, the only way to make it work, planners insist, is if the population is moved from their low-density neighborhoods to high-density “pack and stack” areas near transit stops, while suburban businesses are dragooned to denser downtown locations. This is the essence of the recently approved Bay Area Plan.

    Although these kinds of strategies have never materially reduced automobile use – the Bay Area Plan itself says automobile use will still increase by 18 percent over 30 years – the bureaucratic logic here is almost Stalinesque in the scope of its social-engineering ambitions. As Bay Area journalist and plan advocate John Wildermuth puts it, people know they should take transit but don’t because it’s very inconvenient. But by forcing three quarters of new residents into dense housing, some with no parking, he reasons, it then will be “easier for them to either give up their cars or, at least, use them a lot less.”

    Yet getting people to change their way of life, as many central planners have discovered, is not as easy as it seems. The highly dispersed San Jose-Silicon Valley area, the economic epicenter of the Bay Area and worldwide information technology, has a commute trip market share barely a third of major metropolitan area average… . Building “one of the longest” light rail systems in the United States in 50 years has barely moved the percentage of transit commuters over the past three decades.

    What the Bay Area Plan will probably accomplish is to boost housing prices ever further out of reach, both in urban areas and in the suburbs. With new single-family development effectively all but banned, prices of homes in the Bay Area already are again rising far faster than the national average and now are approaching two and half times higher, based on income, than in competitor regions such as Salt Lake City, Phoenix, Dallas-Fort Worth, Austin, Tex., Houston or Raleigh, N.C.

    Environmental Imperative?

    Greens and their allies in the high-density housing lobby long have suggested that “peak oil” and rising prices will inevitably drive suburbanites out their cars. But, clearly, recent advances in U.S. oil and natural gas production may have already made this moot. Transit activists increasingly have focused on climate change to justify massive spending on expanding transit and forcing recalcitrant suburbanites from their cars.

    This logic is largely based on the notion that suburbanites must travel greater distances to work. Yet, a study by McKinsey & Co. and the Conference Board found that – largely because of the impact of higher energy standards for cars forecast by the Department of Energy – sufficient greenhouse gas emission reductions can be achieved without reducing driving or necessitate “a shift to denser urban housing.”

    The fundamental limitations of transit in dispersed cities further weakens environmentalists’ claim. Ridership on some transit systems is so sparse that cars are more energy efficient. Then, there’s the oft-mistaken assumption that higher-density housing will reduce congestion and travel. But in multipolar areas like Southern California, traffic congestion and resultant pollution generally becomes worse with higher density.

    There may be other, more technologically savvy ways to reduce emissions and energy use. People have cut automobile use the past three years but their reduced travel is not showing up so much in transit usage, but, rather, is driven by other factors such as unemployment and the high price of gasoline.

    But, arguably the biggest reduction can be traced to the rise of telecommuting. Over the past decade, the country added some 1.7 million telecommuters, almost twice the much-ballyhooed increase of 900,000 transit riders. In Southern California, the number of home-based workers grew 35 percent, three times the increase for transit usage. By 2020, according to projections from demographer Wendell Cox, telecommuting should pass transit, both nationally and in this region, in total numbers.

    What About the Poor?

    Perhaps the most compelling argument for transit stems from serving those populations – the poor, students, minorities – who often lack access to a private car. Yet, for workers in newer cities, public transit often is not an effective alternative. Brookings Institution research indicates that less than 5 percent of the jobs in the Los Angeles and Riverside-San Bernardino areas are within reach of the average employee within 45 minutes, using transit. The figure is less than 10 percent in the San Jose metropolitan area, the same percentage as for cities nationwide. Moreover, 36 percent of entry-level jobs are completely inaccessible by public transit.

    Not surprisingly, roughly three in four poorer workers use cars to get to work. Recent work by University of Southern California researcher Jeff Khau finds that car ownership is positively correlated with job opportunities; no such relationship can be proven with access to transit.

    At the same time, we should look at more-flexible systems, notably, expanded bus and bus rapid transit, which work better in dispersed areas and are less costly. Most rail systems tend to cannibalize most of their riders from existing bus lines, which explains the small net increases in total transit ridership.

    Transit too expensive

    Costs matter, and will become more important as cities and counties face the looming threat of fiscal defaults. In this respect, rail systems essentially steal from other transit – notably, the buses used mostly by the poor – and from hard-pressed city and county general-fund budgets. Gov. Jerry Brown’s outrageously expensive high-speed rail, which will principally serve the affluent, takes this unfairness to an extreme.

    Instead, we should push far more cost-effective ways to provide transportation options, including those from the private sector, such as the successful Megabus, which provides efficient, quicker and far-less expensive transport between cities than either existing rail or short-haul airline flights. USC’s Khau suggests the private sector also could enhance solutions for lower-income commuters through car loans and car-sharing services such as ZipCar and and Lyft, a mobile app that links riders with drivers.

    As we attempt to figure out ways to improve both the environment and people’s economic prospects, innovative 21st century solutions – from telecommuting to car-sharing – may prove more effective than relying on the 19th century technology of rail. We should not blindly follow transit ideology but focus on how to improve people’s mobility in ways other than the overpriced, inefficient and often far-less-equitable solutions being bandied about today.

    Joel Kotkin is executive editor of NewGeography.com and Distinguished Presidential Fellow in Urban Futures at Chapman University, and a member of the editorial board of the Orange County Register. He is author of The City: A Global History and The Next Hundred Million: America in 2050. His most recent study, The Rise of Postfamilialism, has been widely discussed and distributed internationally. He lives in Los Angeles, CA.

    This piece originally appeared at The Orange County Register.

    Photo by biofriendly, Metro Bus Campaign, Los Angeles

  • The Next Urban Crisis, And How We Might Be Able To Avoid It

    Urban boosters are rightly proud of the progress American cities have made since their nadir in the 1970s; Harvard economist Ed Glaeser has gone so far as to proclaim “the triumph of the city.” Yet recent events — notably Detroit’s bankruptcy and the victory of left-wing populist Bill de Blasio in the Democratic primary of the New York mayoral election — suggest that the urban future may prove far more problematic than commonly acknowledged.

    Detroit’s bankruptcy revealed the unsustainable fiscal problems facing most major urban centers, including, most importantly, President Obama’s political base of Chicago. This summer, Moody’s downgraded the Windy City’s credit rating three notches, noting the unsustainable nature of its pension obligations. Some 37 cities have filed for bankruptcy since 2010, most of them small, and as many as 20 others may be on the verge, including larger places like the California cities of Oakland and Fresno, and Providence, R.I.

    My hometown of Los Angeles may not be far behind. Perhaps the most union-dominated big city in America, the City of Angels’ pension obligations have gone from 3% of the city budget a decade ago to 18% last year. They are rising at a phenomenal 25% annual rate, according to a recent report by an independent watchdog, California Common Sense.

    Given this background, the political tides in New York suggest a worsening of the crisis. Thanks to the Bernanke-inspired Wall Street boom, the New York economy has not suffered the extreme fiscal distress of other big cities. But its fiscal condition is far worse than Mayor Michael Bloomberg and his well-oiled media machine might suggest. Under Bloomberg city spending grew 55% while pension costs have grown 300%.

    With de Blasio likely to be the next mayor, we can expect the bleeding to get worse. Many business people rightly fear a de Blasio’s administration will raise taxes in order to meet public employee demands. Faced with financial shortfalls, de Blasio’s response, notes historian Fred Siegel, is likely to be similar to that of his hero, former Mayor David Dinkins, who consistently gave in to public unions and raises taxes.

    But it’s not enough to dismiss de Blasio as a throwback. His victory reveals the depth of a profound social crisis beneath the glitz and glitter of Bloomberg’s luxury city. Similar class and geographic divisions can be seen throughout the country but inequality seems most egregious in New York. A recent analysis of inequality by University of Washington demographer Richard Morrill found New York to be the least egalitarian big metro area in America.

    This is borne out by other research: the New York City comptroller’s office found that the top 1% account for roughly a third of Gotham’s income, twice as high a share as in the rest of the country. Incomes have surged on Wall Street but most New Yorkers — two-thirds of whom are racial minorities — have struggled to keep pace. Controlling for cost, in fact, the New Yorker’s average paycheck is among the lowest among the nation’s 51 largest metro areas. Nearly half the city’s residents, notes theNation, are either below the poverty line or just above it.

    Bloomberg’s policy focus on ultra-dense development geared to Wall Street, the global rich, and the needs of the all-powerful, largely Manhattan real estate community has done very little for the vast majority of New Yorkers. This reality has lent credibility to de Blasio’s “tale of two cities ” stump speech and the growing rejection of Bloomberg’s legacy.

    Not that all of this can be laid at Bloomberg’s feet. New York’s economy has been changing for decades. New York of the 1950s was a manufacturing, trade and fashion superpower, employing hundreds of thousands of middle- and working-class residents. Large corporations employed large numbers of white- and pink-collar workers. This made New York, although always with its extremes, still a very middle- and working-class city.

    New York’s blue-collar economy has withered to a degree unmatched in most other U.S. cities. The port, the city’s original raison d’etre , lost its primacy to Los Angeles-Long Beach by 1980 and now ranks third in cargo value behind Houston-Galveston as well. The manufacturing sector, which employed a million in 1950, has shriveled to 73,000 jobs today (note that a small part of the decline is due to the BLS’ reclassification of some jobs to other sectors, and other statistical changes). Manufacturing employment in NYC has shrunk 39% since 2004, the worst performance of any major metropolitan area.

    A similar, albeit less dramatic decline has occurred in white-collar employment, in part due to the movement of large companies out of the city. In 1960 New York City boasted one out of every four Fortune 500 firms; today there are 46. And even among those keeping their headquarters in Gotham, many have shipped most of their back office operations elsewhere. Employment has even dropped in the “booming” financial sector, down 7.4% since 2007. The big employment gains have been almost entirely concentrated in the low-wage hospitality and retail sectors.

    If inequality is now greater in New York, the overall economic situation in other cities is, if anything, worse. New York at least has Wall Street, media and a constant infusion of wealth from the rest of world to keep its economy going and stave off the bond-holders. Yet even New York’s economy is underperforming its periphery. The city’s unemployment rate is 8.7% while the surrounding suburbs stand at 7.5%. This gap exists in almost all major metropolitan areas ; among the 51 largest metros the core unemployment rate is 8.8 percent compared to 7.1% in the suburbs.

    The gap is wider in other major cities. In the Chicago area, unemployment in the city is 2 percentage points higher than in the suburbs; in Los Angeles, the city unemployment rate is near 12%, three points higher than in suburbs. This, of course, all pales to Detroit where the city jobless rate stands at over 18% compared to 10% in the suburbs.

    Rather than “cure poverty” or export it to the suburbs, as is regularly claimed, cities retain a poverty rate twice as high as in the suburbs. And although hipsters and the global rich dominate media coverage, the vast majority of the population growth in urban cores over the past decade — upward of 80% — has come not from hipsters but the poor.

    These woes have been largely ignored by the press, but, as de Blasio’s primary victory shows, cannot be hidden forever. True, big investments aimed at attracting the “hip and cool” urban element have helped real estate speculators in selected districts, but has precious little positive impact on the neighborhoods where most urbanities reside.

    Unless addressed, the inequality in core cities suggests a similar lurch to the left could be seen in other cities. What is needed now is a new strategy that promotes the kind of broad-based economic growth that would make the urban “triumph” more than an empty one.

    This story originally appeared at Forbes.

    Joel Kotkin is executive editor of NewGeography.com and Distinguished Presidential Fellow in Urban Futures at Chapman University, and a member of the editorial board of the Orange County Register. He is author of The City: A Global History and The Next Hundred Million: America in 2050. His most recent study, The Rise of Postfamilialism, has been widely discussed and distributed internationally. He lives in Los Angeles, CA.

    Photo courtesy of Bill de Blasio.

  • A Map Of America’s Future: Where Growth Will Be Over The Next Decade

    The world’s biggest and most dynamic economy derives its strength and resilience from its geographic diversity. Economically, at least, America is not a single country. It is a collection of seven nations and three quasi-independent city-states, each with its own tastes, proclivities, resources and problems. These nations compete with one another – the Great Lakes loses factories to the Southeast, and talent flees the brutal winters and high taxes of the city-state New York for gentler climes – but, more important, they develop synergies, albeit unintentionally. Wealth generated in the humid South or icy northern plains benefits the rest of the country; energy flows from the Dakotas and the Third Coast of Texas and Louisiana; and even as people leave the Northeast, the brightest American children, as well as those of other nations, continue to migrate to this great education mecca.

    The idea isn’t a new one – the author Joel Garreau first proposed a North America of “nine nations” 32 years ago – but it’s never been more relevant than it is today, as America’s semi-autonomous economic states continue to compete, cooperate … and thrive. Click on the thumbnail of our map to see our predictions for the job, population and GDP growth of these 10 regional blocks over the next decade, and read on below for more context.

    View the map graphic at Forbes.com.


    INLAND WEST

    The Inland West extends from the foothills of the Rockies to the coastal ranges that shelter the Pacific Coast. This is the West as we understand it historically, a land of spectacular scenery: icecaps and dry lands, sagebrush, high deserts and Alpine forests. From 2003 to 2013, it enjoyed the most rapid population growth in the nation: 21%. It is expected to continue to outgrow the rest of the country over the next decade, as the area boasts the highest percentage of young people under 20 in the U.S.

    Much of this growth was driven by a combination of quality of life factors — access to the outdoors and relatively low housing prices — as well as strong economic fundamentals. Over the past decade the area has enjoyed nearly 8% job growth, the strongest in the country, with the highest rate of STEM growth in the nation over the past decade.  Boise, Denver and Salt Lake City have posted stellar employment growth due to the energy boom and growth in technology. The western reaches of the region — the inland parts of Washington, Oregon and California — have not done as well. These areas suffer from being “red” resource- and manufacturing-oriented economies within highly regulated, high-tax “blue states.”

    THE LEFT COAST

    The Northeast may still see itself as the nation’s intellectual and cultural center, but it is steadily losing that title to the Left Coast. This region sports a unique coastal terroir, with moderate temperatures, though it may be a bit rainy in the north. The climate requires less power than elsewhere in the country for heating and air-conditioning, making its residents’ predilection for green energy more feasible.

    Over the past 20 years, the Left Coast — the least populous nation with some 18 million people — has rocketed ahead of the Northeast as a high-tech center. It has by far the highest percentage of workers in STEM professions — more than 50% above the national average — and the largest share of engineers in its workforce as well. No place on the planet can boast so many top-line tech firms: Amazon and Microsoft in the Seattle area, and in the Bay Area, Intel, Apple, Facebook and Google, among others.

    Over the next decade, the Left Coast should maintain its momentum, but ultimately it faces a Northeast-like future, with a slowing rate of population growth. High housing prices, particularly in the Bay Area, are transforming it into something of a gated community, largely out of reach to new middle-class families. The density-centric land use policies that have helped drive up Bay Area prices are also increasingly evident in places like Portland and Seattle. The Left Coast has the smallest percentage of residents under 5 outside the Great Lakes and the Northeast, suggesting that a “demographic winter” may arrive there sooner than some might suspect.

    CITY-STATE LOS ANGELES

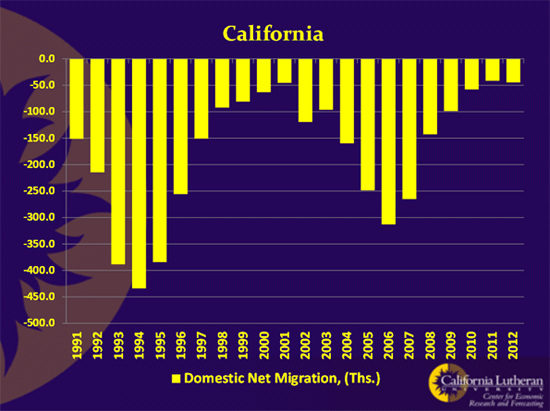
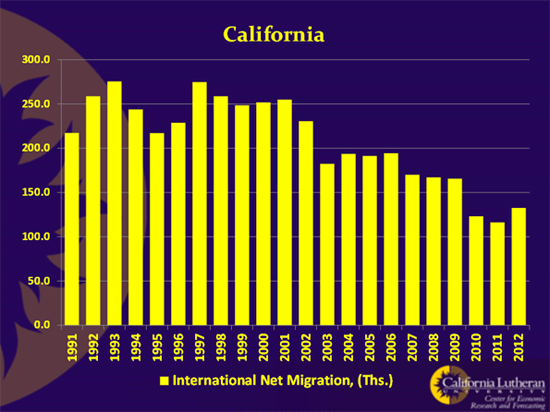
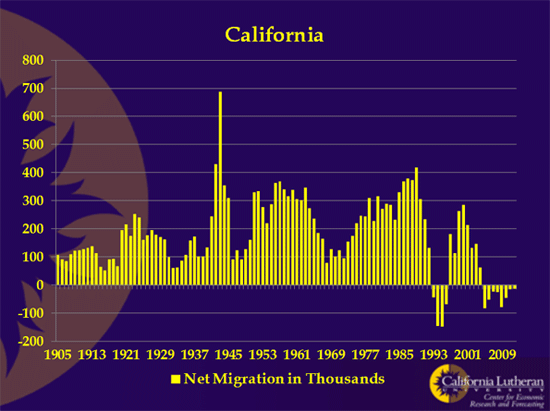
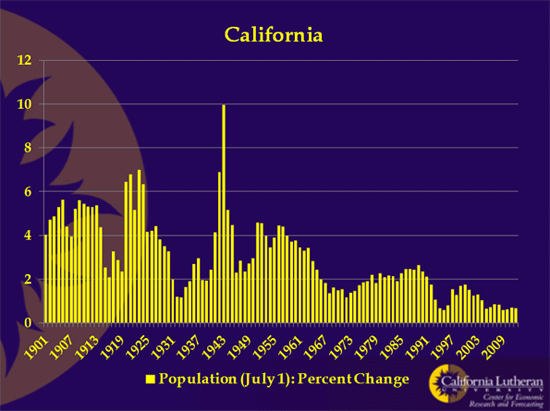
    Once called “an island on the land,” southern California remains distinct from everywhere else in the country. Long a lure for migrants, it has slipped in recent decades, losing not only population to other areas but whole industries and major corporations. The once-youthful area is also experiencing among the most rapid declines in its under-15 population in the nation. Yet it retains America’s top port, the lion’s share of the entertainment business, the largest garment district–and the best climate in North America.

    THE GREAT PLAINS

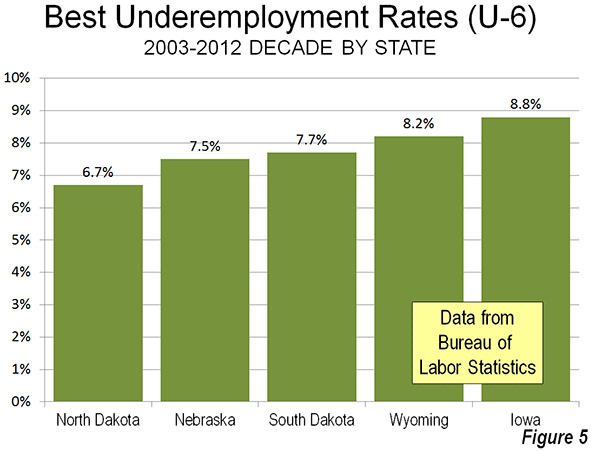
    The vast region from Texas to Montana has often been written off as “flyover country.” But in the past decade, no nation in America has displayed greater economic dynamism. Since the recession, it has posted the second-fastest job growth rate in the U.S., after the Inland West, and last year it led the country in employment growth. The Dakotas, Nebraska, Oklahoma and Kansas all regularly register among the lowest unemployment rates in the country.

    The good times on the Plains are largely due to the new energy boom, which has been driven by a series of major shale finds: the Bakken formation in North Dakota, as well as the Barnett and Permian in Texas. The region’s agricultural sector has also benefited from soaring demand in developing countries.

    Most remarkable of all has been the Plains’ demographic revival. The region enjoyed a 14% increase in population over the past 10 years, a rate 40% above the national average, and is expected to expand a further 6% by 2023, more than twice the projected growth rate in the Northeast. This is partly due to its attractiveness to families — the low-cost region has a higher percentage of residents under 5 than any other beside the Inland West.

    But outside of the oil boom towns, don’t expect a revival of the small communities that dot much of the region. The new Great Plains is increasingly urbanized, with an archipelago of vibrant, growing cities from Dallas and Oklahoma City to Omaha, Sioux Falls and Fargo.

    Its major challenges: accommodating an increasingly diverse population and maintaining adequate water supplies, particularly for the Southern Plains. The strong pro-growth spirit in the region, its wealth in natural resources and a high level of education, particularly in the northern tier, suggest that the Plains will play a far more important role in the future than anyone might have thought a decade ago.

    THE THIRD COAST

    Once a sleepy, semitropical backwater, the Third Coast, which stretches along the Gulf of Mexico from south Texas to western Florida, has come out of the recession stronger than virtually any other region. Since 2001, its job base has expanded 7%, and it is projected to grow another 18% the coming decade.

    The energy industry and burgeoning trade with Latin America are powering the Third Coast, combined with a relatively low cost, business-friendly climate. By 2023 its capital–Houston–will be widely acknowledged as America’s next great global city. Many other cities across the Gulf, including New Orleans and Corpus Christi, are also major energy hubs. The Third Coast has a concentration of energy jobs five times the national rate, and those jobs have an average annual salary of $100,000, according to EMSI.

    As the area gets wealthier, The Third Coast’s economy will continue to diversify. Houston, which is now the country’s most racially and ethnically diverse metro area, according to a recent Rice study, is home to the world’s largest medical center and has dethroned New York City as the nation’s leading exporter. Mobile, Ala., seems poised to become an industrial center and locus for trade with Latin America, and New Orleans has made a dramatic comeback as a cultural and business destination since Katrina.

    THE GREAT LAKES

    The nation’s industrial heartland hemorrhaged roughly a million manufacturing jobs over the past 10 years, making it the only one of our seven nations to lose jobs overall during that period. But the prognosis is not as bleak as some believe.

    Employment is growing again thanks to a mild renaissance in manufacturing, paced by an improving auto industry and a shale boom in parts of Ohio. The region has many underappreciated assets, such as the largest number of engineers in the nation, ample supplies of fresh water and some of the nation’s best public universities. With fifty-eight million people, it boasts an economy on a par with that of France.

    Yet we cannot expect much future population growth in the Great Lakes, the second most populous American nation. Its population is aging rapidly, and the percentage under 5 is almost as low as the Northeast.

    THE GREAT NORTHEAST

    The Northeast–which excludes the city-state of New York–has been the country’s brain center since before the American Revolution. This region is home to some 41 million people, and leads the nation in the percentage of workers engaged in business services, as well as in jobs that require a college education. With average wages of $76,000, $19,000 above the national average, the area boasts a GDP of $2.2 trillion, about equal to that of Brazil.

    The Northeast is one of the country’s whitest regions — Anglos account for over 70% of the population — and one of the wealthiest. In many ways, it resembles aging Western Europe in its demographic profile. The Northeast is the most child-free region outside the retirement hub of south Florida. Coupled with sustained domestic out-migration, its population growth is likely to be among the slowest in the nation in the decade ahead.

    Good thing its residents are highly educated — diminishing numbers and the consequent decline in political power suggest that the Northeast may need to depend more on its wits in decade ahead.

    CITY-STATE NEW YORK

    The Big Apple’s much heralded comeback has assured its place as one of the world’s great global cities. But the city faces challenges in terms of soaring indebtedness, rapid aging, a weak technical workforce, expensive housing and high taxes. It also will struggle with competition from rising cities of the other nations such as San Francisco, Seattle, Washington, D.C., and Houston, each of which threatens New York’s traditional role in key sectors of the economy.

    THE SOUTHEAST MANUFACTURING BELT

    At the time of the Civil War the southeastern United States was both outpeopled and outmanufactured. Today the Southeast, is the largest region in terms of population (60 million) and is establishing itself as the country’s second industrial hub, after the Great Lakes.

    It is attracting large-scale investment from manufacturers from Germany, Japan, and South Korea. Although most of the region still lags in educational attainment, the education gap with the Northeast and Great Lakes is slowly shrinking. The population holding college degrees has been expanding strongly in Nashville, Raleigh, Birmingham, Richmond and Charlotte.

    More babies and the migration of families, including immigrants, to this low-cost region suggest an even larger political footprint for the Southeast in the decades ahead. Population growth has been more than twice as fast since 2001 as in the Northeast, a trend that is projected continue in the next decade. The region looks set to become smarter, more urban and cosmopolitan, and perhaps a bit less conservative.

    CITY-STATE MIAMI

    Greater Miami often seems more the capital of Latin America than it does an American region. Its population is heavily Hispanic, and trade, finance, construction and tourism tend to focus southward. But Miami faces the constraints of an aging, and largely childless, population–which means it will continue to rely on newcomers both from abroad and from the colder regions of the U.S.

    This story appears in the September 23, 2013 issue of Forbes.

    Joel Kotkin is executive editor of NewGeography.com and Distinguished Presidential Fellow in Urban Futures at Chapman University, and a member of the editorial board of the Orange County Register. He is author of The City: A Global History and The Next Hundred Million: America in 2050. His most recent study, The Rise of Postfamilialism, has been widely discussed and distributed internationally. He lives in Los Angeles, CA.

    Mark Schill is Vice President of Research at Praxis Strategy Group, an economic development and research firm working with communities and states to improve their economies.

  • Southern California’s Road Back

    If the prospects for the United States remain relatively bright – despite two failed administrations – how about Southern California? Once a region that epitomized our country’s promise, the area still maintains enormous competitive advantages, if it ever gathers the wits to take advantage of them.

    We are going to have to play catch-up. I have been doing regional rankings on such things as jobs, opportunities and family-friendliness for publications such as Forbes and the Daily Beast. In most of the surveys, Los Angeles-Orange County does very poorly, often even worse than much-maligned Riverside and San Bernardino. For example, in a list looking at “aspirational cities” – that is places to move to for better opportunities – L.A.-Orange County ranked dead last, scoring well below average in everything from unemployment to job creation, congestion and housing costs relative to incomes.

    Yet, Southern California possesses unique advantages that include, but don’t end at, our still-formidable climatic and scenic advantages. The region is home to the country’s strongest ethnic economy, a still-potent industrial-technological complex and the largest culture industry in North America, if not the world.

    In identifying these assets, we have to understand what we are not: Silicon Valley-San Francisco, or New York, where a relative cadre of the ultrarich, fueled by tech IPOs or Wall Street can sustain the local economy. Unlike the Bay Area, in particular, our economy must accommodate a much larger proportion of poorly educated people – almost a quarter of our adult population lacks a high school degree. This means our economy has to provide opportunities for a broader range of skills.

    Nor are we a corporate center such as New York, Houston, Dallas or Chicago. We remain fundamentally a hub for small and ethnic businesses, home to a vast cadre of independent craftspeople and skilled workers, many of whom work for themselves. In fact, our region – L.A.-Orange and Riverside-San Bernardino – boasts the highest percentage of self-employed people of any major metropolitan area in the country, well ahead of the Bay Area, New York and Chicago.

    Policy from Washington has not been favorable to this grass-roots economy. The “free money for the rich” policy of the Bernanke Federal Reserve has proven a huge boom to stock-jobbers and venture firms but has not done much to increase capital for small-scale firms. Yet it is to these small firms – dispersed, highly diverse and stubbornly individualistic – that remain our key long-term asset, and they need to become the primary focus on regional policy-makers.

    Ethnic Networks

    Immigration has slowed in recent years but the decades-long surge of migration, largely from Asia and Mexico, has transformed the area into one of the most diverse in the world. More to the point, Southern California has what one can call diversity in depth, that is, huge concentrations of key immigrant populations – Korean, Chinese, Mexican, Salvadoran, Filipino, Israeli, Russian – that are as large or larger than anywhere outside the respective homelands. Foreigners also account for many of our richest people, with five of 11 of L.A.’s wealthiest being born abroad.

    These networks are critical in a place lacking a strong corporate presence. Our international connections come largely as the result of both the ethnic communities as well as our status as the largest port center in North America, which creates a market for everything from assembly of foreign-made parts to trade finance and real estate investment. Southern California may be a bit of a desert when it comes to big money-center banks, but it’s home to scores of ethnic banks, mainly Korean and Chinese, but also those serving Israeli, Armenian and other groups.

    For the immigrants, what appeals about Southern California is that we offer a diverse, and dispersed, array of single-family neighborhoods. Both national and local data finds immigrants increasingly flocking to suburbs. Places like the San Gabriel Valley’s 626 area, Cerritos, Westminster, Garden Grove, Fullerton and, more recently, Irvine, have expanded the region’s geography of ethnic enclaves.

    These enclaves drive whole economies, such as Mexicans in the wholesale produce industry or the development of electronics assembly and other trade-related industry by migrants largely from Taiwan. Global ties are critical here. Korean-Americans started largely in ethnic middleman businesses, but have been moving upscale, as their children acquire education. They, in turn, have helped attract investment from South Korea’s rising global corporations, including a new $200 million headquarters for Hyundai in Fountain Valley, as well as a $1 billion, 73-story new tower being built by Korean Air in downtown Los Angeles.

    Tech Industrial Base

    During the Cold War, Southern California sported one of the largest concentrations of scientists and engineers in the world. The end of the Cold War, at the beginning of the 1990s, severely reduced the region’s technical workforce, a process further accelerated by the movement out of the region of such large aerospace firms as Lockheed and Northrop. The region has roughly 300,000 fewer manufacturing jobs than it had a decade ago, largely due to losses in aerospace as well as in the garment industry.

    Yet, despite the decades-long erosion, Southern California still enjoys the largest engineering workforce – some 70,000 people – in the country. It also graduates the most new engineers, although the vast majority of them appear to leave for greener pastures. One looming problem: a paucity of venture capital, where the region lags behind not just the Bay Area, but also San Diego and New York. This can be seen in the relative dearth of high-profile start-ups, particularly in fields like social media, now dominated by the Bay Area.

    But the process of recovery in Southern California does not require imitating Silicon Valley. Instead we need to leverage our existing talent base – and recent graduates – and focus on the region’s traditional strength in the application of technology. A recent analysis of manufacturing by the economic modeling firm EMSI found strong growth in some very promising sectors, including the manufacturing of surgical and medical equipment, space vehicles and a wide array of food processing, an industry tied closely to the immigrant networks.

    Cultural Complex

    For most Americans, and even more so among foreigners, the image of Southern California is shaped by its cultural exports, not only in film and television but in fashion and design. This third sector epitomizes the uniqueness of the region, and provides an economic allure that can withstand both the generally poor business climate and the incentives offered by other regions.

    After a period of some stagnation, Hollywood again is increasing employment. Roughly 130,000 people work in film-related industries in Los Angeles, which is now headed back to levels last seen a decade earlier but still well below the 146,000 jobs that existed in 1999.

    At the same time, the sportswear and jeans business in Los Angeles, and the surfwear industry in Orange County, remain national leaders. Overall, the area’s fashion industry has retained a skilled production base – over twice that of rival New York’s – and has been aided, in part, by access to Hollywood, lower rents and labor costs than in New York.

    Taken together, these sectors – ethnic business, sophisticated manufacturing and culture – could provide the basis for a renaissance in the local economy. The smaller firms in these fields, in particular, need a friendlier business climate, a more evolved skills-training program from local schools and a better-maintained infrastructure. More than anything, though, they require an understanding on the part of both government and business that their success remains the best means to reverse decades of relative decline.

    Joel Kotkin is executive editor of NewGeography.com and Distinguished Presidential Fellow in Urban Futures at Chapman University, and a member of the editorial board of the Orange County Register. He is author of The City: A Global History and The Next Hundred Million: America in 2050. His most recent study, The Rise of Postfamilialism, has been widely discussed and distributed internationally. He lives in Los Angeles, CA.

    This piece originally appeared at The Orange County Register.

  • Manufacturing in Los Angeles: A Test Case in Why Increasing Concentration Isn’t Always a Positive

    What comes to mind when you think of Los Angeles’ big industries? Motion pictures and other entertainment sectors, yes. Real estate and corporate headquarters, too. But probably not manufacturing.

    No other sector, however, contributes more to the Los Angeles metro area’s gross regional product – the final market value of all goods and services in a region – than manufacturing. It accounted for 11% of L.A.’s GRP in 2012, narrowly beating out the real estate and rental and leasing sector (10%).

    Manufacturing is also the fourth-largest major industry sector in Los Angeles by employment, with nearly 535,000 jobs. But the manufacturing labor market has taken a beating in L.A. — and the downward spiral began years before the Great Recession. In 2001, in fact, manufacturing was the largest sector in L.A., accounting for more than 800,000 jobs, many of which were centered in two sub-industries: computer/electronic products and apparel.

    The Apparel Manufacturing Story

    Apparel manufacturing is a particularly interesting case study for L.A. manufacturing as a whole. Nearly 10% of all manufacturing jobs in the Los Angeles metro — a little over 52,000 —  are in this subsector. And 40% of workers in apparel manufacturing are sewing machine operators whose overall median earnings in L.A. are $9.48 per hour.

    ApparelMfg

    Jobs in apparel manufacturing have declined 43% in Los Angeles since 2001, a reduction of some 40,000 jobs. But nationally, the industry has fared worse; it’s lost 63% of its workforce since 2001. This explains why the concentration of apparel manufacturing jobs in L.A., as measured by location quotient, is actually increasing, despite the heavy local cutbacks.

    ApparelMfg2L.A. has 7.8 times the national average of these jobs, after having 4.9 times the national average in 2001. Looking at it another way, a third of all apparel manufacturing jobs in America are in the Los Angeles metro (and 89% of these jobs in California are in L.A.).

    Why has L.A.’s concentration increased so much? Because location quotient compares the industry’s share of regional employment with its share of national employment. In this case, apparel manufacturing is dwindling as a share of all jobs nationally and in L.A. But the rate of decline hasn’t been as sharp in Los Angeles as it has been in the nation.

    In many cases, a high concentration like apparel manufacturing’s in L.A. signals that it’s a key local industry. And to be sure, apparel manufacturing still has a large presence and helps bring money into the region. Further, there are sub-industries inside apparel manufacturing that are adding jobs. But this is an example of why increasing concentration isn’t always a positive.

    Many firms have moved apparel manufacturing operations overseas, and the jobs that have remained in the U.S. are mostly unappealing: low-wage, low-skill, with little career potential. In L.A., the average earnings per job in apparel manufacturing is $44,859 — a figure that includes workers at all levels, from management to the production floor. That annual salary is only slightly higher than the national average ($43,947).

    Compare the above numbers to industries with increasing employment and increasingconcentration. The following are some of the real emerging industries in L.A., and most pay well, too:

    • Other scientific and technical consulting services, a professional services industry that has doubled in concentration since 2001 and added the third-most jobs of any detailed industry in L.A. over that time. This industry pays $60,828 per job and has gone from 6,900 jobs in 2001 to over 42,000 in 2013.
    • Port and harbor operations. This industry is 14 times more concentrated in L.A. than the nation, and it’s grown 27% since 2001. (Plus, average earnings are $111,650.)
    • Surgical and medical instrument manufacturing, which has more than doubled in employment and concentration in L.A. And it requires a diverse and mostly high-skilled workforce that is paid well.

    And while it’s hard to label entertainment industries in L.A. as “emerging,” there are a stream of related industries that fit the criteria of high growth and increasing specialization. Most notably, teleproduction and other postproduction services (11.5 times more concentrated than nation; 19% growth), motion picture and video production (10.3 times more concentrated; 31% growth, though it’s declined 2008), and agents and managers for artists, athletes, entertainers, and other public figures (7 times more concentrated; 59% growth) fit that mold.

    Other Manufacturing Sectors in L.A.

    We’ve focused on apparel manufacturing, and briefly touched on surgical and medical instrument manufacturing. The performance of other detailed manufacturing industries is also worth noting. In all, 352 of the 472 manufacturing subsectors classified by the U.S. Census Bureau have lost jobs since 2001 in Los Angeles. The two most notable declines have come aircraft manufacturing (-16,502 jobs, a 50% loss) and search, detection, navigation, guidance, aeronautical, and nautical system and instrument manufacturing (-15,664 jobs, a 42% loss). Both used to be major industries in L.A., and both have bled high-paying jobs.

    But there are growth areas in L.A.’s manufacturing scene. The following table shows 17 detailed industries that have added at least 500 jobs since 2001 in L.A., topped by surgical and medical instrument manufacturing:

    NAICS Code Description 2001 Jobs 2013 Jobs Change % Change 2001 National Location Quotient 2013 National Location Quotient 2013 Avg. Earnings Per Job 2012 Establishments
    Source: QCEW Employees, Non-QCEW Employees & Self-Employed – EMSI 2013.2 Class of Worker
    339112 Surgical and Medical Instrument Manufacturing 4,861 11,268 6,407 132% 1.05 2.15 $128,685 82
    315232 Women’s and Girls’ Cut and Sew Blouse and Shirt Manufacturing 2,151 7,046 4,895 228% 6.43 21.26 $49,550 165
    336414 Guided Missile and Space Vehicle Manufacturing 8,131 11,594 3,463 43% 3.54 5.11 $157,273 29
    312111 Soft Drink Manufacturing 3,089 5,398 2,309 75% 0.81 1.71 $86,690 29
    339116 Dental Laboratories 3,749 6,026 2,277 61% 1.63 2.8 $56,424 345
    311991 Perishable Prepared Food Manufacturing 1,581 3,666 2,085 132% 1.62 2.35 $39,344 50
    311941 Mayonnaise, Dressing, and Other Prepared Sauce Manufacturing 476 1,429 953 200% 0.86 2.46 $68,096 19
    334419 Other Electronic Component Manufacturing 4,647 5,563 916 20% 1.19 2.18 $80,262 90
    311811 Retail Bakeries 6,339 7,156 817 13% 1.8 2.08 $26,520 488
    336112 Light Truck and Utility Vehicle Manufacturing 13 805 792 6092% 0 0.45 $73,522 5
    333996 Fluid Power Pump and Motor Manufacturing 1,247 2,022 775 62% 1.26 2.52 $108,005 13
    332722 Bolt, Nut, Screw, Rivet, and Washer Manufacturing 6,906 7,677 771 11% 3.19 4.83 $78,025 65
    332912 Fluid Power Valve and Hose Fitting Manufacturing 3,042 3,659 617 20% 1.56 2.41 $96,089 46
    336415 Guided Missile and Space Vehicle Propulsion Unit and Propulsion Unit Parts Manufacturing 425 957 532 125% 0.82 2.2 $125,893 6
    335129 Other Lighting Equipment Manufacturing 780 1,305 525 67% 1.37 3.39 $68,257 31
    331111 Iron and Steel Mills 503 1,020 517 103% 0.1 0.27 $55,782 37
    334510 Electromedical and Electrotherapeutic Apparatus Manufacturing 4,623 5,135 512 11% 2 2.15 $99,271 70


    Notice the second industry on the list — women’s and girls’ cut and sew blouse and shirt manufacturing. It’s part of the declining apparel manufacturing sector, but it’s one of the rare growth subsectors that we mentioned above. And also of note is guided missile and space vehicle manufacturing, which has made an 86% jump in jobs since 2010 and pays big wages. This industry would no doubt also fall in the emerging category, given it’s increasing concentration and employment.

    Joshua Wright is an editor at EMSI, an Idaho-based economics firm that provides data and analysis to workforce boards, economic development agencies, higher education institutions, and the private sector. He manages the EMSI blog and is a freelance journalist. Contact him here.

  • Observations on Urbanization: 1920-2010

    Ninety years have made a world of difference in the United States. Between 1920 and 2010, the nation’s population nearly tripled. But that was not the most important development. Two other trends played a huge role in shaping the United States we know today. The first trend was increasing urbanization, a virtually universal trend, but one which occurred earlier in the high income countries, while the other was a rapidly falling average household size. 

    National Trends

    In 1920, the United States had just crossed the same 50 percent urbanization threshold that China recently crossed. By 2000, the United States was 81 percent urban. 

    The second trend was even more significant. Average household size has fallen from 4.6 in 1920 to 2.6 by 2000, where it remained in the 2010 census. The result is that there are now 7.7 times as many households (Note 1) in urban areas as there were in 1920 (Figure 1).

    Urban Area Trends

    In the 1960s, the Urban Land Institute sponsored research by Jerome P. Pickard (Note 2) to replicate urban area population and density data going back to 1920, using the generalized criteria that had been developed by the Census Bureau for the 1950 and 1960 censuses.

    According to Pickard’s work, there were five urban areas in the United States with more than 1 million population in 1920. Unfortunately, the publication did not include Detroit, which undoubtedly had an urban area population of more than 1 million in 1920 (Note 3). In addition, Pickard found nine urban areas with populations between 500,000 and 1 million.

    By contrast, today there are 42 urban areas with more than 1 million population and 38 with between 500,000 and 1 million population.

    In 1920, the five major urban areas for which there is data had an overall population density of 8,400 per square mile (3,700 per square kilometer). This figure dropped continually, except for between 1940 and 1950 as to its present level (Figure 2) of approximately 3,100 per square mile (1,200 per square kilometer).

    However, caution is required, because before 2000, urban areas generally contained only complete municipalities. Two of the nation’s major urban areas had substantial rural (greenfield) expenses inside their core cities in 1920. This was most pronounced in the core city of New York, where most of Queens and most of Staten Island were undeveloped. Between 1920 and 2010, these two boroughs added more than 1.8 million population, most of which was on greenfield land, rather than the densification of the existing urban neighborhoods. This was in effect, suburban expansion within the city of New York. The same dynamics occurred, to a lesser degree in core cities such as Philadelphia and Los Angeles.

    Pickard finds a population density of 10,600 per square mile (4,100 per square kilometer) for the New York urban area in 1920. It had fallen by half to 5,300 per square mile (2,050 per square kilometer) by 2010.

    Core City and Suburban Growth

    Over the period, the bulk of the population growth (92 percent) was in the suburbs (Figure 3). Even that figure, however, understates the extent of suburban growth. As was above, the inclusion of rural areas as urban in municipalities appears to have been a major driver of the population increase in the city of New York, which added 2.4 million people between 1920 and 2010. Among the other five major urban areas, which includes an estimate for Detroit (Note 2), the core municipalities lost population in each case over the 90 years, though they all continued to grow at least until 1950.

    All of the six major urban areas in 1920 were in the Northeast or the Midwest. The fastest growing urban area from 1920 to 2010 among the six was Detroit, despite the huge losses of its core municipality (Figure 4). No municipality in the world of Detroit’s 1950 size (1.85 million) has lost so much of its population (1.1 million) in all of history. Yet, the Detroit urban area is estimated to have added approximately 2.6 million people to its urban area population since 1920, for an approximately 240 percent increase in population. The Detroit urban area peaked in 2000 at 160,000 higher than in 2010. The second fastest growing larger urban area was Chicago, at approximately 175 percent, while Philadelphia gained 146 percent and Boston 142 percent.

    Urban Areas with 500,000 to 1,000,000 Population in 1920

    The nine urban areas with 500,000 to 1,000,000 population in 1920 had a much lower population density, at 7,200 per square mile (2,800 per square kilometer). This figure, however, is artificially low because of the Los Angeles urban area’s extremely small 1920 density (1,700 per square mile or 650 per square kilometer). Just a few years before the 1920 census, Los Angeles had annexed the San Fernando Valley and other largely rural areas. As a result the city quadrupled in land area. Again, the inclusion of rural areas in the core city rendered Pickard’s urban area (and that of the Census Bureau to at least in 1950) unreflective of actual urban densities in Los Angeles.

    Milwaukee: More Dense than New York

    The Milwaukee urban area, with a population of 504,000 had the highest density in the nation, at 10,900 per square mile (4,200 per square kilometer), which was the last time before 1990 that the New York urban area was not the most dense major urban area. In 1990, the Los Angeles area became more dense than  the New York urban area. By 2000, both the San Francisco and the all-suburban San Jose urban area had also passed New York,

    Falling Densities and Causes

    The population density declines were substantial over the period, at from 63 percent to 70 percent. At the same time, falling household sizes created the requirement for more houses and household densities fell at a slower rate, 37 percent in the largest areas and 50 percent in the smaller metropolitan areas. There were other factors as well, such as more efficient manufacturing and commercial operations, that took more space, urban planning requirements in some metropolitan areas (such as Boston and Atlanta) that required larger than market  building lots (large lot zoning)and the general preference for more land and space on the part of consumers. The US has not been alone in this. The trend toward lower densities has been virtually universal, from Mumbai and Manila to Moscow and Milan.


    Wendell Cox is a Visiting Professor, Conservatoire National des Arts et Metiers, Paris and the author of “War on the Dream: How Anti-Sprawl Policy Threatens the Quality of Life.

    —-

    Note 1: Assumes the same average household size for urban and rural areas.

    Note 2: Jerome P. Pickard, Dimensions of Metropolitanism, Urban Land Institute, 1967.

    Note 3: In 1920, the municipality of Detroit had a population of 993,000 and a population density of 12,700 per square mile (4,900 per square kilometer). Wayne County, which includes Detroit, had a population of 1,170,000. The land area of the county was approximately nine times that of the municipality, nearly all of it rural. On that basis it is estimated that the urban area would have had no more than 1,100,000 residents.

    Photo: New York in the 1920s (Singer Building in foreground, Woolworth Building in the background). Photograph by the U.S. Census Bureau, Public Information Office (PIO).