Tag: manufacturing

  • Manufacturing Executives Predict Jobs will Return to the U.S.

    A recent poll of 3,000 C-level manufacturing company executives found that 85% see certain manufacturing functions returning to the U.S., citing increasing costs overseas (37%), logistics/delivery demands (20%), quality issues (7%) and other reasons (37%).

    From the Cook Associates Survey:

    85 percent of manufacturing executives see the possibility of certain manufacturing operations returning to the U.S., with 37 percent citing overseas costs as the major factor. Nineteen percent cited logistics and 36 percent stipulated other reasons, including economic/political issues, quality and safety concerns, patriotism and overseas skills shortages for highly technical manufacturing processes.

    Cook Associates Executive Search polled nearly 3,000 manufacturing executives primarily in small- to mid-sized U.S. companies from October 13 through November 18, 2011. Participants consisted of C-level executives (CEO, CFO, COO) and key functional Vice Presidents (Operations, Manufacturing, Supply Chain).The survey data was supplemented by written comments submitted by individual executives.

    The survey identified low-volume, high-precision, high-mix operations, automated manufacturing and engineered products requiring technology improvements or innovation as the primary forms of manufacturing returning to the States.

  • Interactive Data Visualization: The Connection Between Manufacturing Jobs and Exports

    By Hank Robison and Rob Sentz

    We recently observed that there are only about 50 manufacturing sectors out of 472 (6-digit NAICS) that actually gained jobs over the past 10 years. This made us wonder because we keep hearing that manufacturing output is actually improving. Politicians and policymakers tend to assume that an uptick in output would naturally result in an uptick in employment. So we investigated.

    What we found

    We placed national export data on top of job totals for each of the 472 manufacturing sectors, and found that manufacturing exports (inflation-adjusted) actually grew by 56% from 02-10 while manufacturing jobs contracted by 23%. Growth in exports have clearly not resulted in more domestic jobs. See the interactive graphic at the bottom of this post for a visualization.

    Across the manufacturing sectors we are actually seeing a predominantly inverse relationship between jobs and exports. To explore this further, we placed each of the 472 industries into one of four categories (again see the graphic):
    1) Those that gained both exports and jobs,
    2) Those that gained exports but lost jobs,
    3) Those that lost exports but gained jobs, and
    4) Those that lost both exports and jobs.

    Some observations

    Those advocating for increased exports as a way of resuscitating jobs in manufacturing need to look at this data. Only 11% of all manufacturing sectors showed gains in jobs and exports, which is not a huge surprise given manufacturing decline. 19% lost jobs AND exports at the same time. Now here is the stat really worth noting — 71% of all manufacturing sectors increased their exports while decreasing their domestic workforce.

    There are some political ramifications here. The Obama Administration has proposed exports as a key to kick-starting the U.S. labor market (see this post from Brookings). Economists and policy experts as well as all of us here at EMSI are huge fans of improving exports. Exports are a principal source of foreign exchange and an important driver for U.S. goods. Export industries also tend to pay higher wages and connect with the rest of the economy through greater multiplier effects, which mean they are key for income and job formation.

    However, as the data suggests things are not that simple. Domestic manufacturers appear to be outsourcing large parts of their work to foreign suppliers. In the process, they employ fewer domestic workers but become more competitive in foreign markets. As a result, exports go up while employment goes down. This is something that policymakers need to consider before pinning too much hope on exports as a way of reviving manufacturing sector employment.

    Conclusion

    There may be a conflict of goals here. On one hand we want high-wage, high-benefit jobs; on the other, “full employment.” But in manufacturing can we have both? If wages, and benefits are pushing producers to outsource then either wages go down (an unattractive prospect), or we adopt policies that spawn productivity growth needed to support high-wages. Are there any other choices?

    Data Graphic

    In this interactive graphic, you can explore EMSI’s data on manufacturing jobs and exports. The data is based on 4-digit NAICS manufacturing sectors. NOTE: 6-digit data was used in the previous analyis.

    Click on the chart to highlight an industry or use the drop-down box. Data in the top half of the graphic shows percentage change in jobs (on the y-axis) and exports (on the x-axis). The bottom line graph simply compares manufacturing jobs and exports over time.

    As we highlighted above, 71% of all manufacturing sectors increased their exports while decreasing their domestic workforce from 2002 to 2010.

    For more information, email Rob Sentz.

  • China: Two Modernizations (Decentralization and Living Away from the Job)

    American and European planners have long sought to improve the “jobs-housing” balance, seeking to place residents and jobs within walking or cycling distance. Of course, planners don’t place people anywhere. Not surprisingly, their efforts have largely failed, from the new towns of the London area, where people travel about as far to work as anywhere else, to fabled failures of Stockholm, where high rise housing close to suburban employment centers now houses migrants who tend to have far lower incomes than native Swedes.

    In the time of Mao Zedong, China had achieved perhaps the ultimate in the jobs-housing balance. Companies provided housing for their workers, who were able to walk to their jobs in the same compound. However, the economic reforms instituted by Deng Xiaoping and his successors has led to an abandonment of this model (Danwei housing) and millions of Chinese households have been lifted out of poverty into affluence. Most Chinese households do not aspire to “living on top” of the factory or office.

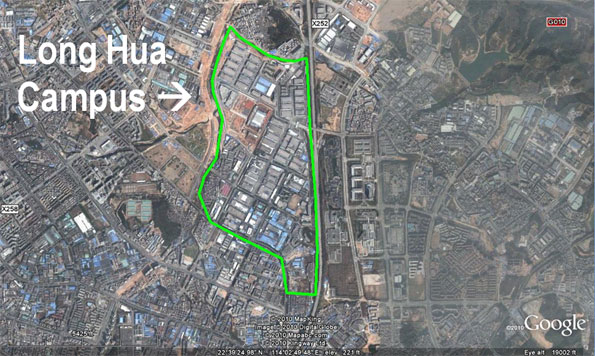
    Foxconn (Hon Hai Precision Industry), one of the world’s largest companies, is among the last to provide large amounts of housing to its workers. In its Shenzhen “Long Hua Campus,” which covers only one square mile, Foxconn employs 450,000 people (Figure). They are housed on the campus or nearby in company provided units.

    Shenzhen directly borders Hong Kong and Dongguan, which borders the Guangzhou-Foshan urban area. All together, these contiguous Pearl River Delta urban areas, along with others down the western shore to Macao have nearly 50 million people, more than live in any geographic area of the same size anywhere else in the world. These Guangdong province urban areas, along with the special economic regions of Hong Kong and Macau have become one of the world’s leading manufacturing and export areas. Shenzhen itself has been estimated to have a population of between 10 million and 15 million, depending on how the migrant workers are estimated. Shenzhen and other major manufacturing centers of China are estimated to house as many as 200 millions migrants from other parts of China (especially rural areas), coming to work in jobs that pay far higher wages than can be earned at home.

    Foxconn itself is the world’s largest manufacturer of consumer electronic technology, producing Apple’s I-Pod and I-Phone and making products for Dell, Hewlett-Packard, Sony, as well as the Nintendo, Wii entertainment systems.

    According to a report in The Wall Street Journal, Foxconn has plans to abandon its Danwei housing and move away from its “perfect” jobs-housing balance to the spatial arrangements that Chinese, Americans and Europeans routinely choose — to work where they like and live where they like.

    Foxconn has had its share of difficulties. There have been the multiple employee suicides at the Long Hua Campus. The company has faced rising costs in its Pearl River Delta operations, including higher wage costs. In its attempt to retain competitiveness, Foxconn is seriously rethinking its business model and appears likely not only get out of the housing business, but will also move many of its operations into central and western China, where costs and wages are lower. This also makes sense in relation to government policy, which seeks to develop the center and west.

    Overall, Taiwan headquartered Foxconn employs 920,000 people in China, the equivalent of the entire work force in the Portland or Kansas City metropolitan areas.

    Foxconn plans to increase its workforce in China from 920,000 to 1,300,000 and intends for many of its employees to be in new facilities in places like Chengdu (capital of Sichuan), Wuhan (capital of Hubei), Zhengzhou (capital of Henan) and Chongqing (capital of the provincial level Chongqing municipality). Foxconn’s decentralization, and the location of other new and expanded businesses in the center and west is strongly supported by China’s substantial infrastructure investment. The nation already has more than 40,000 miles of interstate equivalent highways. When all of the gaps are completed, trucks will be able to reach east coast ports from Zhengzhou or Wuhan in about days drive and little more than two days from Chongqing and Chengdu.

    At the same time, corporate executives can get to Beijing, Shanghai and the Pearl River Delta and other East Coast urban areas in 2.5 hours or less through some of the world’s most modern airports.

    Finally, the more decentralized operations will allow the migrant workers to live much closer to their homes, rather than having to travel all the way to the East Coast. This will make more frequent visits to rural villages and families possible.

    —-

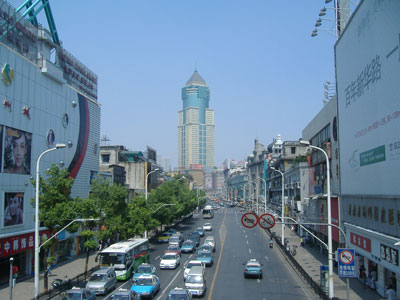
    Photo: Wuhan (photo by author)

  • Maps of United States Manufacturing and Finance Industry

    For our War of the Regions piece I went through BLS data and calculated location quotients for a few key diverging industries, namely manufacturing and securities, commodities and investments side of the finance industry. These are the kind of numbers that really benefit from geographic visualization.

    A LQ tells us not where the most jobs are in any given industry, but how much of a state’s employment is clustered in the given industry.

    I’ve been following FortiusOne for a while but this is the first time I’ve gotten a chance to play around with their GEOCommons Finder! and Maker!, a new social production platform for agglomerating, sharing and visualizing geographic data. It’s a fantastic platform.

    Click on the map images here to explore them on the GEOCommons platform. You can see a lot of dark color in the rust belt, but at this point, the states of Indiana, Wisconsin, Arkansas, Iowa, Alabama, and Mississippi are at or ahead of Michigan and Ohio in state dependence on Manufacturing. Part of this is due to growth in the South and Great Plains, and part is due to manufacturing job losses in the Rust Belt, causing the concentration there to slip.

    Finance here is limited to Securities, Commodity Contracts, and Other Financial Investments and Related Activities (NAICS 523). Not surprisingly, this industry is clustered in the Northeast. You see Illinois, Minnesota, and Colorado shaded darker due to the role of Chicago, Minneapolis, and Denver as regional trade centers.

    Take some time to explore GEOCommons and some of the other visualizations created by others, and watch for more maps in this space as we do the same.

  • Geography of the US Auto Manufacturing Industry

    Talk of bailing out US automakers has dominated the news recently, and we all know that means Michigan. Michigan is home to roughly a quarter of the country’s auto manufacturing jobs, and the industry is in rapid decline there and in Ohio, but the state of automaking employment in the rest of the country may surprise you.

    The economies of Michigan, Alabama, Ohio, Indiana, and Missouri are the most highly dependent on auto manufacturing. While Michigan and Ohio have lost more than 43,000 auto jobs since 2001, Indiana actually added almost 3000 over the same time period and Alabama more than doubled its auto industry, adding 8600 jobs.

    In fact, the rest of the nation aside from Ohio held about the same number of automobile manufacturing jobs in 2001 as the state of Michigan. While Michigan has shed more than 35% of its employment in the industry, the rest of the country actually held its own over the same period.

    One major caveat – this source of BLS data is only current through the end of 2007, so it doesn’t quantify the effects of the recent credit market implosion. What it does show is a strong decentralizing trend in the auto manufacturing industry.

    Looking at average annual pay, the small vehicle sector in Minnesota leads the way – jobs there average over $100,000. At well over $90k per job in Michigan, you can see what the rapid decline in automaking has contributed to the evisceration of the state economy. In the top four highest paying states – where workers make more than $90,000 on average per year – automakers have cut more than one third of the jobs in those states since 2001.

    So while the failures of major automakers would send ripples throughout the North American industrial economy, what we are really contemplating here is doling out support for the declining states of Michigan and Ohio.

  • Manufacturing Growth Nodes

    Manufacturing is often viewed as a massive anchor to regional job growth. Here’s two lists of metro areas that not only withstood the national job hemorrhaging of 2001-2003, but they are actually growing.

    Growth by percent:

    Read more manufacturing analysis in as part of our Best Cities Rankings: Is Manufacturing Weighing Down the U.S. Economy?

    Growth by number of jobs: