Tag: middle class

  • The Three Faces of Populism

    More than at any other time in recent memory, American politics now are centered on class and the declining prospects of the middle class. This is no longer just an issue for longtime leftists or Democratic or right-wing propagandists. It’s a reality so large that even the most detached and self-satisfied Republicans must acknowledge it.

    The Left’s new superstar, New York City Mayor Bill de Blasio, identifies inequality as “the dominant issue in our public discourse” but similar assessments have recently been coming from such unlikely sources as GOP Senate Majority Leader Mitch McConnell, Jeb Bush and even Mitt Romney.

    So, if populism will become a dominant theme in the next election, what form will it take? Populism itself is more a sentiment than a program; it reflects people’s deep-seated fears about the future and a festering resentment of the seemingly unassailable power of financial and other corporate elites.

    Read the entire piece at The Orange County Register.

    Joel Kotkin is executive editor of NewGeography.com and Roger Hobbs Distinguished Fellow in Urban Studies at Chapman University, and a member of the editorial board of the Orange County Register. He is also executive director of the Houston-based Center for Opportunity Urbanism. His newest book, The New Class Conflict is now available at Amazon and Telos Press. He is also author of The City: A Global History and The Next Hundred Million: America in 2050.  He lives in Los Angeles, CA.

  • 10 Most Affluent Cities in the World: Macau and Hartford Top the List

    The United States and Europe continue to dominate the list of strongest metropolitan areas (city) economies in the world, according to the Brookings Institution’s recently released Global Metro Monitor 2014. This is measured by gross domestic product per capita, adjusted for purchasing power parity (GDP-PPP). Brookings points out that this does not indicate personal income, but "proxies the average standard of living in an area."

    The Global Metro Monitor 2014 provides detailed ratings for the 300 largest metropolitan economies in the world, measured by gross domestic product adjusted for purchasing power parity. The list is defined by total size of the economy, with some cities with very high GDP-PPPs per capita, but small populations are excluded. For example, Midland, Texas, with the highest GDP-PPP per capita metropolitan area according to the United States by the Department of Commerce Bureau of Economic Analysis, is excluded.  Other cities, with large populations and low GDP-PPP s per capita were included, such as megacity Kolkata, with a GDP-PPP of $4,000, a fraction of the top 10 average of $77,000. Megacities such as Lagos, Dhaka and Kinshasa were excluded from the top 300, owing to their low GDP-PPPs per capita

    According to data in the Global Metro Monitor website and report, 90 of the top 100 cities were in the United States or Europe in 2014, 68 in the United States and 20 in Europe. The US figure matches that of the previous Global Metro Monitor (2012), while Europe has fallen from 22 to 20 cities.

    Macau: The Most Affluent City

    Last year’s most affluent city, Hartford, was replaced by Macau, which, with Hong Kong is one of China’s two special economic regions. Brookings estimates Macau’s GDP-PPP per capita at $93,849, opening a substantial lead on Hartford of more than $10,000.

    Macau’s economy has expanded rapidly the last decade, principally due to legalized gaming industry and related tourism. Macau displaced Las Vegas as the largest gaming center in 2006. According to the Las Vegas Review Journal, Macau’s gaming revenues had exploded to nearly seven times that of the Las Vegas Strip ($44.1 billion compared to $6.4 billion). Revenue declined, however, in 2014, partly due to China’s anti-corruption drive and competition from other growing East Asian centers, such as Singapore and the Philippines.

    Macau is the one of the smallest cities in the Brookings 300, with a population of only 575,000. Only three other richest cities have populations less than 600,000 including Durham, North Carolina the smallest, ranked 12th, Pennsylvania’s capital, Harrisburg (with a core city that filed for bankruptcy), ranked 25th and Scotland’s capital, Edinburgh, at ranked 37th.

    Balance of the Top 10 Cities

    As was the case last year, nine of the 10 largest GDP-PPP’s per capita were in the United States (Figure). Like Macau, the second and third ranking cities were also smaller than the average, a population of 4.7 million. Second ranked Hartford, with a GDP-PPP per capita of $83,100 has 1.1 million residents. Hartford’s economy strong in finance, especially insurance and benefits and is an important government center, as the capital of Connecticut.

    San Jose, with 1.9 million residents, ranked third, with a GDP-PPP per capita of $82,400. San Jose is home to the larger part of the world’s leading technology center, suburban Silicon Valley. Tech and University hub Boston ranked fourth.

    Leading energy hub Houston ranked as the fifth most affluent city, with a GDP-PPP per capita of nearly $75,000 (Note 1). With 6.4 million residents, Houston is the largest city among the top five. Among the top ten, only New York is larger.

    Bridgeport, Connecticut, a metropolitan area adjacent to New York that includes suburban business centers such as Stamford, Westport and Greenwich is ranked 6th.

    The balance of the top 10 also includes cities specializing in technology, finance and government. Number seven Washington has probably the world’s largest government complex   and has nurtured a huge technology center centered in the Virginia and Maryland suburbs. Seattle ranks eighth, continuing its historic leadership in the technology driven aerospace industry besides its emergence as one of leading information technology centers in the world.

    San Francisco which includes part of the Silicon Valley in its suburbs (sharing with San Jose) and has a strong social media industry in its urban core, ranks 9th. The top 10 was rounded out by New York, perennially ranked as one of the two top global cities, along with London (see: Size is not the Answer: The Changing Face of the Global City, referred to as the Global Cities Report, described further in Note 2)

    Additional Highlights

    Europe:Unlike the United States, which placed 37 of its most affluent cities in the top 50 and 31 in the second 50, Europe’s 20 most affluent economies were concentrated in the second 50, with only six in the top 50. Comparatively small Edinburgh, cited above, was the most affluent, at 37th. Paris was ranked 40th most affluent by Brookings and 3rd in the Global Cites report, just ahead of London at 42nd, the perennial global city co-leader (which was ranked number one in the Global Cities Report).

    Hong Kong:Along with Macau, China’s other special economic region, Hong Kong continued to be among the world’s most affluent, at 39th. The Global Cities Report ranked Hong Kong as the sixth Global City, with a GDP-PPP PPP higher than that of former its former imperial capital   London.

    China: Perhaps most significantly, mainland China has begun to enter the top 100. Suzhou, partly exurban to Shanghai (Kunshan), now ranks 68th. Suzhou has been the recipient of considerable business park investment, including cooperative ventures with Singapore. China’s economic prosperity may be shifting toward the Yangtze Delta (which extends from Ningbo and Hangzhou, through Shanghai to Nanjing). Along with Suzhou, Wuxi, Changzhou and Nanjing now have GDP-PPP’s per capita exceeding $30,000. By contrast, among the large manufacturing centers of the Pearl River Delta, only Shenzhen exceeds a GDP-PPP of $30,000, while Guangzhou, Dongguan and Foshan are below that level (Note 2). According to a new Economist Intelligence Unit report, Jiangsu (which includes the urban corridor from Suzhou to Nanjing) now accounts for more manufacturing employment than any other province.

    Surprisingly Low Rankings: Some cities that might have been expected to be among the world’s most affluent, ranked comparatively low. For example Tokyo, the world’s largest city, ranked fourth in the Global Cities Report, made it only to the third 50 in affluence. Seoul-Incheon, a burgeoning corporate and tech center, remained outside the top 100.

    Canada’s largest city, Toronto managed only a ranking of 100, well below the Prairie behemoths of Calgary (11th) and Edmonton (23rd). Australia’s largest city, Sydney also barely made the top 100, at 95th, far below energy and commodities capital Perth (17th).

    European cities with reputations for unusual prosperity also ranked lower than expected. Financial center Zurich was ranked 45th. Scandinavia’s most affluent city  was Stockholm (48th), followed by energy leader Oslo (62nd), Helsinki (87th) and Copenhagen, which failed to make the top 100 and ranked in the third 50. Singapore,which the Global Cities Report ranks fourth, is ranked 14th most affluent.  

    Evaluating City Performance

    Cities grow as migrants are attracted by hope for better lives. This is as true in Africa and India as it is in Europe or the United States. Cities achieve their primary purpose when they produce a higher standard of living for their residents. Some cities do very well at this, as the Brookings data indicates, and some do less well. The Global Metro Monitor provides crucial information that can be used by national, regional and local officials to measure how well their policies are performing in improving living conditions in relation to both their own past and other cities.

    Note 1: Purchasing power can vary greatly even within nations. Because of this, the United States Department of Commerce, Bureau of Economic Analysis has developed a regional price parities (RPP) program to adjust for metropolitan area costs of living. For example, in 2012, the unadjusted per capita income in San Jose was 30 percent above that of Houston. In the same year, the per capita income-RPP (or in international terms, the per capita income-PPP) in San Jose was just six percent above that of Houston, indicating cost of living at least 20 percent higher in San Jose. 

    Note 2:  Joel Kotkin was principal author of Size is not the Answer: The Changing Face of the Global City, which included contributing authors Ali Modarres, Aaron M. Renn and me. The report was jointly published by the Civil Service College of Singapore and Chapman University. The report is available here.

    Note 3: The 2012 Global Metro Monitor ranked some cities of China higher, though Note 19 expressed concerns about population data for some cities, which might have excluded migrant populations (the "floating population"). There are no such difficulties in the 2014 Global Metro Monitor.

    Wendell Cox is principal of Demographia, an international public policy and demographics firm. He is co-author of the "Demographia International Housing Affordability Survey" and author of "Demographia World Urban Areas" and "War on the Dream: How Anti-Sprawl Policy Threatens the Quality of Life." He was appointed to three terms on the Los Angeles County Transportation Commission, where he served with the leading city and county leadership as the only non-elected member. He was appointed to the Amtrak Reform Council to fill the unexpired term of Governor Christine Todd Whitman and has served as a visiting professor at the Conservatoire National des Arts et Metiers, a national university in Paris.

    Photo: St. Paul’s Church (Facade), Macau, photo by authors

  • 50 Years of US Poverty: 1960 to 2010

    Although inequality is the current focus of concern with income, it is in the end a story of the rich, the middle and the poor, who of course have not gone away.  It is valuable to remind ourselves, particularly the young, about how pervasive poverty was 50 years ago, how poverty declined markedly between 1960 and 1980, after which it has risen again. Most important is to understand what led to the poverty reduction between 1960 and 1980, in order to further understand the power and lure of forces which would return us to the good old days of 1960, or before!. This piece is inspired by the pioneering book from 1970 on the Geography of Poverty, with Ernest Wohlenberg, based on 1960 data.  The data updates come mainly from US Census Bureau. 

    I start with the basic data, the numbers of the poor and the percent below the poverty level for 1960, for 1980 and for 2010, plus a summary table.  These are supplemented by some maps of the poverty rates for whites and for blacks (or non-whites), and for the elderly (only available for 1980).

    Overall for the nation the poverty rate fell from 22% in 1960 steeply down to 12% in 1980 then moved up moderately to 15% during the current era of rising inequality.  I look first at broad patterns of relative poverty for the three times, and then turn to the more interesting or surprising story of the differences in the reduction of poverty across the states, and then the story for whites, blacks and the elderly.

    Broad Patterns 

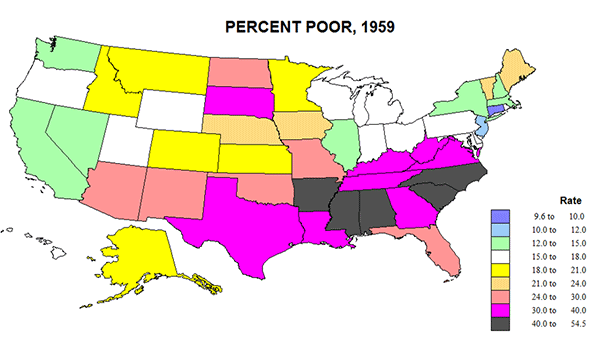
    The United States was so different in 1960, with a poor rural south and southwest, and a fairly poor Great Plains. (Figure 1). While the west coast was better off and metropolitan, the main area of lower poverty was the historic urban-industrial core from IL and WI to southern New England, where unionized industry prevailed. CT was richest with less than 10 percent poverty; this compared to MS with a poverty rate of 55! The deep south was amazingly poor and not just for Blacks. 

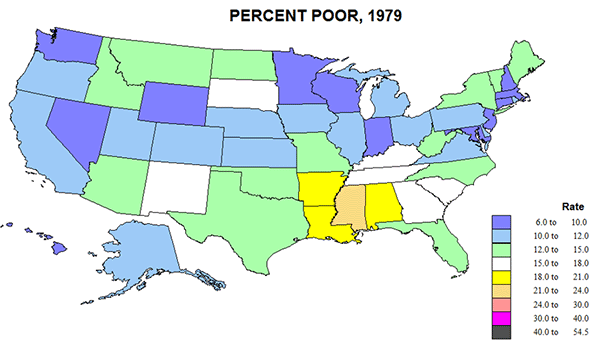
    Changes by 1979 were indeed revolutionary (Figure 2).  Areas of lower poverty extended from the old industrial core to the rest of New England and down Megalapolis to Virginia, and to the “old northwest”, MN, WI, IA, and to most of the US West. Most improved were the corners of the south, TX, OK, and FL, NC, due to energy development, new industries moving to the south and poor blacks escaping to the north.  Only a small lower Mississippi region (AR, LA, MS, and AL) remained fairly poor.

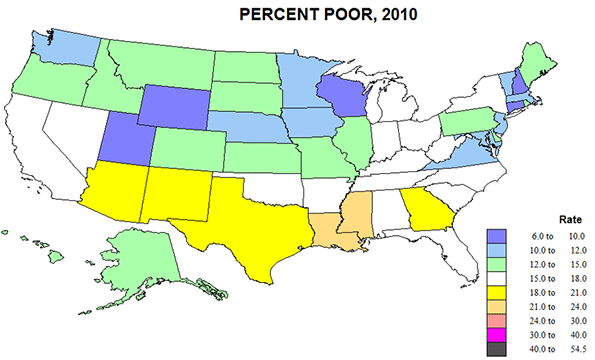
    2010 saw a rather general resurgence of poverty – related certainly to globalization and industrial off shoring, deindustrialization in the old northeastern core, and greater poverty across the southern tier from CA to FL, in part related to heavy immigration from Latin America.  Some of this shift could, in my opinion, be pegged as well to the shift to more conservative Republican Party rule.


    Numbers of States
    White Black Over 65
    Rate 1960 1980 2010   1980 1980 1980
    <12% 2 27 14 41 0 11
    12-18% 19 19 30 10 7 21
    18-24% 11 5 7 8 8
    24-40% 14 36 11
    >40% 5

    Poverty rates fell broadly between 1960 and 1980, especially for the half of states with 1960 rates above the 22% average level, while the number of states with rates below the 1980 average of 12% rose from 2 to 27 states. Rates increased modestly in the ensuing years in the then states with the lowest rates.

    The Relative Fates of States    

    Several states fared relatively best, with poverty rates falling at least in half or more in 2010 than in 1980. These are in two disparate sets: first southern states with very high poverty in 1960: AL, AR, KY, MS, NC, and VA, and another northern set  in ME, NE, NH, ND, SD, UT, and VT.  Other states in which poverty rates fell at least in half, but were lower in 1980 than in 2010 include GA, IA, SC, and TN. FL and TX poverty rates fell to less than half the 1960 rates in 1980, but poverty growth by 2010 showed some back-tracking. At the other extreme three states actually had higher rates of poverty in 2010 than way back in 1960: CA, NV, and NY.

    The particular gains for the south reflect two dominant forces, the out-migration of large numbers of black people to the north and west, slowing the reduction in poverty rates for the north and west, as well as the successful shift of industry from the north to the south, both forces including millions of families and of jobs.  TX and FL stand out because of high migration from Latin America. The exceptional story of CA and NY is similarly one of massive migration of minorities from the rest of the country but of even larger immigration from Latin America. The opposite story of very low poverty in NH, VT, and ME is one of overflow of opportunities and wealth from Massachusetts. The reason for ND, SD, NE, and UT is pre-oil development, and reflects broader forces for poverty reduction.

    Poverty in White and Black

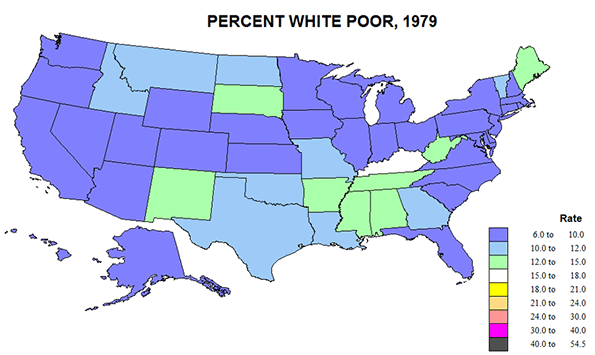
    White poverty rates fell from 17 to 9.4 in 1979 but then edged up to 10% in 2010. At the same time, black poverty rates fell from a horrendous 55% in 1959 to just under 30% in 1979 and appears to have remained at 30 in 2010. Note that black poverty rates remain three times that of whites, and are comparatively as high as they were in 1959.  The gap remains worse (Figure 6) in the south and extreme generally across the north, but much lower in places like the Dakotas and upper New England in 1979 in part because of small numbers, and also due to the fact that the 1959 rates included Native Americans while the 1979 numbers did not.  The only good estimates for white poverty were for 1979, and reveal a remarkable uniformity across much of the country, lagging slightly in Appalachia-Ozarkia. (Figure 5) 

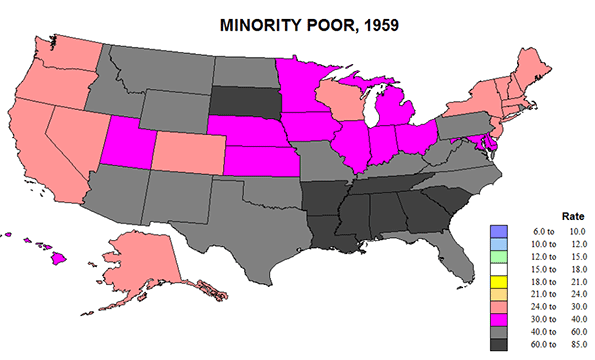
    Meanwhile, rates for blacks fell more in the parts of the South SC,  VA, NC, FL, and TX, but even more so  in the historic ”black belt” of AL, LA, MS, AR, and SC where the poverty rate dropped from 77 to 33 %. Less improvement is evident for early northern destinations of blacks from the south: NY, IL, MI, OH, and NJ, or in CA and OR.

    Please refer back to the table. While whites had rates below 12% in 46 states, for blacks the number is 0.   While 0 states had white rates above 18%, 44 states had black rates above 18%. This is shameful.  I am unable to find any positive spin for this story. The racial gap remains deeply entrenched.

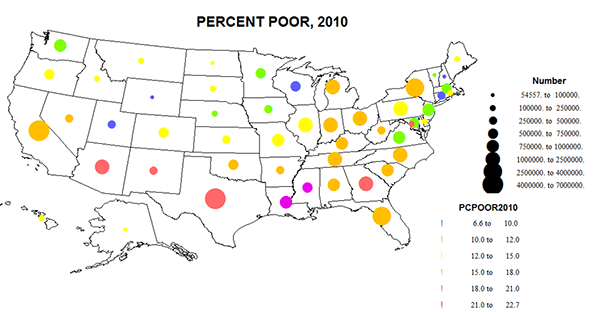
    I close with a variant of the 2010 poverty map, showing the absolute numbers as well as the rates (Figure 8). Poverty remains serious across the southern tier, especially on CA, TX and GA, but also in the north, especially in NY and the eastern Great Lakes states.  While direct causality is unlikely, one can understand the worry of the increased numbers and shares of the poor clear across the southern tier of the country- CA to FL.     

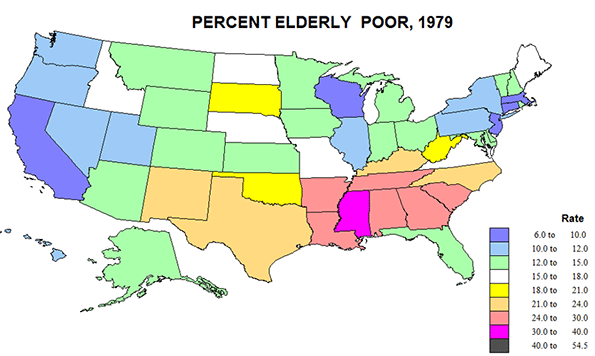
    Poverty of the Elderly

    Compared to the generally poor picture of black poverty, the story  for the elderly is much  more positive. If anyone won the “war on poverty”, it was the elderly. Is this because of their political clout? Not just that, but it obviously matters. The data for 1959 and 2010 are not fully comparable, so the only map is for 1979.  But the elderly poverty rate in 1959 was a striking 46 percent, not that much below the outcast blacks, so the fall in the rate to under 15% in 1979 is quite astonishing. The reasons for this are discussed below. Here we can compare the pattern for elderly with that for all persons.
    Actually the correlation between age and poverty is quite high; elderly rates average about 5% above those for all people.  CA, AZ, FL, and NY achieved lower senior poverty rates in 1979 than for all persons, probably a result of selective migration, perhaps a role of political influence in AZ and FL.

    Why did poverty fall so much from 1960 to 1980, and then increase again? This is no big mystery! The two powerful and complementary forces reducing poverty were America’s robust economic expansion, in the 1960s especially, combined with social programs, starting with the New Deal (especially Social Security and the minimum wage), and the era of union growth, followed by the 60s Civil Rights revolution, including women’s rights, and the Great Society’s War on Poverty, above all Medicare and Medicaid. Of course these programs had to be paid for, but this was accomplished by vast economic investment and gains in productivity of the economy.

    The elderly were a huge part of poverty in 1960 but a relatively low part by 1980.  And despite the nation’s ongoing inability to overcome racial discrimination and unrest, the social programs have greatly helped the emergence  of a black middle class, as much in the south as in the north.

    Factoring in the Cost of Living

    But wait! Isn’t the cost of living higher in New York and San Francisco than in West Virginia and Nebraska?  Should this affect the estimates of poverty across the state?  The answer is yes, and fortunately, the Census Bureau has just completed a new series of poverty estimates for 2010-2012 adjusting for variations in the cost of living, and compared these to their official figures.  The effects are not trivial.

    Essentially, the cost of living is significantly higher in the biggest, densest and richest metropolitan cores, and correspondingly lower is most of the rest of the country. The higher costs in these few giant but populous places is sufficient to raise the number in poverty nationally, by 2.6 million, raising the US rate from 15.1 to 16 percent.

    The critical states for underestimating poverty are actually few: CA, 2,750,000 more, up 7.3%: NJ, 415,000 more, up 4.8%; FL, 771,000 more, 4.1%; MD, up 195,000, up 3.3%; NV, 102,000, 3.8%; and NY, up 308,000, 1.6%. California dominates the rise in poverty, by itself adding more poor than the country as a whole.  But some other states with big metropolitan areas do not suffer this cost of living adjustment: TX, -338,000. -1.3%; OH, -252,000, -2.2%; MI, -130,000, -1.3%; IN -106,000, -1.7%; and NC, -249,000, 2.6%. I do not know that these states have in common, perhaps less stringent growth management and lower tax rates.  

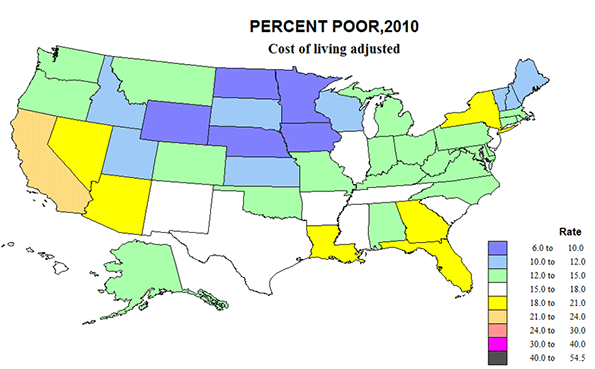
    There are seven states with a drop in the number of poor of 3% or more after adjusting for cost of living,  including MS, -136,000, -4.6%; NM, -86,000, -4.2%; WV, -75,000, -4.3%; and KY, -165,000, -3.8%.  As a consequence, we end up with a US pattern that is counter-intuitive, and contrary to conventional long-term wisdom about poverty. Big, rich mega-urban California earns the nation’s highest poverty rate as well as in total numbers (24%), followed by DC with 22.7; NV, 19.8; and FL, 19.5.  Long maligned poor states like MS has the same rate as the country, at 16%, AR, 16.5; SC, 15.8; and especially extreme, WV, 12.9 and KY, 13.6. Rather than having the lowest poverty rate at 9.6, CT moves up to 12.5, while IA, 8.6; ND, 9.2; WY, 9.2; and MN, 9.7, fall below 10% poor.  Counter-argument can be made that the story is not so different as first appears, if the richest states with higher cost of living also tend to  have higher levels of services to those in poverty. But this has not been measured. 

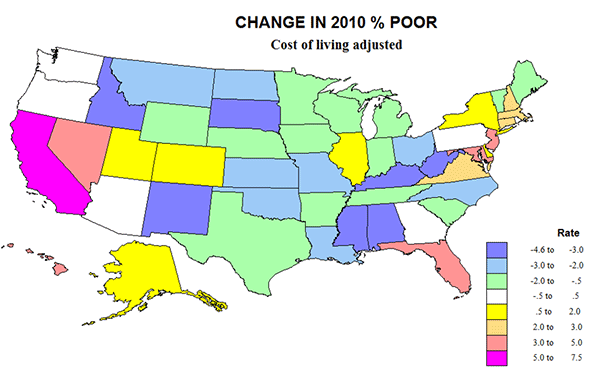
    Perusing the  two new maps of the percent poor in 2010,cost of living  adjusted, and the change in rates and numbers, highlights the key role of California-Nevada and of Megalapolis-Florida, historic cores of urban wealth, are also incubators of higher poverty. This also supports the idea that that immigration from Latin America must play a role in the heightened poverty along most of the southern border, and especially California.  The curse of poverty remains everywhere, but it’s clearly become more severe in some places, and less so in others.

    Richard Morrill is Professor Emeritus of Geography and Environmental Studies, University of Washington. His research interests include: political geography (voting behavior, redistricting, local governance), population/demography/settlement/migration, urban geography and planning, urban transportation (i.e., old fashioned generalist).

  • U.S. Economy Needs Hardhats Not Nerds

    The blue team may have lost the political battle last year, but with the rapid fall of oil and commodity prices, they have temporarily gained the upper hand economically. Simultaneously, conditions have become more problematical for those interior states, notably Texas and North Dakota, that have benefited from the fossil fuel energy boom. And if the Obama administration gets its way, they are about to get tougher.

    This can be seen in a series of actions, including new regulations from the EPAand the likely veto by the president of the Keystone pipeline, that will further slow the one sector of the economy that has been generating high-paid, blue collar employment. At the same time, housing continues to suffer, as incomes for the vast majority of the middle class have failed to recover from the 2008 crash.

    Manufacturing, which had been gaining strength, also now faces its own challenges, in large part due to the soaring U.S. dollar, which makes exports more expensive. Amidst weakening demand in the rest of the world, many internationally-oriented firms such as United Technologies and IBM forecast slower sales. Low prices for oil and other commodities also threatens the resurgence of mainstream manufacturers such as Caterpillar, for whom the energy and metals boom has produced a surge in demand for their products.

    Left largely unscathed, for now, have been the other, less tangible sectors of the economy, notably information technology, including media, and the financial sector, as well as health services. In sharp contrast to manufacturing, energy, and home-building, all of these sectors except health care are clustered in the high-cost, blue state economies along the West Coast and the Northeast. As long as the Fed continues to keep interest rates very low, and maintains its bond-buying binge, these largely ephemeral industries seem poised to appear ever more ascendant. No surprise then that one predictably Obama-friendly writer called the current economy “awesome” despite weak income growth and high levels of disengagement by the working class in the economy. If Wall Street and Silicon Valley are booming, what else can be wrong?

    Should the whole economy become more bluish?

    One consistent theme of blue-state pundits, such as Richard Florida, is that blue states and cities “are pioneering the new economic order that will determine our future.” In this assessment, the red states depend on an economy based on energy extraction, agriculture and suburban sprawl. By this logic, growing food for mass market consumers, building houses for the middle class, making cars, drilling for oil and gas—all things that occur in the red state backwaters—are intrinsically less important than the ideas of nerds of Silicon Valley, the financial engineers of Wall Street, and their scattered offspring around the country.

    But here’s a little problem: these industries do not provide anything like the benefits that more traditional industries—manufacturing, energy, housing—give to the middle and working classes. In fact, since 2007, according to the Bureau of Labor Statistics, the information and technology sectors have lost more than 337,000 jobs, in part as traditional media jobs get swallowed by the Internet. Even last year, which may well prove the height of the current boom, the information and technology industry created a net 2,000 jobs. And while social and on-line media may be expanding, having added 5,000 jobs over the last decade, traditional media lost ten times as many positions, according to Pew.

    In contrast, energy has been a consistent job-gainer, adding more than 200,000 jobs during the same decade. And while manufacturing lost net jobs since 2007, it has been on a roll, last year adding more than 170,000 new positions. Construction, another sector hard hit in the recession, added 213,000 positions last year. The recovery of these industries has been critical to reducing unemployment and bringing the first glimmer of hope to many, particularly in the long suffering Great Lakes region.

    These tangible industries seem to be largely irrelevant to deep blue economies. A prospective decline of energy jobs, for example, does not hurt places like California or New York, which depend heavily on other regions to do the dirty work. Overall, for example, California, despite its massive energy reserves, created merely 15,000 jobs since 2007, barely one-tenth as many as in Texas. Energy employment in key blue cities such as New York and San Francisco has remained stagnant, and actually declined in Boston.

    Similarly, a possible slowdown in manufacturing—in part due to an inflated dollar, depressed international demand, and the loss of industrial jobs tied to energy—will affect different regions in varying degrees. Since 2009, the manufacturing renaissance has been strongly felt in traditional hubs like Detroit, Grand Rapids, and Louisville, as well as energy-charged places such as Houston and Oklahoma City. All saw manufacturing growth of 10 percent or more. Meanwhile New York, Los Angeles, Chicago, San Francisco, and Boston all lost industrial positions.

    Finally, there remains the housing sector, a prime employer of blue collar workers and the prime source of asset accumulation for middle class families. Sparked by migration and income growth, construction growth has been generally stronger in Texas cities but far more sluggish in New York and California, where slower population growth and highly restrictive planning rules make it much tougher to build affordable homes or new communities. Last year at the height of the energy boom, Houston alone built more single family homes than the entire state of California.

    If you think inequality is bad now …

    The new ephemera-based economy thrills those who celebrate a brave new world led by intrepid tech oligarchs and Wall Street money-men. The oligarchs in these industries have gotten much, much richer during the current recovery, not only through stocks and IPOs, but also from ultra-inflated real estate in select regional areas, particularly New York City and coastal California. As economist George Stiglitz has noted, such inflation on land costs has been as pervasive an effect of Fed policy as anything else.

    Even in Houston, some academics hail the impending “collapse of the oil industrial economy,” even as they urge city leaders to compete with places like San Francisco for the much ballyhooed “creative class.” Yet University of Houston economist Bill Gilmer notes that low energy prices are driving tens of billions of new investment at the port and on the industrial east side of the city. This growth, he suggests, may help offset some of the inevitable losses in the more white collar side of the energy complex.

    The emergence of a new ephemera-led economy bodes very poorly for most Americans, and not just Texans or residents of North Dakota. The deindustrialized ephemera-dominated economy of Brooklyn, for example, has made some rich, but overall incomes have dropped over the last decade; roughly one in four Brooklynites, overwhelmingly black and Hispanic, lives in poverty. Similar patterns of increased racial segregation and middle class flight can be found in other post-industrial cities, including one-time powerhouse Chicago, where areas of  concentrated poverty have expanded in recent years.

    Nowhere is this clearer than in ephemera central: California. Once a manufacturing juggernaut and a beacon of middle class opportunity, the Golden States now suffers the worst level of poverty in the country. While Silicon Valley and its urban annex, San Francisco, have flourished, most of the state—from Los Angeles to the Inland regions—have done poorly, with unemployment rates 25 percent or higher than the national average. The ultra-“progressive” city now suffers the most accelerated increase in inequality in the country.

    Similar trends have also transformed Silicon Valley, once a powerful manufacturing, product-producing center. As the blue collar and much of older middle management jobs have left, either for overseas or places like Texas or Utah, the Valley has lost much of its once egalitarian allure. San Jose, for example, has long been home to the nation’s largest homeless encampment. Black and Hispanic incomes in the Valley, notes Joint Venture Silicon Valley, have actually declined amidst the boom, as manufacturing and middle management jobs have disappeared, while many tech jobs are taken by predominately white and Asian younger workers, many of them imported “techno-coolies.”

    In contrast, the recoveries in the middle part of the country have been, to date, more egalitarian, with incomes rising quickly among a broader number of workers. At the same time, minority incomes in cities such as Houston, Dallas, Miami, and Phoenix tend be far higher, when compared to the incomes of Anglos, than they do in places like San Francisco, New York, or Boston. In these opportunity cities, minority homeownership—a clear demarcation of middle income aspiration—is often twice as high as it is in the epicenters of the ephemeral economy.

    To succeed in the future, America needs to run on all cylinders.

    The cheerleaders of the ephemeral economy often point out that they represent the technological future of the country, and concern themselves little with the competitive position of the “production” economy—whether energy, agriculture, or manufacturing. They also seek to force the middle class into ever denser development, something not exactly aspirational for most people.

    Nor is the current ephemera the key to new productivity growth. Social media may be fun, but it is not making America more competitive or particularly more productive (PDF). Yet there has been strong innovation in “production” sectors such as manufacturing, which alone accounts for roughly half (PDF) of all U.S. research and development.

    What is frequently missed is that engineering covers a lot of different skills. To be sure the young programmers and digital artists are important contributors to the national economy. But so too are the many more engineers who work in more mundane fields such as geology, chemical, and civil engineering. Houston, for example, ranks second (PDF) behind San Jose in percentage of engineers in the workforce, followed by such unlikely areas as Dayton and Wichita. New York, on the other hand, has among the lowest percentage of engineers of major metropolitan areas.

    To be sure, an aerospace engineer in Wichita is not likely to seem as glamorous as the youthful, urbanista app-developers so lovingly portrayed in the media. Yet these engineers are precisely the people, along with skilled workers, who keep the lights on, planes flying and cars going, and who put most of the food on people’s tables.

    The dissonance between reality and perception is most pronounced in California. The state brags much about the state’s renewable sector to the ever gullible media. But in reality high subsidized solar and wind account for barely 10 percent ofelectrical production, with natural gas and coal, now mostly imported from points east, making up the vast majority. In terms of transportation fuels, the state has a96 percent dependence on fossil fuels, again large imported, despite the state’s vast reserves. Los Angeles, although literally sitting on oil, depends for 40 percent of its electricity on coal-fired power from the Intermountain West.

    Equally critical, the now threatened resurgence of the industrial and energy sectors could reverse trends that have done more to strengthen the U.S. geopolitical situation than anything else in recent decades. Foreign dictators can easily restrict a Google, Facebook, or Twitter, or create locally-based alternatives; for all its self-importance, social media has posed no mortal danger to authoritarian countries. In contrast, the energy revolution has undermined some of the world’s most venal and dangerous regimes, from Saudi Arabia and Iran to Russia and Venezuela.

    In no way do I suggest we don’t need the ephemeral sectors. Media, social and otherwise, remain important parts of the American economy, and testify to the country’s innovative and cultural edge. But these industries simply cannot drive broader based economic growth and opportunity. Part of the problem lies in the nature of these industries, centered largely in Silicon Valley and San Francisco, which require little in terms of blue collar workers. Another prime issue is that these areas can only import so many people from the rest of country due to extraordinary high housing costs.

    Under current circumstances, the centers of the ephemeral economy such as New York or San Francisco cannot accommodate large numbers of upwardly mobile people, particularly families. These, for better or worse, have been vast gated communities that are too expensive, and too economically narrow, to accommodate most people, except those with either inherited money or elite educations. This is why Texas—which has created roughly eight times as many jobs as California since 2007 and has accounted for nearly one-third of all GDP growth since the crash—remains a beacon of opportunity, and the preferred place for migrants, a slot that used to belong to the Golden State.

    As a country, we stand at the verge of a historical opportunity to assure U.S. preeminence by melding our resource/industrial economy with a tech-related economy. Our strength in ephemera can be melded with the power of a resource and industrial economy. In the process, we can choose widespread and distributed prosperity or accept a society with a few pockets of wealth—largely in expensive urban centers—surrounded by a downwardly mobile country.

    The good news is America—alone among the world’s largest economies—has demonstrated it can master both the ephemeral and tangible economies. To thrive we need to have respect not for one, but for both.

    This piece first appeared at The Daily Beast.

    Joel Kotkin is executive editor of NewGeography.com and Roger Hobbs Distinguished Fellow in Urban Studies at Chapman University, and a member of the editorial board of the Orange County Register. He is also executive director of the Houston-based Center for Opportunity Urbanism. His newest book, The New Class Conflict is now available at Amazon and Telos Press. He is also author of The City: A Global History and The Next Hundred Million: America in 2050.  He lives in Los Angeles, CA.

  • Peak Oil, Yes and No

    I have an Australian friend who works on an oil drilling platform off the coast of Tasmania. He sent these photos from his phone. Pretty cool, huh? These photos got me thinking about the Peak Oil meme. For the uninitiated there are two camps on the subject.

    One camp says there’s an unlimited amount of oil, natural gas, and coal in the ground and new technology will always be able to bring it to market. Since global demand is insatiable there will always be money on the table to incentivize new supply. This camp tends to shrug off environmental concerns and puts people and economic growth first.

    unnamed-8

    The other camp says there’s a fixed amount of fossil fuel in the earth’s crust and at some point the cost and complexity of wrestling the last sour crumbs to the surface will hit a wall the market can’t bear. Concerns about environmental degradation and social justice loom large in this camp.

    When oil reached $147 a barrel in 2007 the Peak Oil folks felt victorious. They also insisted that record high fuel prices, not merely financial chicanery, precipitated the economic crash of 2008. Today fracking, shale oil, and new deep water discoveries have created a glut of supply with significantly lower energy prices. There’s currently a lot of, “We told you so” from the other side.

    My view on the subject is colored by my experiences growing up during the oil shocks of the 1970’s and the resulting economic repercussions. Those shocks were caused by geopolitics in the Middle East during the Yom Kippur War of 1973 and the Iranian Revolution of 1979. They had nothing to do with any physical lack of oil in the world – just supply chain disruptions. But those disruptions were devastating to my family in ways that many people don’t necessarily remember clearly today.

    Screen Shot 2014-12-14 at 12.14.06 AM

    My parents had just purchased their first home in suburban New Jersey the year before the oil crunch hit. I was seven years old. Like many young couples my parents had put every bit of their savings into the down payment and were stretched very thin in terms of the monthly payments. Everyone in our extended family was working class with middle class aspirations so home ownership was at the top of the must-have list. New York City was falling apart back then so they drove an hour and a half south until they found a four bedroom fixer-upper on a quarter acre lot in a good school district that they could afford. The house wasn’t perfect, but my folks were convinced that it could be improved over time with sweat equity. Their mortgage was $203 a month. At the time that was a heavy burden relative to their modest income. (Adjusted for inflation that would be the equivalent of $1,153 today.)

    Economy

    We had oil heat like most people in New Jersey back then. A 300 gallon tank in the back yard would keep the house warm for about a month. From early fall until late spring we burned up six tanks on average per year. When we first moved in heating oil sold for 24¢ a gallon. 24¢ x 300 gallons was $72 (or $409 today). That was the number that my parents used when they put together their household budget before buying the house. At the worst point in the oil crisis heating oil sold for $1.20 a gallon. That’s $360 a tank compared to the mortgage payment of $203 (or $2,045 vs. $1,153 in today’s dollars). Think for a moment about your own mortgage or rent. Now think about what would happen to your personal finances if your utility bill unexpectedly became almost double that sum for half the year.

    At exactly the same time that our household budget collapsed under the weight of that heating bill, the cost of nearly everything else also rose significantly. Oil is used in the manufacture and transport of just about everything from beef and milk to lawn mowers and toilet paper. As fuel prices rose that additional cost rippled through the entire economy at the precise moment people had the least ability to absorb the increases. Consumer demand for many discretionary items collapsed, people lost their jobs, and the overall result was a considerably lower standard of living. That process played out over an entire decade and did serious damage to my family.

    Today most heat in New Jersey comes from natural gas which is cheaper, cleaner, and produced domestically. Problem solved, right? Well… I’m not so sure.

    Screen Shot 2014-12-14 at 3.48.07 PM Google

    1l-image

    The US still imports large amounts of natural gas and oil from other parts of the world – primarily Canada and Mexico along with Venezuela, Columbia, Nigeria, and the Arab nations. These things are priced in a global market so in spite of the “America is the new Saudi Arabia” talk prices can become volatile based on events in other parts of the world. The Bakken shale oil coming out of North Dakota is priced right along with the oil coming out of that oil rig off the coast of Tasmania. If even a small amount of the global oil supply were to be choked off for any reason (the Strait of Hormuz gets shut down due to war, or the Ras Tanura oil terminal is disabled by terrorists) the price of oil would skyrocket worldwide. Natural gas is harder to transport across the seas so that market might appear to be more insulated than the oil market, but if the price of oil jumped it could cause more of those economic ripples that were so troublesome in the ’70s. If you’re unemployed due to an oil shock and you lose your home to foreclosure it may not help that domestic natural gas remains relatively affordable. Peak Oil doesn’t have to be real for me to be concerned about energy and my household security.

    I never ever want to find myself in a similar position as my parents so I organize my affairs as if Peak Oil is a legitimate possibility, regardless of the particulars. Listed below are some of my personal rules. Notice, this isn’t a conservative or a liberal list. There’s no mention of bomb shelters or gas masks or firearms to defend against zombies. Nothing on this list will make anyone poorer or less happy. If life continues to be endlessly prosperous and bountiful no one will be missing out on anything. And by the way, these are all things that our great-grandparents did as a matter of course.

    image

    Keep debt to an absolute minimum. Live below your means in a smaller less expensive place than you can actually afford. Get that mortgage paid off entirely as soon as possible. Unless you have six kids you don’t really need a 2,600 square foot house with a three car garage and a bonus room. Think about the debt you will take on for a fancy kitchen remodel so you can keep up with the Joneses – and then think about how nice it would be to not have a monthly payment of any kind instead. The fancy kitchen is fine if you can pay cash, but that old Formica might look a whole lot better in a mortgage free home. If the economy gets funky and you lose the house to foreclosure the bank could end up enjoying those granite counter tops while you pack your bags and move in with your crazy brother-in-law.

    Screen Shot 2014-12-14 at 4.03.26 PM Screen Shot 2014-12-14 at 4.04.35 PMIMG_3282 (800x600)

    Live in a place where you can actually walk or ride a bicycle to all of your daily needs including work, school, the doctor’s office, the post office… This doesn’t mean you have to give up your car or stop driving. It just means you’ll have options and flexibility. And this doesn’t have to be Manhattan. Lots of small rural towns and some older suburban areas still have these qualities. Don’t let the grand double height entry foyer out in the McMansion subdivision off the side of the highway distract you from what’s really important in life. It ain’t chandeliers. 

    Screen Shot 2014-12-14 at 2.27.04 PM Screen Shot 2014-12-14 at 2.26.13 PM


    unnamed-8


    Figure out how to keep the house heated and cooled with the minimum amount of fuel of any kind. Start with the low hanging fruit by adding lots of insulation. Then think about adding modest extra sources of heat such as a small south-facing greenhouse addition or a back up wood stove. If you have the money you could spring for some technological bells and whistles like solar panels, but that’s very last on the to-do list after the cheaper more effective conservation stuff is done. Remember, Denmark is the most energy efficient, most “green” nation on earth with 20% of it’s power coming from windmills, but the other 80% of their energy still comes from dirty old fossil fuels like coal. They just use it very sparingly. First get your household consumption way, way down. Then think about green power to supply what little you do use.

    unnamed-7 unnamed-13

    Find cost-effective ways to secure a plentiful supply of water that isn’t dependent on mechanical pumps or distant supplies that you have no control over. Rainwater catchment off your roof is one such option. Water security is especially important for people who live in a desert or a region that suffers from long periods of drought.

    51a9c926fb04d664dc00177e._s.fit_h.640_w.640_
    IMG_4847
    IMG_4850
    Pantry storage room


    Keep a really well stocked pantry to help ride out future difficulties. Mine can make a Mormon grandma blush. Maintaining a well stocked pantry is a sensible form of insurance and a hedge against future inflation, unemployment, or temporary shortages.

    Sebastopol with MaAntonia 046 (640x480) Screen Shot 2014-12-14 at 4.32.18 PMjjyfcxytr IMG_5381 (480x640) (2)
    IMG_5386 (480x640)
    Sebastopol with MaAntonia 039 (640x480) Sebastopol with MaAntonia 008 (640x480)

    Produce useful things. Plant a big veggie garden and some fruit trees.  Keep chickens. Keep honey bees. Keep meat rabbits. If you have enough space for a dog, then you have enough space for a couple of small dairy goats. If you’re a vegan pacifist you can adjust by ramping up the garden even more. If you’re a skilled hunter you can fill the freezer with venison.

    unnamed-9 unnamed-11 unnamed-12 unnamed-10

    Cook. (Nuking a tray of Lean Cuisine doesn’t count.) Learn to bake a loaf of bread from scratch. A pot of bean soup is ridiculously inexpensive and dead easy. If your kids will only eat pizza then learn how to make it at home. In fact, teach your kids how to make it themselves as a family project. This stuff isn’t rocket science. While you’re at it learn to sew or knit or do woodworking. These skills can be rewarding unto themselves as hobbies, and you never know when they might actually become necessary. 

    Screen Shot 2014-10-08 at 1.19.32 AM Screen Shot 2014-10-08 at 1.21.00 AM Screen Shot 2014-10-08 at 1.16.59 AM

    Get to know your neighbors and build relationships of trust with like-minded people in your community. These associations can be extremely helpful in a crisis. If Peak Oil never occurs you’ve lived a comfortable, affordable, secure life surrounded by good people. How cool is that?

    John Sanphillippo lives in San Francisco and blogs about urbanism, adaptation, and resilience at granolashotgun.com. He’s a member of the Congress for New Urbanism, films videos for faircompanies.com, and is a regular contributor to Strongtowns.org. He earns his living by buying, renovating, and renting undervalued properties in places that have good long term prospects. He is a graduate of Rutgers University.

  • International Housing Affordability in 2014

    The just released 11th Annual Demographia International Housing Affordability Survey shows the least affordable major housing markets to be internationally to be Hong Kong, Vancouver, Sydney, along with San Francisco and San Jose in the United States. Honolulu, which should reach 1,000,000 population this year (and thus become a major metropolitan market) was nearly as unaffordable as San Francisco and San Jose. An interactive map in The New Zealand Herald illustrates the results.

    Rating Housing Affordability

    The Demographia International Housing Affordability Survey uses the "median multiple" price-to-income ratio. The median multiple is calculated by dividing the median house price by the median household income. Following World War II, virtually all metropolitan areas in Australia, Canada, Ireland, New Zealand, the United Kingdom and the United States had median multiples of 3.0 or below. Since that time, housing affordability has been seriously retarded in metropolitan areas that have been subjected to urban containment policies. This includes virtually metropolitan areas of the United Kingdom, Australia, New Zealand and some markets in the United States and Canada.

    Housing affordability ratings are indicated in Table 1.

    Table 1
    Demographia International Housing Affordability Survey 
    Housing Affordability Rating Categories
    Rating Median Multiple
    Severely Unaffordable 5.1 & Over
    Seriously Unaffordable 4.1 to 5.0
    Moderately Unaffordable 3.1 to 4.0
    Affordable 3.0 & Under


    Table 2 summarizes housing affordability ratings for the 86 major metropolitan areas in the nine nations covered. Apart from China (Hong Kong), the least affordable nation among the major markets is New Zealand, at 8.2, followed by Australia at 6.4. Both nations (and Hong Kong) are rated severely unaffordable. 

    Table 2
    Housing Affordability Ratings by Nation: Major Markets (Over 1,000,000 Population)
     Nation     Seriously Unaffordable (4.1-5.0) Severely Unaffordable (5.1 & Over)    
           
    Affordable (3.0 & Under)  Moderately Unaffordable (3.1-4.0) Total Median Market
     Australia 0 0 0 5 5 6.4
     Canada 0 2 2 2 6 4.3
     China (Hong Kong) 0 0 0 1 1 17
     Ireland 0 0 1 0 1 4.3
     Japan 0 1 1 0 2 4.4
     New Zealand 0 0 0 1 1 8.2
     Singapore 0 0 1 0 1 5
     United Kingdom 0 1 10 6 17 4.7
     United States 14 23 6 9 52 3.6
     TOTAL 14 27 21 24 86 4.2


    Least Affordable Major Markets

    Hong Kong registered the highest median multiple out of the 86 major markets and also in the history of the Survey, at 17.0. Vancouver reached 10.6. Sydney had its worst recorded housing affordability, with a median multiple of 9.8. Adjacent metropolitan areas San Francisco and San Jose had median multiples of 9.2, while Honolulu’s median multiple was 9.0. The ten least affordable major metropolitan areas are shown in Figure 1. In nine of these markets, housing was affordable before adoption of urban containment policy (Hong Kong data is not available).

    Affordable Major Markets

    All of the affordable major markets are in the United States. This includes perhaps the most depressed market, Detroit as well as Atlanta, which has spent most of the last three decades as the fastest growing larger metropolitan area in the high income world. At the same time, Atlanta has consistently been among the most affordable. Detroit’s median multiple is 2.0, while Atlanta’s is 2.9.

    Comparing Demographia Results to The Economist and Kookmin Bank

    This year’s edition includes a comparison of housing affordability multiple data from The Economist’s survey of 40 metropolitan areas in China and Kookmin Bank’s survey of major metropolitan areas in South Korea. The least affordable major markets are in China, New Zealand and Australia, all with severely unaffordable median multiples. The most affordable major markets are in the United States and Korea, both rated as moderately unaffordable (Figure 2).

    Perspective

    Hugh Pavletich, of performanceurbanplanning.com and I have published each of the annual editions, which began in 2005. The perspective of the Demographia International Housing Affordability Survey is that domestic public policy should, first and foremost be focused on improving the standard of living and reducing poverty. This requires policies that facilitate both higher household incomes and lower household expenditures (other things being equal). Housing costs are usually the largest component of household expenditure and it is therefore important that public policy both encourage and preserve housing affordability.

    Housing Affordability and Urban Containment Policy

    However, in recent years, land use policy has not been focused on this concern. Conventional urban theory sees urban containment as a necessity. Yet, urban containment policies are associated with the loss of housing affordability, due principally to their rationing of land for development. This effect is consistent with basic economics – restricting supply of a desired good tends to drive up prices – that has been long established.

    Some of the most important contributions have come from Sir Peter Hall, et al (see The Costs of Smart Growth Revisited), Paul Cheshire at the London School of Economics (New Zealand Seeks to Avoid "Generation Rent") and William Fischel at Dartmouth University (The Consequences of Smart Growth). Donald Brash, former governor of the Reserve Bank of New Zealand attributed the housing affordability losses to "the extent to which governments place artificial restrictions on the supply of residential land" in his introduction to the 4th Annual Edition.

    The Importance of Urban Expansion

    This year’s introduction is provided by Dr. Shlomo Angel, leader of the New York University Urban Expansion Program. Dr. Angel reminds us that "where expansion is effectively contained by draconian laws, it typically results in land supply bottlenecks that render housing unaffordable to the great majority of residents."

    He describes the Urban Expansion Program is "dedicated to assisting municipalities of rapidly growing cities in preparing for their coming expansion, so that it is orderly and so that residential land on the urban fringe remains plentiful and affordable." Urban Expansion Program teams are already working with local officials in Ethiopia and Colombia to achieve this goal. Angel’s previous work documented the association between urban containment policy in Seoul and large house price increases relative to incomes (see Planet of Cities).

    Policies seeking the same goals of plentiful and affordable land on the urban fringe are just as necessary in high income world metropolitan areas.

    As time goes on, the negative consequences of urban containment policy on housing affordability and the standard of living have been increasingly acknowledged. Christine Legarde, managing director of the International Monetary Fund said that "supply-side constraints will require further measures to increase the availability of land for development and to remove unnecessary constraints on land use." in a recent statement on housing affordability in the United Kingdom.

    Similarly a recent feature article in The Economist (see PLACES APART: The world is becoming ever more suburban, and the better for it) noted that the only reliable way to stop urban expansion was to stop them forcefully (such as through urban containment policy). Yet, The Economist continued, "But the consequences of doing that are severe" and cites the higher property prices that have been the result:"

    The Economist continued to note the effect of the policy on households: "It has also forced many people into undignified homes, widened the wealth gap between property owners and everyone else…"

    Wendell Cox is principal of Demographia, an international public policy and demographics firm. He is co-author of the "Demographia International Housing Affordability Survey" and author of "Demographia World Urban Areas" and "War on the Dream: How Anti-Sprawl Policy Threatens the Quality of Life." He was appointed to three terms on the Los Angeles County Transportation Commission, where he served with the leading city and county leadership as the only non-elected member. He was appointed to the Amtrak Reform Council to fill the unexpired term of Governor Christine Todd Whitman and has served as a visiting professor at the Conservatoire National des Arts et Metiers, a national university in Paris.

    Photo: Exurban London

  • Dr. Strangelove: Or How I Learned To Stop Worrying and Love Sprawl (Sort of)

    I’m a longtime advocate of walkable, mixed-use, mixed-income, transit-served neighborhoods. But lately I’ve been having impure thoughts about suburbia. Let me explain.


     Screen Shot 2015-01-06 at 8.45.12 PM Screen Shot 2015-01-06 at 8.43.39 PM

    What often passes for a neighborhood in America is a low grade assemblage of chain convenience stores, big box outlets, franchise muffler shops, multi-lane highways, and isolated cul-de-sacs. Even when it’s physically possible to walk or bike from Point A to Point B it’s not pleasant, safe, or convenient. I bet there are big parts of the town you live in that look like this.

    Screen Shot 2015-01-06 at 8.46.09 PM Screen Shot 2015-01-06 at 8.46.24 PM Screen Shot 2015-01-06 at 8.54.45 PM

    Here’s what’s happened to the housing stock in previously desirable post war suburbs. They’ve aged and were passed over in favor of new development farther out on the edge of town. The homes are out of fashion. They’re too small. They don’t have the right modern features. There are questions about the quality of the local schools. And there’s a general perception that the kinds of people who remain may not make good neighbors. These properties sell at significantly lower prices relative to the larger region. It’s often assumed that they’re unlikely to appreciate in value so they’re considered a poor investment.

    Screen Shot 2015-01-06 at 8.42.30 PM Screen Shot 2015-01-06 at 8.47.44 PM Screen Shot 2015-01-06 at 9.15.26 PM Screen Shot 2015-01-06 at 8.43.09 PM Screen Shot 2015-01-07 at 1.35.38 AM

    This is what the commercial building stock is like. Cheap disposable plywood and cinder block boxes and industrial sheds set behind a patch of asphalt parking lot. These photos happen to be of Portland, Oregon, but they could be from a thousand other places. They’re all the same. This actually looks a lot like where I grew up in New Jersey.

    Sure, the sleek new Pearl District and Historic Pioneer Square are fashionable and urbane. But the vast majority of people will never live there. Most of Portland, like most of America, is sprawl. Forget what you’ve heard about urban growth boundaries, streetcars, and jack booted liberal thugs who make you live in a shoebox apartment and take away your car. The reality on the ground is that most of Portland is indistinguishable from everyplace else.

    Screen Shot 2015-01-07 at 1.34.34 AM Screen Shot 2015-01-07 at 1.44.53 AM

    But here’s the fascinating thing to me – and the source of my recent epiphany about aging sprawl. I always assumed that these neighborhoods would all devolve into the new slums – and many certainly are doing that. Ferguson, Missouri anyone? But it doesn’t have to go that way. These forgotten suburban neighborhoods can just as easily be the new sweet spots for small enterprise and a renewed middle class.

    I stumbled on the intersection of 42nd Avenue and Killingsworth (see all photos above) and thought, “What a crap hole.” But then I started to poke around for a couple of weeks. There’s more going on than immediately meets the eye.

    Here’s the deal. In the 1970’s and 80’s the cheapest real estate was in America’s abandoned downtowns and industrial zones. They were colonized by people looking for freedom – economic freedom from high rents and mortgages, as well as regulatory freedom to do as they wished without the Upright Citizen’s Brigade shutting them down. Now those places have all been picked over by high end developers and transformed into luxury “lifestyle” centers. The same is true of many close-in historic streetcar suburbs like Portland’s Alberta Arts District here. So if you either can’t afford, or simply don’t want, the premium city condo or the deluxe outer suburb McMansion… where do you go to do your own thing on a tight budget?

    IMG_3094 (800x533) IMG_3115 (800x533)   IMG_3122 (800x533) IMG_3126 (800x533) IMG_3109 (800x533)

    This is Pollo Norte here on a miserable intersection where two busy roads collide. A friend brought me here for take away dinner one night and the food was simple, but spectacularly good and it was served by charming people. We arrived at 6:30 on a Tuesday and the place was packed. We were lucky to get the last whole chicken and some side dishes just as they sold out. The place is open until ten but they were overwhelmed by many more customers than they expected. This was their first month in business and they couldn’t keep up with demand. Aside from the great food, the customers all seemed to know each other and were in good spirits even though there wasn’t enough food to go around. They were celebrating the success of a great new local spot. Good beer and companionship were their consolation prizes. Now the owners need to ramp up production and work with their local suppliers to obtain more of the organic free range ingredients in keeping with their mission statement about quality and regional sustainability. This is a good problem for a new business to have.

    Screen Shot 2015-01-07 at 1.01.19 AM Google

    By the way, I pulled this image off Google Street View. This is what the building looked like before the Pollo Norte folks scrubbed it clean, gave it some paint, and infused it with new life. It’s still a piece of crap concrete block bunker, but these buildings can be reinvented to good purpose with the right attitude and community support.

    unnamed-9 unnamed-10 unnamed-11 unnamed-12 unnamed-13
     unnamed-14

    Here’s another tiny concrete bunker a few blocks down the road. It’s owned by a woman who runs a 550 square foot commercial kitchen called Dash here. She rents out space to a variety of small scale producers who need an inspected facility in order to comply with health codes. When I dropped in I was able to speak with Nikki Guerrero as she was readying her Hot Mamma Salsa for market in local shops. here. Nikki started out selling small batches of salsa at farmers markets and now has expanded to several local grocers. She’s successful enough to support herself with the salsa. I don’t think Dash was intentionally organized as an incubator per se, but it serves as the next step up after people are ready to graduate from home cooking (Oregon has a cottage food law here) and street vending. This is not only profitable for the woman who owns the building and cost-effective for people who rent space, but it also cultivates community among various small business people as they share the space. The beauty of this business model is that any cheap ugly building in any uninspiring location can work so long as zoning and NIMBYs don’t get in the way. When your neighbors are industrial sheds and no name convenience stores you don’t get any push back.

    unnamed unnamed-1 unnamed-3 unnamed-4 unnamed-2
    unnamed-5

    Miss Zumstein’s Bakery across the street here is owned by Anja, a native Portlander who finds it difficult to afford property in the trendy parts of town now that the city has become much more expensive than in her girlhood. She recently opened her bakery/cafe on 42nd Ave. because so many of her friends have recently colonized the neighborhood. Price has pushed people into places to live that they wouldn’t necessarily have chosen otherwise. Now the big task at hand is how to make the ugly traffic corridor a proper walkable Main Street on a tight budget. She said the new Pollo Norte is a great indication of the kinds of small independent businesses she’s working with to carve out a new business zone in an otherwise not-so-great location. Anja was very supportive of the people at Dash (Hot Mama Salsa et al) and was thrilled that a new bicycle shop opened up nearby. Cheap ugly space and lots of enthusiastic like-minded people are their primary resources. 

    unnamed-16  unnamed-18 unnamed-20 unnamed-19 unnamed-21

    This is Cat Six Bikes here. Two bike guys just opened up shop seven months ago. They were working for someone else in a more established neighborhood and finally decided to do their own thing. There are so many cyclists in Portland that if there’s a three mile stretch without a bike shop it’s actually a problem for a lot of people who need parts and service. They identified this location, realized it was more affordable than other more fashionable parts of town, and decided to fill the need.

    They almost rented the building that the Pollo Norte people are in now, but the current location was ultimately a better deal. The dentist who owns the building and runs his practice next door provided a deep discount on the rent because he lives in the immediate neighborhood and wanted to help establish more independent businesses in the area. The alternative probably would have been a check cashing place or a cell phone outlet. The guys were able to pull together their business and populate their initial stock and equipment for $10,000 which they had in savings. There was no need for a loan. They’re both handy and were able to do the carpentry and interior work for the shop themselves.

    Screen Shot 2015-01-07 at 1.54.40 AM GoogleScreen Shot 2015-01-07 at 1.57.11 AM GoogleScreen Shot 2015-01-07 at 1.52.51 AM 
    GoogleScreen Shot 2015-01-07 at 1.55.31 AM GoogleScreen Shot 2015-01-07 at 1.50.09 AM GoogleScreen Shot 2015-01-07 at 1.56.17 AM GoogleScreen Shot 2015-01-07 at 1.51.55 AM Google

    But here’s the other thing they mentioned that got me exploring the rest of the neighborhood. The guys share a house – one lives with his girlfriend upstairs and the other lives downstairs. The house is nearby in the Cully neighborhood where little post war homes often have pretty large lots. Many neighbors do varying degrees of urban agriculture – some for a livelihood. This is absolutely not an option in the city center.

    Of course they ride their bikes to work since things are relatively close compared to the far more disbursed newer suburbs far from the downtown core. They were confident that over time they would be able to convince the city to implement road diets that would calm car traffic and make it safer and more pleasant to walk and ride bikes in the area. The primary factor in their favor is that highway expansion and car-oriented improvements are fantastically expensive, while bike infrastructure is ridiculously cheap. They also decided that what the neighborhood lacks in big city urban amenities it makes up for in gardening and door-to-door domestic community as well as significantly lower cost. Many of their friends had already moved to the area so they weren’t alone.

    IMG_2632 (800x533) IMG_2635 (800x533) Screen Shot 2015-01-08 at 9.42.51 PMIMG_3561 (800x533)IMG_3566 (533x800)

    And what about all those tragic little post war ranch homes? Well, it turns out that they’re radically less expensive than either a condo downtown or a McMansion in the newer suburbs. With a little love they can be transformed into something to be proud of. They’re bigger than an apartment, they have a garden, and they’re a whole lot closer to the city center. They’re also a short walk or bike ride to the emerging 42nd Ave, business cluster.

    I’m not saying that all, or even most, aging suburbs will blossom. But it’s at least a possibility. The real question to me is… what pushes a neighborhood down vs. what lifts it up? So far what I’m seeing is that a dead downtown contributes to even deader close in neighborhoods. A thriving downtown attracts more people to the city and creates an economic incentive for people to get creative with the reinvention of not-so-fabulous nearby areas. So if you want your struggling suburb to succeed, support your downtown.

    John Sanphillippo lives in San Francisco and blogs about urbanism, adaptation, and resilience at granolashotgun.com. He’s a member of the Congress for New Urbanism, films videos for faircompanies.com, and is a regular contributor to Strongtowns.org. He earns his living by buying, renovating, and renting undervalued properties in places that have good long term prospects. He is a graduate of Rutgers University.

  • The Inevitability of Tradeoffs, or Understanding New England’s Sky High Energy Costs

    People advance two main sorts of arguments in favor of things for which they advocate: the moral argument (it’s the right thing to do) and the utilitarian one (it will make us better off). As it happens, in practice most people tend to implicitly suggest there’s a 100% overlap between the two categories. That is, if we do what’s right, it will always make us better off too with no down sides at all.

    But is that true?

    For most of us, our life experience suggests that there are always tradeoffs and there’s no such thing as a free lunch. Urbanists tend to argue in way that suggests this isn’t the case. The types of policies advocated by urbanists tend to be presented not only as right in a certain moral sense, but also ones that make society better off in every way. When things go awry in some respect, as they always seem to do, this is always seen as an avoidable defect in policy implementation, not as a problem inherent to the policy itself. Urbanists aren’t alone in this of course. It affects most of the world. But since I cover the urban beat, I’ll focus on us for a minute.

    Today the New York Times opens a window into the type of trade-offs that are studiously avoided in most writings on the subject of climate change. Called “Even Before Long Winter Begins, Energy Bills Send Shivers in New England,” it talks about how a lack of natural gas pipeline capacity is sending electricity and gas costs through the roof as the temperature turns cold.

    John York, who owns a small printing business here, nearly fell out of his chair the other day when he opened his electric bill. For October, he had paid $376. For November, with virtually no change in his volume of work and without having turned up the thermostat in his two-room shop, his bill came to $788, a staggering increase of 110 percent. “This is insane,” he said, shaking his head. “We can’t go on like this.”

    For months, utility companies across New England have been warning customers to expect sharp price increases, for which the companies blame the continuing shortage of pipeline capacity to bring natural gas to the region. Now that the higher bills are starting to arrive, many stunned customers are finding the sticker shock much worse than they imagined.

    I’ve written about this before re:Rhode Island, which is among the most expensive states in America for electricity (most of which is generated by gas). But all of New England is high, with Connecticut ranked as having the country’s most expensive electricity. Gas prices spike every winter to levels far above the rest of the country, as the graph below that I found via City Lab shows:


    This would appear to be a simple problem to solve: just build more pipelines. I included on mylist of starter ideas for improving economic competitiveness in the state.

    Unfortunately, planned pipelines haven’t been built due to environmental opposition:

    The region has five pipeline systems now. Seven new projects have been proposed. But several of them — including a major gas pipeline through western Massachusetts and southern New Hampshire, and a transmission line in New Hampshire carrying hydropower from Quebec — have stalled because of ferocious opposition.

    The concerns go beyond fears about blighting the countryside and losing property to eminent domain. Environmentalists say it makes no sense to perpetuate the region’s dependence on fossil fuels while it is trying to mitigate the effects of climate change, and many do not want to support the gas-extraction process known as hydraulic fracturing, or fracking, that has made the cheap gas from Pennsylvania available.
    ….
    A year ago, the governors of the six New England states agreed to pursue a coordinated regional strategy, including more pipelines and at least one major transmission line for hydropower. The plan called for electricity customers in all six states to subsidize the projects, on the theory that they would make up that money in lower utility bills.

    But in August, the Massachusetts Legislature rejected the plan, saying in part that cheap energy would flood the market and thwart attempts to advance wind and solar projects. That halted the whole effort.

    Here we see the clear tradeoff in action. Reducing carbon emissions has a clear human and economic cost. High electricity costs wallop household budgets in a region with many communities that are struggling or even outright impoverished (as recently as last year, for example, a third of the residents of Woonsocket, RI were on food stamps). This particularly harms poor and minority residents. What’s more, it helps contribute to the region’s low ranking as a place to do business and its anemic job creation.

    Given that gas itself is dirt cheap and will be for the foreseeable future thanks to fracking, hurting residents through high electricity prices designed to drive energy transition is clearly a deliberate policy choice.

    Fair enough if you believe reducing carbon requires subordinating other public goals like more money in poor people’s pockets. But how often is this forthrightly stated by advocates? Almost never.

    Instead we’re treated to article after article in various urbanist publications talking about some awesome green project that’s being implemented somewhere, and how other places ought to do the same thing. There’s lots of doom and gloom about the increased potential for future disasters if the policies aren’t followed. But there’s seldom much about the immediate negative consequences that almost certainly will follow if they are.

    I like energy efficiency. I’m glad we have more fuel efficient cars. I’m very glad I don’t own a car anymore. I’m not so excited about light bulb mandates and other “feel bad” policies that don’t materially affect emissions. But there’s definitely a lot we can do on the energy front.

    But I also care about things like poor people’s electricity bills and economic growth. And I’m not willing to make unlimited sacrifices (including imposing sacrifices on other people) in the name of conservation. I can appreciate that others might make different tradeoffs and want more conservation than I do. But at least they ought to be honest about the costs and harm they are imposing on people in the name of their preferred policy matrix.

    Instead there’s disingenuous talk about the “green economy” powering local economies when there’s no such thing as green industry. Or claiming, as many did in response to my article earlier this year, that Rhode Island’s government is actually conservative, so its problems can’t be laid at the foot of excessively progressive policies imported from places with vastly more economic leverage than most of New England. I guess I did not know that killing gas pipelines in the name of promoting renewable energy via high prices was a Tea Party idea.

    Actually, not even the places that do have huge economic leverage are behaving like this. New York City has more economic leverage than just about anybody. But it also, as the chart above shows, has cheaper gas. One reason is that, as City Lab reported, NYC recently just opened a new gas pipeline into the city:

    A really important thing happened last month to New York City and the rest of the mid-Atlantic. This event will change the daily lives of millions of people, especially during the coldest months of winter. And, despite some protesters, it all went down with less fanfare than Jay Z and Beyonce going vegan for a month.

    An $856-million pipeline expansion began ramping up service, allowing more natural gas to get to New York City consumers. The New York-New Jersey expansion project moves more gas the last few miles from Jersey, which is the terminus for much of the Marcellus Shale gas flowing out of Pennsylvania, into Manhattan. The Energy Information Administration called it “one of the biggest… expansions in the Northeast during the past two decades.” It will bring an additional 800 billion British thermal units (BTU) of gas to the area per day.

    Maybe New England wants to out do New York City when it comes to driving a green energy transition. (NYC seems to be focusing more on climate change adaptation, aka “resiliency,” these days). That’s a valid policy choice to make. But it’s one with consequences.

    Unfortunately, the consequences of these policy choices are seldom presented by their advocates. People only discover them when the costs show up in a way that can be tangible traced back to those policies. Maybe in the case of New England and energy costs, people are starting to wake up to the matter, possibly in a way similar to how sky high housing costs in so many cities woke people up to the actual trade-offs being made in housing policy.

    Advocates are there to advocate of course. So perhaps it’s unrealistic to expect advocates of any stripe to give you the full story. But that’s why we should always pay attention to what the critics of particularly policies have to say. That will give us a more complete picture of the tradeoffs any particular policy set will require.

    Aaron M. Renn is an independent writer on urban affairs and the founder of Telestrian, a data analysis and mapping tool. He writes at The Urbanophile, where this piece originally appeared.

    Photo: Pawtucket Power Plant

    .

  • An Economic Win-Win For California – Lower the Cost of Living

    A frequent and entirely valid point made by representatives of public sector unions is that their membership, government workers, need to be able to afford to live in the cities and communities they serve. The problem with that argument, however, is that nobody can afford to live in these cities and communities, especially in California.

    There are a lot of reasons for California’s high cost of living, but the most crippling by far is the price of housing. Historically, and still today in markets where land development is relatively unconstrained, the median home price is about four times the median household income. In Northern California’s Santa Clara County, the median home price in October 2014 was $699,750, eight times the median household income of $88,215. Even people earning twice the median household income in Santa Clara County will have a very hard time ever paying off a home that costs this much. And if they lose their job, they lose their home. But is land scarce in California?

    The answer to this question, despite rhetoric to the contrary, is almost indisputably no. As documented in an earlier post, “California’s Green Bantustans,” “According to the American Farmland Trust, of California’s 163,000 square miles, there are 25,000 square miles of grazing land and 42,000 square miles of agricultural land; of that, 14,000 square miles are prime agricultural land. Think about this. You could put 10 million new residents into homes, four per household, on half-acre lots, and you would only consume 1,953 square miles. If you built those homes on the best prime agricultural land California’s got, you would only use up 14% of it. If you scattered those homes among all of California’s farmland and grazing land – which is far more likely – you would only use up 3% of it. Three percent loss of agricultural land, to allow ten million people to live on half-acre lots.”

    So why is it nearly impossible to develop land in California? The answer to this is found in the nexus between financial special interests, who benefit from asset bubbles, and powerful environmentalist organizations who apparently view human settlements as undesirable blights that should be minimized. In the San Francisco Bay Area, to offer a particularly vivid example, the Santa Cruz mountains are being targeted to be cleansed of human habitation. Instead of creating wildlife corridors, they are eliminating human corridors. Is this really necessary?

    Human Cleansing – The Evacuation Plan for the Santa Cruz Mountains

    20141203_RingDo you want to live in the mountains?
    Forget it. Only billionaires and non-humans allowed.

    If you are familiar with the San Francisco peninsula, you will see that the area proposed for the “Great Park of the Santa Cruz Mountains” encompasses nearly the entire mountain range. A coalition of environmentalist organizations and government agencies are proposing to create a park of 138,000 acres, that’s 215 square miles, in an area that ought to make room for weekend cabins, mountain dwellers, and vacation communities. Why, in a region where homes cost so much, is so much land being barred to human settlement? The pristine stands of redwoods in Big Basin and Henry Cowell State Park were preserved a century ago. There is nothing wrong with preserving more land around these parks. But do they have to take it all?

    This is far from an isolated example. Urban areas in California, primarily Los Angeles and the San Francisco Bay Area, have been surrounded by “open space preserves” where future development is prohibited and current residents are harassed. Ask the embattled residents of Stevens Canyon in the hills west of the Silicon Valley, if there are any of them left. Once you’re in a “planning area,” watch out. Backed by bonds sold to naive voters, endowments bestowed by billionaires, and the power of state and federal laws that make living on any property at all increasingly difficult, the relentless land acquisition machine continues to gather momentum. Anyone who thinks there isn’t a connection between setting aside thousands of square miles in California for “habitat” and the price of a home on a lot big enough to accommodate a swing set for the kids needs to have their head examined.

    It doesn’t end with open space that is actually purchased, cleansed of humanity, and turned into government ran preserves for plants and wildlife, however. Acquiring permits to build on any land is nearly impossible in California. Land developers who fight year round to try to build housing for people shake their heads in disbelief at the myriad requirements from countless state, federal and local agencies that make the permit process take not months or years, but decades. And it isn’t just farmland, or wetland, or special riparian habitats where development is blocked. It’s everywhere. Even semi-arid rangeland is off limits for housing unless you are prepared to spend millions, fight for decades, and have the staying power to pursue multiple expensive projects simultaneously since many will never, ever get approved.

    What is the result? Here is an aerial photo of a subdivision in the Sacramento area, one that every hedge fund billionaire turned environmentalist in California – especially one who runs cattle on his own special 1,800 acre fiefdom in the Santa Cruz mountains on a property that just happens to be in a “non-targeted area” – might consider living in for the rest of his life in order to understand the human consequences of his ideals – cramped homes on 40′x80′ lots, at a going price in October 2014 of $250,000. Notwithstanding being condemned to a claustrophobic existence at a level of congestion that would drive rats in a cage to madness, $250,000 is a pittance for a billionaire. But for an ordinary worker, $250,000 is a life sentence of mortgage servitude. And even this, the single family dwelling, is under attack by “smart growth” environmentalists and public bureaucrats who prefer density to having to divert payroll and benefits to finance infrastructure. The excess! The waste! Stack them and pack them and let them ride trains!

    Priced to Sell at $250,000 – Housing for Humans on 40′x80′ Lots

    201402_Sacramento-500pxNo mountain air, ocean breezes, or open space for the little people.
    Buy a permit, get in line, visit for a day, but then come home to this.

    When public employee union leadership talk about the importance of paying their members a “middle class” package of pay and benefits, they’re right. Government workers should enjoy a middle class lifestyle. But they need to understand that the asset bubbles caused by high prices for housing are not only making it necessary to pay them more, but are also creating the inflated property tax revenue that they rely on for much of their compensation. They need to understand that the phony economic growth caused by everyone borrowing against their inflated home equity is what creates the stock market appreciation that their pension funds rely on to remain solvent. And they need to understand that all of this is a bubble, kept intact by crippling, misanthropic land use restrictions that hurt all working people.

    There is another path. That is for public employee union leadership to recognize that everyone deserves a chance at a middle class lifestyle. And the way to do that is not to advocate higher pay and benefits to public employees, but to advocate a lower cost of living, starting with housing. One may argue endlessly about how to regulate or deregulate water and energy production, essentials of life that also have artificially inflated costs. But as long as suburban homes consume less water than Walnut orchards – and they do, much less – build more homes to drive their prices way, way down. There’s plenty of land.

    Ed Ring is the executive director of the California Policy Center, where this piece first appeared.

  • California’s Rebound Mostly Slow, Unsteady

    California, after nearly five years in recession, has made something of a comeback in recent years. Job growth in the state – largely due to the Silicon Valley boom – has even begun to outpace the national average. The state, finally, appears to have finally recovered the jobs lost since 2007.

    To some, this makes California what someone called “a beacon of hope for progressives.” Its “comeback” has been dutifully noted and applauded by economist Paul Krugman, high priest of what passes for the American Left.

    In reality, however, California’s path back remains slow and treacherous. California Lutheran University economist Bill Watkins, like other economists, is somewhat bullish on the state’s short-run situation, but suggests that the highly unequal recovery, particularly for the middle class, could prove problematic over time.

    “It’s very narrow and not broad-based,” he observes. “That is very troubling.”

    Things certainly are better than they were, a few years back but still are far from ideal. Right now, California employment is about 1.1 percent above 2007 levels, slightly below the 1.4 percent growth for the country. In contrast, Texas’ economy has created jobs at roughly 10 times that rate. With a population much smaller than California’s, the Lone Star State added more than 1.2 million jobs, compared with 162,000 for California. No great surprise, then, that California has become, by far, the largest exporter of domestic migrants – more than twice that of any other state – to Texas.

    Our unemployment rate, while falling, at 7.3 percent in October was still the nation’s fifth-highest. Even as California has improved, Texas continues to grow as fast, or faster, than the Golden State. According to the U.S. Bureau of Labor Statistics, Texas ranked third in growth over the past year, while California achieved a respectable ninth. It’s possible, though, that with falling oil prices, California might edge out Texas in growth for 2014, but the performance gap – due to the narrowness of the recovery – is likely to remain huge for the foreseeable future.

    Regional Disparities

    Most of the gains in high-wage jobs in California since 2007 have been in professional and business services – up almost 200,000 – a sector that clusters along the coast. Most strong job gains have been concentrated in the Bay Area, primarily along the 50-mile strip from San Francisco to San Jose. At the same time, conditions have remained sluggish both in less tech-oriented Los Angeles and the Inland economies.

    The Sacramento region, for example, remains down 32,000 jobs from 2007 levels; most other Central Valley communities, with the exception of oil-fired Bakersfield, remain stuck at or below their 2007 levels. The Inland Empire may be improving, but remains down 30,000 jobs. Other blue-collar economies, such as Oakland, just across the Bay from booming San Francisco, remains 9,000 jobs below its 2007 level. Los Angeles County, historically the linchpin of the state economy, is down 44,000 jobs.

    Improving the economy in these areas may be very difficult as California’s regulatory environment makes it hard for many firms to expand as easily as they can in Nevada, Arizona, Utah or Texas. Under current circumstances, even when Silicon Valley firms expand their middle-management workforce, they are likely to do it in other more business-friendly states – or abroad – than move further east toward the Central Valley.

    Blue Collar Bust

    One of the great success stories in America the past few years has been the growth of the blue-collar economy. Credit goes to, first and foremost, the energy boom that accelerated growth not only in states like Texas, North Dakota and Oklahoma, but also in Ohio and Pennsylvania, where fracking has expanded. This energy boom has also spilled over into the industrial sector, creating new demand for such things as pipes and sparking a recovery in the auto industry, both in the traditional Rust Belt and the newly industrialized zones of the Southeast.

    California, sadly, has remained largely on the sidelines during this great boom, which is one reason why its population suffers the highest poverty rate in the country. Since 2007, for example, Texas has added some 54,000 jobs in the natural-resource extraction sector. California, with some of the nation’s largest oil reserves, has added 15,000. Critically, this sector provides high-wage jobs not only to geologists and managers, but also to an assortment of blue-collar workers, who earn wages, according to Economic Modeling International, of roughly $100,000 annually.

    A similar pattern can be seen in manufacturing. As the economy has recovered, U.S. industrial expansion has increased, with employment up 2 percent in the past year. Manufacturing in California, meanwhile, has grown at half that rate. Over the past seven years, the Golden State has lost some 200,000 manufacturing jobs, and, with the state’s high energy costs, it’s difficult to see how this pattern will reverse in the foreseeable future.

    Wholesale trade and warehousing represents another key blue-collar industry but California has had virtually no growth here since 2007, while Texas has gained well over 100,000 positions. Future growth for the state in this area may be slowed as trade moves away from the chronic congestion, environmental and labor conflicts surrounding California ports, particularly the key Los Angeles-Long Beach complex. Instead, traffic is headed to more business-friendly facilities along the Gulf Coast and Southeast, as well as to the west coasts of Canada and Mexico.

    Similarly, construction, a critical blue-collar sector, and the one that employs more Latinos than any other, has been slow to grow in California, where construction employment remains 190,000 jobs below 2007 levels. Even in the past year, with rising home prices, California construction growth has lagged well behind that of Texas. Looking forward, with ever stricter restraints on single-family housing, the prospects for growth are limited.

    Silicon Valley a savior?

    Today, most of the hope about California centers on Silicon Valley. “Silicon Valley,” notes economist Watkins, “is the last goose laying golden eggs in California.” It’s hard not to be impressed with the massive wealth accumulation around Silicon Valley and its urban annex, San Francisco. This growth has boosted the state’s improved short-term financial position. But it’s highly improbable that the Valley’s information sector – even at today’s often-absurd valuations – can create enough jobs to sustain the rest of the state. Since 2007, notes economist Dan Hamilton, the state has gained less than 11,000 information jobs, hardly sufficient to make up for the massive losses from the recession.

    So, in what sectors are the job gains concentrated? Generally, not necessarily the sectors that create middle-class jobs. The biggest winners, outside of business services, have been generally lower-wage sectors such as education and health care, up 24 percent since 2007 – a remarkable 464,000 jobs – as well as leisure and hospitality, which has grown 10 percent, or almost 158,000 positions.

    The class implications of this unbalanced growth are profound. Even in Silicon Valley, Latinos and African Americans have seen wages fall, and the area has been home to the nation’s largest homeless encampment. Meanwhile, many solid middle-class employers – Boeing, Chevron, Charles Schwab and Toyota – continue to shift jobs out of state; Occidental Petroleum, a longtime boon to the Southern California economy, pulled up stakes and moved to Houston.

    So, rather than break out the organic champagne to toast California’s comeback, as the Jerry Brown administration would have us do, we would do better to address the ever-growing economic divide in the state. And, to be sure, with little prospects for renewed middle-class and blue-collar job growth, California should not be held up as a model for other states, particularly those that lack both California’s innovation economy and its remarkable natural advantages.

    In fact, neither is this situation ideal for most Californians – particularly if you are concerned about the state’s middle class and the consequences of an expanding, often undereducated population with little prospect of ascending the economic ladder.

    This piece first appeared at the Orange County Register.

    Joel Kotkin is executive editor of NewGeography.com and Roger Hobbs Distinguished Fellow in Urban Studies at Chapman University, and a member of the editorial board of the Orange County Register. His newest book, The New Class Conflict is now available at Amazon and Telos Press. He is author of The City: A Global History and The Next Hundred Million: America in 2050. His most recent study, The Rise of Postfamilialism, has been widely discussed and distributed internationally. He lives in Los Angeles, CA.