Tag: middle class

  • The “Inner Cleveland” of Trendy Cities

    Check out these photos and try to guess where they were taken. If you thought Cleveland, Pittsburgh, Detroit, Buffalo, Cincinnati, or a dozen other Rustbelt towns you’d be mistaken, although your confusion is completely understandable. It’s actually Portland, Oregon – that bastion of liberal, crunchy, hippie, yuppie, hipster, eco-friendliness. Go figure. I’m not putting down Portland. Portland is great. I love Portland. I’m making a point about the reputation of some cities and how we perceive places differently based on a lot of vague stereotypes. If the only images we ever saw of Portland all looked like this it would be hard to persuade people to migrate there – even if the photos don’t portray the complete reality on the ground.

    IMG_0087 (800x533) IMG_0100 (800x533) IMG_0093 (800x533) IMG_0126 (800x533)

    To be perfectly honest, Portland is a small blue collar city out in the sticks with a fairly recent trendy overlay. Its economy is fair-to-middling. Stable, but nothing to write home about. It’s primary source of dynamism comes from inflows of cash, talent, and people from other more expensive west coast cities who seek out a higher quality of life at a lower price point. That migration is fueled by the popular image many people have about the city more than the reality on the ground. Over time this branding becomes a self-fulfilling prophecy. Now check out these next photos.

    Screen Shot 2014-10-27 at 9.19.36 PM Screen Shot 2014-10-27 at 9.17.00 PM unnamed-9 unnamed-8 Screen Shot 2014-11-15 at 9.45.23 AM unnamed

    When you look at these pictures what do you think of? Portland? Seattle? Boston? Chicago? It’s actually Cincinnati.

    Screen Shot 2014-10-11 at 5.35.40 PM Screen Shot 2014-10-11 at 11.14.59 PM Screen Shot 2014-10-11 at 11.11.00 PM Screen Shot 2014-10-11 at 11.32.50 PM Screen Shot 2014-10-11 at 11.28.35 PM

    How about these photos? San Francisco? Maybe a cool part of LA? Nope. It’s Pittsburgh.

    buf4
    buf7 unnamed buf6 buf5 buf1

    How about these photos? Brooklyn? Chicago? Boston? How about Buffalo? Yep. Buffalo.

    IMG_0576 (800x533) IMG_0577 (800x533) IMG_0565 (800x533) IMG_0714 (800x533) (2)

    Are you looking for a great walkable vibrant neighborhood, but really want a single family home with a patch of garden to go along with all the cool nearby shops and fun stuff on Main Street? Maybe something with a bit of historic charm instead of a cookie cutter tract home? Well, for north of $500,000 you can get one of these great places in Portland. Or…

    buf2
    buf3 buf1 buf2

    For about $200,000 you could get something like this in Buffalo. Don’t have $200,000? If you’re willing to work on a fixer upper in a transitional neighborhood really close to the areas that have already gentrified you can find something for $50,000.

    4 unnamed-7 Cincy 34 
    Cincy 33
    Cincy 51 -1
    3 unnamed-2

    How about one of these in Cincinnati for between $50,000 and $200,000?

    Will you make as much money in Cincinnati, Pittsburgh, or Buffalo as you might in Seattle, Chicago, or Brooklyn? No. But when your housing cost has been radically reduced you really don’t need nearly as much cash. It isn’t how much you earn that matters. It’s how much you have left over at the end of the month that determines how well you live. Personally I spend 90% of my life within a five block radius of my apartment in San Francisco. Do I love having ready access to the rest of an amazing city? Absolutely. Could I afford to enjoy most of what San Francisco has to offer if we hadn’t bought our place a million years ago when the Mission was still a cheap funky neighborhood? Not even close.

    Here’s my advice to both young people who are just starting out as well as older people who are struggling to manage in a tough economic environment. Stop fighting expensive housing markets. Stop trying to wedge yourself into an overpriced shoe box apartment in a mediocre neighborhood in a top tier city. Stop driving an hour and a half out to an isolated subdivision just to hold on to your status in a big metroplex. It’s not worth it. The interior of the country is absolutely full of amazing places at a price you can comfortably afford. Give yourself and your family a big raise and leave the coast behind.

    John Sanphillippo lives in San Francisco and blogs about urbanism, adaptation, and resilience at granolashotgun.com. He’s a member of the Congress for New Urbanism, films videos for faircompanies.com, and is a regular contributor to Strongtowns.org. He earns his living by buying, renovating, and renting undervalued properties in places that have good long term prospects. He is a graduate of Rutgers University.

  • The Geography of Lower, Middle and Higher Income Households in the United States

    Data on incomes of households for US counties allow us to see the geographic patterns of poorer, average and richer households. Covering the numbers of households and shares of households that are relatively poor to rich, we get a fascinating picture of American economic diversity. 

    Four maps are used, one each for numbers and shares of lower income: under $40,000, middle income: $40,000 to $100,000, and higher income: over $100,000. These three are the main focus, but I also show a map of mean incomes (aggregate income of the county divided by the number of households), instead of the familiar map of median or typical income, which provides us with some interesting insight into the impact of ultra-affluent households.

    In addition, I present a few tables listing the more “extreme” counties: those highest and lowest in mean income, those with the highest share of rich, middle class and poorer households, and counties with the greatest inequality. These numbers, it should be add, do not factor in the cost of living, nor distinguish between families and non-families, which might produce very different results.

    Lower income households

    Areas with highest shares of lower income households (< $40,000), shown in orange, red and almost black, are quite distinct. Poorest America is concentrated within a massive contiguous zone, punctuated by less poor urban islands, spreading over much of the South and border states, and also encompassing Appalachia and Ozarkia. The northern portion, MO, northern AR, KY, TN, WV, into OH, and western VA and NC, are mainly white and  rural, small town. And there are some mainly white rural low income counties in TX, LA, MS, AL, GA, SC, and NC. But lower income black households dominate in AR, MS, AL, GA, SC, NC into VA, and some American Indian areas in OK.

    Outside the southern core region, there are several  distinct areas of poorer households, (1), core metropolitan counties in Megalopolis (Baltimore, Philadelphia, NJ-NY), (2), heavily Hispanic areas in Texas, along the border with Mexico, (3), Indian reservation areas across the West, (4) and most interesting, several clusters of declining resource dependent counties in ME, northern MI, and a relatively unknown stretch of resource dependent communities in the Pacific Northwest and CA. . 

    In contrast areas with the lowest shares of low income households include suburban Megalopolis, Minneapolis and Chicago, and the Pacific coastal metropolitan areas in general.

    Table 1 lists the very highest share of poorer households for the lower income, < $40,000. The map shows the 30 counties from Table 1 with a higher than 70% share of lower income. These include 11 from Appalachia. Even more counties, 19, are minority dominated. Two are Hispanic and one American Indian. Of the 44 counties with highest share of the poorest category, < $25,000, 14 are in Appalachia, 8 are Hispanic, mostly in TX, 19 are black majority counties in the south,  1 is Indian and 2 are characterized by many poor whites as well as blacks.

    Table 1: Highest shares of low income households
    Counties Poor % Mean Income
    Owsley County, Kentucky 64.4%  $         30,654
    Brooks County, Texas 58.0%  $         38,721
    Allendale County, South Carolina 57.5%  $         37,662
    Breathitt County, Kentucky 57.0%  $         36,737
    Holmes County, Mississippi 57.0%  $         31,294
    Zavala County, Texas 56.7%  $         30,994
    Hancock County, Georgia 56.2%  $         30,209
    Wolfe County, Kentucky 56.2%  $         28,594
    Clay County, Kentucky 55.7%  $         33,904
    Chicot County, Arkansas 55.5%  $         37,631
    McDowell County, West Virginia 55.1%  $         31,002
    McCreary County, Kentucky 55.1%  $         31,517
    Knox County, Kentucky 54.6%  $         35,052
    Leflore County, Mississippi 54.6%  $         35,095
    Noxubee County, Mississippi 54.5%  $         34,046
    Wilcox County, Alabama 54.4%  $         34,585
    Issaquena County, Mississippi 54.3%  $         33,698
    Willacy County, Texas 53.6%  $         36,137
    Magoffin County, Kentucky 53.3%  $         36,653
    Clinton County, Kentucky 53.0%  $         33,799
    Jackson County, Kentucky 53.0%  $         32,884
    Greene County, Alabama 52.7%  $         36,678
    Lee County, South Carolina 52.6%  $         36,284
    Hancock County, Tennessee 52.6%  $         31,170
    Taliaferro County, Georgia 52.4%  $         35,122
    Galax city, Virginia 52.2%  $         39,006
    East Carroll Parish, Louisiana 51.9%  $         51,241
    Quitman County, Mississippi 51.7%  $         33,462
    Hudspeth County, Texas 51.5%  $         34,453
    Telfair County, Georgia 51.4%  $         34,131
    Shannon County, South Dakota 51.3%  $         31,875
    Kinney County, Texas 51.0%  $         36,953
    Claiborne County, Mississippi 51.0%  $         33,386
    Elliott County, Kentucky 51.0%  $         34,786
    Zapata County, Texas 51.0%  $         42,526
    Williamsburg County, South Carolina 51.0%  $         36,065
    Jefferson County, Mississippi 50.9%  $         33,777
    Starr County, Texas 50.9%  $         39,871
    Costilla County, Colorado 50.8%  $         38,967
    Tallahatchie County, Mississippi 50.8%  $         34,418
    Lake County, Tennessee 50.7%  $         37,016
    Coahoma County, Mississippi 50.6%  $         42,045
    Bell County, Kentucky 50.4%  $         36,482
    Sunflower County, Mississippi 50.0%  $         37,361

    It is fascinating that while the poor black, Hispanic and Indian poorer areas tend to vote Democratic, the northern poor white areas, especially in Appalachia, now generally support Republicans.

    Middle income households:  $40,000-$100,000

    While it could be argued that my $40 to $100k range is too narrow for middle classes, I don’t think so, at least for most areas, and I feel that the data reveal the income polarization of American society, with middle classes getting squeezed by the rising shares of the poorer and richer.

    From the map the most telling feature is how sparse are counties with the highest shares of middle incomes. There is a polarization, reflecting a processes of deindustrialization, and the increasing income disparities between professional and the new service workers.  Shares over 40% are predominantly suburban and exurban in the eastern half of the country. They are well represented across the South, most prominently in TX, OK, TN, and VA, but far more pervasive in the Midwest, most notably in MN (greater Minneapolis), WI, IA, MO, IL, IN, and to some degree around cities that still have an industrial base and/or a productive hinterland. A secondary set of counties with high middle income shares are spread across the Mountain West, but different in character, often rural to small city, and notably in UT, CO, and WY. Note their total absence in mighty CA, where the middle class, as we define it, is clearly shrinking.

    In table 2 I list the 45 counties with 46 to 64% middle income shares. Many are quite small and none is very populous. The state with the most such counties is UT, then MN, CO, VA, NE, and IA. It may be significant that Utah has by far the highest share of these high middle income counties. Generally counties with high shares of middle class households have the lowest income inequality.

    Table 2: Highest shares of middle income households
    Counties Mid-Income Households Low Income % Mid-Income % High Income %
    Skagway Municipality, Alaska              206 16.8% 53.4% 27.2%
    Craig County, Virginia           1,045 32.9% 52.5% 10.0%
    McPherson County, Nebraska              104 27.5% 51.0% 5.9%
    Reagan County, Texas              581 27.7% 50.9% 14.2%
    Bath County, Virginia           1,029 36.6% 50.8% 5.6%
    Rich County, Utah              386 24.7% 50.7% 12.1%
    Tooele County, Utah           8,937 27.5% 50.4% 18.0%
    Storey County, Nevada              912 28.4% 49.9% 18.0%
    Moody County, South Dakota           1,281 33.5% 49.4% 9.6%
    Manassas Park city, Virginia           2,071 17.9% 49.2% 28.5%
    Iowa County, Iowa           3,230 35.0% 48.5% 12.9%
    Grundy County, Iowa           2,442 32.9% 48.4% 13.5%
    Lyon County, Iowa           2,095 38.4% 48.0% 8.4%
    Grand County, Colorado           2,557 28.8% 48.0% 18.9%
    Chisago County, Minnesota           9,267 26.6% 47.9% 20.8%
    Lincoln County, Wyoming           3,094 32.5% 47.8% 15.7%
    Greenlee County, Arizona           1,586 38.5% 47.7% 6.3%
    Box Elder County, Utah           7,436 32.8% 47.6% 13.9%
    King William County, Virginia           2,814 26.7% 47.6% 20.7%
    Lincoln County, South Dakota           7,494 25.2% 47.5% 23.4%
    Teton County, Idaho           1,791 32.8% 47.3% 14.1%
    Routt County, Colorado           4,766 22.6% 47.0% 21.9%
    Paulding County, Georgia        21,807 28.7% 47.0% 18.9%
    Sherburne County, Minnesota        13,684 22.2% 46.8% 26.7%
    Juab County, Utah           1,422 34.8% 46.7% 13.8%
    Calumet County, Wisconsin           8,505 27.7% 46.6% 20.6%
    Wayne County, Utah              418 37.5% 46.5% 13.3%
    Dodge County, Minnesota           3,392 27.3% 46.5% 21.7%
    Sioux County, Iowa           5,351 37.3% 46.4% 10.0%
    Stanton County, Kansas              339 34.6% 46.4% 8.9%
    Iowa County, Wisconsin           4,498 35.3% 46.3% 14.1%
    Cameron Parish, Louisiana           1,233 35.1% 46.3% 16.4%
    Nicollet County, Minnesota           5,624 31.7% 46.3% 16.1%
    Wabaunsee County, Kansas           1,272 39.3% 46.3% 11.1%
    Wasatch County, Utah           3,308 24.5% 46.2% 23.9%
    Pershing County, Nevada              914 37.6% 46.2% 11.2%
    Ouray County, Colorado              783 30.0% 46.0% 19.0%
    Morgan County, Utah           1,247 21.0% 45.9% 27.0%
    Park County, Colorado           3,248 24.1% 45.9% 24.0%
    Logan County, Nebraska              147 42.8% 45.9% 4.4%
    Carson County, Texas           1,109 34.9% 45.9% 16.1%
    Emery County, Utah           1,735 38.4% 45.9% 9.6%
    Cass County, Nebraska           4,408 27.5% 45.9% 21.2%
    Jasper County, Indiana           5,602 33.7% 45.8% 15.0%
    Polk County, Nebraska           1,019 40.1% 45.7% 8.6%


    High Income counties

    The geography of higher income counties is again completely different – and rather amazing. Higher shares of richer households are located overwhelmingly in large metropolitan areas in all regions of the country, predictably but most dominant around greater New York City. The few rural small town counties are generally the resort playgrounds of the rich, as found in CO. 

    Table 3A lists the counties with the highest shares of higher incomes (>$100,000). Of the 32 higher income counties, 23 are in Megalopolis, including the 3 richest areas, from 53% to 59% high income. Of the 32 richest counties, 11.1% to 19% of the households are above $200,000, again 22 counties are in Megalopolis, then 4 in CA (Bay Area). 

    Table 3A: Highest share of rich households
    Counties Rich % $100-200,000 Rich % Above $200,000 Mean Income
    Falls Church city, Virginia 35.4% 19.6%  $  134,264
    Hunterdon County, New Jersey 33.0% 17.5%  $  130,723
    Fairfax County, Virginia 35.8% 17.4%  $  132,662
    Loudoun County, Virginia 41.7% 17.4%  $  134,098
    Marin County, California 28.2% 16.8%  $  128,544
    Somerset County, New Jersey 32.6% 16.0%  $  129,222
    Fairfield County, Connecticut 25.0% 16.0%  $  130,074
    Westchester County, New York 24.7% 15.8%  $  128,127
    New York County, New York 19.5% 15.8%  $  122,620
    Morris County, New Jersey 32.7% 15.6%  $  128,371
    Howard County, Maryland 36.3% 15.4%  $  123,234
    Montgomery County, Maryland 31.6% 15.3%  $  125,557
    Pitkin County, Colorado 20.0% 15.1%  $  134,267
    Arlington County, Virginia 32.4% 15.1%  $  121,315
    Nantucket County, Massachusetts 26.3% 14.4%  $  137,811
    Nassau County, New York 33.0% 13.9%  $  121,567
    San Mateo County, California 29.1% 13.8%  $  118,774
    Santa Clara County, California 30.3% 13.5%  $  113,161
    Skagway Municipality, Alaska 14.2% 13.0%  $    93,822
    Fairfax city, Virginia 35.4% 12.6%  $  114,007
    Goochland County, Virginia 27.9% 12.5%  $  118,743
    Los Alamos County, New Mexico 40.3% 12.3%  $  117,400
    Williamson County, Tennessee 31.1% 12.3%  $  114,801
    Bergen County, New Jersey 28.4% 12.1%  $  111,219
    Borden County, Texas 16.4% 11.9%  $    93,417
    Chester County, Pennsylvania 29.6% 11.8%  $  110,798
    San Francisco County, California 24.9% 11.7%  $  102,267
    Monmouth County, New Jersey 29.3% 11.7%  $  109,042
    Alexandria city, Virginia 28.4% 11.2%  $  110,671
    Norfolk County, Massachusetts 28.7% 11.2%  $  108,887
    Douglas County, Colorado 38.4% 11.1%  $  117,692
    Rockland County, New York 30.1% 11.1%  $  105,450

    Table 3B which lists the 37 counties with the highest MEAN incomes, including 9 around Washington DC, 8 around New York, and 3 around San Francisco, reinforcing the fact of the concentration of wealth.   

    Table 3B: Mean Income (highest)
    County Rich % $100-200,000 Rich % Above $200,000 Mean Income
    Nantucket County, Massachusetts 26.3% 14.4%  $  137,811
    Pitkin County, Colorado 20.0% 15.1%  $  134,267
    Falls Church city, Virginia 35.4% 19.6%  $  134,264
    Loudoun County, Virginia 41.7% 17.4%  $  134,098
    Fairfax County, Virginia 35.8% 17.4%  $  132,662
    Hunterdon County, New Jersey 33.0% 17.5%  $  130,723
    Fairfield County, Connecticut 25.0% 16.0%  $  130,074
    Somerset County, New Jersey 32.6% 16.0%  $  129,222
    Marin County, California 28.2% 16.8%  $  128,544
    Morris County, New Jersey 32.7% 15.6%  $  128,371
    Westchester County, New York 24.7% 15.8%  $  128,127
    Montgomery County, Maryland 31.6% 15.3%  $  125,557
    Howard County, Maryland 36.3% 15.4%  $  123,234
    New York County, New York 19.5% 15.8%  $  122,620
    Nassau County, New York 33.0% 13.9%  $  121,567
    Arlington County, Virginia 32.4% 15.1%  $  121,315
    San Mateo County, California 29.1% 13.8%  $  118,774
    Goochland County, Virginia 27.9% 12.5%  $  118,743
    Douglas County, Colorado 38.4% 11.1%  $  117,692
    Los Alamos County, New Mexico 40.3% 12.3%  $  117,400
    Williamson County, Tennessee 31.1% 12.3%  $  114,801
    Fairfax city, Virginia 35.4% 12.6%  $  114,007
    Santa Clara County, California 30.3% 13.5%  $  113,161
    Bergen County, New Jersey 28.4% 12.1%  $  111,219
    Delaware County, Ohio 32.3% 10.6%  $  110,917
    Chester County, Pennsylvania 29.6% 11.8%  $  110,798
    Alexandria city, Virginia 28.4% 11.2%  $  110,671


    Table 3C lists the counties with the most extreme income inequality, characterized by high shares of the poorer and the richer, with lower shares of the middle classes. The list includes both inequality based on high shares of lower income (<$4,000) and higher income (>$100,000), and as estimated from highest shares of the poorest (<$25,000) and richest (>$200,000) households. Many counties are on both lists. New York (Manhattan) and San Francisco top both lists. Other counties prominent on both include Fairfield, CT; Westchester, NY; Norfolk, MA; Monmouth, NY; Contra Costa, CA; Rockland NY; and Goochland, VA – all suburban or exurban. Summit, UT and Pitkin, CO are rural resort areas in the west.  Many of the core counties on the lists are high in minority populations, e.g., New York; Fulton, GA; Washington, DC; and Alameda, Contra Costa, Orange, and Ventura, CA.

    Table 3C: Most Unequal Counties
    Counties <$40k $40-$100k >$100k
    New York County, New York 35.0% 26.5% 35.2%
    San Francisco County, California 30.9% 28.8% 36.5%
    Pitkin County, Colorado 30.0% 29.8% 35.1%
    Fulton County, Georgia 36.7% 29.9% 28.7%
    Westchester County, New York 25.7% 30.1% 40.6%
    District of Columbia, District of Columbia 35.8% 30.1% 29.6%
    Fairfield County, Connecticut 25.1% 30.5% 41.0%
    Rappahannock County, Virginia 35.3% 30.5% 31.3%
    Goochland County, Virginia 25.2% 30.8% 40.4%
    Rockland County, New York 24.6% 31.2% 41.2%
    Monmouth County, New Jersey 24.2% 31.4% 41.0%
    Kendall County, Texas 31.4% 32.0% 33.2%
    Boulder County, Colorado 32.4% 32.1% 31.3%
    Alameda County, California 29.6% 32.5% 34.1%
    Norfolk County, Massachusetts 24.1% 32.6% 39.9%
    Mercer County, New Jersey 28.7% 32.9% 35.0%
    Middlesex County, Massachusetts 25.6% 33.0% 37.7%
    Contra Costa County, California 24.9% 33.0% 38.4%
    Essex County, Massachusetts 32.6% 33.1% 30.6%
    Summit County, Utah 23.5% 33.5% 38.9%
    Union County, New Jersey 30.2% 33.7% 32.0%
    Bristol County, Rhode Island 30.7% 33.9% 31.6%
    Santa Cruz County, California 31.2% 33.9% 30.8%
    Napa County, California 29.4% 33.9% 32.4%
    Richmond County, New York 29.1% 34.2% 33.0%
    Ventura County, California 25.1% 34.6% 36.1%
    Orange County, California 25.3% 34.6% 36.0%
    St. Johns County, Florida 30.8% 34.9% 29.0%
    Montgomery County, Pennsylvania 24.5% 35.2% 36.3%
    Oakland County, Michigan 29.9% 35.2% 30.8%
    Newport County, Rhode Island 29.4% 35.5% 30.3%
    King County, Washington 28.4% 35.6% 31.8%
    Placer County, California 25.6% 35.6% 34.6%
    San Diego County, California 31.4% 35.6% 28.5%
    Counties <$25k >$200k
    New York County, New York 24.5% 15.8%
    San Francisco County, California 20.9% 11.7%
    Borden County, Texas 18.9% 11.9%
    Fairfield County, Connecticut 15.3% 16.0%
    Westchester County, New York 15.2% 15.8%
    Norfolk County, Massachusetts 15.0% 11.2%
    Pitkin County, Colorado 14.6% 15.1%
    Monmouth County, New Jersey 14.4% 11.7%
    Contra Costa County, California 14.3% 10.7%
    Rockland County, New York 14.2% 11.1%
    Bergen County, New Jersey 13.9% 12.1%
    Santa Clara County, California 13.5% 13.5%
    Nantucket County, Massachusetts 13.5% 14.4%
    Goochland County, Virginia 13.3% 12.5%
    Summit County, Utah 13.2% 10.8%
    Marin County, California 13.1% 16.8%
    Lake County, Illinois 12.6% 10.9%
    Chester County, Pennsylvania 12.0% 11.8%
    Alexandria city, Virginia 11.6% 11.2%
    San Mateo County, California 11.6% 13.8%
    Nassau County, New York 11.4% 13.9%
    Williamson County, Tennessee 10.8% 12.3%
    Delaware County, Ohio 10.7% 10.6%
    Fauquier County, Virginia 10.5% 10.1%
    Arlington County, Virginia 10.3% 15.1%
    Putnam County, New York 10.0% 10.4%

    It doesn’t take much of a cynic to conclude that the way to get rich is to be around Wall Street (the pinnacle of capital) or around the U.S. Congress, the pinnacle of government largess (including lobbyists for Wall Street). Do you doubt? Please see the final map of mean income. Yes, Seattle, Denver, Chicago, Minneapolis, and Atlanta are represented at the table, as is the San Diego to San Francisco corridor, but Megalopolis dwarfs them all.

    As if this were not scary enough, consider the relation between these income figures and how Americans voted in for president in 2012. Without showing a map, I can simply state that the areas that provided the extra millions of votes for Obama are precisely the giant metropolitan areas, suburbs and exurbs as well as core counties, with the highest mean income and shares of the rich. While it is also true that Obama carried poorer minority areas, rural as well as metropolitan, he LOST most areas of poor to middle income whites, urban and rural. Weirdly, both the rich (professionals) and the poor (minorities) in the most unequal counties are cores of Democratic strength. The traditional economic basis for Democrat versus Republican partisan difference has essentially disappeared, replaced by distinctions of culture and race, leading to the current screwed up state of not only our political party system, but of governance more widely, and yes, of society itself.

    Richard Morrill is Professor Emeritus of Geography and Environmental Studies, University of Washington. His research interests include: political geography (voting behavior, redistricting, local governance), population/demography/settlement/migration, urban geography and planning, urban transportation (i.e., old fashioned generalist).

  • Don’t Boost Cities by Bashing the ‘Burbs

    There is nothing like a trip to Washington, D.C., to show how out of touch America’s ruling classes have become. I was in the nation’s capital to appear on a panel for a Politico event that – well after I agreed to come – was titled “Booming Cities, Busting Suburbs.”

    The notion of cities rising from the rotting carcass of suburbia is widely accepted today by much of our corporate, academic and media leadership. This notion has been repeatedly embraced as well by the Obama administration, whose own former secretary of Housing and Urban Development declared several years back that the suburbs were dying, and people were “moving back to the central cities.”

    Some on Wall Street also embrace this notion. Having played a pivotal role, along with regulators, in the housing crash of the late 2000s, some financiers have been buying up foreclosed homes for rental income and also back many high-density projects, which are built to house, in large part, those who cannot buy a home, particularly the younger generation.

    As the Economistrecently pointed out, the suburban house, or a house in less-crowded parts of cities, is an aspiration of upwardly mobile people in the United States and around the world. Surveys, including those conducted by Smart Growth America, demonstrate that the vast majority of Americans prefer single-family houses; most millennials seem to feel that way, too, according to both a Frank Magid Associates survey and a more recent one from Nielsen. As the economy improves, and the people in the millennial generation enter their thirties, it is likely that they – as did other generations – will start buying houses as they start families.

    At the very least, suburbia clearly predominates among Americans. Roughly 85 percent of people in our major metropolitan areas, notes demographer Wendell Cox, inhabit suburban neighborhoods, dominated by cars and single-family houses, even though they live within the boundaries of the largest cities. They are definitively not moving en masse into the urban core. In the most recent census, from 2010, the urban core, defined as territory within two miles of city hall, grew by 206,000 people. In contrast, areas 10 or more miles away from an urban center grew by some 15 million people.

    Nor has this appreciably changed over time. Since the housing bust, the growth rates of core cities and suburbs are now basically even, but the preponderance of suburban population means that the periphery is adding many more people. From 2010-13, the suburbs added 5.4 million people, while the core cities have added 1.5 million, accounting for less than 30 percent of all major metropolitan population growth.

    Other recent analyses, such as from the real estate website Trulia, confirm that this pattern continues. Meanwhile, demand for suburban office space, often seen as dying by urban boosters, now is recovering faster than that of the central core, according to the consultancy CoStar.

    The boom in U.S. energy production, and the resulting drop in energy prices, could accelerate the suburban recovery. For years, smart-growth advocates counted on pricey “peak oil” to turn suburbs into “remote slums.” Brookings has estimated that every 10 percent rise in oil prices lowers suburban housing prices by several thousand dollars while raising prices closer in. Not surprisingly, cheaper energy does not sit well with the progressive clerisy, as epitomized by a recent New Yorker article, which likens it to “an industrial form of crack.”

    No one buys the mindless embrace of higher housing density and expanding rail transit more than urban mayors. At the Politico event in Washington, Salt Lake City Mayor Ralph Becker insisted gamely that transit is “less expensive” than building and maintaining roads, which is not even remotely the case. Transit’s fully loaded capital and operating expenditures per passenger mile are more than four times that of the automobile and road system. Nor is the Salt Lake City area about to become a region of strap hangers: 3.2 percent of workers in the Salt Lake City region commute by transit, down slightly since 2000.

    The real Salt Lake City, Becker’s perception notwithstanding, is very much a sprawled one. The downtown may have been spiffed up a bit, largely due to a massive investment by the Mormon church, but, since 2010, the periphery has grown by 48,000 people, compared with 5,000 in the city. In 1950, Salt Lake City accounted for 66 percent of the region’s population; today that is a mere 17 percent.

    Another of my fellow panelists, Atlanta Mayor Kasim Reed, is fantastical in his embrace of transit and the future of metropolitan geography. Reed counts on millennials transforming his city, but, overall, the millennial population share in urban cores has dropped since 2010, with strong percentage declines registered in such varied core counties in New York, San Francisco, St. Louis and Washington, D.C., as well as Atlanta.

    Reed, something of a darling of the Davos crowd, presides over something around 8 percent of the Atlanta metro area’s population, down from half in 1950. The most recent estimates from the Census Bureau, suggest that Atlanta may have gained 28,000 people since 2010, compared with 209,000 gained in the suburbs. But even this must be taken with a grain of salt; in the most recent census, it turned out that estimates in many cities, including New York, Chicago and St. Louis, were greatly inflated – in metro Atlanta’s case, by over 100,000.

    Although poverty has seeped out of central Atlanta and into the periphery, in part due to the relatively small size of its urban core, the poverty rate in the city is close to twice that of the suburbs, which mirrors the national trend. Its crime rate ranks among the nation’s worst, up there with Detroit, Oakland and St. Louis. An Atlanta resident is roughly more than three times more likely than an average Georgian to become the victim of a violent crime. Although worse than most, Atlanta’s metropolitan core is not unusual; overall, the rate of violent crime in urban cores, although down from 2001, is almost four times higher than that of suburbs, where the rate has also declined.

    Nor is Atlanta about to turn into a Southern version of successful transit “legacy” cities like New York or even Washington. Despite a massive investment in rail transit, the regional share of transit commuting today, according to Census Bureau estimates, is a mere 3.1 percent, compared with 3.4 percent in 2000. In reality, transit ridership has risen mostly in a handful of “legacy” cities, notably New York, while overall the share of transit commuters nationally is almost a whole percentage point lower than in 1980. In most U.S. metropolitan areas, including Atlanta, more people telecommute than take transit.

    To be sure, Atlanta is, in certain spots, looking better. Upscale districts, like Midtown and Buckhead, have rebounded smartly from the real estate crash, but downtown Atlanta has among the highest vacancy rates in the country. The once-ballyhooed Underground Atlanta downtown shopping and entertainment district is widely seen as something of a disaster. Progressive rhetoric aside, Atlanta, according to the liberal Brookings Institution, has the greatest income inequality of any large city in America, even worse than luxury cities like San Francisco, New York or Boston.

    To be sure, one can still make a sounder case for Atlanta’s evolution. There is a sizeable youth demographic, particularly students and childless households, who are attracted to such places, and some companies find the central location better than that of the suburban periphery. It is still a liveable city with many nice, relatively low-density neighborhoods that could accommodate middle-class families. It possesses a canopy of trees – leading some to call it “a city in a forest.”

    Cities like Atlanta are important, and it’s great that they are doing better than they were three decades ago. But the urban turnaround, more tentative in places like Atlanta than in Manhattan, does not have to be predicated, as the Politico event seemed to suggest, on the projected ruin of suburban aspirations. Despite the hopes nurtured in places like Washington, D.C., and among parts of financial oligarchy, suburb-dwelling Americans are likely to dominate our housing market, economy and demography for generations to come.

    Rather than target suburbia for extinction, cities should focus on the hard work ahead of them. Even as pundits worry about the loss of artists in high-cost cities, the urban future really depends on holding onto middle-class families and millennials as they age. To keep them, mayors need to focus not just on the densest sections of the urban core and rail transit, but on improving the roads, reducing crime, improving both neighborhoods and the broad-based economy. And they must radically reform the schools, critical to luring middle-class families with children. Rather than celebrating the supposed demise of suburbia, city leaders like Mayor Reed should take heed of the biblical injunction: “Physician, heal thyself.”

    This piece first appeared at the Orange County Register.

    Joel Kotkin is executive editor of NewGeography.com and Roger Hobbs Distinguished Fellow in Urban Studies at Chapman University, and a member of the editorial board of the Orange County Register. His newest book, The New Class Conflict is now available at Amazon and Telos Press. He is author of The City: A Global History and The Next Hundred Million: America in 2050. His most recent study, The Rise of Postfamilialism, has been widely discussed and distributed internationally. He lives in Los Angeles, CA.

  • Seven Years Ago, Wall Street was the Villain. Now it Gets to Call the Shots

    The recent passage by Congress of new legislation favourable to loosening controls on risky Wall Street trading is just the most recent example of the consolidation of plutocratic power in Washington. The new rules, written largely by Citibank lobbyists and embraced by the Obama administration, allow large banks to continue using depositors’ money for high-risk investments, the very pattern that helped create the 2008 financial crisis.

    This move was supported largely by the establishment in each party. Opposition came from two very different groups: the Tea Party Republicans, who largely represent the views of Main Street businesses, and a residue of old-line progressive social democrats, led by Massachusetts Senator Elizabeth Warren.

    Support for big finance is no surprise from Republicans, who are used to worshipping at the altar of Wall Street. But the suborning of “progressivism” to Wall Street has been a permanent feature of this administration. From the onset of his presidential run, Barack Obama had strong ties to Wall Street grandees. New York Times Wall Street maven Andrew Ross Sorkin noted in 2008 how Obama had “nailed down the hedge fund vote”.

    The ultra-rich so backed the president that, at his first inaugural, noted one sympathetic chronicler, the biggest problem for donors was finding parking space for their private jets. Since then, despite occasional flights of populist rhetoric, the president has kept close ties with top financial firms, including the well-connected Jamie Dimon, chairman of JP Morgan, often called Obama’s “favourite banker”. He appears to have been instrumental in getting Democrats to support the recent loosening of financial controls on big banks.

    These Wall Street connections have continued to play dividends for the president, in terms of contributions. The financiers benefited from Obama’s choice of financial managers, such as former treasury secretary Tim Geithner, widely known as a reliable ally of the financial sector. (He liked to explain his support by equating its importance to that of the technology and manufacturing industries.) To no sensible person’s surprise, Geithner, when he left the Treasury last winter, found his reward by joining a large private equity firm. (By way of completing the circle, Geithner’s successor, Jacob Lew, used to work for Citibank.)

    The Justice Department has also been cosy with the plutocracy. Attorney general Eric Holder allowed Wall Street a kind of “get out of jail free card” by failing to launch tough prosecutions of the grandees. In contrast to the situation under previous administrations, both Republican and Democratic, the financial plutocrats have not been forced to pay for their numerous depredations. Instead, most prosecutions have been aimed at low-level traders, Ponzi schemers or inside traders.

    So if you still think 2008 and the financial crisis changed everything, still think of it as a progressive triumph, think again. Instead of the brave new world of reformed finance, what’s been created in the US is something close to a perfect world, policy-wise, for the plutocrats. The biggest rewards have come from an economic policy, backed by the Federal Reserve and the administration, that has maintained ultra-low interest rates. This has forced investors into the market, at the expense of middle-class savers, particularly the elderly. The steady supply of bond purchases has essentially given free money to those least in need and most likely to do damage to everyone else.

    The results make a mockery of the Democrats’ attempts to stoke populist sentiments. In this recovery, the top 1% gained 11% in their incomes while the other 99% experienced, at best, stagnant incomes. As one writer at the Huffington Post put it: “The rising tide has lifted fewer boats during the Obama years – and the ones it’s lifted have been mostly yachts.” If this had occurred during a Republican administration, many progressives would have been horrified. But Democrats, led by New York senator Charles Schumer, Wall Street’s consigliere on the Hill, have been as complicit as Republicans in coddling Wall Street. Democrats, for example, despite their rhetoric about inequality and fairness, have refused to challenge the outrageous discount on taxes for capital gains as opposed to income. A successful professional making $300,000 a year is often taxed at rates twice as high as the rate paid by hedge fund investors, venture capitalists, tech entrepreneurs and Wall Street stock jobbers.

    At the same time, the Obama years have been something of a disaster for Main Street, where most Americans work. A 2014 Brookings report revealed that small business “dynamism”, measured by the growth of new firms compared with the closing of older ones, has declined significantly over the past decade, with more firms closing than starting for the first time in a quarter of a century.

    Small banks, long a critical source of funding for small businesses, have also been pummelled by the very regulatory regime that also allows mega-banks to enjoy both “too big to fail” protections as well as their sacred right to indulge their most cherished risk-oriented strategies. In 1995, the assets of the six largest bank holding companies accounted for 15% of gross domestic product; by 2011, aided by the massive bailout of “ big banks”, this percentage had soared to 64%.

    These trends do much to explain what happened in the recent midterm elections, which saw a massive shift of middle- and working-class voters, especially whites, to the Republicans. Increasingly, Americans suspect that the economic system is rigged against them. By a margin of two to one, according to a 2013 Bloomberg poll, adults feel the American Dream is increasingly out of reach. This pessimism is particularly intense among white working-class voters and large sections of the middle class .

    The other major cause for the Democratic demise in November was the low turnout among minority voters. They certainly have ample reason to be indifferent. Both African American and Latino incomes have declined during the current administration, in large part because neither group tends to benefit much from the appreciation of stocks and high-end real estate.

    In caving in to Wall Street and its economic priorities, members of both parties have demonstrated where their primary loyalties lie. Amid the obscene levels of compensation going to the financial grandees, it seems the ideal time for politicians, right or left, to challenge Wall Street’s control of Washington. High finance has so devastatingly rocked the world of the middle and working classes. Voters, it might be thought, now need leaders who will take these grandees down a notch or two.

    This piece first appeared at The Guardian.

    Joel Kotkin is executive editor of NewGeography.com and Roger Hobbs Distinguished Fellow in Urban Studies at Chapman University, and a member of the editorial board of the Orange County Register. His newest book, The New Class Conflict is now available at Amazon and Telos Press. He is author of The City: A Global History and The Next Hundred Million: America in 2050. His most recent study, The Rise of Postfamilialism, has been widely discussed and distributed internationally. He lives in Los Angeles, CA.

    Wall Street bull photo by Bigstockphoto.com.

  • Exodus of the School Children

    The urban cores of the nation’s 52 major metropolitan areas (over 1 million population) lost nearly one-fifth of their school age population between 2000 and 2010. This is according an analysis of small area age group data for children aged 5 to 14 from Census Bureau data, using the City Sector Model. Over the period, the share of 5 to 14 age residents living in the functional urban cores declined from 15.0 percent to 12.0 percent (Figure 1).

    The City Sector Model

    The City Sector Model analysis avoids the exaggeration of urban core data that necessarily occurs from reliance on the municipal boundaries of core cities (which are themselves nearly 60 percent suburban or exurban, ranging from as little as three percent to virtually 100 percent). It also avoids the use of the newer "principal cities" designation of larger employment centers within metropolitan areas, nearly all of which are suburbs, but are inappropriately joined with core municipalities in some analyses. The City Sector Model" small area analysis method is described in greater detail in Note 1 below (previous articles are listed in Note 2). The approach is similar to the groundbreaking work of David Gordon, et al at Queen’s University for Canadian metropolitan areas.

    School Age Losses

    The urban core school-age population dropped from approximately 3.40 million in 2000 to 2.73 million in 2010, for a loss of 670,000 (Figure 2). Much has been made about the affinity of the Millennial generation for the urban cores. Despite this, our small area analysis indicated that the percentage of 20 to 29 year olds living in the functional urban cores declined between 2000 and 2010, with 88 percent of the growth in suburbs and exurbs (see Dispersing Millennials). Coincidentally, over the period, there was a reduction of two school age children in the urban cores for every additional resident aged 20 to 29 (Figure 3).

    A loss was also sustained in the earlier suburbs (with median house construction dates between 1946 and 1979). The school-age population declined slightly more than 1 million in the earlier suburban areas. In 2000, 45.3 percent of school age children lived in the earlier suburbs, a figure that declined to 40.5 percent in 2010.

    Virtually all of the gain in 5 to 14 age residents was in the later suburban areas (a median house construction dates of 1980 or later) and exurban areas. Overall, these two city sectors added 1.9 million school-age children, while the urban cores and the earlier suburban areas experienced a reduction of 1.7 million, for a reduction of approximately 10 percent.

    The largest increase was in the newer suburban areas (median house construction dates of 1980 or later), where 1.47 more school-age children lived in 2010 than in 2000. This represented an increase of approximately 30 percent. Exurban areas have a more modest increase of 310,000 school-age children, up 8.3 percent from 2000.

    Losses in the Largest Urban Cores

    All of the large urban cores in the metropolitan areas experienced losses in school aged children from 2000 to 2010. Among the 24 urban cores with more than 100,000 residents, Washington (-5.5 percent) and Seattle (-8.4 percent) came the closest to retaining their 2000 school age numbers in 2010.  Seven large urban cores experienced losses of at least 30 percent. Baltimore’s loss was approximately 30 percent. Los Angeles joined rust belt cities St. Louis, Rochester and Cleveland at 33 percent to 34 percent and Detroit at 38 percent. New Orleans had the largest loss (-70.2 percent), owing in part to population loss from the disastrous hurricanes (Figure 4).

    Finally, in all of the 52 metropolitan areas, the later suburban and exurban areas (combined) retained more of their school age children than the urban cores and earlier suburbs. There were gains in 45 of the later suburban and exurban areas.

    Better Schools: The Necessary (But Maybe Not Sufficient) Condition

    One of the issues of most interest among urban analysts has been whether urban cores will be able to retain the share of Millennials that they have attracted. The functional urban cores seem likely to maintain their attraction for younger adults, so long as the cores sustain their improved living environment (such as much lower crime rates than before and continued investment by retailers and other commercial business to support the new populations).

    However, the continuing exodus of people with school-age children described seems to indicate that young adults tend to move to the suburbs and exurbs around the time their children enroll in school. Suburban and exurban schools often provide better educations than urban core schools. The Editorial Projects in Education found that high school graduation rates were 77.3 percent in suburban school districts, compared to 59.3 percent in "urban" school districts (Note 3). There are other difficulties as well, such as having sufficient defensible outdoor space for children to play and for parents to feel secure. But education seems likely to be the most important consideration.

    Of course, in urban areas the highly affluent can enroll their children in private schools. The alternative of private schools can be overly expensive, inducing households to relocate to school districts with higher quality education. According to research by Chief Economist Jed Kolko of Trulia: “Private school enrollment in the lowest-rated school districts is more than four times as high as private school enrollment in the highest-rated school districts after adjusting for neighborhood demographic differences."

    A balanced broad age distribution of households, including those with children of school age, is not likely to be achieved in urban cores unless Millennials are retained in substantial numbers. Once having moved, the chances of their returning are slim, because households move less frequently as they move up the age scale.

    Note 1: The City Sector Model allows a more representative functional analysis of urban core, suburban and exurban areas, by the use of smaller areas, rather than municipal boundaries. The more than 30,000 zip code tabulation areas (ZCTA) of major metropolitan areas and the rest of the nation are categorized by functional characteristics, including urban form, density and travel behavior. There are four functional classifications, the urban core, earlier suburban areas, later suburban areas and exurban areas. The urban cores have higher densities, older housing and substantially greater reliance on transit, similar to the urban cores that preceded the great automobile oriented suburbanization that followed World War II. Exurban areas are beyond the built up urban areas. The suburban areas constitute the balance of the major metropolitan areas. Earlier suburbs include areas with a median house construction date before 1980. Later suburban areas have later median house construction dates. 

    Urban cores are defined as areas (ZCTAs) that have high population densities (7,500 or more per square mile or 2,900 per square kilometer or more) and high transit, walking and cycling work trip market shares (20 percent or more). Urban cores also include non-exurban sectors with median house construction dates of 1945 or before. All of these areas are defined at the zip code tabulation area (ZCTA) level.

    Note 2: The City Sector Model articles are:
    From Jurisdictional to Functional Analyses of Urban Cores & Suburbs
    The Long Term: Metro American Goes from 82 percent to 86 percent Suburban Since 1990
    Beyond Polycentricity: 2000s Job Growth (Continues to) Follow Population
    Urban Cores, Core Cities and Principal Cities
    Large Urban Cores: Products of History
    New York, Legacy Cities Dominate Transit Urban Core Gains
    Boomers: Moving Farther Out and Away
    Seniors Dispersing Away from Urban Cores
    Metropolitan Housing: More Space, Large Lots
    City Sector Model Small Area Criteria

    Note 3: This report (which was prepared with support from the America’s Promise Alliance and the Bill and Melinda Gates Foundation) provides graduation rates using the US Department of Education "local codes." This typology generally defines "urban" school districts as those in core cities as well as other principal cities (such as Arlington, Texas and Mesa, Arizona). Most of the population of core cities and principal cities is classified as functionally suburban (see: Urban Cores, Core Cities and Principal Cities). Further, the typology classifies some districts as suburban that have large urban components (such as Las Vegas, Miami, Louisville and Honolulu), which is necessary because of county level school districts that include both urban cores and suburban areas. As a result the functionally suburban component of urban districts is overstated and the functionally suburban component of suburban districts is understated. Because urban graduation rates tend to be less than suburban rates, both of these factors seem likely to overstate the "urban" graduation rates and understate the "suburban" graduation rates.

    Wendell Cox is principal of Demographia, an international public policy and demographics firm. He is co-author of the "Demographia International Housing Affordability Survey" and author of "Demographia World Urban Areas" and "War on the Dream: How Anti-Sprawl Policy Threatens the Quality of Life." He was appointed to three terms on the Los Angeles County Transportation Commission, where he served with the leading city and county leadership as the only non-elected member. He was appointed to the Amtrak Reform Council to fill the unexpired term of Governor Christine Todd Whitman and has served as a visiting professor at the Conservatoire National des Arts et Metiers, a national university in Paris.

    Photo: School buses in suburban Atlanta (by author)

  • Time to Bring Back the Truman Democrats

    Once giants walked this earth, and some of them were Democrats. In sharp contrast to the thin gruel that passes for leadership today, the old party of the people, with all its flaws, shaped much of the modern world, and usually for the better. Think of Franklin Roosevelt or Harry Truman, John Kennedy, or California’s Pat Brown, politicians who believed in American greatness, economic growth, and upward mobility.

    For more than 40 years, the Democratic Party has drifted far from this tradition, its policies increasingly a blend of racial and gender politics combined with a fashionable brand of environmental fanaticism. No longer does it constitute a reliable, middle class-based alternative to the corporatist mindset of the Republicans. “Today’s Democrats have no more in common with Franklin Roosevelt, Harry Truman, John F. Kennedy and Lyndon Johnson ,” notes author Michael Lind, “than today’s Republicans have in common with Abraham Lincoln or Dwight Eisenhower. “

    To regain their relevancy, Democrats need to go back to their evolutionary roots. Their clear priorities: faster economic growth and promoting upward mobility for the middle and working classes. All other issues—racial, feminine, even environmental—need to fit around this central objective. In survey after survey, economic issues such as unemployment, the economy, and the federal budget top the list of concerns while affirmative action, gay rights, and climate change barely register.

    From Obama Back to Jackson

    Democrats do not need to become Republican lite, as was true among some New Democrats (I was a fellow with the Progressive Policy Institute, the New Democrats think tank). Democrats need to respond aggressively to the crony capitalism practiced by many Republicans, particularly regarding Wall Street. But they can’t do that if all they offer in its place are policies that service instead their own cronies not only in finance, but technology and media as well.

    Right now it’s hard to make the case that the Democrats have a strategy to improve the economic prospects of the middle class. The New York Times’s Tom Edsall notes notes that after six years of Obama, voters stubbornly hold unto pessimistic views about the future. Of course, declining or stagnant wage growth started well before this president took office. Nevetheless, Democratic rule has not only failed to halt the trend, but appears to have accelerated it.

    Not surprisingly, many middle and working class voters, particularly whites, have deserted the Democrats in increasing numbers. This November, notes Gallup, support for Obama among white college graduates dropped to 41 percent while his support among those without degrees fell to a pathetic 27 percent.

    Critically, in 2014 this erosion began to extend to millennials; white millennials, particularly those without BAs (the vast majority), went Republican. This is a generation that, according to the Census, is both somewhat more educated than previous ones but far more likely to live in poverty.

    Although likely to reject Republican views on social issues, such as gay marriage, millennials may not become “permanently blue,” as imagined by some boomer progressives. Faced with the consequences of slow, and poorly distributed growth, they are already less likely to see themselves as environmentalists than the national average and particularly the generally better off boomers.

    Some progressives suggest that working class voters, particularly whites, can be lured back to the party by expanding the welfare state even further. But such an approach works against the traditional pride in self-sufficiency espoused by many in the American middle class. The old Jacksonians challenged financial power—then the Bank of the United States—but also worked to expand the economy, opening new lands to settlement, and encouraging home ownership and grassroots entrepreneurship.

    The Key Issue: Energy and Climate Change

    It would be difficult to find an issue with less resonance with the vast majority of voters than climate change. Concern over the environment has dropped since the Recession, notes Gallup, with climate change ranking near the bottom in voter concerns. In this sense, the emergence of Tom Steyer and other gentry yokes the party to a message with limited appeal once you get a few miles inland from either coast.

    This does not reflect lack of interest in a better environment. Instead, it is a rejection of the Clerisy’s “solutions” to environmental challenges—such as banning suburbs, hiking electricity rates, and opposing new pipelines. These policies don’t hurt the super-rich; they hurt middle and working class voters. Lower oil prices, a product of fracking and other new drilling technologies, represents a boon to the dispersed, largely suburban electorate. But at the same time cheap gas offends progressive writers like the New Yorker’s Michael Specter, who argues that lower oil prices simply reinforces our addiction to an “industrial form of crack.”

    In the next decade, the Obama administration’s bizarrely naïve “agreement” with China threatens to further weaken middle class interests. The South China Morning Post suggests westerners should be skeptical about prospects that China will sacrifice economic growth and, even more important, political stability in favor of planetary salvation. As one Canadian commentator put it, the Chinese deal constituted “a promise in a rented tuxedo” by a country that will cross “its coal fired heart” while the U.S. and the E.U. essentially disarm their economies with ever more draconian regulation.

    Sadly, this choice between growth and climate change may not be necessary. The development of new drilling techniques has sparked a shift from coal fired power to natural gas that has allowed the U.S. to reduce its emissions faster than any major country, far more, indeed, than the self-righteous Europeans whose expensive and inefficient green policies have left them burning more coal.

    Expanding, Not Constraining Geography

    The rapid shrinking of the party’s geographic base is one clear legacy of the Obama years. Energy policy has been key here. Democratic losses have been heavy in those parts of the country that either produce fossil fuels, such as Louisiana, Texas, Colorado, Utah, and Montana, or those, notably in the upper Midwest, that depend on cheap fossil fuels to drive their still critical manufacturing sectors.

    The losses of Democrats in states like Ohio, Michigan, and Wisconsin are arguably the most critical since these are traditionally swing states. The Steyer strategy of wiping out fossil fuels and raising energy costs might appeal to the denizens of climatically mild and highly affluent San Francisco. But people in a hardscrabble factory town in less temperate central Ohio or in greater Detroit , or even interior California, are less well-positioned to indulge green purity.

    And how about the South? As recently as 2008, Democrats held one-third of the South’s Senate seats. Now it’s down to three, two in Virginia and the other in Florida. Convinced the region is lost permanently, some suggest suggest that Democrats “dump Dixie” so as not to have to appeal to voters in what one progressive writer denounced as a “fetid place.”

    But the South accounts for almost 40 percent of the nation’s population, an impossibly large region to simply write off. But even progressives who want to take back the South, such as the New Republic’s Michael Cooper seek to build a coalition of poor whites and minorities in alliance with the growing numbers of graduate-educated professionals. This does not really address the aspirational reasons why so many Americans have been migrating to this region.

    In many ways these attitudes reflect the increasingly urban-centric focus of the party. It diverges dramatically from the approach of traditional Democrats, from Roosevelt and Truman to Clinton, himself the former governor of a poor Southern state, who looked favorably on dispersing growth, particularly to the traditionally poor South, intermountain West and Great Plains, as well to the suburban interior.

    Hostility to the non-urban regions includes a detestation of suburbia. Progressive theorists, like Salon’s Benjamin Ross, like to pin the detested “suburban sprawl” on Ronald Reagan, ignoring the basic fact that suburban growth was fostered for a half century by a Democratic controlled Congress, and was also favored by Democrats from Truman through Clinton. No surprise then that aside from wealthy coastal suburbs, the Democratic base has shrunk to the urban cores and college towns.

    Infrastructure for Growth

    Senator Charles Schumer’s retro perspective about the folly of enacting Obamacare in 2009 revealed much. Schumer rightly pointed out that Obamacare, for all the positives associated with expanding health care coverage, helped a relatively small part of the electorate, as well as the insurance companies.

    A far better move in the early years of Obama’s first term would have been to implement a updated version of the New Deal’s Works Progress Administration. A new WPA would have helped create jobs and provided some training to underemployed or unemployed youth. It could have left a legacy of improved roads, bridges, expanding port facilities, and affordable (usually bus) mass transit options that would appeal to many Americans.

    In contrast to Obamacare, a neo-WPA would have been a difficult target for the GOP. It likely would have appealed to many business people on Main Street, few of whom are free-market fundamentalists. But moves to push such a program elicited opposition from critical parts of the party base, including feminists, who feared that public works would disproportionately help “burly men.”

    Greens also were less than enthusiastic about new massive public works. Environmentalists today generally prefer to limit roads and block new water projects, even in parched California. So the Obama stimulus will be forever linked to insider deals with green energy epitomized by the Solyndra fiasco and massive loans to politically allied venture capitalists.

    Class Not Race

    The growing opposition towards Hillary Clinton’s ascension has one thing right: Democrats should not be seen as the second party of Wall Street. Obama’s recovery and Fed policy have, as Democrats like Elizabeth Warren like to point out, often favored the financial oligarchs, although their support for Democrats makes them far less keen on taking on the Silicon Valley Venture Capitalists, who have also profited under Obama. High valuations—even absurd ones—enrich the insiders who found companies, underwriters, and merger mavens, but those valuations have done precious little for the vast majority of Americans.

    Faced with the loss of middle class voters, the administration seems determined to double down on its current coalition. So to whom do they turn to determine their future political direction? Not to a successful elected official from a swing district or a Main Street businessperson but to Google’s Eric Schmidt, an oligopolist of the first order from the party’s new heartland around the San Francisco Bay Area.

    Given their cozy ties to Wall Street and oligarchs like Schmidt, the Democrats have failed to push class warfare as an issue, preferring instead to play the racial trump card. They allow issues to be dominated by such flawed emissaries as the detestable Al Sharpton, whose job seems to be the stoking of African-American ire. Similarly, the president’s executive order on undocumented residents follows this approach, by trying to appeal to Latino racial interests.

    Yet race politics has limited appeal to whites, and ultimately may not guarantee keeping many minority voters in check. After all, minorities have fared poorly under Obama: a recent Pew study found minority incomes dropped 9 percent between 2010 and 2013, while only 1 percent among whites. Hispanics, notes a recent Pew survey economic issues easily trump immigration. Texas Republicans, for example, got close to half the vote among Latinos in that state, and similar results were found in Kansas. Even in places as blue-leaning as Colorado, Latino support for pro-growth Republicans has been growing. And Asians also showed a shift toward the GOP in the mid-terms.

    Embrace Exceptionalism

    Historically Democrats, like Republicans, believed in American Exceptionalism. This sometimes spills over into messianic overkill—for example, under Woodrow Wilson and George W. Bush—but overall the ideal of a uniquely American national profile has been embraced by Democrats from Jefferson and Jackson to Roosevelt, Truman and, arguably the last of the breed, Bill Clinton.

    President Obama, in contrast, has openly rejected this notion, perhaps reflecting the world view of academics and much of the financial world that sees American Exceptionalism as some sort of patriotic nonsense. In the past the old Democrats saw the country’s broad resources and continental scale as primary sources of national greatness. Early conservationists did not oppose the expansion of industry, mining, or growth as inimical to progressive ideals; instead, they sought to restrain the abuses of the capitalist classes in order to prevent gouging as well as to preserve resources and open space for future generations.

    In sharp contrast to their modern “heirs,” both Progressives and New Dealers were builders of dams, roads, and electrical power systems. They embraced the notion of a growing America, whose economy could be expanded for the benefit of the majority.

    Is There a Messenger For Dino-Democrats?

    Hillary of the many houses, $200,000 speaking gigs, Wall Street linkages, and her aging, wealthy glitterati backers does not exactly appear the ideal messenger for a neo-Jacksonian revival. Rather than the “shot and a beer” Hillary who came back to almost save her 2008 effort, she now reflects gentry views on both economics and climate change in ways that do not significantly diverge from President Obama.

    With dissatisfaction with the economic status quo strong among many traditional Democrats, it’s likely populist candidates could emerge. Some imagine Senator Elizabeth Warren as the charismatic leader of a progressive version of the “tea party.” She has been a strong and vocal critic of Wall Street, which is to her credit, but her base lies not in middle class voters but among academia and wealthy Boston suburbs. On environmental issues, she seeks to out-green Hillary, something that might not appeal to voters in Ohio, Indiana, and a host of other key states.

    Bernie Sanders, the self-described socialist, represents an emotionally appealing alternative to the endlessly grifting Clintons and the law professor Warren. But Sanders, a representative of the Northeastern vacation state of Vermont, also opposes fossil fuel development. This approach would greatly limit his appeal beyond the Northeast and the west coast. It’s hard to envision him campaigning for votes at Great Lakes factories that depend on coal power, or appealing to construction workers who would love to see the Keystone and other pipelines built.

    Right now, former Virginia Senator James Webb may prove the best vehicle for dino-Democratic ideas. A self-conscious inheritor of the Jacksonian tradition, Webb epitomizes the individualist and populist values of his Scotch-Irish forebears. With a strong military background, he also appeals to nationalists who inhabit the South, Appalachia, and the non-coastal parts of the West. Whether his candidacy takes off is still an open question, but the ideas and spirit he embodies could revive a Democratic tradition that, although now submerged, might provide the party with a way out of its current morass. 

    This piece first appeared at The Daily Beast.

    Joel Kotkin is executive editor of NewGeography.com and Roger Hobbs Distinguished Fellow in Urban Studies at Chapman University, and a member of the editorial board of the Orange County Register. His newest book, The New Class Conflict is now available at Amazon and Telos Press. He is author of The City: A Global History and The Next Hundred Million: America in 2050. His most recent study, The Rise of Postfamilialism, has been widely discussed and distributed internationally. He lives in Los Angeles, CA.

  • California Business Needs to Go Small or Go Home

    Here’s the bitter reality for business in much of California: there’s no cavalry riding to rescue you from the state’s regulatory and tax vise. The voters in California have spoken, and with a definitive, distinctive twist, turned against any suggestion of reform and confirmed the continued domination of the state by public employee unions, environmental activists and their crony capitalist allies.

    You are on your own, Southern California businesses, and can count on very little help, and, likely, much mischief, from Sacramento and various lower orders of government. To find a way out of stubbornly high unemployment and anemic income growth, the Southland will need to find a novel way to restart its economic engine based almost entirely on its grass-roots business, its creative savvy and entrepreneurial culture.

    This shift poses a great challenge, both for California’s interior counties and parts of the coastal region. Unlike Silicon Valley and its hip twin, San Francisco, no one is investing much in the Southland. Among the nation’s largest metropolitan areas, the Los Angeles region has become a corporate stepchild, trailing in new office construction not only to world-beaters like Houston, but also New York, the Bay Area and even slower-growing Philadelphia or Chicago. In fact, although the second largest metro area in the country, L.A.-Orange County does not even make the top 10 regions for new building.

    Nor can we expect much in the way of residential housing growth, particularly single-family homes, as the state’s planners continue their jihad against anything smacking of suburban expansion. Traditional industries like aerospace, manufacturing and logistics face enormous regulatory barriers, ruinous taxation levels and huge energy price increases that will slow any potential growth, and could lead to yet more departures by existing large firms. Virtually all the region’s former major established aerospace companies have relocated their headquarters elsewhere, which hurts efforts to get them to expand or maintain facilities here.

    Despite all this, the Southland is not without considerable assets. Perhaps most promising is the region’s status as the nation’s No. 1 producer of engineers – almost 3,000 annually. This raw material is now being somewhat squandered, with as many as 70 percent of graduates leaving the area to find work.

    But there’s no reason for unmitigated despair; overall, Los Angeles-Orange has increased its ranks of new educated workers ages 25-34 since 2011 as much as ballyhooed New York, San Francisco and much more than Portland, Ore. For its part, the Inland Empire ranked fourth among 52 large metropolitan areas in terms of increased presence of bachelor’s degree-holders in this age group, adding almost 19,000 college-educated people since 2011.

    There’s also a case to be made for Southern California as an emerging tech hub. As venture capitalist Mark Shuster points out, the region ranks third, just behind the Bay Area and New York, for its percentage of the nation’s tech startups, and is now the fastest-growing. The overall tech base, which includes aerospace, is still the largest in the country, with more than 360,000 employees. As tech moves from basic infrastructure to application, Shuster argues, the Southland’s time may come.

    Despite producing MySpace, the region may have lost out in the social media wars, but shifts in tech trends could turn out to be far more advantageous. This relative optimism is remarkable given the losses in so many key engineering-driven industries over recent decades, from electronics and energy to aerospace.

    Southern California’s technology community could well benefit from such things as growing demand for content among tech firms, as well as attempts to reboot space exploration. Indeed, investor Peter Thiel recently suggested that the region’s technology industry is the most “underestimated” in the nation.

    “I’d definitely be short New York and long L.A.,” Thiel told the Los Angeles Times, citing both commercial space pioneer SpaceX and Oculus, the Irvine-based maker of virtual-reality headsets.

    The case for a grass-roots rebound of tech in Southern California depends heavily on one key asset – the presence of the nation’s largest community of people in the arts. Roughly half of these workers are self-employed, according to the economic forecasting firm EMSI.

    The Silicon Valley may be ideal as a place to nurture digitial technologies, but “nerds” as a whole are not cultural mavens or trend-seekers. They are better at transmitting messages than putting something worthwhile in them. In contrast, Southern California excels in filling messages with product.

    The large existing base of television, movie and commercial producers has nurtured skills that are sought worldwide. Yet at the same time, with the studio system clearly in decline, as large productions go elsewhere, digital players such as Netflix, Amazon, Apple, as well as Los Angeles-based Hulu, have become more important. Indeed, when my Chapman students, many of them film majors, discuss their futures, it is increasingly these intermediaries, not the studios, that they identify as critical to a successful career.

    This suggests a very different picture of the Southland’s industry than the one normally associated with large companies, studios and deep concentrations of talent. In the future, more production will be done by individuals, sometimes working out of their homes, scattered across the region. According to Kauffman Foundation research, the L.A. area already has the second-most entrepreneurs per 100 people in the U.S., just slightly behind the Bay Area. By necessity, Southern California’s economy will become more entrepreneurial and grass-roots; even as we have been losing large companies, our percentage growth in self-employed is among the highest in the country.

    Not surprisingly, this activity appears concentrated not in the traditional bailiwicks in the San Fernando Valley, or in the hyped Downtown-adjacent areas, but along the coastal strip from Santa Monica to Irvine that some promoters have christened “the tech coast.” This epitomizes the growing role of young individuals and startups – as opposed to veteran engineers – in shaping the Southland’s emerging tech economy.

    This pattern, however, is not just restrictive to digital entertainment. Southern California’s network of tested aerospace engineers – which, at 5,000 people, is second only to Seattle’s – is one reason why companies like SpaceX have located here. In an economy that relies more and more on individual expertise, this is a critical advantage.

    One powerful caveat: We are not likely to see much blue-collar spinoffs of tech here, due largely to high land, regulatory and energy costs. Space X, for example, may have its key brain power in Southern California, but has chosen to construct its spaceport in lower-cost, business-friendly Texas. Another aerospace firm, Firefly Systems, this year decamped entirely for Texas, moving its headquarters to the Austin area and rocket engine facilities to rural Burnett County.

    This pattern suggests that many of our emerging firms may remain somewhat limited in scope and largely focused on high-end functions, which reduces the positive impact for the region’s struggling local middle class and working class.

    But the new grass-roots economy does not apply only to tech. Los Angeles has seen a huge rise in the number of people working from home, a percentage that since 1980 has more than tripled even as transit’s ridership share has dropped. Small, home-based businesses are common not only in such fields as real estate, but also in business consulting and even trade.

    These home-based businesses, and small ones tucked into strip malls or small industrial centers – for example, in food processing – represent the last, best hope for a revived Southland economy. Our corporate community seems destined to continue shrinking, but this does not necessarily mean that the overall economy has to follow suit. Unable to rely on local officials to make things better, our best chance lies with relying on the entrepreneurial spirit and creativity of our people – the very thing that made us such an economic beacon in decades past.

    This piece first appeared at the Orange County Register.

    Joel Kotkin is executive editor of NewGeography.com and Roger Hobbs Distinguished Fellow in Urban Studies at Chapman University, and a member of the editorial board of the Orange County Register. His newest book, The New Class Conflict is now available at Amazon and Telos Press. He is author of The City: A Global History and The Next Hundred Million: America in 2050. His most recent study, The Rise of Postfamilialism, has been widely discussed and distributed internationally. He lives in Los Angeles, CA.

    Self employment photo by BigStockPhoto.com.

  • The Curious Comeback Of U.S. Downtowns

    Perhaps nothing better illustrates the notion of urban revival in America than the comeback of many downtown districts. Yet if these areas have recovered some of their vigor, they are doing so in a manner that hardly suggests a return to their glory days in the first half of the 20th Century.

    Instead what’s emerging is a very different conceptualization of downtown, as a residential alternative that appeals to the young and childless couples, and that is not so much a dominant economic hub, but one of numerous poles in the metropolitan archipelago, usually with an outsized presence of financial institutions, government offices and business service firms.

    The good news: after an era of population declines, these areas are growing again: From 2000 to 2010, the downtown cores of the nation’s 51 metropolitan areas with populations over a milliongained slightly over 200,000 residents, or 1.3% of all the growth in the nation’s major metropolitan areas. However, 80% of that growth took place in just six cities — New York, Chicago, Philadelphia, Washington, D.C., Boston and San Francisco. In 18 of the 51 downtowns populations declined. Meanwhile, the population in the outer fringe of the 51 metro areas, 10 miles beyond downtown, grew by some 15 million.

    These trends appear to have continued into the initial stages of the current economy recovery. In a survey of 2011-2012 patterns, Trulia found a similar pattern of higher growth near the center, but even stronger growth rates on the fringes. As we have noted since 2000, the slowest growth took place in the close-in neighborhoods adjacent to the urban core.

    The better numbers reflect then not a mass “back to the city” movement but an uptick in the market appeal of city centers. And it’s unlikely that the old urban cores will ever come close to recovering the economic preeminence they once enjoyed. In American Community Survey data from 2006-08, the central business district of the New York metro area was the only one across the country that accounted for over 20% of regional employment; downtown’s share topped 10% in just six other metro areas: Chicago, Boston, Washington D.C., Richmond, Chicago and Hartford. This contrasts with the kind of employment dominance seen in the 1950s when Manhattan’s commercial core accounted for more than 35% of employment in the New York area. Of course, the decline is a natural outgrowth of the massive physical expansion of the New York area during the past half century, a pattern seen in other major regions.

    From 2000 to 2010, the share of jobs dropped somewhat in the nation’s biggest urban cores, but employment declined far more in the inner ring suburbs, according to an analysis by demographerWendell Cox. In contrast the fastest job growth was in suburban and exurban areas, paralleling their gains in population. This has become clearer since the recession ended; the consultancy Costar notesbetween 2012 and 2013 office absorption grew quicker in the suburbs than the core, accounting for 87% of new office demand. Overall suburbs account for nearly 75% of all office space in our metropolitan areas.

    We can see this pattern even in two of the hottest office markets, San Francisco and Houston. Overall, despite all the blather about tech moving into the core, San Jose, Calif., has almost 50% more new office space under construction than San Francisco. San Jose, it should be remembered, is essentially a giant suburb, with a very small downtown, and very low levels of transit ridership. It may be next to San Francisco but in urban form, it represents its direct opposite.

    In Houston, easily the nation’s leader in new office construction, downtown has fared well in the boom but the vast majority of new growth is located in the ‘burbs, including the largest project — the new ExxonMobil campus, with 20 buildings that will host 10,000 employees. In both places population growth in the suburbs has been approximately four times that of the core cities between 2010 and 2013.

    These patterns can be seen even in areas where there have been strong improvements in residential growth. In 2010, Chicago’sDowntown Loop Alliance reported that private sector employment in the Loop fell 20% during the last decade. Perhaps more telling, the number of jobs and resident workers (the “jobs-housing” balance) in the city of Chicago are converging toward equality. According to American Community Survey data, there are 1.1 jobs in the city of Chicago for each working resident. In contrast, two of the three large suburban corridors have higher ratios of jobs to workers than the city of Chicago. The Interstate 88 corridor has 1.3 jobs per worker, while the North Shore has approximately 1.5 jobs per worker. The Interstate 90 corridor has slightly more jobs than workers.

    How could this be given the much hyped migration of companies such as Boeing to the Windy City? One explanation lies with the rise of what urban analyst Aaron Renn has described as the “executive headquarters.” These relocations, he notes, tend to follow CEO preferences but cover only a small number of employees. Cost pressures, particularly from Wall Street, make securing space in central cities prohibitive if it involves large numbers of employees. A small, swanky office is one thing but putting 10,000 workers in expensive towers seems less common.

    The recent move of Archer Daniels Midland’s headquarters, he notes, brought roughly 100 jobs while that of Boeing, at a cost of $63 million in incentives, was a net gain of 500. In both cases, far more employees, spanning research, development and marketing remained in the original locations. Boeing, for example, retains over 80,000 employees in its original home around Seattle.

    What seems clear from these trends is this: downtowns are back, but not as dominant business hubs. Instead we continue to see not massive construction of new offices but the continued conversion of offices to residential buildings. This is particularly true in Chicago, where developers are adapting older office towersmalls, as well as hotels for apartments. In most cases, these are rental properties designed to serve a generally younger, and childless market.

    In Manhattan, the rate of office construction is running at a multi-decade high, but some insiders worry that demand may not be there in the next four years to fill the 14 million square feet of spaceprojected to be built by 2019. The shift of jobs, particularly in financial services, to cheaper locales could have a negative effect, as does the trend of employers cramming workers into smaller spaces.

    What about the wannabes like downtown Dallas, Atlanta and Los Angeles? These central cores have failed to recover their economic base, with vacancy rates approaching 20% despite a dearth of new construction. Nor has mass transit — often sold as the “magic bullet” to turn these central cores into thriving urban hubs — succeeded in reestablishing their economic centrality. In all three metro areas, despite multibillion-dollar expenditures on new rail lines, transit ridership remains at or even slightly below the levels of a decade ago.

    None of this suggests that these cores are not important to their regions, and particularly to their often vulnerable self-esteem. The downtowns of Atlanta and Dallashave gained some residents, and there is more pedestrian traffic at night. Similarly Los Angeles, whose downtown attracted nearly half of all L.A. residents daily in the 1920s, according to Robert Fogelson, continues to fade in economic importance. Today it represents about 2% of the vastly expanded metro area’s jobs. At least four other regional job centers are as larger or larger ).

    Yet despite this, it’s legitimate to see some revival of the area, largely due to a rash of residential conversions and some new apartment building. This has brought some new life, as well as some restaurants and some shops, as the population within two miles of City rose by an impressive 23,000 since 2006. But this hardly represents a full-scale return to the center city as the population of the surrounding areas — two to five miles from City Hall — has dropped by a similar number. Almost all the new construction in downtown is either for residents or hotels; very little new office space is being produced.

    Los Angeles’ downtown recovery, notes real estate analyst David Shulman, is “more about sports and entertainment venues, restaurants and bars, loft conversions, and hotels than it is about companies that need a lot of floors in tall buildings. Nightlife and streetscapes trump florescent light and cubicles.”

    This resurgence in L.A., and elsewhere, is no mean accomplishment, but it also does not constitute sea-change in fundamental economic geography. Downtowns are back, but more as a lifestyle option than as a dominant feature of the metropolitan landscape.

    This piece originally appeared in Forbes.

    Joel Kotkin is executive editor of NewGeography.com and Distinguished Presidential Fellow in Urban Futures at Chapman University, and a member of the editorial board of the Orange County Register. His newest book, The New Class Conflict is now available at Amazon and Telos Press. He is author of The City: A Global History and The Next Hundred Million: America in 2050. His most recent study, The Rise of Postfamilialism, has been widely discussed and distributed internationally. He lives in Los Angeles, CA.

    Lead photo of 432 Park Avenue in New York by Louis B (Own work) [CC-BY-3.0 or CC-BY-4.0], via Wikimedia Commons

  • The Three Generations of Black Mayors in America

    A select group of cities elected black mayors during the brief and tumultuous Black Power Era, seeking to implement an activist social justice platform.  These cities – notably Cleveland, Gary, Newark and Detroit among large cities — became stigmatized in a way that few have been able to recover from.   A negative narrative was developed about most of them that stuck, despite considerable efforts to dispel them.  Cities that elected “first black mayors” after the Black Power Era, during a period of relative calm, were able to adapt as the political skill set grew in the African-American community.  However, the Black Power Era’s near-toxic combination of heightened white racism, black disenfranchisement and disillusionment – and ill-prepared black political leadership – accelerated the downfall of these select cities.

    If the cities that elected black mayors during this tumultuous period are ever to move forward, to achieve their potential, they must be released from the purgatory they inhabit.

    Just as many people have well-developed thoughts and opinions on the American Civil War but little understanding of the turbulent Reconstruction Era that followed, many are familiar with the 20th Century Civil Rights Movement, yet are far less knowledgeable about the local social and political events that followed it.  The Black Power Movement supplanted much of the Civil Rights Movement after the assassination of Dr. Martin Luther King, with an emphasis on turning social activism into political empowerment.  Several cities elected their first black mayors during that period.  Cleveland was the first with the selection of Carl Stokes as mayor in 1967.  Gary, Indiana followed suit the same year with the election of Richard Hatcher, and the federal government appointed Walter Washington to become Washington, DC’s first black mayor as well.  Later, Newark (Kenneth Gibson), Dayton (James McGee) and Cincinnati (Ted Berry) followed suit by 1972, and culminated with the elections of Tom Bradley (Los Angeles), Maynard Jackson (Atlanta) and Coleman Young (Detroit) in 1973.  A new era of African-American political empowerment had begun.

    Taking a long historical view, it’s clear that the people who became first African-American mayors beginning in the late ‘60s and continuing through today held different views, developed different paths to victory and methods of governance, and had differing perceptions of their skills among their constituents.  Mayors elected through about 1975 were often activists straight from the Civil Rights Movement, and were looking for ways to turn the movement into actual political power.  The group of black mayors that followed them, from about 1975 to 1990 or so, had more distance between them and the Civil Rights Movement and were less concerned about implementing movement politics; they were more concerned about developing the kind of coalition that could get them elected and help them win legislative victories once in office.  The third group of “first black mayors”, coming after about 1990 and continuing through today generally came to terms with a different demographic landscape in most major American cities.  Whereas first black mayors elected twenty years prior could dependably rely on a supermajority of black votes in their favor – and an equally large supermajority of white votes against them – the most recent group works in a more nuanced and less racially charged environment.  Younger white residents without the racial grievances of their parents or grandparents were returning to cities, and Hispanics were rapidly increasing in numbers.  Anyone who would attempt to become a “first black mayor” in that environment would have to develop an appeal that goes beyond racial boundaries.

    And yes, the decade that followed Dr. Martin Luther King’s assassination was as tumultuous as they come for America’s largest cities.  That period, well remembered by those who lived it as a time of particularly strong urban and social tensions, coincided with the downward slide in momentum of the Civil Rights Movement and the subsequent rise of the Black Power Movement.  Older adults likely remember the period well: urban riots, fights over school busing, Affirmative Action battles, efforts to eliminate long-entrenched policies like blockbusting and redlining.  Skyrocketing crime, heated debates on the inequity of public services, and the development of a new, rapidly expanding land called “suburbia” that was looking very appealing to a growing number of city residents.  Nearly all large cities developed scars during that period.  The question is whether they healed, and healed well.

    “It’s Our Time”


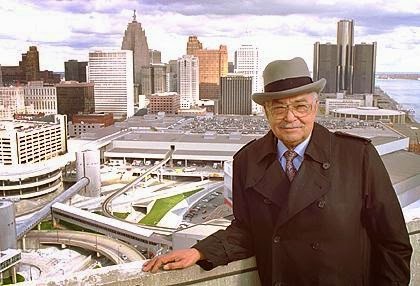
    Detroit Mayor Coleman Young.  Source: Detroit News

    Coleman Young, elected as Detroit’s first black mayor in 1973, in many ways epitomizes the first group of black political leadership that emerged following the Civil Rights Movement.  One might call them the Black Power set.  Born in 1918, Young was part of a generation of African-Americans who stood tantalizingly closer to economic prosperity and social equality than any previous generation, yet were reminded that they could never achieve it.  After serving as a bombardier and navigator for the U.S. Army Air Forces during World War II, Young returned from his service disillusioned by the segregation he and his fellow troops suffered.  He went on to become a labor leader with the UAW and later built a political base as a state representative and state senator in the Michigan Legislature, representing Detroit’s East Side.

    Young became a vocal critic of local leadership after the 1967 riots, and targeted the heavy-handed efforts of Detroit police to reduce crime.  Young announced he was running for mayor in 1973 in large part to work to disband the Detroit Police Department’s STRESS (Stop the Robberies, Enjoy Safe Streets) unit.  The unit was often mentioned as the initiator of police brutality complaints, and was allegedly responsible for as many as 22 deaths of black residents over a 2 ½ year period.  Young ran against John Nichols, the city’s police commissioner and staunch supporter of the troubled unit.

    Young won a narrow victory over Nichols in 1973 in a race that was almost entirely split along racial lines in the nearly 50/50 city.  In his inaugural address, Young famously told “all those pushers, (to) all rip-off artists, (to) all muggers: It’s time to leave Detroit; hit Eight Mile Road! And I don’t give a damn if they are black or white, or if they wear Superfly suits or blue uniforms with silver badges. Hit the road.”  Young maintained that his message was that criminals were not welcome in Detroit; the quote has often been interpreted by white former Detroit residents as a throwing down of the gauntlet, urging whites to leave the city for the suburbs.  Young went on to win four more terms in office.  He balanced budgets yet struggled to maintain services in a city with a rapidly declining tax base.  He remains one of the most controversial leaders in Detroit history.

    Conversely, Cleveland’s Carl Stokes and Newark’s Kenneth Gibson may not have provoked similar passions in their respective cities, but they did not fare much better.  Stokes obtained his law degree in 1956, served three terms in the Ohio Legislature and narrowly lost a bid for mayor in 1965.  His eventual win in 1967 garnered him plenty of national attention as he became the first African-American mayor of one of the nation’s ten largest cities.  He was successful enough to pursue and win a second two-year term in 1969, but his tenure in office was characterized by constant feuds with the Cleveland City Council and the Police Department.  Stokes left office at the end of his second term.  After studying civil engineering in college, Gibson worked for nearly two decades as a structural engineer with the New Jersey Highway Department, the Newark Housing Authority and the City of Newark.  He pursued the mayor’s office as a reformer wishing to restore honor to the office following the corruption scandals of incumbent Hugh Addonizio.  Gibson won in 1970 but perhaps his attachment to people like Newark poet and playwright Amiri Baraka, who challenged Gibson to push the city’s corporate interests to take a more active and responsible role in the community, served as a lightning rod to the city’s remaining middle class element.  Gibson was elected to four terms, but Newark’s slide continued unabated.

    Black National Political Convention

    It’s probably fair to say that the political pinnacle of the Black Power era took place between the elections of Gibson and Young, with the advent of the Black National Political Convention in 1972.  Held in Gary, Indiana and hosted by Mayor Richard Hatcher, delegates from the entire spectrum of black leadership convened to establish a black political agenda for urban America.  More than 8,000 people attended the three-day convention, with 3,000 selected to be voting delegates.  Newly elected black officials attended, along with celebrated black nationalists and revolutionaries.  Delegates with more moderate position also attended.  However, whites were not invited.  No white speakers whose views were sympathetic to the movement; not even white reporters.  This exclusion caused groups like the NAACP and the Urban League to skip the event and be critical of the gathering.

    Renee Ferguson, a former Chicago local news television reporter and currently the press secretary for U.S. Rep. Bobby Rush (D-IL), attended the convention as a 22-year-old reporter for the Indianapolis News.  In an interview with Chicago public radio station WBEZ remarking on the 40th anniversary of the convention in 2012, she spoke about the frenzied nature of the event.  “When I got there it was very disorganized, much bigger than anybody had planned for and impossible actually for anybody to see what was happening. The speeches were long and there were a lot of egos and there weren’t many women.”

    Ferguson said that the agenda of the convention was framed by a basic question, and was the source of great tension.

    “Are black people going to work on the inside with the system, or are they going to have their own and work on the outside? And that was the big argument no matter what else they talked about,” Ferguson said. “That was the underlying intrigue and the most interesting thing for me to document as a young reporter.”

    In the end, black nationalists won the day.  The prevailing theme of the convention was that African-Americans would seek to create change outside of the system.  The agenda included platforms that had support from other liberal factions (elimination of capital punishment, national health insurance), but also included platforms that sought to consolidate political control with the growing number of leaders (community control of schools, busing for school integration).  Perhaps the biggest message of the convention, however, was that “White politics had failed Black people”.  And a new group of leaders set out to implement that vision.

    Coalition Builders


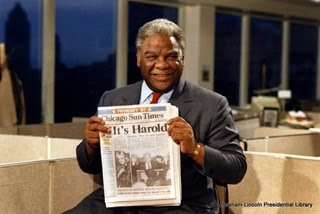
    Chicago Mayor Harold Washington, the day after winning the election in 1983.  Source: Illinois Historic Preservation Agency.

    Almost immediately after the convening of the convention, a group of rising black political figures who rejected the premise of the Black Power era leaders sought to ascend through coalition building.  Rather than work exclusively outside of the system, and alienating those who disagreed with them, this group stressed their ability to work within the existing power and political framework.

    As a state representative at the time representing Illinois’ 26th legislative district, Harold Washington would’ve been eligible to serve as a delegate to the Black National Political Convention.  Whether he attended is uncertain.  But it is clear that he adopted a coalition-building style that served him well as he ascended to the office of Mayor in Chicago.

    Born in 1922 and just four years younger than Detroit’s Coleman Young, Harold Washington nevertheless followed a different path to mayor of Chicago.  Washington also served in the Army during World War II, building runways for long-range bombers in the North Pacific.  Upon his return from service he graduated from Roosevelt College in Chicago in 1949, and from Northwestern University Law School in 1952.  Washington immediately became immersed in local Chicago politics after law school, working for 3rd Ward Alderman and former Olympic athlete Ralph Metcalfe.  While working with Metcalfe Washington became intimately familiar with Chicago’s brand of Machine politics – a spoils system, patronage, and a personal approach to bringing out the vote on Election Day.

    Contrary to Young’s experience in Detroit, African-Americans in Chicago experienced a fair amount of political enfranchisement.  In many respects, African-Americans were just one part of the ethnic milieu that made up Chicago’s political landscape, like the Germans, Poles, Italians and Irish.  The foundation of Chicago’s political machine was its ability to meet the specific needs of those who could be convinced to depend on them, and convincing as many people to depend on them as they could.  The Machine’s success meant that it could not ignore or exclude potential votes, wherever they came from, and that included the African-American community.  The Machine’s strength was derived from its network of precinct captains, committeemen and elected officials that would convene regularly to discuss its political platform, slate of candidates vote targets and distribution of benefits.    Washington received a sound political education in coalition building through his work in Chicago’s Machine.

    Washington was elected into the Illinois House of Representatives in 1965 and to the U.S. Congress in 1980.  Over the years, he developed a reputation of independence from the Chicago Democratic Party leadership, often becoming an unreliable member of the Machine’s state legislative contingent.  As a State Senator Washington was one of a group of independent black Democrats who partnered with white liberal Democrats and moderate Republicans to push forward the Illinois Human Rights Act of 1980.  His ascension to Congress later that year, defeating Machine loyalist Bennett Stewart, further alienated him from the Machine.

    This effort afforded Washington a unique political perspective.  He enjoyed strong independent support from his African-American base, largely developed apart from the Machine.  He had strong connections with members of Chicago’s “lakefront progressive” community, which had a fairly large contingent in the city’s Hyde Park community, where Washington also lived.  It was likely evident to Washington and others that this pairing provided him a wider base than other black elected officials who rose through the ranks and focused solely on serving the needs of their African-American constituents.  Furthermore, Washington likely realized that the Hyde Park progressive community’s networks with other progressives, particularly on the North Side, opened up opportunities for offices beyond Congress.

    Washington rode the wave of his unique coalition into mayoral politics in 1983.  Bolstered by support from his African-American base and reform-minded white progressives, Washington won against Republican Bernard Epton that November.  Once elected, however, he was confronted with a solid bloc of 29 aldermen (out of 50) firmly wedded to the “Democratic Organization” structure that had survived for so long in Chicago.  The bloc led a four-year period of legislative gridlock in Chicago known as Council Wars – the bloc assumed control of all Council committees, allowing it to set the legislative agenda; the bloc voted down virtually all of the mayor’s appointments; the bloc fought bitterly with Washington’s supporters on budget and appropriations.

    Despite the challenges, however, Washington’s coalition held firm.  Federal lawsuits led by Washington allies challenged Chicago’s ward redistricting following the 1980 Census.  At the time, Chicago’s population included approximately 40 percent white and black residents, and 15 percent with an Hispanic background.  However, Washington supporters argued that wards were gerrymandered to maximize the number of white aldermen in the racially polarized city – at the time of Washington’s election as mayor there were 33 white, 16 black and one Hispanic aldermen.  Federal courts ruled in favor of Washington’s supporters in 1986, causing a redrawing of seven wards and special elections.  Washington supporters won four elections, creating a 25-25 split in the City Council and effectively giving the mayor control of the Council through his ability to cast a deciding vote.  Unfortunately, Washington’s control was short-lived.  He died of a massive heart attack on November 25, 1987, just months after his defeat of the obstructionist bloc.

    Whereas Harold Washington’s political acumen made him a coalition builder, Baltimore mayor Kurt Schmoke’s stellar athletic and academic pedigree, wonky sensibility and personable nature drew coalitions toward him.

    Schmoke attended the prestigious Baltimore City College for high school, where he excelled in football and lacrosse.  He entered Yale University in 1967, where he played quarterback for the freshman team and developed into an undergraduate student leader.  After graduating from Yale with a degree in history in 1971, Schmoke studied as a Rhodes Scholar at Oxford University and graduated from Harvard Law School in 1976.

    Schmoke’s first electoral victory was as Baltimore State’s Attorney in 1982.  He defeated William Swisher in a surprise landslide, running a race-neutral campaign against the law-and-order, and (according to some) racially insensitive incumbent.  Schmoke was technically not Baltimore’s first black mayor; that title goes to Clarence “Du” Burns, who was elevated to mayor after the election of the previous mayor, William Donald Schaefer, as Maryland’s governor.  But Schmoke inherited much of Schaefer’s progressive and business establishment, as they saw him as the one who could articulate their agenda in a largely black city.  Schmoke challenged Burns in 1987 and won narrowly.  Recalling Schmoke’s victory for an article in Baltimore’s City Paper, City Council member Bill Cunningham said it was a “new-day-is-dawning thing.”  In the same article, the Rev. Arnold Howard of Enon Baptist Church said, “We were looking for someone to encompass our hopes for the future, someone who would validate our own journey.  He went into office with all that on him. He was the new savior. He was the one who would fulfill our dreams.”

    In the end, however, despite being twice re-elected, Schmoke’s analytical approach to leadership alienated coalitions who thought they were getting something else.  He developed a reputation for establishing bold policy goals that were difficult to build consensus around – improving adult literacy, drug decriminalization – and put in place department heads who brought the same policy wonk approach to their work that he did.  The business establishment and African-American community alike thought they were electing a dynamic “mover and shaker” who could energize them as they pushed toward new heights.  But Schmoke was perhaps more manager and caretaker than mover.  As a result he left office in 1999, deciding not to seek a fourth term, with a frayed coalition: a business community slightly betrayed, and an African-American community slightly disillusioned.

    Trans-Racial Appealists

    With the start of the 1990’s a new type of black political figure began to emerge.  Gains made through increased access to education and job opportunities were putting more African-Americans in previously unattainable positions, and allowing them to pursue previously unattainable avenues.  Wellington Webb, the first black mayor of Denver, fits this bill.

    Webb was born in 1941 in Chicago and arrived in the Mile High City at age 11.  In his autobiography, he chronicles a difficult childhood; his mother had a drinking problem and he ended up being raised by his grandmother, and he had academic difficulties at Denver’s Manual High School.  But Webb fought through his family problems and personal demons.  He attended and graduated from Northeastern Junior College in Colorado in 1960, and obtained his bachelor’s degree from Colorado State College in 1964.  He was introduced to politics by his grandmother, who was a Democratic Party district committeewoman in Denver.  Webb wanted to become a teacher, but found it difficult to obtain a position in Denver’s public schools, and thought local political involvement in some of the federal “War on Poverty” programs of the late 1960’s might help.  He transitioned from working in a potato chip factory to working in city government, and later obtained a master’s degree from the University of Northern Colorado in 1971.

    Webb developed a reputation as a numbers-cruncher and policy wonk in city government, and was pulled into politics rather than pushed into it by any sense of bitterness.  He was elected to the Colorado House of Representatives in 1972 and represented the Northeast Denver neighborhood he grew up in.  In 1977 he was appointed by President Jimmy Carter to serve as regional director of the U.S. Department of Health, Education and Welfare, and in 1981 he was appointed by Colorado Governor Richard Lamm to be executive director of the state Department of Regulatory Agencies.  Webb held that position until 1987, when he ran and won in the election to become Denver’s city auditor.

    Webb’s political ascendance through the ‘70s and ‘80s certainly put him on a path to consider pursuing citywide and even statewide positions, but it was unclear whether an African-American in a city with a small minority population, in a state with a small minority population, could be competitive.  He did not start with a built-in large political base like Young or Washington; nor did he have to ability to strengthen a base through coalition building the way Washington did.  His only strategy, should he pursue another office, was to make a trans-racial appeal that would highlight his experience, skills and vision.

    Webb entered the campaign in late 1990.  Three leading candidates emerged: Webb, Denver District Attorney Norm Early (also African-American), and Republican lawyer Don Bain.  Webb carried out his “Sneaker Campaign”, going door-to-door in virtually all of Denver’s neighborhoods while preaching a message of competency.  He surprised everyone by forcing a runoff with Early in the May 1991 primary, finishing with 30 percent of all votes to Early’s 40 percent.  Webb was able to consolidate the support from other candidates with a law-and-order platform prior to the general election against Early in June 1991.  Webb won with 57 percent of the vote.


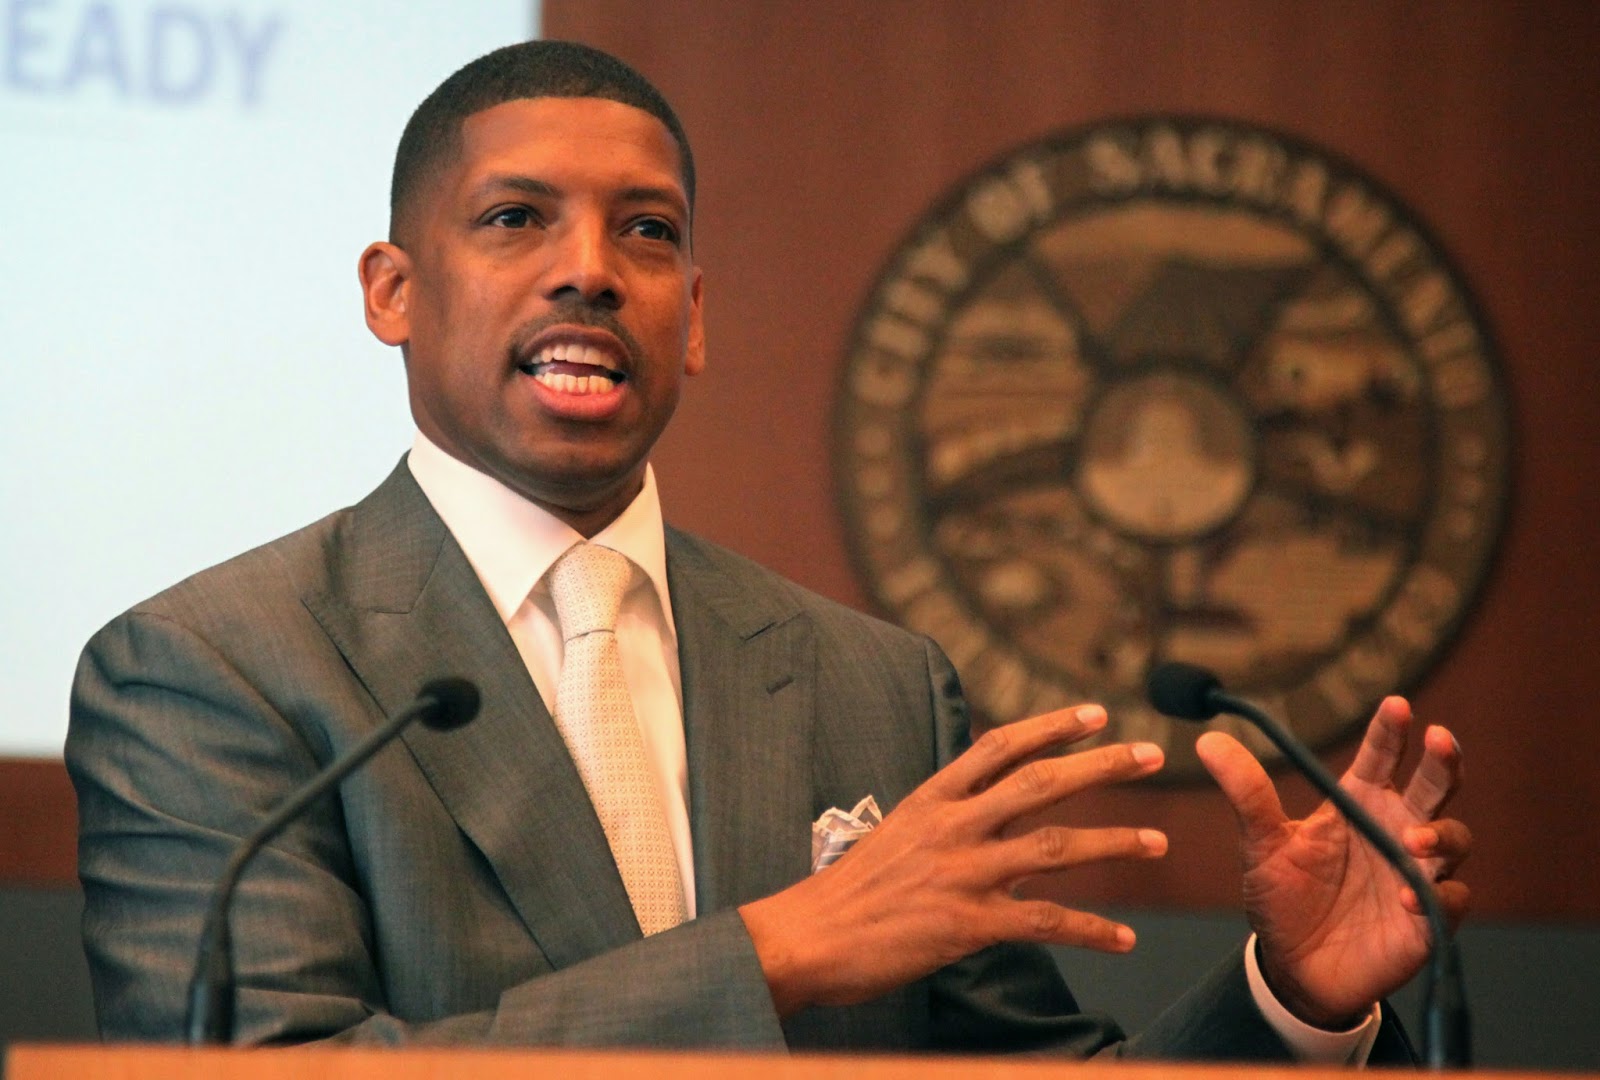
    Sacramento Mayor Kevin Johnson.  Source: gbmnews.com

    Perhaps a better version of a first black mayor who won with a broad trans-racial appeal would be Kevin Johnson of Sacramento.  Johnson was born in Sacramento, where he was a standout student and athlete.  He excelled in basketball and baseball, and accepted a scholarship to play basketball at the University of California, Berkeley.  From there he went on to a storied college basketball career and a long professional career with the NBA’s Cleveland Cavaliers and Phoenix Suns.

    Even during his playing days Johnson maintained strong roots with his native Sacramento.  He established the Kevin Johnson Corporation, which focused on real estate development and business acquisitions, and the St. HOPE nonprofit organization as an after-school program in the Oak Park neighborhood he grew up in.  After his retirement from basketball in 2000, he broadened St. HOPE to include charter schools and nonprofit development in Sacramento.  Today, St. HOPE is a network of four charter schools in Sacramento, and a development company with more than a dozen new construction and renovation projects in Sacramento.

    Johnson had intimated his political ambitions for years, but finally announced his run for mayor in 2008.  Race was hardly a factor in the race; indeed, Johnson was viewed as a decorated favorite son of California’s capital city.  Johnson received numerous endorsements from Sacramento’s business and political establishment, and was the highest vote getter in the nonpartisan election that June.  He forced a runoff against two-time incumbent mayor Heather Fargo, and soundly defeated her in November.

    Johnson has parlayed his athletic, corporate and nonprofit success well in the government sector.  He has been a staunch supporter of charter schools, along with his wife Michelle Rhee, the former chancellor of the Washington, DC Public Schools.  He was actively involved in keeping the NBA’s Sacramento Kings basketball team from fleeing the city, orchestrating the team’s sale to a group of local investors.  He easily won reelection in 2012, and in April 2014 was elected as president of the U.S. Conference of Mayors.

    There are other black mayors who fit the trans-racial appeal profile, but are not the first black mayors of their respective cities.  Kasim Reed of Atlanta, Michael Nutter of Philadelphia, and Cory Booker of Newark each brought impressive academic credentials, strong corporate backgrounds and youthful passion to their positions as mayor, distinguishing them from their predecessors.    Reed interned for U.S. Rep. Joseph Kennedy II before earning his juris doctorate from Howard University, and became a partner at a law firm prior to entering politics.  Nutter earned a business degree from the Wharton School at the University of Pennsylvania.  Booker earned his bachelor’s and masters degrees from Stanford, earned a Rhodes Scholarship to attend the University of Oxford, and earned his juris doctorate from Yale.

    Because of their academic and corporate credentials, Reed, Nutter and Booker are as comfortable in corporate boardrooms as they are in churches or community centers.  Each has forged partnerships with political opponents, and adopted a pragmatic bipartisan approach to governing cities.  Each has focused on effective service delivery rather than empowerment or redistributive policies.  Booker’s success as mayor of New Jersey’s largest city propelled him to his current position as New Jersey’s junior U.S. Senator through special election in 2013.

    The Power of Perception

    Detroit, Cleveland, Newark, Chicago, Denver, Baltimore and Sacramento occupy different positions on the success spectrum of American cities.  Of these five Chicago would certainly occupy the highest perch.  Chicago clearly is a global city – a world financial center, the home of a dozen Fortune 500 companies and the critical link in the nation’s rail and air transportation network.  The Windy City has extensive economic connections throughout the world.  Indeed, world-class architecture firms based in Chicago are designing the gleaming skyscrapers sprouting everywhere in China’s large cities.  Denver would rest in a position not far behind Chicago.  Denver has become the capital of the Great Plains and Mountain West, a mid-continent transportation hub that built its wealth on its access to mineral resources in the Rocky Mountains.  Sacramento would likely occupy a position behind Denver.  Sacramento’s growth has been more recent than the others, and it still sits in the shadows of much larger California metropolises.  But as the capital of our nation’s largest and most influential state, it has heft.

    Baltimore, Cleveland and Newark would occupy another place on the spectrum.  All are well known for enduring the storm of industrial decline, and in Cleveland’s case, fiscal insolvency.  They’re slowly recovering from a nadir reached perhaps a decade or two ago and have made small steps toward improvement.  They’ve worked hard to revitalize their cores – Newark has leaned on its financial services sector to turn the tide, while Baltimore and Cleveland have relied on their assets in education, health care services, and biomedical and biotech research.  However, all are far from being complete success stories.

    Then there is Detroit.

    Each city has had African-Americans serve in the city’s highest office.  Chicago’s Harold Washington endured tough times as mayor of Chicago, but he built a lasting coalition that allowed him to prevail.  Denver’s Wellington Webb learned to adapt in a pluralistic environment and raised the profile of a Western city.  Cleveland, Newark and Detroit each elected first black mayors during the turbulent post-Civil Rights era and paid a steep social price for doing so.  Cleveland and Newark began their turnaround some years ago; perhaps Detroit’s, with its recent bankruptcy filing, has just begun.

    If anyone doubts the impact of electing an African-American mayor during the racially tumultuous late ‘60s-early ‘70s era, examine the general perceptions that formed of the cities during that period and have endured ever since.  Newark and Detroit, already tainted by the aftermath of urban riots, were effectively shunned by white residents after the elections of their first black mayors.  Cleveland may have been headed down the same path after the election of Carl Stokes in 1967.  But Stokes chose not to run for a third two-year term as mayor, leaving a wide open field.  Stokes was followed by three consecutive white mayors — Ralph J. Perk, Dennis Kucinich and George Voinovich – before the election of the city’s second black mayor, Michael White, in 1990.  Atlanta touted itself as the “City too busy to hate” in the ‘70s, but Maynard Jackson’s 1973 election coincided with rapid white flight out of the city, at the same time that Sun Belt migration from the north was strengthening the suburban base.  In Washington, DC, black political empowerment there was often wrapped up in the controversy of federal political representation for the District.  Mayors in the District were federally appointed until Walter Washington was elected mayor in 1975.

    Perhaps the best way to view perceptions of cities that elected “first black mayors” during the Black Power Era is to examine the fortunes of Detroit and Philadelphia during and after this period.  Entering the 1970’s the Motor City and the City of Brotherly Love had similar populations (about 1.5 million people in Detroit, 1.9 million in Philadelphia), with a similar geography (about 140 square miles) and similar demographics (approximately a 60/40 split between whites and blacks).  As noted, Coleman Young was elected mayor of Detroit in 1973, narrowly winning against Police Commissioner John Nichols.  It was clear that Nichols’ candidacy was an effort by his constituency to restore order to a city during a difficult time.  Meanwhile, another police commissioner, Frank Rizzo, assumed power as mayor of Philadelphia in 1971.  As mayor Rizzo was regarded as having a strained relationship with the city’s African-American community.  Rizzo’s “law-and-order” tactics were viewed positively by his white ethnic base and have been credited by some for keeping Philadelphia from suffering the same fate as other cities.  Could the Nichols campaign have been modeled after the successful Rizzo election two years earlier?

    Possibly.  Yet it is instructive to view the difference in perceptions of both cities since that time.  Philadelphia was certainly hit hard by the decline of the nation’s manufacturing sector.  Philly had substantial losses in the shipbuilding, oil refining and food processing industries over the decades, losing thousands of jobs as a result.  Yet did Philly endure what was in effect a boycott of the city by white residents?  Troubled North and West Philadelphia are well known, but did their troubles define the entire city?  I think many people could imagine a real-life “Rocky Balboa” coming from Philadelphia in the ‘70s and ‘80s, but far fewer could imagine a similar character coming from Detroit.

    Philadelphia’s national perception took a tumble over the last 40 years, but the city has fought back hard to rebuild itself as a premier city with a strong economic foundation in education, health care and financial services.  Detroit, however, continued on a descent no other city endured.  High crime rates, racial tensions, dilapidated abandoned buildings in a desolate post-industrial landscape  — all defined Detroit then and continue to define it today.

    Between 1970 and 2010, Philadelphia’s population dropped by 22 percent, from 1.9 million to 1.5 million.  The decline was largely driven by a substantial loss of its non-Hispanic white population over the period, which declined by 56 percent.  Over the same period, Detroit’s population dropped by 53 percent, from 1.5 million to just over 700,000.  Its decline too was largely driven by a loss of its non-Hispanic white population, which dropped by 93 percent. Ninety-three percent.

    Something happened that kept a base or core of white residents in Philadelphia.  Something happened in Detroit that led to their virtual disappearance.

    Cities that elected their first black mayors during the Black Power Era deeply suffered in national perception because of the gamut of social challenges they had at the time, and found it difficult to stabilize poor economies or for revitalization to gain traction.  But they suffered far worse than other cities because they were in effect shunned.  They suffered from the greatest increases in crime.  They experienced the largest declines in school quality and performance.  They witnessed the steepest drops in property values.  They had the widest divides between police and community.  They had the highest numbers of white middle-class residents departing for the suburbs.  Newark was shunned.  Gary was shunned.  Detroit was shunned.  Maybe Cleveland, Los Angeles, or Cincinnati, or Dayton did not suffer the same fate because African-American populations there did not approach parity with whites, who were eventually able to “reclaim” the city’s highest office.  In the end, however, select cities paid a price for the election of black mayors during this time, a price not paid by cities that elected black mayors after them, or not at all.

    Another Transition


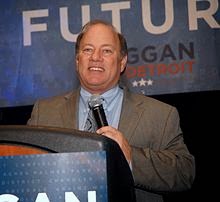
    Detroit Mayor Mike Duggan on election night in 2013.  Source: wikipedia.org

    On January 1, Michael Duggan assumed the difficult and unenviable responsibility of becoming the 75th mayor of Detroit, Michigan.  Given the most recent difficult period that Detroit has endured, and the continued difficult times ahead, Mayor Duggan’s inauguration was a subdued affair.  There was no inaugural ball or celebration.  The new mayor was simply sworn in with a short ceremony in his new 11th floor office in the Coleman A. Young Municipal Center.

    The new mayor said he would focus on operations – removing blight, snowplowing streets, repairing lights, making sure buses run safely and on time.  The mayor suggested he would move into Manoogian Mansion, the palatial mayoral residence on the Detroit River that was deeded to the city in the 1960’s.  As far as the focus on operations goes, he really has little choice in the matter.  The State of Michigan-appointed emergency manager Kevyn Orr, brought in with exceptionally broad powers to resolve the city’s financial mess and currently leading the Motor City’s largest-ever municipal bankruptcy, has a lock on policy decisions right now.  Mayor Duggan says his focus is to “return the city to elected leadership on October 1,” the day that Orr’s 18-month appointment from the state ends.

    And with that, Mike Duggan became the first white mayor of Detroit since 1973, mayor of a city with a population that is 83% African-American.  This most recent election, most observers believe, is a venture into the unknown, and is as much an experiment as Detroit’s bankruptcy itself.  An era of African-American political leadership has ended in Detroit, but no one is certain of what the next era might be.

    Perhaps the bankruptcy, the election of a white mayor and the growing urban pioneer spirit that is visible in parts of the city means that the shunning of Detroit has ended.

    This post originally appeared on August 10th, 2014 in Corner Side Yard.

    Pete Saunders is a Detroit native who has worked as a public and private sector urban planner in the Chicago area for more than twenty years.  He is also the author of “The Corner Side Yard,” an urban planning blog that focuses on the redevelopment and revitalization of Rust Belt cities.

    Top photo: The Monument to Joe Louis, commonly known as “The Fist”, in downtown Detroit. For more than thirty years, the sculpture has been a controversial symbol of black power in Detroit.  Source: Pete Saunders

  • New Class Order

    In this predictably difficult year for the Democrats, the party of the people is turning, of all people, to its plutocrats. However much the party stigmatizes right-wing billionaires like the Koch brothers, a growing proportion of America’s ultra-rich have become devoted Democrats, giving them an edge in fund-raising. Indeed, an analysis of billionaire contributors this year by Politifact found that 13 supported liberals while only nine backed Republicans.

    The left plutocracy helps explain how Harry Reid’s Democratic Senatorial Campaign Committee has greatly outraised their Republican rivals. Overall, Democratic-aligned committees have achieved a lopsided edge in fundraising – $453 million opposed to $289 million, according to Politico. Overall, the top three donors to the political Super PACs this year all lean to the left.

    Democrats counter that many Republican groups, notably the Koch-funded Americans for Prosperity, generally don’t reveal their finances. But as the New York Times’ Tom Edsall notes, “Liberals do the same, and the press in large part gives them a pass.” He points particularly to the “Democracy Alliance,” a conglomerate of some 100 very rich donors who contribute some $30 million annually to progressive organizations and causes.

    All this reflects a changing class system far more nuanced than the overworked meme about the “1 percent” arrayed against the toiling masses. Instead, we have a plutocracy increasingly divided, mostly along regional and industry lines, among themselves. It’s no surprise voters, notes columnist John Kass, are confused by this recent headline in the Chicago Tribune: “Obama decries income inequality in speech after $50,000-a-person fundraiser for Quinn.”

    The Democrats’ Plutocrats

    The Democratic plutocracy is largely rooted in such industries as telecommunications, entertainment, software, legal services and, surprisingly, a large section of Wall Street. Financial firms, such as Goldman Sachs, supported the president even before his first election. Although the firm did shift towards Mitt Romney in 2012, it maintains close, even intimate, ties to the president, as spelled out in the left-leaning Huffington Post. Wall Street has been the big winner in the Obama economy due to the Federal Reserve’s policy of ultra-low interest rates, which work to force investors into stocks.

    Others sectors also have good reasons to embrace the Democrats. Lawyers often benefit from increased regulation, although that does not apply to most businesses. Overall, legal firms have contributed more than twice as much to Democrats than they have to Republicans.

    Another powerful force for the Democrats lies in the high-tech sector. The same Fed policy that helps Wall Street asset managers also boosts venture capitalists by making investment in even dodgy start-ups irresistible. Once a minor force in campaigns, the tech firms, including software, have greatly expanded their campaign spending, up three-fold since 2000, with a tilt that, in 2012, saw Democrats harvest roughly twice as much high- tech cash as their GOP rivals.

    Most of the leading tech industry figures – Yahoo’s Melissa Mayer, Google’s Sergei Brin, venture capitalist Reid Hoffman as well as Facebook’s Mark Zuckerberg and Sheryl Sandberg – strongly tilt toward the Democrats. The grassroots nerdistan may be even more bluish; 91 percent of the contributions of Apple employees in the 2012 presidential race went to President Obama.

    Concerns over climate change are a big plus for the Democrats with Silicon Valley. Mega-figures like Google’s Eric Schmidt and Tom Steyer, a former big time investor in fossil fuels, oppose all fossil fuels, including natural gas. Apple’s CEO Tim Cook, who has Al Gore on his board, has even asked that what he considers climate change “deniers” not invest in his company.

    Silicon Valley is not just content to proselytize the masses. Firms like Google and investors have been quick to exploit the Democrats’ green politics, investing heavily in highly subsidized renewable fuels. Being green has become yet another business opportunity for some of America’s wealthiest investors and companies.

    Then there’s always geography. Most of the major Democratic plutocrats live in solidly blue states such as Washington, California, Illinois and New York, where political influence means, for the most part, appealing to Democrats.

    In contrast, being a conservative Republican in Silicon Valley avails one little; you are pretty much excluded from the biggest political events and any ideological misstep, as the former head of Mozilla learned the hard way, can lead to virtual banishment.

    The Republican Residue

    None of this suggests that the Republicans have become the new de facto populist party. The GOP still gathers in millions of dollars from big businesses, but these tend to be very different industries than those of the Democrats. Particularly prominent are fossil fuel companies, caught in the crosshairs of the White House and its regulatory apparatus. In 2012, oil and gas executives doubled their federal contributions to $70 million, with some 90 percent going to Republicans.

    This year, energy firms are again making big bets on the GOP, hoping to block environmentalist-backed regulations by helping Republicans gain a majority in the Senate.

    Republicans also do well with old-line oligarchs in agribusiness firms, home builders, casino owners, commercial banks and insurance companies. Once more divided in their loyalties, these appear to becoming increasingly GOP oriented in recent years. The party’s embattled governors have been raising millions from energy moguls like the Kochs, casino magnate Sheldon Adelson and tobacco firm Reynolds American.

    There’s also a strong regional tilt here. Most strong energy, home-building and agribusiness firms are concentrated in the middle of the country, most prominently in Texas, Oklahoma, and the Dakotas. Voters in these states, particularly Republicans, tend to be more favorable, according to Gallup, to expanding natural gas and oil production than their Democratic counterparts who are generally more partial to wind and solar.

    Other players tip the scales to the Democrats.

    Traditionally, Democrats have balanced the disproportionate business support for Republicans with strong backing from unions.

    Since 1989, six of the largest political donors have come from labor. Today, business may be effectively divided, but organized labor remains rock solid in its backing for President Obama and his party.

    Some private sector unions are upset by presidential policies on such things as Keystone XL pipeline.

    But increasingly, the dominant union force behind the Democrats is not hard-hats but public employee unions, whose power in many blue states is all but incontestable.

    Looking forward: The Gentry Liberal Ascendancy

    Despite the fund-raising shortfall, Republicans could do well this November.

    Even brilliantly targeted get-out-the-vote efforts, or effective use of social media, may not be enough to save Harry Reid’s Senate majority, and certainly will not be enough to break the GOP stranglehold on the House. But this may prove only a temporary triumph, as most long-term trends in political fund-raising favor the Democrats.

    The most profound is the movement of money away from the tangible economy – oil and gas, manufacturing, home-building, logistics – to such activities as financial transactions, digital technology, media and entertainment.

    Unless the Democratic Party rediscovers its populist soul, these sectors, and those who derive their fortunes from it, will enjoy friendly treatment from Democrats, whether in mergers, as in the case of Comcast, or in evading privacy controls, which impacts much of the social media sector.

    More important will be the progressive orientation of the trustifarians, the inheritor generation, which is just emerging from Hollywood, Silicon Valley and Wall Street.

    Already the bulk of nonprofits are now solidly liberal, with roughly 70 percent of their funds going to left-of-center causes. This trend will likely increase in the future. The new gentry – like the inheritors of the fortunes of the once-reactionary Ford, MacArthur and Rockefeller families – is likely to ignore basic business concerns and instead adopt the generally leftist culture in their favored locales.

    Ultimately, the American oligarchy is transforming in ways injurious to Republicans and favorable to the Democrats. The Supreme Court has dropped restrictions on fundraising and the economy has boosted the incomes of the super-rich, but not much for anyone else.

    That may upset Democrats in principle, but, in the long run, they are likely to be the biggest beneficiaries.

    This piece originally appeared at The Orange County Register.

    Joel Kotkin is executive editor of NewGeography.com and Distinguished Presidential Fellow in Urban Futures at Chapman University, and a member of the editorial board of the Orange County Register. His newest book, The New Class Conflict is now available at Amazon and Telos Press. He is author of The City: A Global History and The Next Hundred Million: America in 2050. His most recent study, The Rise of Postfamilialism, has been widely discussed and distributed internationally. He lives in Los Angeles, CA.