Tag: middle class

  • The Revolt Against Urban Gentry

    The imminent departure of New York’s Mayor Michael Bloomberg, and his replacement by leftist Bill DeBlasio, represents an urban uprising against the Bloombergian  “luxury city” and the growing income inequality it represents. Bloomberg epitomized an approach that sought to cater  to the rich—most prominently Wall Street—as a means to both finance development growth and collect enough shekels to pay for services needed by the poor.

    This approach to urbanism draws some of its inspiration from the likes of Richard Florida, whose “creative class” theories posit the brightest future for “spiky” high cost cities like New York.  But even Florida now admits that what he calls  “America’s new economic geography” provides “ little in the way of trickle-down benefits” to the middle and working classes.    

    Some other urbanists don’t even really see this as a problem. Harvard’s Ed Glaeser, a favorite of urban developers, believes De Blasio should celebrate the huge gaps between New York residents as evidence of the city’s appeal; a similar argument was made recently about California by an urban Liberal (and former Oakland Mayor) Jerry Brown, who claimed the state’s highest in the nation poverty rate reflected its “incredible attractiveness”.

    Couched in progressive rhetoric, the gentry urbanists embrace an essentially neo-feudalist view that society is divided between “the creative class” and the rest of us. Liberal analyst Thomas Frank suggests that  Florida’s “creative class” is numerically small, unrepresentative and self—referential; he describes them as  “members of the professional-managerial class—each of whom harbors a powerful suspicion that he or she is pretty brilliant as well.”

    The Voters rebel.

    The revolt against this mentality surfaced first in New York perhaps because the gaps there are so extreme. Wall Streeters partied under Bloomberg, but not everyone fared so well. The once proudly egalitarian city has become the most unequal place in the country, worse even than the most racially divided, backward regions of the southeast.  In New York, the top 1 percent earn roughly twice as much of the local GDP than is earned in the rest of country. The middle class in the city is rapidly becoming vestigial; according to Brookings its share of the city’s population has fallen from 25 percent in 1970s to barely sixteen percent today.   

    De Blasio rode this chasm between “the two cities” to Gracie Mansion, but his triumph represents just part of a growing urban lurch to the left. Voters in Seattle, for example, just elected an outright Socialist who promptly called on Boeing workers to take over their factory. More reasonably, she is also campaigning for a $15 an hour minimum wage, a reaction against the surging inequalities in that   historically egalitarian Northwest city.

    Similarly  San Franciscans turned down a new luxury condo development along their waterfront, in large part because it was perceived as yet another intrusion of the ultra-rich. Even as the city enjoys its most recent tech bubble, resentment grows between the tech elites, including those traveling on private buses to Silicon Valley, and ordinary San Franciscans, struggling to cope with soaring housing costs.

    The New Urban Demography

    Bloomberg’s “luxury city” was ultimately undermined by its own demographic logic. Bloomberg’s gentry urbanist policies have undermined New York’s private sector middle class, a group that was critical to his own early rise to power and even more decisive in electing his predecessor, Rudy Giuliani. This same group of middle class voters, largely clustered in the San Fernando Valley, also drove the election of Richard Riordan in Los Angeles in 1993 and his comfortable re-election four years later. But the private sector middle class

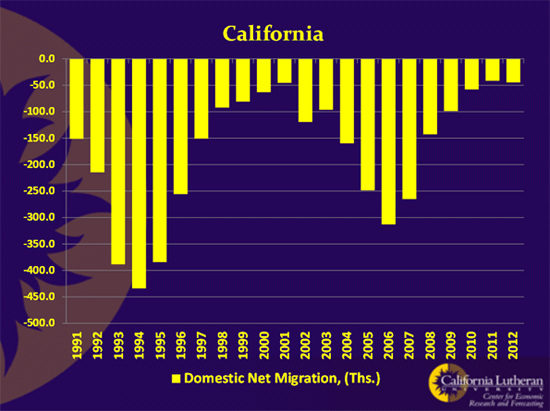
    The fading of the old middle class came with the rapid decline of industries, like manufacturing and logistics that once employed them.  Since 2000, the New York metropolitan region has lost some 1.9 million net domestic migrants, the most of any  in the country. $50 billion in lost revenue has bled out of the city along with the people departing. Florida alone, the largest destination has gained almost $15 billion in income. Other major cities, notably Los Angeles and Chicago, have suffered similar losses since the 1970s, notes Brookings, as middle income neighborhoods have declined while both poor and very affluent areas have grown.    

    Becoming the ultimate playground to the rich made things worse for most middle class New Yorkers by imposing higher costs, particularly for rents. In fact, controlling for costs the average New York paycheck (costs) is among the lowest in the nation’s 51 largest metro areas, behind not only San Jose, but Houston, Raleigh, and a host of less celebrated burgs. A big part of this is the cost of rents. According to the Center for Housing Policy and National Housing Conference , 31 percent of New York’s working families pay over 50% of their income in rent, well above   the national rate of 24 percent, which itself is far from tolerable.

    Conditions for those further down the economic scale, of course, are even worse. The urban poor in New York, Chicago, Los Angeles or Philadelphia , notes analyst Sam Hersh, find their meager resources strained by high prices not  common in less fashionable cities like Buffalo or Dallas. “In some ways,” he notes, “ the low cost of living in “unsuccessful” legacy cities means that quality of life is in many cases better than in those cities widely regarded as a success.”

    The dirty little secret here is the persistence of urban poverty. Despite the hype over gentrification, urban economies—including that of New York—still underperform their periphery. Nearly half of New York’s residents, notes the Nation are either below the poverty line or just above it. Just look at the penultimate symbol of urban renaissance, Brooklyn. The county (home to most of my family till the 1950s) suffers a median per capita income in 2009 of just under $23,000, almost $10,000 below the national average (PDF).

    Marquee cities haven’t “cured poverty” or exported it largely to the suburbs, as is regularly claimed. Cities still suffer a poverty rate twice as high as in the suburbs. Demographer Wendell Cox notes that  some 80% of the population growth over the past decade in the nation’s 51 largest cities came from the ranks of those with lower incomes, most likely the children of the entrenched poor as well as immigrants.

    The resilience of poor populations has occurred even as there has been a much ballyhooed surge into some cities of younger people, primarily single, often well-educated, childless and less traditional in their values. This demographic shift has further pushed urban politics to the left as singles, particularly women, have become, next to African-Americans, the most reliable Democratic constituency.

    By the time these young people get older and develop more interest in issues like schools, parks and public safety, Census data suggest they leave in cities large numbers, depriving them of a critical source of political, social and economic stability. By the age of 40, according to the most recent data, going up to 2012, more desert the core city than ever came there in the first place.   

    Urban Politics Left Turn

    This new demography—essentially a marriage of rich, young singles and the poor—has created an urban electorate increasingly one-dimensional, and less middle class, not only in economic status, but also, perhaps more importantly, in attitude. This can be seen in the very low participation rates in de Blasio’s victory in New York, where under one quarter of the electorate voted in the election compared to some 57 percent in the 1993 Giuliani vs Dinkins race. Historically, middle class voters were the most reliable voters and their decline has led to record low participation not only in New York, but also in Los Angeles, where new Mayor Eric Garcetti was elected with the lowest turnout, barely twenty percent, in a contested election in recent memory.

    The decline in voter participation occurs as cities are becoming ever more one-party constituencies. Two decades ago a large chunk of the top twelve cities were run by Republicans, but today none are. America’s cities have evolved into a political monoculture, with the Democratic share growing by 20 percent or more in most of the largest urban counties.

    Under such circumstances the worst miscues by liberals are largely ignored or excused as politics and media take place in a kind of left-wing echo chamber. Even the meltdown of the healthcare law, which has hurt the president’s approval rating in national polls, seems to have not impacted his popularity in urban areas.  

    In New York and other cities this shift leftward, ironically, has been enabled by the successes of Bloomberg and other pro-business pragmatists whose successful policies on issues like crime have shifted the political agenda to other matters. “This election is not going to be about crime, as some previous elections were,” de Blasio told National Journal last month. “It used to be in New York you worried about getting mugged. But today’s mugging is economic. Can you afford your rent?”

    Policy Directions.

    With crime a less urgent issue and no sizable right or even centrist voting blocs, urban leaders can now push a set of initiatives—for example on policing—that would have been unthinkable in the New York of Rudy Giuliani or Los Angeles under Riordan. There are also likely to be fewer pushes for education reform, a critical issue for retaining the middle class, since most left-wingers, like de Blasio, largely follow the union party line.

    This is not to suggest that we should long for a return to the Bloombergian  “luxury city.” The gentrification-oriented policies did indeed foster the evolution of  two cities, one preserved by tax increment funding and donations by wealthy and businesses and another, heavily minority city, notes analyst Aaron Renn facing budget constraints, the closing of schools, parks and other facilities  

    But revoking these policies alone does little to expand the middle class and diminish social inequality. A more direct step would be to boost the minimum wage in cities—as suggested by Seattle’s firebrand socialist council member and endorsed by the new Mayor— for the vast numbers of working poor who labor in hotels, fast food restaurants and other service businesses.  This, to his credit, is what Richard Florida suggests as part of his proposed “creative compact” to boost the pay workers who work in service jobs for his dominant “creatives.”

    This policy does address inequities but it may also have the effect of reducing overall employment as companies seek to downsize and automate their operations. Although conceived to help the working poor, it could further reduce job opportunities for those most in need of work.

    Can Social Media Save New York?

    The key issue is how to expand high wage jobs in cities with high rents and costs of living. One approach, embraced by many urban boosters, is to lure social media firms. Tech companies tend to concentrate in denser urban areas and are also a good fit with urban left-wing politics as they tend to be dominated by young, alternative lifestyle types.

    However, this is a risky proposition, given the historic volatility of these companies. After the last bubble, Silicon Alley suffered a downward trajectory, losing 15,000 of its 50,000 information jobs in the first five years of the decade.

    Although some claim, in a fit of delusion, that the city is now second to the Silicon Valley in tech this ignores the long-term trends. In fact, since, since 2001, Gotham’s overall tech industry growth has been a paltry 6% while the number of science, technology, engineering, and math related jobs has fallen 4%. This performance pales compared not only to  the Bay Area, but a host of other cities ranging from Austin and Houston to Raleigh, Salt Lake and Nashville.

    The chances of Gotham becoming a major tech center are further handicapped   by a severe lack of engineering talent. On a per capita basis, the New York area ranks 78th out of the nation’s 85 largest metro areas, with a miniscule 6.1 engineers per 1,000 workers, one seventh the concentration in the Valley and well below that of many other regions, including both Houston and Los Angeles.

    Finally for most cities, and particularly in New York, Los Angeles and Chicago, the rise of social media has been a mixed blessing. Whatever employment is gained in social media has been more than lost by declines in book publishing, videos, magazines and newspapers—all industries historically concentrated in big cities. Since 2001 newspaper publishing has lost almost 200,000 jobs nationwide, or 45% of its total, while employment at periodicals has dropped 51,000,or 30%, and book publishing, an industry overwhelmingly concentrated in New York, lost 17,000 jobs, or 20% of its total.

    Restoring the Aspirational City

    Instead of waiting for the social media Mr. Goodbars to save the day, or try to force up wages by edict, cities may do better to focus on preserving and even bolstering existing middle-income jobs. In New York, for example, more emphasis needs to be placed on retaining mid-tier white collar jobs, which have been fleeing the city for more affordable regions, including the much dissed suburbs.    

    New York’s middle class has been a primary victim of the wholesale desertion of the city by large firms.  In 1960 New York City boasted one out of every four Fortune 500  firms; today it hovers around 46. And even among those keeping their headquarters in Gotham,  many have shipped most of their back office operations elsewhere. Amidst a record run on Wall Street, the financial sector’s employment has fallen by 7.4 percent since 2007. The city’s big employment gains have been mostly concentrated in low-wage hospitality and retail sectors—service jobs that often don’t provide benefits and are vulnerable to fluctuations in the market.

    Other potential sources of higher wage jobs include those tied to   international trade, logistics and, in some areas, manufacturing. Many progressive theorists denigrate these very industries, which tend to pay higher than average wages across the board. Traditional employment sectors like these  have   bolstered urban economies in Houston, Oklahoma City, Dallas-Ft. Worth and Charlotte.  

    Equally important, cities need to shift away from the gentry urbanist fixation on the dense urban core and focus on more diverse neighborhoods. As more workers labor from home, and make their locational decisions based on factors like flexible hours and time with family, cities need to stop viewing neighborhoods as bedrooms for downtown, and begin to envision them as their own generators of wealth and value. The era of the office building has already peaked, and increasingly employment, even in cities, will become dispersed away from the cores.

    Sadly, it’s doubtful the new left-wing urban leaders will embrace these ideas, in some part due to pressure from the “green” lobby. Though he was elected based on a message that assailed the city’s structural inequality, ulitimately de Blasio   may end up more dependent on Wall Street than even his predecessor since his plans to fund expanded social and educational programs depend squarely on extractions from the hated “one percent.”

    What our cities need is not a return to theatrical leftism or hard left redistributive policies, but a new focus on improving the long-term economic prospects of the middle and aspirational working class. Without this shift, the new leftist approach will fail our cities as much, if not more so, than the rightfully discredited gentry urbanism it seeks to supplant.

    This story originally appeared at The Daily Beast.

    Joel Kotkin is executive editor of NewGeography.com and Distinguished Presidential Fellow in Urban Futures at Chapman University, and a member of the editorial board of the Orange County Register. He is author of The City: A Global History and The Next Hundred Million: America in 2050. His most recent study, The Rise of Postfamilialism, has been widely discussed and distributed internationally. He lives in Los Angeles, CA.

    Photo by Mike Lee

  • Progressive Policies Burden the Yeoman Class

    Obamacare’s first set of victims was predictable: the self-employed and owners of small businesses. Since the bungled launch of the health insurance enrollment system, hundreds of thousands of self-insured people have either had their policies revoked or may find themselves in that situation in the coming months. More than 10 million self-insured people, many of them self-employed, could meet a similar fate.

    Unlike large companies or labor unions, which have sought to delay or duck implementing the Affordable Care Act, what could be called the yeoman class lacks the political might to make much of a dent in Washington policies. Indeed, in the Obama era, with its emphasis on top-down solutions and Chicago-style brokering, Americans who work for themselves probably are more marginalized today than at any time in recent memory.

    Virtually every major initiative of this administration – from taxation and regulation to monetary policy and Obamacare – has been promulgated with little concern for the self-employed. Many feel themselves subject to an apparent attempt to transfer middle class incomes to the poor just as ever more wealth concentrates in the “1 percent.” Not surprisingly, 60 percent of business owners surveyed by Gallup expressed opposition to the administration.

    The divide between the yeoman and the political community marks a major departure from the norms of American history. After all, people came to America in large part to secure “a piece of the pie,” whether through owning a small business or a farm, goals often unattainable in Europe. Thomas Jefferson, notes historian Kenneth Jackson, “dreamed of the U.S. as a nation of small yeoman farmers who would own their own land and cultivate it.”

    The rural yeoman ascendency lasted well into the late 19th century, when the populist movement fell to triumphant industrial capitalism. Yet the drive to disperse property did not end there, but resurfaced in the expansion of urban homeownership, something strongly supported by the New Deal administration. “A nation of homeowners,” President Franklin Roosevelt believed, “of people who own a real share in their land, is unconquerable.” From 1940-60, nonfarm homeownership rose from 43 percent of Americans to more than 58 percent.

    Early on, some progressives, particularly among intellectuals, recoiled against the rise of a class of petty landowners. Some of them, historian Christopher Lasch observed, saw “a republic of producers” as necessarily “narrow, provincial and reactionary.” This view is echoed today by Democrats such as former Clinton administration adviser Bill Galston, who dismisses small business as “a building block of the Republican base.” Democrats, he suggests, should instead seek a reconciliation with Big Business and its powerful cadre of lobbyists.

    An expanding cohort

    Yet, Democrats someday may rue tossing off the yeoman class. Unlike such groups as white racists, defense hawks and social conservatives, all of whose ranks are thinning, the numbers of the self-employed are growing. Independent contractors, according to Jeffrey Eisenach, an economist at George Mason University, have increased by 1 million since 2005; one in five works in such fields as management, business services or finance, where the percentage of people working for themselves rose from 28 percent to 40 percent from 2005-10. Many others work in fields like energy, mining, real estate or construction. Altogether, there are as many as 10 million such independent workers, constituting upward of 7.6 percent of the U.S. labor force and earning more than $626 billion.

    This shift to self-employment is occurring even in heavily regulated states like California. Since 2001, the number of self-employed people in the Golden State grew by 15.6 percent, versus a gain of 9.4 percent for the nation. In terms of states’ share of self-employed in the workplace, California ranks in the top five; three of the others, Vermont, Maine and Oregon also are blue states.

    Why is this the case? Ironically, this may be a reaction to expansive regulatory regimes that tend to both reduce corporate employment and also encourage some individuals “to take their talents” solo into the marketplace without having to deal with, for example, labor laws and environmental regulations.

    At the same time, technology allows people to work in an increasingly dispersed manor. The number of telecommuters has soared by 1.7 million workers over the past decade, a 31 percent increase in market share, and now accounts for 4.3 percent of all employment.

    Obamacare is only one aspect of government’s assault on the yeoman class. Attempts to regulate housing and encourage denser, usually rental, units ultimately works against the interests of home-based small businesses by raising house prices. The extra bedroom that becomes the home office now can be seen as “wasteful” even if – in terms of generating greenhouse gases – working at home is far more efficient than commuting, even by mass transit.

    Alienating allies

    Over time, these conflicts could threaten the interests of some groups that now reside firmly in the Obama majority coalition. This reflects the changing demographics of small enterprise; the yeomanry is slowly becoming far more diverse. From 1982-2007, for example, African American-owned businesses increased by 523 percent; Asian American-owned businesses grew by 545 percent; Hispanic American-owned businesses by 696 percent; businesses owned by whites increased by 81 percent. Today, minority-owned firms make up 21 percent of the nation’s 27 million small businesses.

    Immigrants, a largely Democratic-leaning constituency, constitute a growing part of the entrepreneurial landscape. The immigrant share of all new businesses, notes the Kauffman Foundation, grew from 13.4 percent in 1996 to 29.5 percent in 2010. They also constitute roughly a quarter of founders of high-tech start ups, and have done so for most of the past generation.

    Women, another Obama-leaning group, have also expanded their footprint; over the past 15 years, the number of women-owned firms has grown by one and a half times the rate of other small enterprises. These companies account for almost 30 percent of all enterprises; from 1997-2012, the number of women-owned U.S. firms increased by 54 percent, versus an overall growth rate for all firms of 37 percent.

    Eventually, the potential yeoman backlash may also spill over to millennials, another key Obama constituency. As a generation, their desire for homeownership and economic self-reliance runs headlong into both the tepid economic recovery and regulatory policies. Over time, as they age, their interests could diverge from the expanding welfare state, whose primary mission appears to be to transfer wealth not only from the middle class to the poor but from younger to older Americans.

    As millennials age, many will seek to buy homes, start businesses and families. In contrast to their common, often-naïve embrace of the idea of bigger government, developed in their student years, experiences as potential homeowners and parents, as well as business owners, might make them skeptical of “top down” solutions imposed by largely baby boomer ideologues.

    Reply from the Right?

    Yet, this will be no cakewalk for conservatives. It is not enough to simply dismiss Obamacare, or other regulations, without endorsing some of the measures’ positive attributes, such as assuring one’s children or protecting the rights of those with “pre-existing conditions.” The yeomanry may want less-Draconian legislation, but they may not be so anxious to leave their health care utterly exposed to unfettered market forces.

    Democrats, in fact, could make a run at this constituency, particularly if the Republicans continue a political approach that alienates, in particular, a more diverse yeomanry – gays, many women and ethnic minorities, immigrants and creative professionals. Here, in fact, it might be better to be more radical than less, proposing something more like a Canadian “single payer” health system that would separate employment status from health care. Democrats also could also support some form of minimum coverage designed for the growing numbers of Americans who work for themselves.

    Ultimately, over time, the yeoman constituency, although poorly organized and without a programmatic agenda, is one that needs to be addressed, if for no other reason than they constitute a growing portion of the workforce. The party, or movement, that successfully does this will have a great opportunity to seize the political future.

    This story originally appeared at The Orange County Register.

    Joel Kotkin is executive editor of NewGeography.com and Distinguished Presidential Fellow in Urban Futures at Chapman University, and a member of the editorial board of the Orange County Register. He is author of The City: A Global History and The Next Hundred Million: America in 2050. His most recent study, The Rise of Postfamilialism, has been widely discussed and distributed internationally. He lives in Los Angeles, CA.

    Official White House Photo

  • Jerry Brown and California’s “Attractive” Poverty

    Jerry Brown is supposed to be a different kind of politician: well informed, smart, slick, and skilled.  While he has had some missteps, he’s always bounced back.  His savvy smarts have allowed him to have a fantastically successful career while generally avoiding the egregious dishonesty that characterizes so many political practitioners.

    So, I was shocked to read that he said that California’s poverty is a result of the State’s booming economy.  Here’s part of the Sacramento Bee report:

    Gov. Jerry Brown, whose pronouncements of California’s economic recovery have been criticized by Republicans who point out the state’s high poverty rate, said in a radio interview Wednesday that poverty and the large number of people looking for work are "really the flip side of California’s incredible attractiveness and prosperity."

    The Democratic governor’s remarks aired the same day the U.S. Census Bureau reported that 23.8 percent of Californians live in poverty under an alternative calculation that includes the cost of living. Asked on National Public Radio’s "All Things Considered" about two negative indicators — the state’s nation-high poverty rate and the large number of Californians who are unemployed or marginally employed and looking for work — Brown said, "Well, that’s true, because California is a magnet.

    "People come here from all over in the world, close by from Mexico and Central America and farther out from Asia and the Middle East. So, California beckons, and people come. And then, of course, a lot of people who arrive are not that skilled, and they take lower paying jobs. And that reflects itself in the economic distribution."

    This is so incredibly wrong that I’m worried that Brown has lost his head and ability to reason.   If he really believes what he said, he’s living in the past and he’s so ill informed as to be delusional.  If he doesn’t believe what he said, I’m worried that his political skills have slipped.  To my knowledge, he’s never said anything so clearly at odds with the truth in his career.

    Here are the facts:

    • California’s poverty is not where the jobs are, which is what we’d expect if what Brown said was true.  Most of California’s jobs are being created in the Bay Area, a region of fabulous wealth. By contrast, California’s poverty is mostly inland. San Bernardino, for example, has the second highest poverty rate for American cities over 200,000 population, and no, it’s not because it’s a magnet. Most of California’s Great Central Valley is a jobs desert, but the region is characterized by persistent grinding poverty and unemployment.  No one in recent years is moving to Kings County to look for a job.
    • States with opportunity have low poverty rates.  North Dakota may have America’s most booming economy.  According to the Census Bureau, North Dakota’s Supplemental Poverty Measure is 9.2 percent.  That is, after adjustments for cost of living, 9.2 percent of North Dakotans live in poverty.  The rate in Texas – a state with a very diverse population, and higher percentages of Latinos and African-Americans – is 16.4 percent.  California leads the nation with 23.8 percent of Californians living in poverty.
    • According to the U.S. Census, domestic migration (migration between California and other states) has been negative for 20 consecutive years. That is, for 20 years more people have left California for other states than have come to California from other states. Wake up, Jerry, this is no longer your Dad’s state – or that of his successor, Ronald Reagan. This is a big change from when Brown was elected governor the first time.  At that time, California was a magnet.  It had a vibrant economy, one with opportunity.  California was a place where you could have a career, afford a home, raise a family.  It was where the American Dream was realized.
    • How about the magnetic attraction for immigrants from all over the world? According to the Census Bureau, international migration to California is way down.  The number of California international immigrants has been declining for a decade at least.  Indeed, in recent years there have been about half as many international immigrants to California than we saw in the 1990s.  Over the past decade, the number of foreign born increased more in Houston than the Bay Area and Los Angeles put together. Opportunity, not  “attractiveness”, drives people to move.
    • The result of negative domestic migration and falling international migration is the total migration to California has been negative in each of the past eight years.  More people have left California than have come to California for eight consecutive years. 
    • California’s migration trends combined with falling birth rates has resulted in the lowest sustained population growth rates that California has seen.

    The data are clear: Brown’s assertions have no basis in fact.  California – with the exception only recently of the Bay Area – is not a magnet. California is not "incredibly attractive and prosperous."  People are not coming from all over the world. California may beckon, but more are leaving, and those here are having fewer children. California’s seductive charms go only so far.

    I don’t know if I’d prefer that Brown was delusional or lying. On the one hand, policy made from a delusional analysis of the world is sure to be bad policy. Brown, for example, may convince himself that Twitter, Google, and Facebook are the future of the California economy, without recognizing how few people, particularly from the working class or historically disadvantaged minorities, they employ. On the other hand, Brown is very skilled in the political arts. If someone as skilled as he has to resort to such outright misdirection, we may be in worse shape than I think.

    Bill Watkins is a professor at California Lutheran University. and runs the Center for Economic Research and Forecasting, which can be found at clucerf.org.

    Jerry Brown photo by Bigstock.

  • Are Millennials Turning Their Backs on the American Dream?

    In his classic 1893 essay, “The Significance of the Frontier in American History,” historian Frederick Jackson Turner spoke of “the expansive character of American life.” Even though the frontier was closing, Turner argued, the fundamental nature of Americans was still defined by their incessant probing for “a new field of opportunity.” Turner’s claim held true for at least a century—during that time, the American spirit generated relentless technological improvement, the gradual creation of a mass middle class, and the integration of ever more diverse immigrants into the national narrative.

    Yet today, many consider this modern period of “expansiveness” to be as doomed as the prairie frontier culture whose denouement Turner portrayed. Nothing makes this clearer than the perception of a majority of middle class Americans that their children will not do better than them, with as many as pessimistic about the future as are optimistic. Almost one-third of the public, according to Pew, consider themselves “lower” class , as opposed to middle class, up from barely one quarter in 2008.

    Are Young Americans Becoming Herbivores?

    To some, this dismal outlook is either inevitable, or even positive, as Americans shift from their historically “expansive” view and embrace a more modest déclassé future. Rather than seek new worlds to conquer, or even hope to retain the accomplishments of prior generations, contemporary young Americans seem destined to confront a world stamped by ever narrowing opportunity, class distinction, and societal stagnation. Once a nation of competitive omnivores and carnivores, America could be turning more docile—a country of content, grazing herbivores.

    Just such a diminished world view has already taken root in Japan, particularly among that country’s younger males. Growing up in a period of tepid economic growth, a declining labor market, and a loss of overall competitiveness, Japan’s male “herbivores” are more interested in comics, computer games, and Internet socializing than building a career or even the opposite sex. Marriage and family have increasingly little appeal to them, sentiments they share with most women their age.

    This devolved future is widely embraced by both left and right. Libertarian-leaning economist Tyler Cowen identifies a permanent upper class, essentially those who command machines and particularly the software that runs them, while the masses, something like 85 percent of the population, need to adjust to lower living standards, and a diet made up largely of beans and rice.

    This approach has appeal to the grandees of finance, who see in a diminishing American dream not only higher relative status for themselves but an opportunity to turn prospective property owners into rental serfs. Large equity funds have been particularly aggressive about buying foreclosed homes and renting them out, often at high rates, to economically distressed families.

    This “rentership” society, as first suggested by Morgan Stanley’s Oliver Chang, reflects, in this sense, an almost Marxian dialectic that sees ownership of property concentrating in ever fewer hands. Conservative theorists have little problem with this, since they naturally defend class privileges and are less committed to upward mobility than assuring the relentless triumph of market capitalism.

    But the most potent apologists for shrinking the American dream come from the very left which, in the past, once championed broad-based economic growth and upward mobility. Instead, progressives increasingly favor their own version of a “rentership society,” albeit one more regulated than the conservative version, but also accepting , and even encouraging, the proletarianization of the American middle class. (Turning them, in the process, into good, reliable clients of the Democratic Party). Goodbye Levittown, with its promise of property ownership and privacy, and back to the tenements of Brownsville, now dressed up as “hip and cool.”

    Some even have suggested getting rid of “middle class norms of decency” governing housing and bringing back the boarding house of the 19th and early 20th Century. The goal, of course, is to facilitate ever more densification of urban areas and to rein in the dreaded suburban “sprawl.”

    This tendency to force densification and downgrade ownership is deeply pronounced among urbanists and the green lobby, two groups with ample power in most blue states and regions. “Progressive” theorists such as Richard Florida see wealth transferring to a handful of “spiky” American cities, places such as San Francisco and Manhattan, where even the prospect of home ownership is inconceivable to the vast majority of the population.

    There are many others, farther out on the green urbanist track, who believe that the entire notion of middle class upward mobility is too consumption-oriented and, well, sort of in bad taste. They maintain that millennials will not only eschew home ownership but the ownership of automobiles and practically anything else bigger than their beloved electronic gadgets.

    Indeed, this transformation would be greeted with enthusiasm by many greens and traditional urbanists. The environmental magazine Grist even envisions “a hero generation” that will escape the material trap of suburban living and work that engulfed their parents. “We know the financial odds are stacked against us, and instead of trying to beat them, we’d rather give the finger to the whole rigged system,” the millennial author concludes.

    Are Americans Millennials Victims of Circumstance?

    Are young Americans ready to move off the competitive playing field and onto the herbivore pastureland? The economic stagnation certainly seems to have had a negative effect on everything from marriage to fertility rates, which are at their lowest levels in a quarter century. Much like their Japanese counterparts, young Americans increasingly avoid both marriage and having children, according to a recent Pew Foundation study. Despite a total rise in population of 27 million (PDF), there were actually fewer births in 2010 than there were ten years earlier.

    Is this a matter of preference or a reaction to hard times?  Hemmed in by college debt and a persistently weak economy, almost 40 percent of the unemployed are between 20 and 34. A smaller percentage of American males between 25 and 34—the key age for prospective families—are in the workforce than at any time since 1948.

    One reason some celebrate the rejection of marriage and family is that it undermines the suburban environments that overwhelmingly attract most families. Urban theorists such as Peter Katz maintain that millennials (the generation born after 1983) show little interest in “returning to the cul-de-sacs of their teenage years.” Manhattanite Leigh Gallagher, author of the predictable anti-burbs broadside The Death of Suburbs, asserts with certitude that that “millennials hate the suburbs” and prefer more eco-friendly, singleton-dominated urban environments.

    Another apparent casualty here may be entrepreneurship, the very thing that characterized both boomers and their successors, Generation X.  Entrepreneurship rates remain strong among older Americans , but start-up rates among young people look far weaker. Millennials’ experience with the economy makes them, according to generational chroniclers Morley Winograd and Mike Hais, “very risk averse,” particularly in comparison with previous generations.

    Can millennials recreate the “Expansive” culture in their own image?

    Winograd and Hais see millennial timidity as a mostly temporary phenomena. Far from rejecting suburbia, homeownership, and the American dream, millennials are simply seeking to recreate it in their own image. Contrary to the notions promoted by the Wall Street financiers, urban land speculators, and greens, most millennials, particularly those entering their 30s, express a strong desire to own a home, with three times as many eyeing the suburbs as the inner core.

    The recession, according to a recent Wilson Center study (PDF), did not kill the desire to own a home among younger people: more than 90 percent of those under 45 said they wanted to own their own residence.    Another survey by TD Bank found that 84 percent of renters aged 18 to 34 intend to purchase a home in the future. And a Better Homes and Gardenssurvey found that three in four sawhomeownership as “a key indicator of success.”

    Survey data also suggests that millennials are highly focused on getting married and being good parents. Nearly four in five millennials express a desire to have children. This will become more significant as millennials reach their 30s and early 40s, the prime age for family formation. Over the next decade, at least six million people will be entering their 30s, and that number is expected to keep expanding through 2050.

    None of this suggests that, as some social conservatives might hope, that the Ozzie and Harriet family is about to make a major comeback. For one thing, millennials will likely get hitched and have children later than previous generations. Their marriages also will probably be less traditional and male-centered. Hais and Winograd assert that millennials are a “female dominated” generation and have a less traditional view of sex roles—or for that matter, what constitutes a family, since they tend to be highly supportive of same sex marriage.

    But if they differ from past generations, most millennials clearly do not aspire to the ideal of singleness and childlessness embraced by more radical boomer enthusiasts. That said, they will not recreate the family or their residence in their parents’ image. They may, for example, be more willing to customize their residences for their own unique needs or for greater energy efficiency, and place greater emphasis on “technology capabilities” than on a larger kitchen, or some more traditional suburbanaccoutrements.

    As they get on with life, they will also make new demands on their bosses, warn Hais and Winograd. Companies will need to accommodate as well the new familial arrangements that Millennials are likely to seek out. This means firms will need to adopt policies that favor telecommuting, flexible hours, and maternity and paternity leave that will allow for a better balance between work and personal life.

    But in the long run, millennials, if given a chance, are likely to maintain the national ethos of aspiration despite the powerful headwinds they now face. As Turner suggested at the end of his famous essay, it would be “a rash prophet who would assert that the expansive character of American life has now entirely ceased.”

    The real issue here is not the declining validity of American aspiration, but overcoming the economic, political and social factors that threaten to suffocate it. Similar challenges—the concentration of wealth of the Gilded Age, the Great Depression, war, and environmental angst—have periodically appeared and were eventually addressed through technological innovation, and critical political and social changes. Rather than accept the shrinkage of the American prospect, we should seek ways to restore it for those who will inherit this republic.

    This story originally appeared at The Daily Beast.

    Joel Kotkin is executive editor of NewGeography.com and Distinguished Presidential Fellow in Urban Futures at Chapman University, and a member of the editorial board of the Orange County Register. He is author of The City: A Global History and The Next Hundred Million: America in 2050. His most recent study, The Rise of Postfamilialism, has been widely discussed and distributed internationally. He lives in Los Angeles, CA.

  • Long Island’s Flawed Housing Policy is the Real Brain Drain

    Affordable housing is Long Island’s greatest regional failure and the key to our success in the 21st century. Yet, for such an important topic, there is still a fundamental lack of understanding of the problem, and a marked lack of standardization in studying it. We don’t have a regional standard when it comes to affordability, nor do we have an accurate assessment of how many existing units can be considered “affordable.”

    Worse, the approach in which we’re addressing the problem is significantly flawed. This flawed approach is the byproduct of two larger trends in urban planning that I’ve seen on Long Island: shoehorning urban solutions onto suburban problems and allowing stakeholders to dominate the discussion of the issues.

    Recently, I attended a housing design forum hosted by a group that is spearheaded by a development firm that is actively working to “cultivate a spirit of community-driven visioning, entrepreneurship and local investment.”

    In general, I support any initiative that seeks to discuss and address Long Island’s regional issues, and think it’s an important effort. It is critical that the topics of housing, our economy and reversing suburban decline are discussed with the general public. I enjoy attending the events and participating in the discussion. Yet, time and time again, it’s been the same trend – stakeholders, be it developers, environmentalists or so on, all of which have “a dog in the fight” or something to lose or gain, dominate the conversation regarding our regional issues and push to benefit their own agendas.

    We get the policy we deserve

    The group I mentioned earlier has recently a launched a focused campaign to build attainably priced housing. The crux of their proposed solution is the creation of micro-unit apartments across Long Island’s downtown areas. These hypothetical micro-units range in size from 300- to 400-square-foot (roughly three times the size of the average prison cell) unit studios, up to two-bedroom units in the 800- to 900-square-foot range. The theory is that the smaller units, located in a transit-oriented development in the heart of a downtown area, will lead to a more efficient lifestyle. This efficiency will promote sustainable living that is the opposite of suburban waste, reduce energy consumption (because the units are so small) and so on.

    This is all well and good, but when it comes to dollars and cents, the plan makes no sense.

    DLI Pricing

    The hypothetical units, as proposed during a design forum, could rent for between $1,000 and $1,400 for 300- to 400-square foot units up to $2,000 to $2,500 for the 800- to 900-square-foot variants. These rents do not include utilities or cable/internet. To be fair though, the projected rents do not reflect any government subsidies either.

    Regardless, in what world is this considered “affordable?” Um… I mean… workforce. Or is it ”attainable” housing these days?

    Give me a break.

    Granted, these are hypothetical units, but the fact these were presented as a viable option to get excited about in an absolutely serious manner with a straight face, is insulting.

    This is what we get for allowing developers, not planners, economists and others detached from the process, to take the lead when it comes to addressing our regional housing issues. When developers helm the discussion we get proposals such as these.

    A mentor of mine raised a good point when we were discussing the issue. Can the real estate industry play a constructive role in the discussion of housing issues on Long Island? Can the goals of the real estate industry (make as much profit in as short a time frame as possible) harmonize with the goal of planners (to keep land use in balance with the socio-economic needs of residents and the environment)? Often, no; the goals of private industry conflict with the planning ideals.

    One could say, “Well, Mr. Know-it-all, Long Island’s young professionals need different options or they’ll leave. There is a brain drain you know.” The only brain drain I’ve seen is our approach to housing policy.

    If we are losing the young, why not focus on job creation that goes beyond low-wage retail. Stop advocating for mixed-use with integrated retail and create wealth and opportunity that will allow Long Island’s younger generations to stay, be single and eventually start a family. With each Target superstore built, we lose the opportunity to create a strong manufacturing, green or tech base. Land on an island is finite. We must ask ourselves, are we maximizing our open space? Are we creating a business climate that will appeal to startups and entrepreneurs?  What can be done to lower costs, drive up business and allow for a multitude of housing options?

    Enough is Enough

    Drop the buzzwords, drop the flowery language such as “attainable” or “workforce” and let’s actually start to tackle our problem.

    Here is a newsflash: A thousand bucks for a 300-square-foot closet will not fly with millennials raised in homes with bedrooms larger than that. Long Island’s young people are getting priced out of a restricted, stagnant housing market with high costs of living, high property taxes and a distinct lack of affordable housing. They can’t afford nicer living because our job opportunities stink, but don’t insult young islanders with shoe boxes priced astronomically high. If we wanted to live in a tight space, Manhattan is a train ride away.

    We Long Islanders have driven ourselves into a ditch and expect to build our way out of it. Well, you can’t build your way out of a recession. Maybe it’s time to enact a “fair-share” housing policy that requires each and every municipality on Long Island to create a quota of truly affordable development. Perhaps it’s time to stare our property tax problem in the eye, buck up and start looking into consolidation.

    Problems aren’t solved by tip-toeing around the issues and giving us gilded solutions that sit on a shelf and gather dust. The public, especially Long Island’s millennials, deserve better. Why is suburban growth stagnant? It’s because of the stakeholders and their stagnant solutions.

    This piece originally appeared on LIBN’s Young Island.

    Richard Murdocco is a digital marketing analyst for Teachers Federal Credit Union, although the views expressed in this post are Murdocco’s alone and not shared by TFCU. Follow him on Twitter @TheFoggiestIdea, visit thefoggiestidea.org or email him atrich.murdocco@gmail.com.

    Photo by cinderellasg.

  • L.A. Ports Face Challenge from Gulf Coast

    In this strange era of self-congratulation in California, it may be seen as poor manners to point out tectonic shifts that could leave the state and, particularly, Southern California, more economically constrained and ever more dependent on asset bubbles, such as in real estate. One of the most important changes on the horizon is the shift of economic power and influence away from the Pacific Coast to the Gulf Coast – the Third Coast – a process hastened by the imminent widening of the Panama Canal. Over time, this could represent a formidable challenge to our status as a critical global region.

    It is easy to live in Southern California – particularly in the more-affluent, coastal sections or the middle-class inland valleys – and hardly know how critical international trade is to our regional economy. Invisible to denizens of Malibu or Newport Beach, the ports of Long Beach and Los Angeles together account for almost 40 percent of U.S. container imports. Along with Hollywood, and our climate, it represents arguably the region’s greatest asset.

    Overall, the ports are the critical linchpin of the roughly 500,000 jobs tied to logistics, warehousing and trade services. These jobs, notes economist John Husing, provide a wide range of generally higher-paying blue-collar employment compared with, for example, hospitality or retail. This is critical in a region with a large undereducated, but motivated, workforce.

    Southern California’s emergence as the nation’s largest trading center has been unlikely, tied more to ingenuity and ambition than natural geography. Unlike its West Coast rivals – San Diego, Seattle and, most particularly, San Francisco – the Los Angeles region does not boast a great natural harbor. Its construction, starting in the early decades of the previous century, was completely man-made and conceived.

    By the 1980s, sparked by a shift of trade from Europe to Asia, the ports of Los Angeles and Long Beach started to overtake, in merchandise trade value, New York, which had dominated U.S. trade since the first decades of the 19th century. Along with trade came business connections, direct air travel and a surge of Asian immigration. Today, Los Angeles, with roughly 1.5 million Asians, ranks first among America’s counties for Asian population, while Orange County, with more than 530,000 Asian residents, ranks third, just behind the Santa Clara-Silicon Valley region.

    Wider canal coming

    These advantages, human as well as geographic, are critical to the region’s global status. But this could change, in part due to the expansion of the Panama Canal – set for completion in late 2014 or in 2015 – which will open to Asian businesses the opportunity to send megaships directly to the Gulf Coast or the Southeast.

    “Trade will shift,” predicts Khalid Bachkar, a professor at the California Maritime Academy.

    There are other challengers to our supremacy, including port expansions in both Western Canada and Mexico that could offer newer facilities and rail connections directly within their own countries and the vast U.S. market. But the greatest challenge seems likely to come from the Gulf, which offers excellent access to trains that carry goods directly to the vast majority of the United States.

    Demographic trends will also play a role. In the 1970s and 1980s, the Pacific Coast seemed like the premier growth market, but high housing prices, taxes and regulatory restraints – and, most importantly, outmigration – have slowed regional business growth.

    In the next four years, notes Pitney Bowes, Houston is expected to have the largest household growth in the country: some 140,000 people, an increase by 6.7 percent. Most of the other fast-growth regions in the nation – Dallas-Fort Worth, Austin, Texas, Raleigh-Cary, N.C., San Antonio, Jacksonville, Fla., and Charlotte, N.C. – are located either along the Gulf or are natural markets for their ports.

    In contrast, Los Angeles is projected to grow by only 1.5 percent and Orange County by less than 2 percent the next four years.

    Critically, the Gulf is, for the first time, attracting a critical mass of Asians. Over the past decade, Houston has enjoyed some of the nation’s fastest growth in Asian population, up some 70 percent, and its Asian community is now the eighth-largest in the country. Houston’s Asian population is now growing three times as rapidly as that of the San Francisco or Los Angeles areas.

    Energy exports

    At the same time, the expansion of oil and natural gas production in Louisiana, Texas and the Plains makes the Gulf ports major players in the emergence of the U.S. as an energy exporter. The Gulf Coast also is home to many of the nation’s largest industrial investments, including from overseas. The Port of Houston, for example, posted a 28.1 percent jump in foreign trade in 2012, and trade at reached records levels at the Port of New Orleans (I work as a consultant in that city).

    Agriculture has also been on a roll in terms of exports, and 50 percent of the nation’s grain shipments through Louisiana ports. Combined with rising energy and industrial growth, the Third Coast now claims a growing share of U.S. trade. Since 2003, the value of exports from the Gulf ports has more than tripled; the region’s share of U.S. exports over that period grew from roughly 10 to nearly 16 percent.

    Once an industrial backwater, the Gulf region has attracted new steel plants, petrochemical plants and facilities involved in everything from airplanes to food processing. All these locations export such items as cars and chemicals, and all import goods, such as car parts and iron ore. According to Site Selection magazine, the Gulf includes four of the top 12 states – led by No. 1 Texas, No. 7 Louisiana, No. 10 Florida and No. 12 Alabama – in attractiveness to investors. Texas and Louisiana ranked first and third among the states for new plants.

    Standing pat

    Ultimately, this is a challenge that our region cannot afford to ignore, particularly with completion of the Panama Canal expansion in as soon as roughly a year. In anticipation, ports along the Gulf, as well as in the Southeast, are almost all improving and expanding their ports. In contrast, Southern California ports – largely because of labor and environmental concerns – may be slow to make the “intense capital improvements,” such as dredging and new road connections. This largely results from environmental pressures that, notes economist Husing, are not nearly as powerful along the Gulf or in the Southeast. A history of labor disputes by highly paid, politically powerful California port workers also has reinforced the notion that the L.A. area ports are becoming an increasingly unreliable place to do business.

    The Third Coast is also positioned to benefit from commerce with Latin America, the Gulf’s historic leading trade partner. Latin America, notes Bill Gilmer, has been home to many of the world’s fastest-growing economies. Since 2002, about 56 million people in Latin America,according to the World Bank, have risen out of poverty.

    Trade with these partners – including Mexico – are ramping up growth in Houston, as well as other Gulf ports. Brazil, notes Jimmy Lyons, has risen to become a trading partner of Mobile, Ala. Strong Latin immigration to virtually all the Gulf cities, particularly Houston and, increasingly, New Orleans, can only strengthen these economic ties.

    Southern California, with its vast Hispanic population and proximity to Mexico, also should be able to serve as a hub for this trade, but this can only happen if the region attaches greater priority to port development. Historically, this region was built by people taking risks on big infrastructure – covering everything from the water delivery systems to the port and freeways – that literally paved the way to economic progress, and growth.

    The key question now is: Do we still have the spirit and willingness to build, as our competitors are on the Third Coast, the Southeast, Mexico and Canada. If we fail to meet the challenge, Southern California could surrender desperately needed potential sources of new employment and a critical linchpin to our continuing status as one of the world’s great global centers.

    This story originally appeared at the Orange County Register.

    Joel Kotkin is executive editor of NewGeography.com and Distinguished Presidential Fellow in Urban Futures at Chapman University, and a member of the editorial board of the Orange County Register. He is author of The City: A Global History and The Next Hundred Million: America in 2050. His most recent study, The Rise of Postfamilialism, has been widely discussed and distributed internationally. He lives in Los Angeles, CA.

    Port of Los Angeles photo courtesy of NOAA’s National Ocean Service.

  • To Rebuild, the Midwest Must Face Its Real and Severe Problems

    Despite well-publicized problems that earned it the nickname of the “Rust Belt”, on paper the Midwest possesses some formidable strengths. These include the largest concentration of engineers in America, world class educational institutions, a plethora of headquarters of global champions ranging from Proctor and Gamble to Caterpillar to the Chicago Mercantile Exchange, the world’s greatest reserves of fresh water, and an expanding immigrant population.

    Yet with limited exceptions, these have been around for a while, but haven’t produced much growth across the region. Instead, outside of an archipelago of successful outliers (mostly select parts of major metros or college towns), the region has seen its population, job, and income growth badly trail the nation.  During the 2000s US population grew by 9.7%, the Midwest* 3.8%. For jobs, the US lost 1.5% but the Midwest 7.8%.

    Reversing this requires not just leveraging strengths and building on assets, but facing the very real and severe structural challenges that plague the region. However, most of the strategies out there remain outside the region’s essential DNA:

    • Economic clusters like high tech startups or water industries are in effect attempts to build new success enclaves outside the system.
    • Rebuilding downtowns into urban playgrounds for the upscale often takes place against a backdrop of vacant lots, abandoned structures, and depopulation – in other words, empty space.
    • The Rust Belt Chic movement suggests that many of the problems are actually the solution.  But while there are intriguing and important elements to this, it bypasses core issues.

    These are all good as far as they go, but they require little broad-based reform (as opposed to district or enclave based solutions) to structural problems and thus are limited in what they can achieve.

    What are these structural problems? Among the key ones are:

    1. Racism. The modern history of Midwest cities is enmeshed in the history of race relations, particularly between black and white. Places like Chicago and Milwaukee remain among the absolutely most segregated in America. Race riots have been defining feature of cities ranging from Detroit to Cincinnati (which had a race-influenced riot as recently as 2001). In all of these places, a large population of black residents live in segregated neighborhoods plagued with problems ranging from poor schools to low quality housing to a lack of jobs.  Significant social distress has resulted. 

    There are signs the Great Migration that brought blacks north in search of factory work is reversing, with black residents actually seeing more welcoming environments and better economic opportunities in Southern metro areas like Atlanta, Houston, and Charlotte. As well, historically it’s been the more ambitious who leave, not such a good thing for the people and places left behind.

    2. Corruption.  Midwest cities ranging from Chicago to Detroit to Cleveland are famous as cesspools of corruption and cronyism. Systems like Chicago’s “aldermanic privilege” tradition that gives city council members almost dictatorial control over their districts produce environments of almost required tacit corruption even if no laws are violated. In other cities, it’s well known that your approvals will go much faster if you hire the right wired-up subcontractors, lawyers, or lobbyists. While this type of environment exists at some level everywhere, it’s very bad in many Midwest cities and badly degrades an already challenged business climate.

    3. Closed Societies. Contrary to the assertions of Robert Putnam and Bowling Alone, a lot of Midwest places suffer from an excess of social capital. As Sean Safford noted in Why the Garden Club Couldn’t Save Youngstown, excessively dense social networks can create a hermetically sealed environment into which new ideas can’t penetrate or get a hearing.  There are many reports of newcomers to Midwest cities saying that they have difficult making friends and penetrating the social networks in places as diverse as Minneapolis and Cleveland. In Cincinnati and St. Louis expect that the first question you’ll be asked is “Where did you go to high school?” which tells you everything you need to know about those cities.  Immigration has ticked up in recent years, but overall the Midwest has done a poor job of attracting outsiders.

    4. Two-Tier Environment and Resulting Paralysis.  Despite the plethora of high end companies, educated workers, and top quality universities, the Midwest economy was traditionally based on moderately skilled labor in agriculture and industry. This forged a work force that places too low value on education and which can even be suspicious of people with too much of it. Today’s agriculture and manufacturing concerns, at least the ones with jobs that pay more than subsistence wages, require much higher levels of skills and education than in the past. What’s more, with the global macro-economy favorable to larger cities and talent based industries, larger metros have comparatively done well while most smaller towns have struggled. As a result, their quality of life and services have so badly degraded they are no longer attractive to “discretionary residents” (those with the means and opportunity to leave), which perpetuates a downward spiral as the educated flock to bigger cities. That’s why manufacturers complain they can’t find workers with skills, even if those skills are just passing and drug test and showing up to work everyday. This produces massive inequities, resentment, and policy confusion. What’s more, realistically many very poorly performing communities may never recover.

    Beyond these core issues, many places have aging infrastructure, massive blight issues, a regulatory environment not suited to the 21st century, and severe fiscal problems. All of these are extremely difficult problems to resolve, but that does not mean they don’t need to be faced, and overcome.

    Unsurprisingly, the Midwest has not been a particularly competitive region.  There will continue to be bright spots ranging Des Moines to Madison to the greater Chicago Loop to the fracking fields of western Pennsylvania, but until the region faces up to its problems don’t expect a major turnaround anytime soon.

    Aaron M. Renn is an independent writer on urban affairs and the founder of Telestrian, a data analysis and mapping tool. He writes at The Urbanophile.

  • Underemployment in America

    The nation’s lackluster economic performance continues to be a concern. This is evident in stubbornly high unemployment rates (See: Suburban and Urban Core Poverty: 2012 Special Report),which continue to be well above historic norms. There is another indicator, which may be even more important – underemployment. This figure, 80 percent above the unemployment rate, can be used as a measure of the “output gap,” which a Congressional Research Service (CRS) report refers to as “the rate of actual output (economic) growth compared with the rate of potential output growth.” CRS continues: “Potential output is a measure of the economy’s capacity to produce goods and services when resources (e.g., labor) are fully utilized” (Note 1).

    Both rates are reported by the Department of Labor, Bureau of Labor Statistics (BLS). The national underemployment rate (BLS “U-6” labor underutilization measure) is far higher than the unemployment rate (BLS “U-3” labor underutilization measure). The 2012 underemployment rate was 14.7 percent, compared to the unemployment rate of 8.1 percent. The total unemployed population was 12.5 million in 2012, while the total underemployed population was 23.1 million.

    The difference between underemployment and unemployment comes by adding two groups: marginally attached workers and workers on part-time schedules for economic reasons. According to BLS, marginally attached workers are not counted as unemployed because they have not looked for work within the last four weeks, but they have sought work within the last year and are available for employment. Marginally attached workers include “discouraged” workers, who are not looking for work “because they believe there are no jobs available or there are none for which they would qualify.” In 2012, there were approximately 2.5 million marginally attached workers, including 900,000 “discouraged” workers.

    However, there was a much larger number of involuntary part time workers, at 8.1 million in 2012. This is nearly two-thirds of the 12.5 million workers unemployed in 2012.

    The number of underemployed may be higher. Gallup estimated the nation’s underemployment rate at 17.4 percent in August, well above the BLS August figure of 14.7 percent. The Gallup estimate would place underemployed workers at more than 27 million. This is approximately equal to all of the combined employment in the first and second largest states, California and Texas, as well as Colorado (Figure 1).

    Indeed, the number of underemployed could be higher yet. Economists Richard Vedder, Christopher Denhart, and Jonathan Robe at the Center for College Affordability and Productivity have estimated that 48 percent of employed college graduates hold jobs that do not require college degrees, using BLS data. None of these, as long as they are full time employees, would be included in the underemployment figures.

    Underemployment by State

    In addition to its monthly national estimates, BLS provides quarterly, year-on-year estimates by state, but only for Los Angeles County and New York City below the state level. Data is shown for 2006, the year of the best underemployment rate in the last decade, 2010, with the worst underemployment rate and the most recent year for which data is available, ending June 30, 2013 (Table).

    Underemployment Rates 
    by State, Los Angeles County & New York City
      2006 2010 2013q2* Rank
    United States 8.2% 16.7% 14.3%  
    Alabama 7.3% 17.3% 13.0% 22
    Alaska 11.8% 14.3% 12.4% 16
    Arizona 7.6% 18.4% 15.7% 42
    Arkansas 9.1% 14.5% 13.6% 25
    California 9.1% 22.1% 18.3% 50
    Colorado 7.9% 15.4% 13.8% 28
    Connecticut 7.8% 15.7% 14.6% 37
    Delaware 6.4% 14.3% 14.1% 30
    District of Columbia 9.8% 14.0% 14.1% 30
    Florida 6.2% 19.3% 15.1% 39
    Georgia 8.1% 17.9% 15.6% 40
    Hawaii 6.2% 16.9% 11.4% 12
    Idaho 6.9% 16.3% 13.6% 25
    Illinois 8.1% 17.5% 16.1% 47
    Indiana 8.1% 17.4% 14.5% 36
    Iowa 6.7% 11.6% 9.5% 5
    Kansas 7.4% 12.4% 10.9% 9
    Kentucky 9.3% 16.4% 14.3% 34
    Louisiana 8.1% 12.9% 12.5% 18
    Maine 8.2% 15.2% 14.2% 32
    Maryland 6.5% 13.0% 12.0% 15
    Massachusetts 8.2% 14.3% 13.3% 23
    Michigan 12.2% 21.0% 16.1% 47
    Minnesota 7.9% 13.8% 11.2% 11
    Mississippi 10.2% 17.6% 15.8% 45
    Missouri 8.0% 15.8% 12.4% 16
    Montana 6.9% 14.9% 12.7% 20
    Nebraska 6.1% 8.6% 8.7% 3
    Nevada 6.8% 23.6% 19.0% 51
    New Hampshire 6.1% 11.8% 11.1% 10
    New Jersey 7.8% 15.7% 15.7% 42
    New Mexico 7.5% 15.6% 13.7% 27
    New York 7.7% 14.8% 14.2% 32
    North Carolina 8.6% 17.4% 15.6% 40
    North Dakota 6.2% 7.4% 6.2% 1
    Ohio 9.7% 16.9% 13.5% 24
    Oklahoma 7.3% 11.4% 10.0% 6
    Oregon 10.4% 20.0% 16.9% 49
    Pennsylvania 8.0% 14.7% 13.8% 28
    Rhode Island 8.9% 19.2% 15.9% 46
    South Carolina 10.8% 18.1% 15.0% 38
    South Dakota 6.2% 9.7% 7.8% 2
    Tennessee 8.7% 16.6% 14.3% 34
    Texas 8.6% 14.4% 11.6% 13
    Utah 5.8% 15.1% 10.5% 7
    Vermont 6.4% 12.5% 10.5% 7
    Virginia 6.0% 12.9% 11.6% 13
    Washington 9.4% 18.4% 15.7% 42
    West Virginia 8.8% 14.0% 12.5% 18
    Wisconsin 8.1% 14.8% 12.9% 21
    Wyoming 5.8% 11.5% 9.0% 4
    Los Angeles County 9.1% 24.3% 20.5%
    New York City 8.7% 15.6% 15.1%
    Source: Bureau of Labor Statistics
    *2013q3: Year ended June 30, 2013


    Worst Performing States

    Underemployment in the states is highest in some Western and Midwestern states. For the 12 months ended June 30, Nevada had the highest underemployment rate, at 20.3 percent. California was second, at 19.3 percent, while Oregon had the third highest underemployment rate, at 16.9 percent. Michigan and Illinois were tied for fourth highest, at 16.1 percent (Figure 2).

    Over the past decade (2003 through 2012), four of these states were among the five with the highest underemployment rates. Michigan, hard hit by manufacturing losses, had the highest average underemployment rate (15.6 percent), followed by California and Oregon (both at 14.8 percent), South Carolina (13.8 percent) and Nevada (13.7 percent). For the most part, underemployment has become intractable in these states. Only Nevada, with its precipitous decline from the housing crisis ranked better than 40th worst in underemployment in any year between 2003 and 2012 (Figure 3).

    Best Performing States

    The best underemployment rates were literally concentrated in five adjacent states with strong energy sector states, principally in the Great Plains. North Dakota led the nation for the year ended June 30, 2013, with an underemployment rate of 6.2 percent, less than one-half the national rate (14.7 percent) and less than one-third the rates of Nevada and California. North Dakota’s neighbor to the south, South Dakota had the second best rate, at 7.8 percent, while   Nebraska ranked third at 8.7 percent. On Nebraska’s western border, Wyoming, the only non-Plains state in the top five, ranked fourth with an underemployment rate of 9.0 percent. Nebraska’s eastern neighbor, Iowa, ranked fifth, at 9.5 percent (Figure 4).

    As with the states with the worst underemployment rates over the last decade, those with the lowest  current figure also did best from 2003 and 2012. North Dakota is again number one, with an underemployment rate of 6.7 percent. Nebraska (7.5 percent), South Dakota (7.7 percent) and Wyoming (8.2 percent) follow, with New Hampshire ranking fifth best, at 8.8 percent (Figure 5).

    Underemployment in New York City and Los Angeles County

    For the year ended June 30, 2013, the city of New York had an underemployment rate of 15.1 percent, somewhat above the national rate of 14.3 percent. Over the past decade, the state of New York’s underemployment rate has been lower than that of the city in every year.  

    Los Angeles County is the largest county in the United States and if it were a state would rank eighth in population, between Ohio and Georgia. Further, it Los Angeles County were a state, it would have had the worst underemployment rate in every year from the 2008 to the present. For the year ended June 30 2013, Los Angeles County had an underemployment rate of 20.8 percent, nearly 1/2 higher than the national underemployment rate 14.7 percent and above the highest state rate of 20.3 percent in Nevada.

    Closing the Productivity Gap

    The productivity gap that results from underemployment constrains the US economy at a time of unusually severe financial challenges. College graduates face not only a grim employment market, but have student loan repayments that require good jobs. The nation continues to spend more than it collects in taxes. The inability of state and local governments to fund their government employee pension programs could lead, in the worst case, to much higher taxes or severe service cutbacks.

    Yet things could get worse. The soon to be implemented “Patient Protection and Affordable Care Act” (“Obamacare”) has a built-in incentives for employers to shift workers to part time status (weekly schedule of fewer than 30 hours of work per week). The law exempts them from providing health insurance for employees who work part time and so some establishments are shifting full time employees to part time status. Others establishments may substitute hiring part time employees instead of full time to reduce their expenses. This incentive is not just being executed by private companies seeking to maintain profitability. It extends to state and local government agencies, which unlike the federal government, must balance their books each year. According to a running of enterprises announcing shifts to part-time by Investors Business Daily, more than 75 percent are government agencies.

    All of this points to two important policy implications. The first is the necessity of focusing on the underemployment measure, the improvement of which is so crucial to maintaining and improving the standard of living and reducing poverty (by reducing the productivity gap). The second is that, with such a focus, policy makers from Washington to Sacramento, Lansing, and Carson City must pursue policies that encourage investment and employment.

    Wendell Cox is a Visiting Professor, Conservatoire National des Arts et Metiers, Paris and the author of “War on the Dream: How Anti-Sprawl Policy Threatens the Quality of Life.

    Note 1: A detailed comparison of the unemployment (U-3) and underemployment (U-6) rates is provided by economist Ed Dolan. A useful chart comparing the two indicators, with numbers from June 2012 will be found on qz.com.

    Note 2: Vedder, Denhart and Robe also suggest the possibility of “over-investment,” as more students may have been encouraged to higher education levels than there are likely to be correspondingly appropriate jobs. The extent of such over-investment is not known.

    Unemployed woman photo by BigStockPhoto.com.

  • Fixing California: The Green Gentry’s Class Warfare

    Historically, progressives were seen as partisans for the people, eager to help the working and middle classes achieve upward mobility even at expense of the ultrarich. But in California, and much of the country, progressivism has morphed into a political movement that, more often than not, effectively squelches the aspirations of the majority, in large part to serve the interests of the wealthiest.

    Primarily, this modern-day program of class warfare is carried out under the banner of green politics. The environmental movement has always been primarily dominated by the wealthy, and overwhelmingly white, donors and activists. But in the past, early progressives focused on such useful things as public parks and open space that enhance the lives of the middle and working classes. Today, green politics seem to be focused primarily on making life worse for these same people.

    In this sense, today’s green progressives, notes historian Fred Siegel, are most akin to late 19th century Tory radicals such as William Wordsworth, William Morris and John Ruskin, who objected to the ecological devastation of modern capitalism, and sought to preserve the glories of the British countryside. In the process, they also opposed the “leveling” effects of a market economy that sometimes allowed the less-educated, less well-bred to supplant the old aristocracies with their supposedly more enlightened tastes.

    The green gentry today often refer not to sentiment but science — notably climate change — to advance their agenda. But their effect on the lower orders is much the same. Particularly damaging are steps to impose mandates for renewable energy that have made electricity prices in California among the highest in the nation and others that make building the single-family housing preferred by most Californians either impossible or, anywhere remotely close to the coast, absurdly expensive.

    The gentry, of course, care little about artificially inflated housing prices in large part because they already own theirs — often the very large type they wish to curtail. But the story is less sanguine for minorities and the poor, who now must compete for space with middle-class families traditionally able to buy homes. Renters are particularly hard hit; according to one recent study, 39 percent of working households in the Los Angeles metropolitan area spend more than half their income on housing, as do 35 percent in the San Francisco metro area — well above the national rate of 24 percent.

    Similarly, high energy prices may not be much of a problem for the affluent gentry most heavily concentrated along the coast, where a temperate climate reduces the need for air-conditioning. In contrast, most working- and middle-class Californians who live further inland, where summers can often be extremely hot, and often dread their monthly energy bills.

    The gentry are also spared the consequences of policies that hit activities — manufacturing, logistics, agriculture, oil and gas — most directly impacted by higher energy prices. People with inherited money or Stanford degrees have not suffered much because since 2001 the state has created roughly half the number of mid-skilled jobs — those that generally require two years of training after high-school — as quickly as the national average and one-tenth as fast as similar jobs in archrival Texas.

    In the past, greens and industry battled over such matters, which led often to reasonable compromises preserving our valuable natural resources while allowing for broad-based economic expansion. During good economic times, the regulatory vise tended to tighten, as people worried more about the quality of their environment and less about jobs. But when things got tough — as in the early 1990s — efforts were made to loosen up in order to produce desperately needed economic growth.

    But in today’s gentry-dominated era, traditional industries are increasingly outspent and out maneuvered by the gentry and their allies. Even amid tough times in much of the state since the 2007 recession — we are still down nearly a half-million jobs — the gentry, and their allies, have been able to tighten regulations. Attempts even by Gov. Jerry Brown to reform the California Environmental Quality Act have floundered due in part to fierce gentry and green opposition.

    The green gentry’s power has been enhanced by changes in the state’s legendary tech sector. Traditional tech firms — manufacturers such as Intel and Hewlett-Packard — shared common concerns about infrastructure and energy costs with other industries. But today tech manufacturing has shrunk, and much of the action in the tech world has shifted away from building things, dependent on energy, to software-dominated social media, whose primary profits increasingly stem from selling off the private information of users. Servers critical to these operations — the one potential energy drain — can easily be placed in Utah, Oregon or Washington where energy costs are far lower.

    Even more critical, billionaires such as Google’s Eric Schmidt, hedge fund manager Thomas Steyer and venture firms like Kleiner Perkins have developed an economic stake in “green” energy policies. These interests have sought out cozy deals on renewable energy ventures dependent on regulations mandating their use and guaranteeing their prices.

    Most of these gentry no doubt think what they are doing is noble. Few concern themselves with the impact these policies have on more traditional industries, and the large numbers of working- and middle-class people dependent on them. Like their Tory predecessors, they are blithely unconcerned about the role these policies are playing in accelerating California’s devolution into an ever more feudal society, divided between the ultrarich and a rapidly shrinking middle class.

    Ironically, the biggest losers in this shift are the very ethnic minorities who also constitute a reliable voter block for Democratic greens. Even amid the current Silicon Valley boom, incomes for local Hispanics and African-Americans, who together account for one-third of the population, have actually declined — 18 percent for blacks and 5 percent for Latinos between 2009 and 2011, prompting one local booster to admit that “Silicon Valley is two valleys. There is a valley of haves, and a valley of have-nots.”

    Sadly, the opposition to these policies is very weak. The California Chamber of Commerce is a fading force and the state Republican Party has degenerated into a political rump. Business Democrats, tied to the traditional industrial and agricultural base, have become nearly extinct, as the social media oligarchs and other parts of the green gentry, along with the public employee lobby, increasingly dominate the party of the people. Some recent efforts to tighten the regulatory knot in Sacramento have been resisted, helped by the governor and assisted by the GOP, but the basic rule-making structure remains, and the government apparat remains highly committed to an ever more expansive planning regime.

    Due to the rise of the green gentry, California is becoming divided between a largely white and Asian affluent coast, and a rapidly proletarianized, heavily Hispanic and African-American interior. Palo Alto and Malibu may thrive under the current green regime, and feel good about themselves in the process, but south Los Angeles, Oakland, Fresno and the Inland Empire are threatened with becoming vast favelas.

    This may constitute an ideal green future — with lower emissions, population growth and family formation — for whose wealth and privilege allow them to place a bigger priority on nature than humanity. But it also means the effective end of the California dream that brought multitudes to our state, but who now may have to choose between permanent serfdom or leaving for less ideal, but more promising, pastures.

    Joel Kotkin is executive editor of NewGeography.com and Distinguished Presidential Fellow in Urban Futures at Chapman University, and a member of the editorial board of the Orange County Register. He is author of The City: A Global History and The Next Hundred Million: America in 2050. His most recent study, The Rise of Postfamilialism, has been widely discussed and distributed internationally. He lives in Los Angeles, CA.

    This piece originally appeared at U-T San Diego.


  • The Cities Creating The Most Middle-Class Jobs

    Perhaps nothing is as critical to America’s future as the trajectory of the middle class and improving the prospects for upward mobility. With middle-class incomes stagnant or falling, we need to find a way to generate jobs for Americans who, though eager to work and willing to be trained, lack the credentials required to enter many of the most lucrative professions.

    Mid-skilled jobs in areas such as manufacturing, construction and office administration — a category that pays between $14 and $21 an hour — can provide a decent standard of living, particularly if one has a spouse who also works, and even more so if a family lives in a relatively low-cost area. But mid-skilled employment is in secular decline, falling from 25% of the workforce in 1985 to barely 15% today. This is one reason why middle- and working-class incomes remain stagnant, well below pre-recession levels.

    Over the past three years, high-wage professions have accounted for 29% of new jobs created, while the lowest-paid jobs (under $13 an hour) have grown to encompass roughly half of all new jobs. Net worth-wise, as a recent Pew study notes, the wealthy — the top 7% — are thriving due to the rebound of the stock and bond markets; the bottom 93%, whose wealth is more tied up in their homes,  is still feeling the hangover from the cratering of housing prices in the recession.

    No surprise then that about a third of all Americans now consider themselves lower class, according to another Pew study, up from a quarter before the recession.

    But middle-income employment has not vanished everywhere.  An analysis of the distribution of new jobs since 2010 by Economic Modeling Specialists, Inc. found a wide disparity among the states. Between 34% and 45% of all new jobs have been mid-wage in Wyoming, Iowa, North Dakota, Michigan and Arizona. The worst performers: Mississippi where only 10% of new jobs have been middle-income, followed by New York, New Hampshire, New Jersey and Virginia, all with 14% or less. (Note: I use the terms “mid-skill” and “middle-income” interchangeably; recent research suggests pay is a reasonable proxy for skill.)

    Generally speaking mid-skilled employment is expanding the most in states with strong overall job growth, and less in high-cost, high-tax states, with the notable exception of Mississippi. The EMSI data also suggest that states with expanding heavy industries such as oil and manufacturing generate more positions for mid-level workers such as machinists, truck drivers, welders and oil roustabouts. At the same time, the states with a bifurcated combination of low-wage industries, like hospitality or retail, and high-paid professions, like software engineers or investment bankers, tend to have fewer opportunities for middle-income workers.

    This pattern becomes clearer if we look at metropolitan areas, the level at which most economic activity takes place. Mark Schill at the Praxis Strategy Group crunched the data for us on employment trends over the five years since the recession in the 51 metropolitan statistical areas with over 1 million people. It’s not a pretty picture. Three years since employment hit bottom, the U.S. still has 2 million fewer mid-income jobs than at the onset of the financial crisis in 2007; half of that deficit is in the largest metro areas.

    But the pain is not evenly distributed. There are eight metro areas that boast more mid-level jobs today than in 2007. The list is dominated by Texas cities, led by Austin-Round Rock-San Marcos, which has added 17,000 mid-skill jobs — an increase of 7.6%  – among the 95,000 new jobs generated in the region. The largest numeric increase is in Houston-Sugarland-Baytown, which has 60,810 more mid-skilled jobs, up 7.4%. The Houston metro area also has easily led the nation in overall job growth since 2007, adding a net 280,000 positions.

    Texas metro areas also come in third and fourth: in San Antonio-New Braunfels, middle-income employment rose 3.4%; in Dallas-Ft. Worth-Arlington , 3.1%. Nearby Oklahoma City comes in fifth with 2.1% growth in middle-income employment, sharing the merits of relatively low costs and a strong energy economy.

    The working class and  the endangered middle class may be favored topics of discussion in the deepest blue regions, but for the most part these metro areas have failed to bolster their middle-skilled labor forces. Los Angeles-Long Beach leads the league with the biggest net loss of mid-skilled jobs since 2007, down by 112,300, or 6.1%. Chicago had the second-largest numerical decline, some 102,100, or 7.6%, followed by New York, which lost 82,350 such jobs, 3.4% of its total in 2007. In contrast, notes economist Tyler Cowen, Texas has not only created the most middle-income jobs, but a remarkableone-third of all net high-wage jobs created over the past decade.

    The loss of manufacturing jobs is clearly part of the problem here; despite the recent resurgence in the industrial sector, the U.S. still has 740,000 fewer middle-skill manufacturing jobs than in 2007. Chicago and Los Angeles remain the nation’s largest industrial regions, but they are also among the most rapidly de-industrializing areas in the country. New York City, once among the world’s leading industrial centers, with roughly a million manufacturing workers in 1950, is down to around 75,000. In contrast, industrial employment has been expanding in the Houston, Seattle and Oklahoma City metro areas, and recently even Detroit.

    In contrast, New York, Chicago and L.A. have seen job gains in such low-wage areas as hospitality and retail, as well as a smaller surge in high-end employment — notably in information and business services. But the welcome growth in these positions is not enough to make up for the big hole in middle-class employment. Since the recession, for example, New York has lost manufacturing and construction jobs at a double-digit rate while hospitality employment grew 18% and retail 10%. Los Angeles and Chicago showed similar patterns, but actually did worse in higher-wage sectors, like professional business services.

    Another major area of lost middle-class jobs has been construction. The U.S. is still down 1.2 million middle-skill construction jobs since 2007 and 125,000 in real estate. These losses have inflicted the most pain in the boom towns that grew fastest in the early 2000s. The biggest loser of mid-skill jobs in percentage terms is Las Vegas-Paradise, Nev., which has suffered a staggering 16.1% loss in such jobs since 2007. It’s followed by Riverside-San Bernardino-Ontario, Calif. (-10.6%); Sacramento-Arden-Arcade-Roseville, Calif., (-10.4%); Tampa- St. Petersburg- Clearwater, Fla. (-9.7%); and Phoenix-Mesa- Scottsdale, Ariz. (-9.3%).

    Whether in the biggest cities, or Sun Belt boom towns, the issue of increasing middle-income employment should be as much of a priority for policymakers as attracting glamorous high-wage jobs or helping the poor. America’s identity has been built around the idea that hard work, particularly with some study for a particular skill, should be rewarded with decent pay. Boosting employment in mid-skill professions, from construction and manufacturing to logistics and energy, is critical to achieving this goal.

    If we fail to stem the erosion of middle-income jobs, we will be faced with a continued descent into a Latin American style society divided largely between an affluent elite and multitudes of the poor, with a thin layer in the middle. This promises miserable consequences for most Americans and the future of our democracy.

    Note: An early version of this table listed incorrect figures in the 2013 total jobs column.

    Middle-skill Employment in U.S. Metropolitan Areas
    Metropolitan Statistical Area Name 2013 Middle Skill Jobs 2007-2013 Change % Change % Change Rank 2013 Location Quotient 2013 LQ Rank
    Austin-Round Rock-San Marcos, TX 248,988 17,485 7.6% 1 0.93 41
    Houston-Sugar Land-Baytown, TX 878,038 60,810 7.4% 2 1.00 17
    San Antonio-New Braunfels, TX 310,920 10,316 3.4% 3 1.07 3
    Dallas-Fort Worth-Arlington, TX 959,326 29,178 3.1% 4 0.98 23
    Oklahoma City, OK 198,944 4,113 2.1% 5 1.05 8
    New Orleans-Metairie-Kenner, LA 177,207 2,676 1.5% 6 1.05 8
    Nashville-Davidson–Murfreesboro–Franklin, TN 263,022 2,309 0.9% 7 1.02 12
    Salt Lake City, UT 221,892 476 0.2% 8 1.07 3
    Denver-Aurora-Broomfield, CO 390,661  (2,824) -0.7% 9 0.96 31
    Indianapolis-Carmel, IN 274,996  (3,143) -1.1% 10 0.98 23
    Boston-Cambridge-Quincy, MA-NH 700,371  (9,683) -1.4% 11 0.90 46
    San Jose-Sunnyvale-Santa Clara, CA 233,796  (5,012) -2.1% 12 0.78 51
    Louisville/Jefferson County, KY-IN 199,292  (4,669) -2.3% 13 1.04 10
    Charlotte-Gastonia-Rock Hill, NC-SC 267,840  (6,888) -2.5% 14 0.98 23
    Pittsburgh, PA 358,823  (9,301) -2.5% 15 1.03 11
    Rochester, NY 147,269  (4,325) -2.9% 16 0.97 28
    Raleigh-Cary, NC 153,838  (4,854) -3.1% 17 0.93 41
    Baltimore-Towson, MD 391,208  (12,532) -3.1% 18 0.95 34
    Washington-Arlington-Alexandria, DC-VA-MD-WV 764,805  (25,078) -3.2% 19 0.80 50
    San Diego-Carlsbad-San Marcos, CA 492,724  (16,382) -3.2% 20 1.09 2
    New York-Northern New Jersey-Long Island, NY-NJ-PA 2,336,777  (82,350) -3.4% 21 0.88 48
    Columbus, OH 272,821  (9,829) -3.5% 22 0.95 34
    Buffalo-Niagara Falls, NY 159,658  (5,770) -3.5% 23 0.99 20
    Richmond, VA 193,104  (7,081) -3.5% 24 1.00 17
    San Francisco-Oakland-Fremont, CA 583,934  (21,618) -3.6% 25 0.87 49
    Seattle-Tacoma-Bellevue, WA 543,988  (21,651) -3.8% 26 0.97 28
    Minneapolis-St. Paul-Bloomington, MN-WI 507,261  (20,643) -3.9% 27 0.91 45
    Portland-Vancouver-Hillsboro, OR-WA 337,705  (19,386) -5.4% 28 1.02 12
    Hartford-West Hartford-East Hartford, CT 179,653  (10,578) -5.6% 29 0.95 34
    Philadelphia-Camden-Wilmington, PA-NJ-DE-MD 789,395  (49,105) -5.9% 30 0.95 34
    Atlanta-Sandy Springs-Marietta, GA 692,336  (44,530) -6.0% 31 0.95 34
    Los Angeles-Long Beach-Santa Ana, CA 1,731,419  (112,332) -6.1% 32 0.96 31
    St. Louis, MO-IL 393,900  (27,502) -6.5% 33 0.98 23
    Kansas City, MO-KS 302,025  (21,222) -6.6% 34 0.98 23
    Memphis, TN-MS-AR 192,693  (14,600) -7.0% 35 1.02 12
    Detroit-Warren-Livonia, MI 517,098  (39,268) -7.1% 36 0.93 41
    Orlando-Kissimmee-Sanford, FL 304,724  (23,533) -7.2% 37 0.95 34
    Cincinnati-Middletown, OH-KY-IN 302,932  (24,111) -7.4% 38 1.00 17
    Chicago-Joliet-Naperville, IL-IN-WI 1,249,263  (102,122) -7.6% 39 0.94 40
    Jacksonville, FL 200,324  (16,482) -7.6% 40 1.06 6
    Virginia Beach-Norfolk-Newport News, VA-NC 298,352  (25,147) -7.8% 41 1.19 1
    Miami-Fort Lauderdale-Pompano Beach, FL 706,788  (60,373) -7.9% 42 0.97 28
    Milwaukee-Waukesha-West Allis, WI 237,871  (20,489) -7.9% 43 0.96 31
    Cleveland-Elyria-Mentor, OH 304,167  (27,158) -8.2% 44 0.99 20
    Birmingham-Hoover, AL 162,440  (15,437) -8.7% 45 1.07 3
    Providence-New Bedford-Fall River, RI-MA 206,473  (20,670) -9.1% 46 0.99 20
    Phoenix-Mesa-Glendale, AZ 578,767  (59,101) -9.3% 47 1.02 12
    Tampa-St. Petersburg-Clearwater, FL 365,043  (39,371) -9.7% 48 1.02 12
    Sacramento–Arden-Arcade–Roseville, CA 259,792  (30,200) -10.4% 49 0.92 44
    Riverside-San Bernardino-Ontario, CA 431,892  (51,373) -10.6% 50 1.06 6
    Las Vegas-Paradise, NV 234,340  (44,849) -16.1% 51 0.89 47
    Total 23,210,895  (1,045,210) -4.3%      
    Source: EMSI Class of Worker – QCEW Employees + Non-QCEW Employees + Self-Employed
    Analysis by Mark Schill, Praxis Strategy Group

    This story originally appeared at Forbes.

    Joel Kotkin is executive editor of NewGeography.com and Distinguished Presidential Fellow in Urban Futures at Chapman University, and a member of the editorial board of the Orange County Register. He is author of The City: A Global History and The Next Hundred Million: America in 2050. His most recent study, The Rise of Postfamilialism, has been widely discussed and distributed internationally. He lives in Los Angeles, CA.