Tag: middle class

  • High Cost of Living Leaves Some States Uncompetitive

    Late this spring, when voters in California emphatically rejected tax increases to close the state budget gap, they sent a clear message to state policymakers. They were tired of California’s high taxes, which according to the non-partisan Tax Foundation, consumed 10.5 percent of state per capita income last year. This compared with a national average of 9.7 percent, making California the sixth most heavily taxed state in the nation.

    But if Californians were tired of paying an additional 0.8 percent of their income in state and local taxes, what would they make of research by economists at the federal Bureau of Economic Analysis that estimated that the cost of living in California, based on 2006 data, was a whopping 29.1 percent above the national average? Obviously, from an economic point of view, the state’s high cost of living has a much greater impact on the average person’s standard of living than taxes do.

    Cost of living is not an issue that we typically think about, when it comes to voting and politics. That needs to change. Cost of living estimates provide a valuable tool for making accurate comparisons of economic performance. Moreover, they provide the best available, if indirect, measure of the costs imposed by regulation. And with Congress debating potentially dramatic changes in how we regulate energy and health care, costs of this kind clearly deserve close scrutiny.

    Let’s begin with economic performance, starting with California. According to 2006 census estimates from the American Community Survey, the median household income in California was $56,645. In terms of ranking, that made California the sixth most prosperous state in the nation. But how did California fare, once the cost of living was taken into account? The answer is not very well. The economists who published the 2006 data, Bettina Aten and Roger D’Souza, did not deflate income data by the full 29.1 percent when calculating the real effect of cost of living. Rather, they exempted certain components of income, such as government transfer payments. Using this attenuated calculation, real median household income in California in 2006 was $47,988. In terms of ranking, that dropped California down to 31st place. (Were the data deflated by the full 29.1 percent, the state would have fallen all the way to 48th place.)

    California is not the only state afflicted with an exorbitant cost of living. Bluer than blue New York State, according to the Aten and D’Souza data, had an even higher cost of living, estimated at 31.8 percent above the national average. And not surprisingly, it fared particularly badly, once the cost of living was taken into account. Again using an attenuated calculation, the median household income in New York dropped from $51,384 in nominal dollars down to $42,744 in cost of living adjusted dollars. In terms of rankings, this dropped New York from 17th place down to 49th place. (Were the data deflated by the full 31.8 percent, the state would have fallen to last place, almost 10 percent lower than the next poorest state, Mississippi.)

    What cost of living estimates taketh away from some, however, they also giveth to others. Consider, for example, Utah and Minnesota. In the case of Utah, median household income in 2006 stood at $51,309 in nominal terms. But according to the Aten and D’Souza estimates, the cost of living in Utah was 13.5 percent below the national average. Using the attenuated calculation, cost of living adjusted income in Utah was $57,147, the second highest in the nation.

    In the case of Minnesota, median household income in 2006 stood at $54,023 in nominal terms. But according to the Aten and D’Souza estimates, the cost of living was 7.4 percent below the national average. The attenuated calculation put the Minnesota a cost of living adjusted income at $57,140, third highest in the nation.

    As a general rule, the states with the lowest cost of living are states in the South and to a lesser degree the Mountain West. Among the states of the Old South, only Virginia had a cost of living above the national average. Dynamic states like North Carolina had a cost of living 13.1 percent below the national average. In Georgia, the figure was 12.1 percent. In the Mountain West, Idaho had a cost of living 17.3 percent below the national average. In New Mexico, the figure was 16.5 percent.


    Besides affecting the true measure of economic performance, cost of living differentials have other, important implications as well. Federal taxes are one example. Consider New York. For years, it has been recognized that New York State sends more in taxes to Washington, D.C. than it receives back in the form of federal outlays. Recently, there has been some disagreement about the size of this deficit, but in the past it was generally agreed that it amounted to approximately two percent of Gross State Product. If New Yorkers were truly rich, this would not be a great burden. But as shown already, that is not the case. By failing to control its cost of living, New York ends up subsidizing other states that in real terms are doing much better.

    Another implication of cost of living differentials has to do with population. All things being equal, people will live where they can maximize their standard of living. Not surprisingly, states that have seen the largest population growth in recent decades tend to be those with a low cost of living, notably in the South and in the Mountain West. On the other hand, states with a high cost of living have typically seen population growth lag. This is particularly true among certain Northeastern states that should have boomed, if nominal income were the best guide of how well a state is doing. Examples include Massachusetts, Connecticut and to a lesser degree, New Jersey, which has the second highest median household income in the nation.

    In sum, the cost of living says a great deal about a state, its politics and its future.

    Eamon Moynihan is the Director of the Cost of Living Project in New York. The purpose of the project is make New York City and State more competitive, with a particular focus on the costs imposed by regulation. A former government official at both the City and State level, he most recently served as Deputy Secretary of State for Public Affairs and Policy Development. An interactive website for the project can be accessed at thecostoflivingproject.org.

  • Rome Vs. Gotham

    Urban politicians have widely embraced the current concentration of power in Washington, but they may soon regret the trend they now so actively champion. The great protean tradition of American urbanism – with scores of competing economic centers – is giving way to a new Romanism, in which all power and decisions devolve down to the imperial core.

    This is big stuff, perhaps even more important than the health care debate. The consequence could be a loss of local control, weakening the ability of cities to respond to new challenges in the coming decades.

    The Obama administration’s aggressive federal regulatory agenda, combined with the recession, has accelerated this process. As urban economies around the country lose jobs and revenues, the D.C. area is not merely experiencing “green shoots” but blossoming like lilies of the field.

    To be sure, the capital region has been growing fat on the rest of America for decades, but its staggering success amid the recession is remarkable. Take unemployment: Although the district itself has relatively high rates, unemployment in Virginia and Maryland – where most government-related workers live – has remained around 7% while the nation’s rate approaches 10%.

    The reason is obvious: an explosion of government amid a decline in the private sector. Factories may be closing in Michigan, tech jobs and farms may be disappearing in California, but the people who grease the skids of the ever-expanding federal machine seem to be doing just fine.

    This is most evident at the top of the job market. The capital region now boasts the healthiest technology employment picture in the nation. Virginia has the highest proportion of tech workers in the nation. Maryland ranks fifth, and the district itself is seventh.

    The area also continues to enjoy continued growth in the lucrative professional and business service jobs category. Over the past year, according to latest estimates by www.jobbait.com, the D.C. area was the only region in the nation to enjoy growth in this field.

    Signs of Washington’s ascent abound. The local real estate market appears to be on the mend even as others suffer continued strong declines in values and rising foreclosures. Hotel prices, dropping virtually everywhere else, look to be rising as well.

    Occupancy rates, falling in most places, actually increased during the first half of 2009, as did revenues, which have taken a nosedive elsewhere. In New York prices have plunged – even the mighty Waldorf has been slashing rates.

    In many ways, the economic disasters in New York and other cities have proved a boon for Washington. Wall Street’s demise, for example, has been D.C.’s gain as the locus of financial power leaves New York for the Treasury, Fed, White House and the finance-related congressional committees. K Street is the new Wall Street, where you play for the really big stakes.

    This shift may soon spread beyond the financial sector. Want to get into the energy business? You can bypass Houston and head to the Energy Department and Environmental Protection Agency – they are the ones handing out subsidies and grants to “deserving” applicants. Thinking of expanding your city to accommodate new middle-class families? The people at the Departments of Transportation and Housing and Urban Development have their own ideas on how your cities and regions should grow.

    Manufacturing might be important to your economy, but Washington – a region with virtually no history of productive industry – generally regards factories as polluters, greenhouse gas emitters and labor exploiters. If you have enough lobbyists you might be able to hang on, but don’t really expect much in the way of positive help.

    Some “progressives” may like this model – after all, it originated in Europe, the supposed fount of all that is enlightened. Since the 18th century, Europe’s urban history has been largely dominated by great imperial centers – London, Paris, Moscow and Berlin – that treat other cities like something akin to poor relations.

    Even today European cities and localities tend to have far less control over their destiny than in the U.S. Zoning, planning decisions and even economic strategy often originate from the center, as does the power to tax and spend. For decades, Europe’s legacy of ancient urban privilege – so critical in emerging out of the dark ages – has ebbed before the increasing power of the national capitals. More recently the super-capital of Brussels, like Washington, thrives in hard times that are decimating other European urban economies.

    The great European capitals rose largely because they also served as the domicile of princes, bureaucrats and, until recent times, the clerical establishment. Other cities might have enjoyed a boom – such as Manchester during the industrial revolution – but, ultimately, hierarchy served to concentrate power in the great capital cities.

    In contrast, American cities and communities traditionally have retained control over planning, development and other critical growth factors. Equally important, American cities, noted the great sociologist E. Digby Baltzell, were not dominated by aristocracy but were “heterogeneous from top to bottom.” Urban growth came primarily not by central design but as a result of the often ruthless schemes and lofty aspirations, often ruthlessly expressed, of local political and business leaders.

    For example, the quintessential American city, New York, started as a commercial venture. As early as the mid-17th century 18 languages were spoken on Manhattan Island (population of 1,000) and numerous faiths practiced. In early New Amsterdam, the counting house, not the church or any public building, stood as the most important civic building.

    Even after the Dutch were pushed out by the more powerful British military, the bustling island city – renamed New York – retained its fundamentally commercial character. It served briefly as the nation’s capital, but its power grew from its port and its immigrants. The city’s entrepreneurial spirit and social mobility startled many Europeans. As the French consul to New York complained in 1810, “The inhabitants…have in general no mind for anything but business. New York might be described as a permanent fair in which two-thirds of the population is constantly being replaced; where huge deals are being made, almost always with fictitious capital; and where luxury has reached alarming heights.”

    This entrepreneurial pattern also drove the growth of New York’s many competitors – first the great industrial cities such as Cleveland, Chicago and Detroit and, later, West Coast metropolises like Los Angeles, the San Francisco Bay area and Seattle. More recently, there has been a similar spectacular rise of formerly obscure places like Dallas, Houston, Atlanta and Miami.

    Through much of this time Washington barely registered among the ranks of American urban centers. Despite early expectations that Washington would become “the Rome of the New World,” it lagged behind other American cities through much of the 19th century. The city was widely reviled as a fetid, swampy place with atrocious cuisine – hog and hominy grits were its staples – that offered little in the way of commerce, industry or culture. Even its great buildings were compared to “the ruins of Roman grandeur.”

    The First World War, the Depression and then the Second World War each boosted Washington’s status but hardly into the first rank of cities. Few entrepreneurs were attracted to a city dominated by regulators, clerks and lawyers. The cultural center lay in New York and Boston – and later Los Angeles. The Bay Area, Massachusetts and later Texas evolved into the primary technological centers.

    Not until the 1960s did Washington begin to emerge as something like a traditional national capital, with a large permanent population of well-educated and cultured citizens as well as a robust economy based on the defense industry and the expanding welfare state.

    But the financial crisis of 2008 has set the stage for an unprecedented growth of the region, with a Democratic president and majority seemingly determined to expand federal mandates into every crevice of community life. There is an eagerness to use federal authority in unprecedented ways that could bring federal influence into virtually every minute decision made in an urban area.

    This concentration of power is also bad news for urban economies, including New York’s. As New York University’s Mitchell Moss has observed, Gotham may be losing its perch as the true national financial center. But other cities also should take note of the trend. Polycentric sprawling cities like Los Angeles, Dallas, Houston, Phoenix and Atlanta soon may find themselves forced to reorganize themselves along lines preferred by federal urban “experts.” Hard-pressed industrial cities may find new environmental restrictions on ports and other key infrastructures an impediment to a much-needed renaissance.

    American cities are at a critical moment. Our competitive, commercial urban tradition certainly has its flaws, but it also has produced the advanced world’s most dynamic roster of modern cities and regions. Ceding the power of urban planning to Washington will cripple the American city – except, of course, for the one that reigns as locale for imperial control.

    This article originally appeared at Forbes.

    Joel Kotkin is executive editor of NewGeography.com and is a presidential fellow in urban futures at Chapman University. He is author of The City: A Global History. His next book, The Next Hundred Million: America in 2050, will be published by Penguin early next year.

  • The New Radicals

    America’s ”kumbaya” moment has come and gone. The nation’s brief feel-good era initiated by Barack Obama’s stirring post-partisan rhetoric–and fortified by John McCain’s classy concession speech–has dissolved into sectarian bickering more appropriate to dysfunctional Iraq than the world’s greatest democratic republic.

    Yet little of the shouting concerns the fundamental economic issue facing the U.S. today: the decline of upward mobility and income growth for the working and middle classes. Instead we have politicos battling over two versions of ”trickle down” economics.

    The Democrats seem bent on installing a permanent ruling mandarinate alongside a small financial aristocracy. The Republicans, meanwhile, simply want to help the rich hold onto as much of their money as possible.

    Neither approach will improve prospects for the vast majority of Americans. The Bush Administration policies of low taxes–for the upper classes–and less regulation helped engender a massive asset bubble unsupported by economic fundamentals. This ultimately drove up both the current account and federal deficits and led to the severe Great Recession.

    The Obama ”trickle down” is, sadly, not all that different from the Bush-Paulson strategy. Like its predecessor, it endorses the bailout of giant financial institutions as the linchpin of its economic policy. It is, simultaneously, profoundly anti-democratic and anti-capitalist.

    Other aspects of the Obama policy seem likely to prop up Wall Street traders at the expense of the rest of us. The administration’s big ”cap and trade” proposals could prove more advantageous to well-heeled ”carbon traders” than to the environment. The other big winners may be Silicon Valley venture capitalists, who– increasingly bereft of their own ideas for making money–hope to cash in on Washington-subsidized energy schemes.

    Of course, not all Democrats have sold out. Sens. Byron Dorgan, D-N.D., and John Tester, D-Mont., have expressed opposition to bailing out ”too big to fail” institutions. New York Attorney General Andrew Cuomo has been fearless in unveiling the enormous Wall Street bonuses–over $32.6 billion last year– handed out as firms suffered $81 billion in losses and almost drove the world economy to ruin.

    Unfortunately, these are exceptions. Illinois Sen. Dick Durbin recently admitted that the banks remain ”the most powerful lobby on Capitol Hill,” adding that they ”frankly own the place.”

    So far in 2009 the Democrats have netted nearly 60% of all campaign contributions that have come from the financial industry, now the largest sector in terms of donations. The biggest donations have gone to such influential Democrats as Sen. Charles Schumer and his sidekick, newly appointed Sen. Kirsten Gillibrand, from New York; Sen. Chris Dodd D-Conn., and Majority Leader Harry Reid D-Nev. Schumer, the Street’s leading vassal in Congress, has emerged as the rising star in the Democratic leadership. If Majority Leader Reid loses his seat–as is now possible, according to polls in Nevada–Wall Street’s main man could well end up a future Majority Leader.

    Some Democrats try to have it both ways, playing populists for the peanut galleries but getting cozy with the industry when it matters. Massachusetts Rep. Barney Frank, the House Financial Services Chairman, talks tough but has a history of friendly relations with financial powerhouses. One of Frank’s own top assistants, Michael Pease, just went to work for the biggest winner since taking TARP bucks, Goldman Sachs. As left-winger blogger Glenn Greenwald put it recently: ”The only way they can make it more blatant is if they hung a huge Goldman Sachs banner on the Capitol dome and branded it onto the foreheads of leading members of Congress and executive branch officials.”

    In the end the faux populist Democrats end up with policies that make Ronald Reagan’s ”trickle down” seem downright Leninist. Harry Truman once quipped that ”There should be a real liberal party in this country, and I don’t mean a crackpot professional one.” Sadly, it’s increasingly the latter.

    The hypocrisy should open a path for the Republicans as wide as the Grand Canyon. But the ill-named Party of Lincoln still seems to think that the path to power lies in the tired old formula of ultra-patriotism, guns, abortion and religious rectitude. Screaming ”socialism” may awaken the spirits of some on the old right, but it’s hard to make a convincing case when George Bush socialized banking and grew the deficit.

    You certainly can’t trust big-business conservatives to stop bonuses for the TARP babies, particularly the 25 financial firms deemed ”too big to fail” by the likes of Ben Benanke. Give GOP big-business leaders higher stock prices, and they will follow you anywhere. Only a few–such as Sen. Charles Grassley, R-Iowa,–have shown they are truly serious about the free market or defending the interests of the regular taxpayer.

    Given this sad political picture, the best hope now is to build an alternative perspective that focuses on the basic economic issues. This would not be the media celebrated movement of moderates–Democrats-lite and Republicans-lite–who seek kumbaya through compromise. It would, instead, require a radical third tendency–neither strictly left or right–that would draw on long-term American priorities and values.

    These new radicals would focus on basic issues like improving infrastructure, and primary education and bolstering the nation’s productive economy. Their inspiration would come from a long tradition of federal successes–from the Homestead Act and the WPA to the Interstate Highway and the space program. They would view the financial crisis not as an imperative for protecting the well-connected but for financial reform, decentralization and innovation.

    Such an approach would address what the British author Austin Williams calls our ”poverty of ambition.” Americans historically have rejected a future constrained by entrenched hierarchies. Most, I believe, would support spending money and paying taxes, if it was spent to achieve big things that would lead to a greater, more widespread prosperity and opportunity.

    Just imagine if the upward of $1 trillion spent guaranteeing Goldman Sachs and Citigroup executives giant paydays had instead gone into roads, bridges, subways, buses, port development, skills training, energy transmission lines and basic scientific research. And imagine if instead of protecting Citigroup and Bank of America, we encouraged stronger local banks and solvent financial entrepreneurs to fill the breach left behind by gross failures.

    Such an approach may seem extreme, but it might have wide appeal. We know, for example, that the TARP bailout is widely unpopular. Indeed, according to one survey taken earlier this year, Americans oppose continuing bailouts for banks by better than 2 to 1.

    As I travel the country, I find anger is deepest among business owners who find securing loans increasingly difficult nearly a year after the original bailout. Even as the economy slowly recovers, this anger will become more pronounced with the coming bonuses doled out to those at bailed-out firms. As Sen. Grassley puts it: ”My people ask, ‘When are these people going to be put in jail?”’ Instead we’re paying for them to stay at the Ritz.

    This article originally appeared at Forbes.

    Joel Kotkin is executive editor of NewGeography.com and is a presidential fellow in urban futures at Chapman University. He is author of The City: A Global History. His next book, The Next Hundred Million: America in 2050, will be published by Penguin early next year.

  • The New Industrial City

    Most American urban economic development and revitalization initiatives seek to position communities to attract high wage jobs in the knowledge economy. This usually involves programs to attract and retain the college educated, and efforts to lure corporate headquarters or target industries such as life sciences, high tech, or cutting edge green industries. Almost everything, whether it be recreational trails, public art programs, stadiums and convention centers, or corporate incentives, is justified by reference to this goal, often with phrases like “stopping brain drain” and “luring the creative class”.

    The future vision underpinning this is a decidedly post-industrial one. This city of tomorrow is made up of people living upscale in town condos, riding a light rail line to work at a smartly designed modern office, and spending enormous sums – with the requisite sales tax benefits – entertaining themselves in cafes, restaurants, swanky shops, or artistic events.

    In contrast the factory has no place in this future city. Indeed industry is considered a blight that needs to be eliminated or repurposed. What were once working docks are to be converted to recreational waterfront parkland. Warehouses and small factories become the site for developing lofts, studios, or boutiques. This urban economy is based almost solely around intellectual work and services, not physical production.

    But there is a problem with this equation. In almost any city, the bulk of the people do not have college degrees. According to Brookings, the average adult college degree attainment rate for the top 100 metro areas is only 30.6% In the many years it will take to raise this, what are the rest of the people supposed to do for a living? Younger cohorts are better educated than their grandparents, so this will improve over time. But better educated for what? Not everyone is cut out, or wants to be a stock-trader or media consultant. We have to think about those who would rather work with their hands, or are better suited for that kind of work.

    The vision touted by too many urban boosters is that of an explicitly two-tier society. There are elite, well paid knowledge workers in industries like finance, law, and technology, and then there is everybody else. Programs designed to boost knowledge industries turn out to be subsidies to cater to the most privileged stratum of society. The public is called on to pay for urban amenities for the favored quarter of the intelligentsia, with the benefit to the rest of the people assumed.

    But little thought is given as to how everyone else will get by, other than working in low wage service occupations catering to the privileged. In the Victorian era, they called this going “into service”. Today we might think of them better as globalization’s coolie class.

    Beyond this, can we as a country prosper if we don’t actually make things anymore? Some of the fear of manufacturing decline is overblown. Despite large scale job losses in the manufacturing sector, the US has continued to set industrial production records outside of recessions. However, as the chart below from the Federal Reserve shows, industrial production growth flattened significantly in the late 1990s.

    Sadly, manufacturing has been hammered in this Great Recession. There will certainly be a cyclical upturn in output, but restructuring in the automobile industry portends a permanent reduction in domestic output in that sector among others. Unless carefully handled, increasing regulation of carbon emissions, along with the associated energy price rises, will encourage further offshoring to countries with few climate change obligations, such as China, India, Brazil and other developing nations.

    Yet to remain both a prosperous and fair society, the United States must remain a manufacturing power. Manufacturing still provides the traditional route to middle class wages for those without college degrees. It also alone employs 25 percent of scientists and related technicians and 40 percent of engineers and engineering technicians.

    Of course, the next wave of manufacturing will differ greatly from the past. Improvements in productivity and global competition mean a bleak future for large scale, low value-added, routinized production. The era where an assembly plant provided thousands of good jobs at good wages is a thing of the past other than for the lucky few. And where there are new factories, they are often in greenfield locations like the new Honda plant in Greensburg, Indiana – halfway between Indianapolis and Cincinnati – not urban centers. Polluting heavy industry like primary metals and refining really are incompatible with neighborhoods. So what is to be done?

    One answer is to build a new industrial city focusing on small scale craft and specialty manufacturing with high value added. We’re seeing a precursor to this in the rise of organic farming and artisanal products of all kinds. TV shows featuring hip young carpenters renovating homes or gearheads tricking out cars and motorcycles make these professions seem glamorous. Magazines targeted at the global elite like Monocle scour the world in favor of the finest handcrafted products from old school workshops, building demand for these products. The New York Times Magazine recently did an article making the case for working with your hands, and also noted how digitally oriented designers are rediscovering the use of their hands. Perhaps it is no surprise that sociologist Richard Sennett turned his attention to the idea of the craftsman. In short, making things, craftsmanship, and quality are back in fashion.

    The challenge for urban economies is to develop this and put it on a sound industrial and economic footing. One key might be to inspire people to start these craft oriented businesses by tapping into people’s desire to purchase ethical and sustainable products. We increasingly see with foods and other items that people want to understand their provenance, to know who made them, how, with what, and under what conditions. Often today businesses catering to this desire are small scale “Mom and Pop” type operations, but there is no reason they can’t be done at greater scale, or expanded into areas like organic food processing, not just organic farming. American Apparel has done just that by manufacturing low cost, stylish clothing “Made in Downtown Los Angeles. Sweatshop Free.” at scale, for example.

    Beyond craft products, reinvigorating small scale, specialty fabrication and other businesses, to rebuild an American version of Germany’s Mittlesand, creates another, often ignored option for urban economies. Quality, flexibility, responsiveness, and a willingness to do small runs are keys. These businesses can also underpin product companies higher in the value chain. They start building an ecosystem of local companies and expertise that can be useful for related or spin-off businesses. Jane Jacobs, and before her the great French historian Fernand Braudel, noted how cities could incubate many new enterprises because all the diverse products and services they needed were available locally. If you need to scour the globe looking for custom parts and services, it can quickly overwhelm a small business. That’s one reason American Apparel started in Los Angeles, which already had a network of garment producing firms and expertise to draw on. What’s more, these firms might be ideal candidates to take over empty strip mall or other space in decaying inner ring suburbs, helping to solve the “graybox” problem. Even Main St. locations could potentially benefit from businesses beyond traditional boutiques.

    Today these types of specialty firms are often found in America’s largest cities, so they stand to benefit most from this. Smaller cities also need to figure out how to build this ecosystem. The culture needs to change too. Particularly in the Midwest/Rust Belt area, industrial labor has tended towards low skill, repetitive work in larger scale mass production industries. Retraining will be needed for these newer types of businesses, but this is vocational or skill training, not necessarily a college degree. It is a much more tractable problem.

    Not only could this new manufacturing base be a source of urban middle class jobs for the non-college degreed, it would do something arguably more important. It links the fortunes of the new upscale urban residents, the people who are both the customers for many of these products and potentially also the entrepreneurs making them, with that of their less educated neighbors. For many owners, managers, and workers, it might bring into daily contact people who might not otherwise ever interact if one group worked in an office and another in a warehouse. Rebuilding that sense of community and commonwealth, that we are neighbors, fellow citizens, and all in this together, is critical to building a truly sustainable, well-functioning and broadly prosperous society.

    Aaron M. Renn is an independent writer on urban affairs based in the Midwest. His writings appear at The Urbanophile.

  • Nice Houses for Ducks

    During the long hot summer of the expenses scandal in British politics, one of the most bizarre stories concerned a Conservative MP who claimed from the public purse for a second home: a place for his ducks. It wasn’t any old duck house, however, but a ‘Stockholm’ floating model, valued at over £1,500. It is over 5 feet high.

    If only two ducks lived in the duck house, with its prime waterside location and spectacular views of the gardens beyond, their living space would be on a more generous specification – measured by their weight – than the hundreds of thousands of new homes that have been built in Britain in recent years. For one of the lesser-commented upon hypocrisies of the expenses scandal has been the chasm between those with two or more houses, and the many thousands who have just bought a home to find they couldn’t swing a duck around in it, let alone a cat.

    The BBC recently reported some of the new homes are so small that they have been rejected by the housing associations: these are the agencies that have taken over a great deal of the rented housing in Britain since the Conservatives abolished council house building in 1980. Housing associations are empowered to purchase some homes from the private market for rent to their tenants, or for shared ownership schemes.

    Good housing for those who cannot afford private ownership should be welcomed, and the housing associations congratulated for dismissing the smallest new dwellings. But the key question is: why should so much of the new housing seem to be built for birds, not people?

    British new housing today is rapidly becoming a scandal, at least for those who have to live in it. The BBC report found that in some new dwellings valued at over £200,000 ($326,000), rooms were tiny, and many basic construction faults were to be found. And Britain is now building the smallest new homes in the developed world: in Holland the average size of a new build home is 115 square metres, and in Japan it is 92.5 square metres. In Britain a paltry 76 square metres is common. (BBC News, New Homes Rejected for Social Housing (16 May 2009))

    The causes of this cramped and unhappy state of affairs cannot completely be laid at the door of New Labour. During the 1980s the Conservative government of Margaret Thatcher terminated the obligation of private builders to construct new homes according to the Parker Morris standards set out in the report of the same name in 1961. The Toryism of Thatcher may have been more stridently in favour of the aspirational home owner than the more ‘one-nation’ Conservatism of Harold Macmillan, who legislated them, but these guidelines should not have been revoked. Whatever their faults, those standards laid down decent room sizes, and allowed for more generous interpretations of internal uses of space. Council tenants and private home owners benefited from both.

    Now, following the abolition of Parker Morris, it was possible to build new dwellings with a double bedroom that was marginally bigger than a double bed. This tendency to cram became commonplace, however, under Labour, whose housing policies mindlessly follow the idea that, when it comes to housing, tiniest is next to godliness.

    This brilliant approach arose in the 1990s as part the notion that creating higher densities in British cities would stimulate urban renewal. The formula was simple, or rather simplistic, and was best articulated by the leading architect Lord Rogers of Riverside. ‘Let’s cram our city centres’ he wrote provocatively. Of course, this was not for his usual clients for whom he designed spacious office blocks and sizeable swanky houses.

    Rogers was appointed as Head of the Urban Task Force, commissioned by the New Labour government. Its report entitled Towards an Urban Renaissance (1999), called for flats to populate the city centres at high densities. And as for those sprawling suburbs around the outskirts of town, so popular with English home owners, they were to be retro-fitted to utilise existing green spaces for housing.

    So much for verdant England. Even little parks and large private gardens are now vulnerable to development. Interestingly, the first illustration in Towards an Urban Renaissance is a photograph of the then Deputy Prime Minister John Prescott, who, of course, has two homes and more than one car. Needless to say, he welcomed the recommendations in the report since he likely never saw it applying to him or his friends.

    Environmentalism has further accelerated the trend for the shrinking of the British home. The emphasis upon the Rogers-style compact city has been trumpeted by the Green Party and other environmental lobby groups because higher densities and small build theoretically cause less carbon emissions and use up less non-renewable sources of energy.

    Yet let the obstreperous commoner be a bit put off by the high priests of cramming. Some of the most outspoken advocates of environmentalism come from wealthy patrician backgrounds, for example Jonathan Porrit and Prince Charles. Buckingham Palace and High grove House are hardly exercises in low-density living.

    All this leads to some doubts about the democratic future under the influence of our feudalist betters. A recent article in Regeneration and Renewal magazine by Sir Peter Hall draws attention to research led by Marcial Echenique at Cambridge University. Echenique and his team compared the ‘Richard Rogers-style compact city’ with ‘market-led dispersal, US fashion’. Their findings raise some profound questions in an urban democracy:

    The compact city cut carbon emissions by just 1 percent; but there were higher economic costs in outer areas where people still want to live, and where demand was greatest. Also, any social aspects of the compact city were to some extent undermined by crowding, exposure to noise and the crush on facilities.

    American style sprawl by contrast raised energy use and CO2 emissions by almost 2 percent, but engendered lower house prices, less crowding and less road congestion. (Hall, Sir Peter ‘Planners may be wasting their time’, Regeneration and Renewal, 6 July, 2009)

    None of this has yet created the momentum for a radical push back on housing policies, but it should. Conservative, Liberal and Labour MPs are now guiltily paying back their sums for using their expenses to buy their own often lavish second homes. It is striking how they have enjoyed a privileged access to accommodation which they, through legislation, would make all but unaffordable to millions outside the wealthiest classes.

    Once upon a time our political class understood that they ignored the hopes of less-well-off owner occupiers at their peril. Labour’s spectacular victories in 1997 and 2001 owed much to the votes of those who wanted to get on the housing ladder, or who had just clambered onto it, and naturally wanted the best home for their money. Before then, under Thatcher, the Conservatives successfully garnered the support of the same class.

    Now lamentably all the parties display little interest in the aspirations of working-class, lower middle-class and immigrant wannabe homeowners for a decent space. Instead they are to be treated like water fowl by those who generally have access to one or more homes. Some may do it in the name of being “green” but there’s a better term for what they are doing: hypocrisy and class privilege.

    Mark Clapson is a social historian, with interests in suburbanisation and social change, new communities in England and the USA, and war and the built environment.

  • Bloomberg Endorses “City of Aspiration” Report Recommendations in New Middle Class Plan

    Earlier this year, the Center for an Urban Future published an extensive report about the mounting challenges New York City faces in both retaining its middle class and elevating more low income residents into the ranks of the middle class. One of our key recommendations from that report, titled Reviving the City of Aspiration, was that “city and state officials must embrace community colleges as engines of mobility and dedicate the resources necessary to strengthen these institutions and ensure that a greater number of middle class, poor and working poor New Yorkers can attend these schools and complete their degrees.”

    City officials are now running with our suggestion. Today, Mayor Bloomberg announced a “Gateway to the Middle Class” plan that focuses on boosting community colleges. The mayor’s proposal aims to “move more New Yorkers into the middle class by increasing the number of city residents that graduate from community colleges and training them for higher wage jobs in growing industries.” The plan will invest an additional $50 million over the next four years to improve the system’s quality, accessibility, affordability, and accountability.

    The new attention and resources for community colleges is an important step in the right direction for the city. Our report found that community colleges in New York are overshadowed by virtually every other facet of the education system and have not received the financial support needed to effectively educate students that come from a wide variety of backgrounds and often require academic remediation. Click here to read the section of our report about community colleges, titled “A Platform For Mobility.”

  • Immigrants Are ‘Greening’ our Cities, How About Giving them a Break?

    Debate about immigration and the more than 38 million foreign born residents who have arrived since 1980 has become something of a national pastime. Although the positive impact of this population on the economy has been questioned in many quarters, self-employment and new labor growth statistics illustrate the increasingly important role immigrants play in our national economy.

    There has also been an intense debate within the environmental community about the impact of immigrants. Yet there has been relatively little research done about how immigrants get to work and where most immigrants live. As the ‘green’ movement in the U.S. has increasingly pushed for higher-density housing and transit-oriented development in order to improve public transportation (specifically rail), few have considered how immigrants use transit and what might be the best way to accommodate their needs. In fact, all too often, “green” policies advocate transit choices – favoring such things as light rail over buses – that may work against the interests of immigrant transit riders.

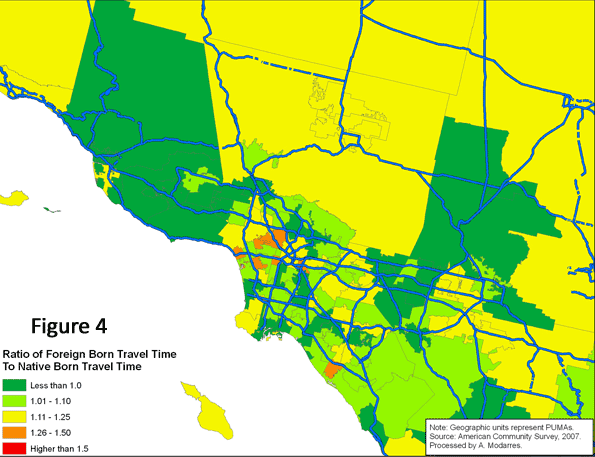
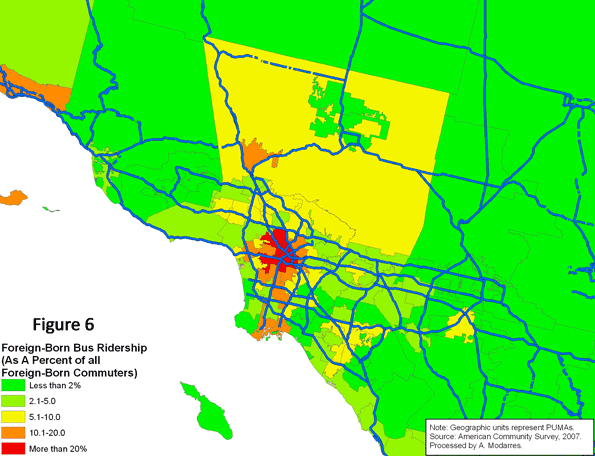
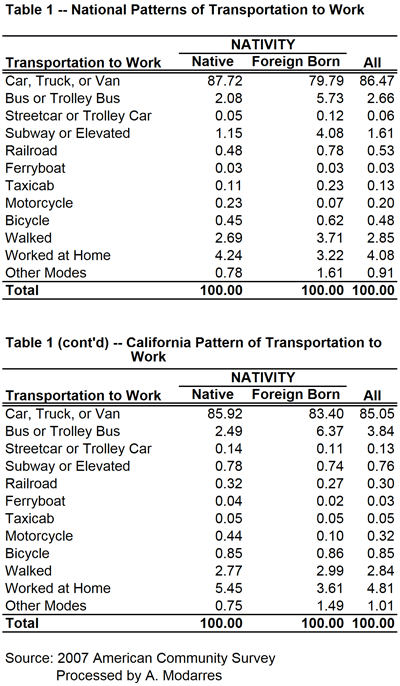
    Based on the 2007 American Community Survey, 117.3 million native-born and 21.9 million foreign-born individuals commuted to work. As Table (1) illustrates, a higher percentage of immigrants rode buses (5.7% vs. 2.1%) and subways (4.1% vs. 1.2%) and many walked to work (3.7% vs. 2.7%). A much smaller percentage drove to work (79.8% vs. 87.7%). Unfortunately, despite their higher usage of alternate means of transportation to work, or perhaps because of it, the commute to work time was on average longer for the foreign-born commuters than their native-born counterparts (28.8 minutes versus 24.7).

    Clearly in terms of using public transportation, immigrants are a bit greener than those born here. But why? Is this habit formed elsewhere? In that case, are recent immigrants even more likely to use public transportation than those who immigrated earlier? Or is it their income that affects their transportation choices?

    Table (2) provides the answer to the first question. Recent arrivals are clearly less likely to drive to work and have a higher propensity toward using public transportation, compared to all foreign-born individuals (and significantly more than the native-born). Additionally, over 6% of the immigrants who have arrived since 2000 walk to work.

    Overall, more than a quarter of the immigrants who have arrived since 2000 use an alternative mode of transportation to work. If the rest of America could do the same, we’d be a bit ‘greener’ already. However, it seems that as immigrants stay longer, they eventually tend to use cars more often because automobile usage allows for access to better jobs, better shops, and better schools. For example, immigrants who arrived in the U.S. in the 1970s (which means they have been here over three decades) drive a bit more and use public transportation less.

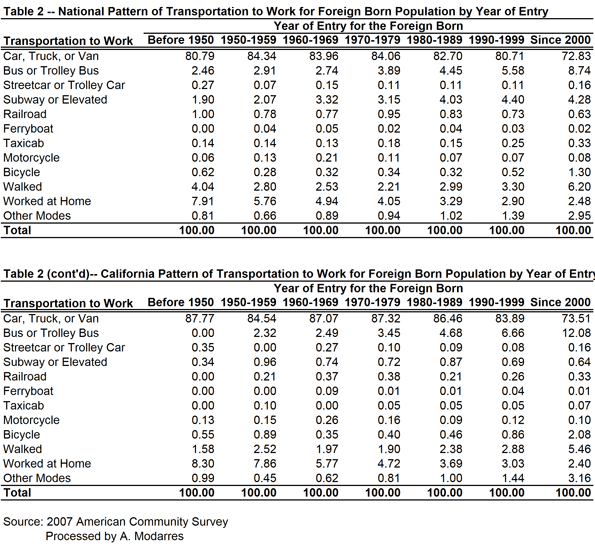
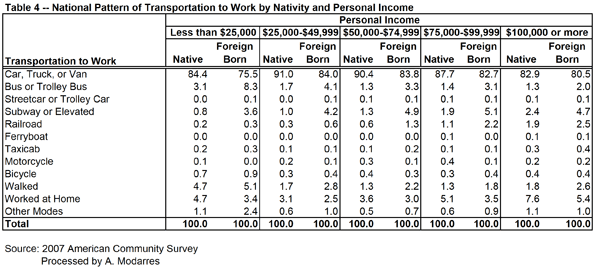
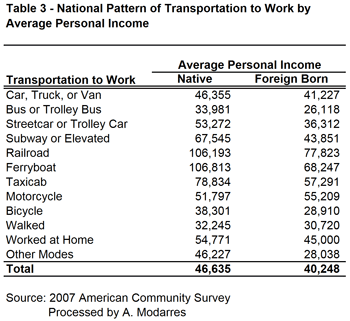
    Even so, their rates are still slightly better than the native-born (compare Tables 1 and 2). This may be in part because of their lower incomes (see Table 3) yet at every level of income they are still more likely to take transit. Table (4) illustrates this point by grouping commuters into income categories and their nativity. In every income category, immigrants use their cars less and are more likely to use public transportation, even though their car ridership increases with income.

    The message from these statistics is loud and clear. Immigrants are more likely to ride public transportation than those born in the U.S., regardless of their income. The ones arriving more recently are even more likely to do so. Overall, this suggests that familiarity with public transportation, combined with the effects of income and place of residence, has made the immigrants’ lives in the U.S. a bit ‘greener’ than those of the native-born. In fact, one factor that may contribute to their higher usage of public transportation stems from their living in neighborhoods whose densities are, on average, 2.5 times higher than those of the native-born. Immigrants, in essence, are doing precisely what planners want the rest of us to do.

    Moving to Southern California

    Southern California still stands as the icon of immigration and multiculturalism and is home to a large number of immigrants in the urban region that extends from eastern Ventura County to the southern tip of Orange County and the Inland Empire. As Figure (1) illustrates, in a number of neighborhoods in Southern California, the foreign-born population outnumbers the native-born by large margins. For example, in areas west and south of downtown Los Angeles, immigrants are more than three times as numerous as the native-born.

    A comparison of Figures (2) and (3) suggests a wide geographic difference between the native-born and the foreign-born and how long it takes them to get to work. The foreign-born population experiences much longer commutes in highly urbanized areas around downtown Los Angeles and the San Gabriel Valley. Conversely, in the more rural areas, such as northern Ventura County, the foreign-born population experiences shorter commutes compared to their native-born counterparts.

    Figure (4) provides a clear comparison of average travel time to work for both populations (visually comparing Figures 2 and 3). In all areas appearing in the darkest shade of green, the foreign-born population experienced shorter commutes compared to the native-born. These shorter commutes, however rarely occur in high density areas (compare with Figure 5). Conversely, in areas such as Santa Monica, the Wilshire corridor, East Los Angeles, and southern sections of downtown Los Angeles, the foreign-born population experiences much longer commutes than the native-born.


    Statistically speaking, there is a positive relationship between average travel time and density – i.e., the higher the density, the higher the reported average travel time. For the foreign-born population who live in higher density areas, this means much longer commutes, a problem caused by a number of factors, including their dependency on slower public transportation systems and the long distances they have to travel to reach job centers outside the city center.

    Figure (6) illustrates the geographic pattern of bus ridership among the foreign-born commuters. As with national patterns, immigrants in Southern California are more likely to settle in high density areas and use public transportation to work, but unfortunately, they also suffer much longer commutes.

    What should the policy responses be? One may be to promote increased car ownership among immigrants and low-income populations in the U.S. This may be objectionable to some environmentalists and planners, but it’s clear that those people who live by the principles of higher density and public transportation use are not rewarded and indeed suffer longer commutes.

    An even more relevant question is why advocates for public transportation focus disproportionately on rail, when buses are so frequently used by low income populations, including immigrants. In California, these riders outnumber the native-born on buses. The situation is reversed on rail and subways. An intelligent policy response to public transportation planning would suggest that buses should receive much more attention. Major metropolitan areas have become polycentric in their employment patterns, and most major employment centers are located at long distances from the central city. Specially-designed buses for reverse commutes could help alleviate transportation problems while helping working immigrants reach their destinations more quickly.

    This challenges the priorities of some public transport advocates, who tend to focus on very expensive rail projects designed primarily to draw more middle class, largely native-born riders who commute to places like downtown Los Angeles. Meanwhile those ‘new’ Americans who already live by a number of ‘green’ standards suffer from the misallocation of transit resources. Those who are already doing what we hope the middle class will do deserve better.

    Ali Modarres is an urban geographer in Los Angeles and co-author of City and Environment.

  • Green Jobs Can’t Save The Economy

    Nothing is perhaps more pathetic than the exertions of economic developers and politicians grasping at straws, particularly during hard times. Over the past decade, we have turned from one panacea to another, from the onset of the information age to the creative class to the boom in biotech, nanotech and now the “green economy.”

    This latest economic fad is supported by an enormous industry comprising nonprofits, investment banks, venture capitalists and their cheerleaders in the media. Their song: that “green” jobs will rescue our still weak economy while saving the planet. Ironically, what they all fail to recognize is that the thing that would spur green jobs most is economic growth.

    All told, green jobs constitute barely 700,000 positions across the country – less than 0.5% of total employment. That’s about how many jobs the economy lost in January this year. Indeed a recent study by Sam Sherraden at the center-left New America Foundation finds that, for the most part, green jobs constitute a negligible factor in employment – and will continue to do so for the foreseeable future. Policymakers, he warns, should avoid “overpromising about the jobs and investment we can expect from government spending to support the green economy.”

    This is true even in California, where green-job hype has become something of a fetish among self-styled “progressives.” One recent study found that the state was creating some 10,000 green jobs annually before recession. To put this into context, the total state economy has lost over 700,000 jobs over the past year (more than 200,000 in Los Angeles County alone). Any net growth in green jobs has barely made a dent in any economic category; only education and health services have shown job gains over this period.

    More worrisome, in terms of national competitiveness, the green sector seems to be going in the wrong direction. The U.S.’s overall “green” trade balance has moved from a $14.4 billion surplus in 1997 to a nearly $9 billion deficit last year. As the country has pushed green energy, ostensibly to free itself from foreign energy, it has become ever more dependent on countries such as China, Japan and Germany for critical technology. Some of this is directly attributable to the often massive subsidies these countries offer to green-tech companies. But as New America’s Sherraden puts it, this “does not augur well for the future of the green trade balance.”

    Nor are we making it any easier for American workers to gain from green-related manufacturing. Some of America’s “greenest” regions are inhospitable for placing environmentally oriented manufacturing facilities. For example, high taxes and regulatory climate have succeeded in intimidating solar cell makers from coming to green-friendly California; a manufacturer from China told the Milken Institute’s Ross DeVol that the state’s “green” laws precluded making green products there.

    Attempts to put windmills in Nantucket, Mass., the Catskills and Jones Beach in New York and other scenic areas have also been blocked by environmentalist groups. Transmission lines, necessary to take “renewable” energy from distant locales to energy-hungry cities, often face similar hurdles. Solar farms in the Mojave desert might help meet renewable energy quotas but, as wildlife groups have noted, may not be so good for local fauna.

    And then there is the impact of green policies on the overall economy. Green power is expensive and depends on massive subsidization, with government support levels at roughly 20 times or more per megawatt hour than relatively clean and abundant natural gas. Lavishing breaks for Wall Street investors and favored green companies also may be harmful to the rest of the economy. A recent study on renewable energy subsidies on the Spanish economy found that for every “green” job created more than two were lost in the non-subsidized economy.

    So how do we build a green economy that is sustainable without massive subsidies? First, governments need to learn how to say no to some environmentalists. Green jobs and renewable energy can not be fully developed without affecting somebody’s backyard. Windmills will have to be built in some scenic places; transmission lines may mar somebody’s “view-shed.”

    Arguably, the thing that would spur green jobs and domestic industries most would be economic growth. Environmentalists long have been cool to growth, since they link it to carbon production and other noxious human infestations. As an official at the Natural Resources Defense Council put it, the recession has “a moment of breathing room.” Disaster may be still looming, but bad times add a few more moments to our carbon clock.

    Long term, though, I would argue hard times may prove harmful for the environmental cause. Even with subsidies, many renewable energy projects are now on hold or being canceled across the country. Slackening energy demand, brought on by a weak economy, has undermined the case for new sources of energy generation; what looked attractive with oil prices at $140 a barrel and headed higher looks at $70 less so.

    Similarly, hard-pressed homeowners and businesses don’t constitute the best market for new, often expensive “green” products. A growing economy, which would drive up energy prices, could spur a more sustainable interest in alternative energy from firms that now only do so for public relations concerns. At the same time, cash-rich consumers could more afford to install energy-saving home insulation or rooftop solar panels. A strong economy would also spur sales of new energy-efficient appliances and cars.

    This process would go more quickly if government relied less on mandates, which tend to scare serious investors, and turned toward incentives. With the right tax advantages, energy efficiency could become a positive imperative for companies.

    There’s also an unappreciated political calculus at work. A persistently weak economy undermines support for the green agenda. For the first time in 25 years, according to a Gallup poll, more people place higher priority on economic growth than on the environment.

    Furthermore, more people now feel claims about global warming are “exaggerated.” Early this year, Pew reported that global warming ranked last among the top 20 priorities of Americans.

    Ultimately, environmentalists need to realize that the road to a green economy does not lie in promoting hysteria, guilt and self-abnegation while ignoring prohibitive costs and grim economic realities. Green enthusiasts should focus on promoting a growing economy capable of generating both the demand and the ability to pay for more planet-friendly products. After all, the economy needs green jobs less than green jobs need a thriving economy.

    This article originally appeared at Forbes.

    Joel Kotkin is executive editor of NewGeography.com and is a presidential fellow in urban futures at Chapman University. He is author of The City: A Global History. His next book, The Next Hundred Million: America in 2050, will be published by Penguin early next year.

  • Forget Second Stimulus; We Need Economic Vision

    As the American economy slowly heals, the Obama administration will no doubt claim some credit for its $787 billion stimulus — and perhaps even suggest doubling down for a second stage. Republicans, for their part, will place their emphasis on the “slow” part of the equation and persistent high unemployment, blaming the very same stimulus program.

    Whatever the politics, no new stimulus should be considered unless it deals with the fundamental illness undermining the country’s long-term economic prospects. Such a stimulus would address the country’s essential problem: persistent overconsumption amid underproduction.

    Neither party wants to address this issue because neither chooses to understand it. From the very beginning, the Obama administration has viewed the stimulus as a political issue, not an economic one. This became clear to me even before the election when I asked Obama’s campaign economic adviser, Austan Goolsbee, about “the goal” of the president-to-be’s program.

    All I got for my trouble was vague political rhetoric about improving the economy. Though some parts of the stimulus, such as extending health and unemployment benefits, were clearly justified, the whole program never sought to address the roughly $800 billion annual imbalance between American consumption and production.

    Instead, we have witnessed a grab bag of political handouts — Chicago machine politics on a grand scale — designed to placate key Democratic constituencies. Most have gone to what my old teacher Michael Harrington described as “the social-industrial complex” consisting of the education industry, social service providers and the various government bureaucracies.

    As a recent New America Foundation report makes clear, precious little has gone to the productive side of the economy that determines the country’s competitiveness and creates many high-paying blue-collar jobs. Infrastructure, a critical component of any productivity-enhancing strategy, has accounted for barely 10 percent of the package.

    The results have not been pretty for the productive sectors of the economy. Construction workers now have higher than 19 percent unemployment; jobs in this sector have fallen during the past year in 333 out of 352 metropolitan areas, with more than 200 plunging by double digits. Meanwhile, the hard-pressed manufacturing sector suffers more than 12 percent unemployment.

    Why this disinclination to fund the tangible parts of the economy? One reason may be that those working in construction and manufacturing — both blue-collar workers and white-collar professionals — do not wield the same influence in this law review administration as college professors, Service Employees International Union-organized workers or unionized teachers.

    One also senses that some militant environmentalists in the administration may be less than enthusiastic about anything associated with the entire carbon-creating part of the economy. Certainly, new factories, natural gas facilities, roads, ports and waterways don’t fit the professed passion of the president’s own science adviser, John Holdren, for the gradual “de-development” of the U.S. and other advanced economies.

    Even prospects for the auto industry — the one manufacturing sector that the administration has effectively annexed — are threatened by plans to enact policies that will “coerce” Americans out of their cars. This amounts to trying to “save” an industry by destroying it.

    For sectors not under government control — warehousing, fossil fuel energy, home construction and agriculture — the administration’s “green” regulatory regime could boost costs at the worst possible time. As a result, the coming recovery once again may be consumption-led and fail to improve our overall competitiveness. The biggest beneficiaries will most likely be Chinese manufacturers, German and Japanese automakers and, because of a lack of sufficient domestic alternatives, energy producers from Venezuela and the Middle East to Russia.

    If they had a collective IQ over 50, the still largely discredited Republicans could run strongly against this economic scenario. Yet, for the most part, they seem incapable of putting the national interest ahead of Wall Street’s profits and corporate excess.

    So no matter how much the conservatives complain, Obamanomics most likely will end up with results remarkably like those of Bushonomics: more consumption, less production, expanding public debt, asset inflation on Wall Street and a slowly declining middle-class standard of living. The only real difference will lie in who gets to rob the public — instead of pharmaceutical and oil companies, we get Gorite “renewable” energy traders and well-connected “green” venture capitalists.

    Americans need to place a pox on both these flawed models. We need a totally new approach that focuses on key productivity-enhancing investments such as improved transportation infrastructure — new roads, bridges, ports and waterways to meet the demands of an expanded economy for a growing population. We should be looking at modern equivalents of the New Deal electrification program, the GI Bill, the Eisenhower highway and the space program.

    Clearly, an infrastructure that is inadequate today will be utterly useless in 2050, when there are projected to be at least 100 million more Americans. Already, our energy-generating capacity in some parts sputters like that of a Third World country. Commodity exports, such as grains, unable to reach foreign markets because of a lack of rail cars and adequate waterways, are left to rot and feed rats.

    This is not the way to prepare ourselves for ever greater competition from countries such as China, India and Brazil. Americans must demand a program that, while perhaps financially painful now, will make it possible for our progeny to enjoy a prosperous future rather than a declining one.

    This article first appeared at Politico.

    Joel Kotkin is executive editor of NewGeography.com and is a presidential fellow in urban futures at Chapman University. He is author of The City: A Global History. His next book, The Next Hundred Million: America in 2050, will be published by Penguin early next year.

  • Rating World Metropolitan Areas: When Money is an Object

    American metropolitan areas have been the subject of considerable derision. Often characterized as inferior to those of Australia, Canada, Europe and even of Japan by planners and politicians who travel abroad, there has long been a desire to reshape American cities along the lines of foreign models. Yet, despite this, American metropolitan areas generally provide a standard of living to their residents unmatched anywhere in the world. This is based upon the latest comparative economic data for the world’s most affluent metropolitan areas.

    International Rankings: American metropolitan areas never seem to place near the top of “quality of living” or “livability” indexes, such as those published by The Economist and the Mercer consulting group. On the other hand European, Australian and Canadian metropolitan areas usually grab the honors, frequently led by the likes of Vancouver, Melbourne, Zurich or Vienna.

    The media routinely reports these rankings without serious analytical analysis, which can lead to misunderstanding or even misrepresentation in comparing metropolitan areas on issues of living standards (Note 1). As Owen McShane pointed out on this site before, these ratings serve their purpose, which is to rank metropolitan areas based upon their “attractiveness to expatriate executives”. Not only do these lists fail to consider housing affordability, as McShane indicates, they also do not consider the overall economic performance of metropolitan areas in regard to their residents, which is not an insignificant matter. These highly publicized international listings might be thought of as “money is no object” ratings.

    When Money is an Object: The problem here: money is an object for the great majority of people living in the world’s metropolitan areas. This is true in Kinshasa, Seattle, Vancouver or Vienna.

    When the available measures of affluence or the standard of living are considered, the picture for US cities drastically improves. Here the US metropolitan areas dominate the list. The best available data is gross domestic product (GDP) per capita, adjusted for national level purchasing power (Note 2). Metropolitan area GDP data is now produced by the Bureau of the Census in the United States and regional data generally conforming to most metropolitan areas is available for the European Union by Eurostat (Note 3). Data for other metropolitan areas can be estimated from other national and regional sources.

    In 2005 (the latest available data), The Economist top ten averaged 57th in GDP per capita in the world. Mercer’s top ten did even worse, averaging 62nd. None of The Economist or Mercer top 10 ranked was among the 25 metropolitan areas with the highest GDP per capita. Vienna ranked best, at 27th. Perennial favorites Vancouver and Melbourne ranked 71st and 72nd (Table 1). Zurich, another rating champion, ranks 74th, just ahead of Oklahoma City. In contrast, only 5 of the 51 large metropolitan areas in the United States ranked behind Vancouver, Melbourne and Zurich.

    Table 1
    Top 10 Economist & Mercer "Cities"
    Ranked by Affluence
    (GDP per Capita, Purchasing Power Parity)
    Metropolitan Areas over 1,000,000 Population
    City or Metropolitan Area GDP per Capita: Rank among Top 100 World Metropolitan Areas The Economist Mercer
    Vienna 27 2 1
    Perth 28 5
    Munich 40 7
    Calgary 46 6
    Frankfurt 51 8
    Sydney 62 9 10
    Toronto 67 4
    Vancouver 71 1 4
    Melbourne 72 3
    Zurich 74 10 2
    Helsinki 84 7
    Auckland 84 5
    Dusseldorf 99 6

    100 Most Affluent World Metropolitan Areas: GDP per capita estimates for 2005 are provided for the 100 most affluent metropolitan areas in the world with more than 1,000,000 residents (Table 2).

    Dominance of the United States: It is perhaps not surprising that San Jose, California ranks as the richest major metropolitan area in the world, with a 2005 GDP per capita of $78,700. Number 2, however, is a surprise: Charlotte, NC-SC, which not only pirated away San Francisco’s largest bank some years ago and has now displaced the tony city by the Bay in the runner-up position. San Francisco and Washington, DC rank third and fourth most affluent in the world. Brussels, grown fat on the largesse of its European Union taxpayers, ranks 5th.

    The dominance of the United States is illustrated below.

    • The US has 8 of the 10 richest metropolitan areas in the world. Only Stockholm, at number 9, joins Brussels in the top 10 from outside the United States.
    • The US has 22 of the top 25 metropolitan areas (Figure)
    • 37 of the most affluent 50 metropolitan areas are in the United States. By contrast, Mercer ranks only seven US “cities” in the top 50.
    • 46 of the 70 richest metropolitan areas are in the United States

    Only one of the 51 US metropolitan areas with more than 1,000,000 fails to make the top 100 in the world, Riverside-San Bernardino ($25,800), which could just as easily be considered a part of the Los Angeles metropolitan area, just as San Jose could be considered a part of the San Francisco metropolitan area.

    Outside the United States: Outside the United States, the metropolitan areas of Australia and Canada perform best relative to their size. All five of Australia’s largest metropolitan areas placed in the top 100, with one in the top 50. Five of Canada’s six top metropolitan areas made the top 100, with one in the top 50. Europe placed 33 of its metropolitan areas in the top 100, with 11 in the top 50 and 22 in the second 50.

    The top 100 list provides some surprises.

    • One eastern European metropolitan area has already entered the top 100. Prague ranks 48th, with a GDP per capita of $42,400, which is more than Frankfurt or Phoenix.
    • London, arguably the world’s financial capital, ranks 44th, at $42,700. Some listings show London much higher, however such rankings exclude the outer portion of the metropolitan area, which these estimates include.
    • Tokyo-Yokohama ranks 79th, at $35,700. This ranking is lower than others, which either ignore purchasing power or exclude most of the metropolitan area by focusing only on the high income core (the prefecture of Tokyo).
    • The world’s two large “city-states,” Singapore and Hong Kong also make the list. Singapore ties Louisville and Sacramento at 53rd, with a GDP per capita of $41,500. Hong Kong ranks 79th, at $35,700. Moreover, it would not be surprising if other Chinese metropolitan areas begin to break into the top 100 over the next decade.

    Ranking Metropolitan Areas for People: American metropolitan areas provide their residents a superior standard of living. True enough, the mountains and water features of Vancouver or Zurich are superior to those of Oklahoma City or Charlotte. However, the average resident does not have enough money to spend much time boating in Vancouver or Zurich or taking in what may be a better cultural life. The standard of living may well be better for those with money in Vancouver, Vienna, Melbourne or Zurich than it is in an American metropolitan area. However, most people cannot afford to live like financiers and other “jet-setters.” For everyday people, the American metropolitan area remains the best place in the world to live.

    Table 2
    Top 100 World Metropolitan Regions 
    Gross Domestic Product per Capita: 2005 Estimates
    Purchasing Power Parity
    Metropolitan Areas over 1,000,000 Population
           
    Rank Nation Metropolitan Area GDP per Capita
    1 United States San Jose $78,700
    2 United States Charlotte $67,900
    3 United States San Francisco $65,400
    4 United States Washington $65,300
    5 Belgium Brussels $63,700
    6 United States Boston $59,000
    7 United States Seattle $57,600
    8 United States New York $56,200
    9 Sweden Stockholm $55,100
    10 United States Hartford $55,000
    11 United States Denver $54,700
    12 United States Minneapolis-St. Paul $54,600
    13 Germany Hamburg $53,500
    14 United States Dallas-Fort Worth $53,000
    15 United States Houston $51,900
    16 United States Indianapolis $51,800
    17 United States Philadelphia $50,100
    18 United States San Diego $50,000
    19 United States Atlanta $49,600
    20 United States Los Angeles $49,100
    21 United States Chicago $48,400
    22 United States Salt Lake City $48,200
    23 United States Milwaukee $47,800
    24 United States Nashville $47,700
    24 United States Columbus (Ohio) $47,700
    26 United States Las Vegas $47,400
    27 Austria Vienna $47,000
    28 Australia Perth $46,700
    29 United States Portland (Oregon) $46,600
    30 United States Kansas City $46,400
    31 United States Richmond $46,200
    32 United States Orlando $45,900
    32 United States Cleveland $45,900
    34 France Paris $45,700
    35 United States Memphis $45,500
    35 United States Detroit $45,500
    37 United States Austin $45,300
    37 United States Raleigh $45,300
    39 Ireland Dublin $44,300
    40 Germany Munich $43,800
    40 United States Baltimore $43,800
    42 United States Birmingham $43,500
    43 United States Miami $42,900
    44 United Kingdom London $42,700
    44 Denmark Copenhagen $42,700
    46 Canada Calgary $42,600
    46 United States Cincinnati $42,600
    48 Czech Republic Prague $42,400
    48 United States Phoenix $42,400
    50 Netherlands Utrecht $41,900
    51 Germany Frankfurt $41,800
    52 United States New Orleans $41,600
    53 United States Sacramento $41,500
    53 United States Louisville $41,500
    53 Singapore Singapore $41,500
    56 United States Pittsburgh $41,400
    57 Canada Ottawa $41,200
    57 United States Jacksonville $41,200
    59 Netherlands Amsterdam $41,000
    60 United States St. Louis $40,900
    61 France Lyon $40,400
    62 Australia Sydney $40,100
    63 Norway Oslo $40,000
    64 United States Rochester $39,900
    65 Italy Milan  $39,100
    66 United States Virginia Beach $39,000
    67 Canada Toronto $38,200
    68 Belgium Antwerp $37,900
    68 United States Tampa-St. Petersburg $37,900
    68 Australia Brisbane $37,900
    71 Canada Vancouver $37,600
    72 Australia Melbourne $37,100
    73 Japan Nagoya $37,000
    74 Switzerland Zurich $36,900
    75 United States Oklahoma City $36,800
    76 Germany Stuttgart $36,700
    77 United States Providence $36,100
    78 Germany Nuremburg $35,900
    79 Japan Tokyo-Yokohama $35,700
    79 China Hong Kong $35,700
    81 Netherlands Rotterdam-Hague $35,600
    82 Spain Madrid $35,500
    83 Italy Rome $35,400
    84 New Zealand Auckland $35,300
    84 Finland Helsinki $35,300
    86 Canada Edmonton $35,200
    87 Greece Athens $34,700
    88 Spain Bilbao $34,600
    89 France Toulouse $34,500
    90 Italy Turin $34,200
    90 United States San Antonio $34,200
    92 Australia Adelaide $33,500
    93 United States Buffalo $33,400
    94 Japan Shizuoka-Hamamatsu $32,500
    95 Spain Barcelona $32,300
    96 Japan Fukuoka-Kitakyushu $31,300
    97 Germany Cologne $31,000
    98 France Marseille $30,400
    99 Germany Essen-Dusseldorf $30,200
    100 Germany Hannover $29,900
    (1) Purchasing power parity. Metropolitan areas over 1,000,000 population for which data is available. Based upon data from Eurostat, US Bureau of Economic Analysis and Japan Statistics Bureau. 
    (2) US data for metropolitan areas from Bureau of Economic Analysis. Scaled to World Bank 2005 GDP PPP figure.
    (3) European data for metropolitan regions from Eurostat regional data. There is no generally accepted metropolitan area definition in Europe. Scaled to World Bank 2005 GDP PPP figure.
    (4) Japan data from Japan Statistics Bureau Scaled to World Bank 2005 GDP PPP figure.
    (5) London metropolitan area is Greater London plus the historic counties of Berkshire, Buckinghamshire, Essex, Herfordshire, Kent and Sussex (including unitary authorities), which are adjacent to the London green belt. Some London metropolitan region GDP estimates exclude suburban areas outside the Greater London Authority. This analysis includes these suburban areas, using GVA scaling from UK National Statistics to estimate non-metropolitan contribution included in Eurostat data (Bedfordshire, Oxfordshire, East Sussex and West Sussex).
    (6) Estimates for the following metropolitan areas scaled to 2005 from 2002 estimates using the closest available change estimate (metropolitan, state/provincial or nation) of the change in GDP per capita (http://www.demographia.com/db-gdp-metro.pdf): Metropolitan areas in Australia and Italy as well as Essen-Dusseldorf, Lyon, Marseille, Dublin, Auckland, Oslo, Zurich, Vancouver, Toronto and Ottawa.
    (7) Metropolitan area data for Calgary and Edmonton estimated from local sources.

    Note 1: Another problem with these kinds of rankings is that can be misleadingly unrepresentative. For example, Mercer ranks more than 200 “cities,” which sounds like a significant number. By cities, Mercer appears to mean municipalities (the website is unclear and Mercer has not responded to our request for clarification of what they mean by “city”), of which there are many in all first world metropolitan areas. Some have as few as 50,000 to 100,000 residents. Mercer ranks White Plains, New York (population: 57,000), in the New York metropolitan area, but has no ranking for the many larger cities in the metropolitan area, except for New York itself. Considering that the United States alone has nearly 275 municipalities of more than 100,000 population, the Mercer list appears to be far from comprehensive.

    Note 2: The national purchasing power parity conversion factor does not permit comparison of standards of living within nations. For example, anecdotal data would indicate that the cost of living is considerably higher in the San Jose, San Francisco and New York metropolitan areas than in the rest of the country. While not generally available, a purchasing power parity analysis within the United States could show metropolitan areas with lower GDPs per capita to have superior standards of living.

    Note 3: The European Union does not formally delineate metropolitan areas, however provides regional data that in most cases is a rough approximation of metropolitan areas.


    Wendell Cox is a Visiting Professor, Conservatoire National des Arts et Metiers, Paris. He was born in Los Angeles and was appointed to three terms on the Los Angeles County Transportation Commission by Mayor Tom Bradley. He is the author of “War on the Dream: How Anti-Sprawl Policy Threatens the Quality of Life.