Urban risk may be understood as a function of hazard, exposure, and vulnerability.1 In metro New Orleans, Katrina-like storm surges constitute the premier hazard (threat); the exposure variable entails human occupancy of hazard-prone spaces; and vulnerability implies the ability to respond resiliently and adaptively—which itself is a function of education, income, age, social capital, and other factors—after having been exposed to the hazard.
This essay measures the extent to which, after the catastrophic deluge triggered by Hurricane Katrina in 2005, residents of metro New Orleans have shifted their settlement patterns and how these movements may affect future urban risk.2 What comes to light is that, at least in terms of residential settlement geographies, the laissez faire rebuilding strategy for flooded neighborhoods proved to be exactly that.
“The Great Footprint Debate” of 2005-2006
An intense debate arose in late 2005 over whether low-lying subdivisions heavily damaged by Katrina’s floodwaters should be expropriated and converted to greenspace. Most citizens and nearly all elected officials decried that residents had a right to return to all neighborhoods. Planners and experts countered by explaining that a population living in higher density on higher ground and surrounded by a buffer of surge-absorbing wetlands would be less exposed to future storms, and would achieve a new level of long-term sustainability.
Despite its geophysical rationality, “shrinking the urban footprint” proved to be socially divisive, politically volatile, and ultimately unfunded. Officials thus had little choice but to abrogate the spatial oversight of the rebuilding effort to individual homeowners, who would return and rebuild where they wished based on their judgment of a neighborhood’s viability.
Federal programs nudged homeowners to return to status quo settlement patterns. Updated flood-zone maps from FEMA’s National Flood Insurance Program, for example, would provide actuarial encouragement to resettle in prediluvial spaces, while the federally funded, state-administered Louisiana Road Home Program’s “Option 1”—to rebuild in place, by far the most popular of the three options—provided grant money to do exactly that.
“Shrinking the urban footprint” became heresy; “greenspacing” took on sinister connotations; and rebuilding in flooded areas came to be valorized as a heroic civic statement. Actor Brad Pitt’s much-celebrated Make It Right Foundation, for example, pointedly positioned its housing initiative along a surge-prone canal, below sea level and immediately adjacent to the single worst Katrina levee breach, to illustrate that if a nonprofit “could build safe, sustainable homes in the most devastated part of New Orleans, [then it] would prove that high-quality, green housing could be built affordably everywhere.”3 Ignoring topography and hydrology gained currency in the discourse of community sustainability even as it flew in the face of environmental sustainability.
A Brief History of New Orleans’ Residential Settlement Patterns, 1718-2005
Topography and hydrology have played fundamental roles in determining where New Orleanians settled since the city’s founding in 1718. The entire region, lying at the heart of the dynamic deltaic plain of the Mississippi River, originally lay above sea level, ranging from a few inches along the marshy perimeter, to a few feet along an interior ridge system, to 8 to 12 feet along the natural levee abutting the Mississippi River.
From the 1700s to the early 1900s, the vast majority of New Orleanians lived on the higher ground closer to the Mississippi. Uninhabited low-lying backswamps, while reviled for their (largely apocryphal) association with disease, nonetheless provided a valuable ecological service for city dwellers, by storing excess river or rain water and safeguarding the city from storm surges. Even the worst of the Mississippi River floods, in 1816, 1849, and 1871, mostly accumulated harmlessly in empty swamplands and, in hindsight, bore more benefits than costs. New Orleanians during the 1700s-1900s were less exposed to the hazard of flooding because the limitations of their technology forced them to live on higher ground.4
Circumstances changed in the 1890s, when engineers began designing and installing a sophisticated municipal drainage system to enable urbanization to finally spread across the backswamp to the Gulf-connected brackish bay known as Lake Pontchartrain. A resounding success from a developmental standpoint, the system came with a largely unforeseen cost. As the pumps removed a major component of the local soil body—water— it opened up cavities, which in turn allowed organic matter (peat) to oxidize, shrink, and open up more cavities. Into those spaces settled finely textured clay, silt, and sand particles; the soil body thus compacted and dropped below sea level. Over the course of the twentieth century, former swamps and marshes in places like Lakeview, Gentilly, and New Orleans East sunk by 6-10 feet, while interior basins such as Broadmoor dropped to 5 feet below sea level. New levees were built along the lakefront, and later along the lateral flanks, were all that prevented outside water from pouring into the increasingly bowl-shaped metropolis.
Nevertheless, convinced that the natural factors constraining their residential options had now been neutralized, New Orleanians migrated enthusiastically out of older, higher neighborhoods and into lower, modern subdivisions. Between 1920 and 1930, nearly every lakeside census tract at least doubled in population; low-lying Lakeview increased by 350 percent, while parts of equally low Gentilly grew by 636 percent. Older neighborhoods on higher ground, meanwhile, lost residents: Tremé and Marigny dropped by 10 to 15 percent, and the French Quarter declined by one-quarter. The high-elevation Lee Circle area lost 43 percent of its residents, while low-elevation Gerttown increased by a whopping 1,512 percent.5
The 1960 census recorded the city’s peak of 627,525 residents, double the population from the beginning of the twentieth century. But while nearly all New Orleanians lived above sea level in 1900, only 48 percent remained there by 1960; fully 321,000 New Orleanians had vertically migrated from higher to lower ground, away from the Mississippi River and northwardly toward the lake as well as into the suburban parishes to the west, east, and south.6
Subsequent years saw additional tens of thousands of New Orleanians migrate in this pattern, motivated at first by school integration and later by a broader array of social and economic impetuses. By 2000, the Crescent City’s population had dropped by 23 percent since 1960, representing a net loss of 143,000 mostly middle-class white families to adjacent parishes. Of those that remained, only 38 percent lived above sea level.7
Meanwhile, beyond the metropolis, coastal wetlands eroded at a pace that would reach 10-35 square miles per year, due largely to two main factors: (1) the excavation through delicate marshes of thousands of miles of erosion-prone, salt-water-intruding navigation and oil-and-gas extraction canals, and (2) the leveeing of the Mississippi River, which prevented springtime floods but also starved the delta of new fresh water and vital sediment. Gulf waters crept closer to the metropolis’ floodwalls and levees, while inside that artificial perimeter of protection, land surfaces that once sloped gradually to the level of the sea now formed a series of topographic bowls straddling sea level.
When those floodwalls and levees breached on August 29, 2005, sea water poured in and became impounded within those topographic bowls, a deadly reminder that topography still mattered. Satellite images of the flood eerily matched the shape of the undeveloped backswamp in nineteenth-century maps, while those higher areas that were home to the historical city, quite naturally, remained dry.
But the stark geo-topographical history lesson could only go so far in convincing flood victims to move accordingly; after all, they still owned their low-lying properties, and real estate on higher terrain was anything but cheap and abundant. Besides, New Orleanians in general rightfully felt that they had been scandalously wronged by federal engineering failures, and anything short of full metropolitan reconstitution came to be seen as defeatist and unacceptable. Most post-Katrina advocacy thus focused on reinforcing the preexisting technological solutions that kept water out of the lowlands, rather than nudging people toward higher ground. “Shrink the urban footprint” got yelled off the table; “Make Levees, Not War” and “Category-5 Levees Now!” became popular bumper-sticker slogans; and “The Great Footprint Debate” became a bad memory.
Resettlement in Vertical Space
The early repopulation of post-Katrina New Orleans defied easy measure. Residents living “between” places as they rebuilt, plus temporarily broken-up families, peripatetic workers, and transient populations all conspired to make the city’s 2006-2009 demographics difficult to estimate, much less map. The 2010 Census finally provided a precise number: 343,829. By 2014, over 384,000 people lived in Orleans Parish, or eighty percent of the pre-Katrina figure. Of course, not all were here prior; one survey determined roughly 10 percent of the city’s postdiluvian population had not lived here before 2005.8
How had the new population resettled in terms of topographic elevation? We won’t know precisely until 2020, because only the decennial census provides actual headcounts aggregated at sufficiently high spatial resolution (the block level) for this sort of analysis; annual estimates from the American Community Survey do not suffice. Thus we must make do with the 2010 Census. While much has changed during 2010-2015, the macroscopic settlement geographies under investigation here had largely had fallen into place by 2010.
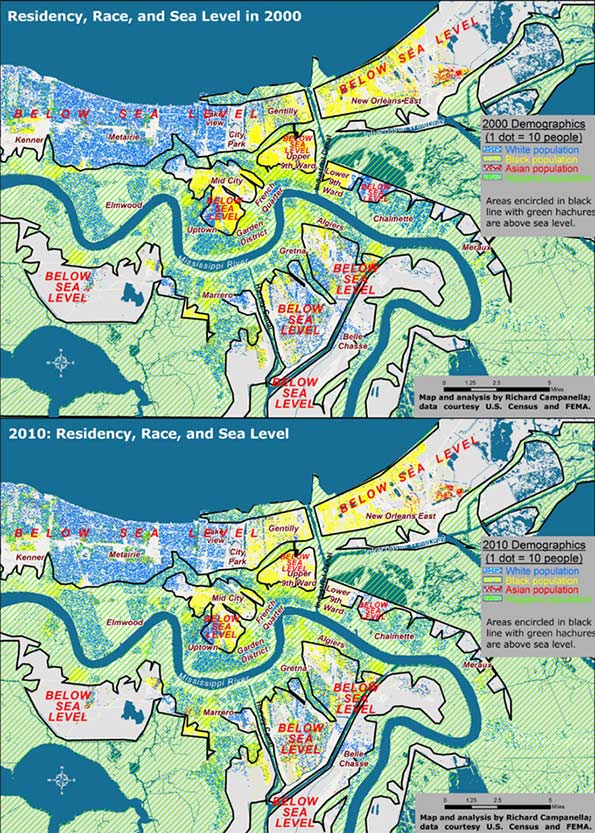
Figure 1. Residential settlement above and below sea level, 2000 and 2010; analysis and maps by Richard Campanella.
When intersected with high-resolution LIDAR-based digital elevation models, the 2010 Census data show that residents of metro New Orleans shifted to higher ground by only 1 percent compared to 2000 (Figure 1). Whereas 38 percent of metro-area residents lived above sea level in 2000, 39 percent did so by 2010, and that differentiation generally held true for each racial and ethnic group. Whites shifted from 42 to 44 percent living above sea level; African Americans 33 to 34 percent, Hispanics from 30 to 29 percent, and Asians 20 to 22 percent.
Clearly, elevation did not exercise much influence in resettlement decisions, and people distributed themselves in vertical space in roughly the same proportions as before the flood. Yet there is one noteworthy angle to the fact that the above-sea-level percentage has risen, albeit barely (38 to 39 percent): it marked the first time in New Orleans history that the percent of people living below sea level has actually dropped.
What impact did the experience of flooding have on resettlement patterns? Whereas people shifted only slightly out of low-lying areas regardless of flooding, they moved significantly out of areas that actually flooded, regardless of elevation. Inundated areas lost 37 percent of their population between 2000 and 2010, with the vast majority departing after 2005. They lost 37 percent of their white populations, 40 percent of their black populations, and 10 percent of their Asian populations. Only Hispanics increased in the flooded zone, by 10 percent, in part because this population had grown dramatically region-wide, and because members of this population sometimes settled in neighborhoods they themselves helped rebuild.
The differing figures suggest that while low-lying elevation theoretically exposes residents to the hazard of flooding, the trauma of actually flooding proved to be, sadly, much more convincing.
Resettlement in Horizontal Space
Contrasting before-and-after residential patterns in horizontal space may be done through traditional methods such as comparative maps and demographic tables. What this investigation offers is a more singular and synoptical depiction of spatial shifts: by computing and comparing spatial central tendencies, or centroids.
A centroid is a theoretical center of balance of a given spatial distribution. A population centroid is that point around which people within a delimited area are evenly distributed.9
Centroids capture complex shifts of millions of data with a single point. But they do not tell the entire story. A centroid for a high-risk coastal area, for example, may shift inland not because people have moved away from the seashore, but because previous residents decided not to return there. It’s also worth noting it takes a lot to move a centroid, as micro-scale shifts in one area are usually offset by countervailing shifts elsewhere. Thus, apparent minor centroid movements can actually be significant. Following are the centroid shifts for metro New Orleans broken down by racial and ethnic groups (Figures 2 and 3).
In 2000, five years before the flood, there were 1,006,783 people living within the metro area as delineated for this particular study, of whom 512,696 identified their race as white; 435,353 as black; 25,941 as Asian; and 50,451 as Hispanic in ethnicity. Five years after the flood, these figures had changed to 817,748 total population, of whom 416,232 were white; 327,972 were black; 27,562 were Asian, and 75,397 were Hispanic.10 When their centroids are plotted, they show that metro residents as a whole, and each racial/ethnic sub-group, shifted westward and southward between 2000 and 2010, away from the location of most of the flooding and away from the source of most of the surge, which generally penetrated the eastern and northern (lakeside) flanks of the metropolis.
Did populations proactively move away from risk? Not quite. What accounts for these shifts is the fact that the eastern half of the metropolis bore the brunt of the Katrina flooding, and the ensuing destruction meant populations here were less likely to reconstitute by 2010, which thus nudged centroids westward. Additionally, flooding from Lake Pontchartrain through ruptures in two of the three outfalls (drainage) canals disproportionally damaged the northern tier of the city, namely Lakeview and Gentilly. Combined with robust return rates in the older, higher historical neighborhoods along the Mississippi, as well as the unflooded West Bank (which sit to the south and west of the worst-damaged areas), they abetted a southwestward shift of the centroids. In a purely empirical sense, this change means more people now live in less-exposed areas. But, as we saw with the vertical shifts, the movements are more a reflection of passive responses to flood damage than active decisions to avoid future flooding.
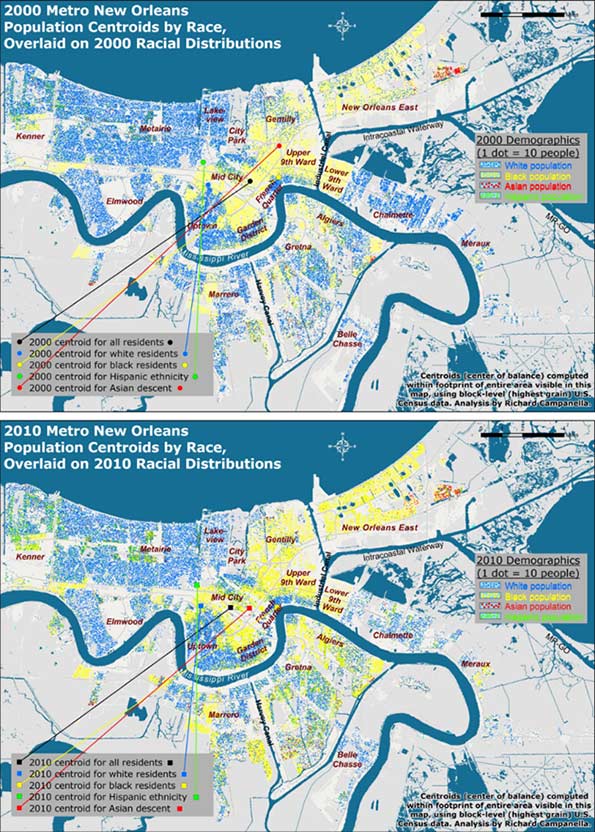
Figure 2. Population centroids by race and ethnicity for metro New Orleans, 2000-2010; see next figure for detailed view. Analysis and maps by Richard Campanella.
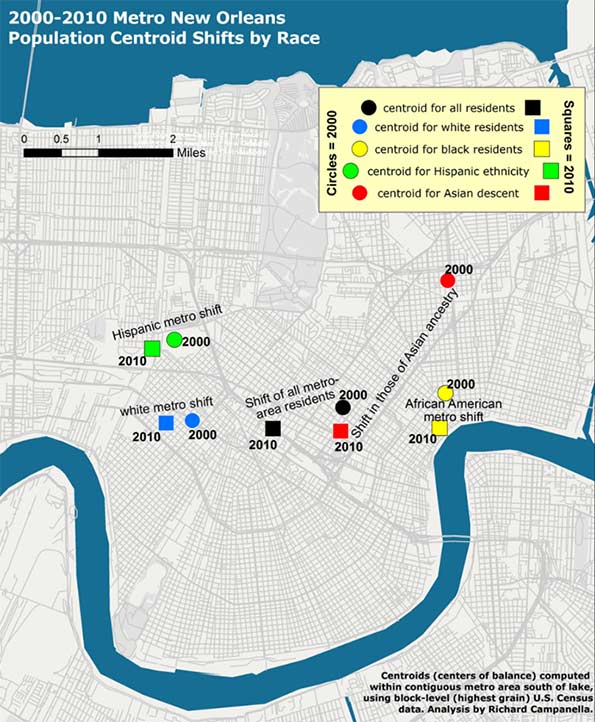
Figure 3. A closer look at the metro-area population centroid shifts by race and ethnicity, 2000-2010; analysis and map by Richard Campanella.
Reflections
Resettlement patterns in metro New Orleans have only marginally reduced residential exposure to the hazard of storm surge. In the vertical dimension, metro-area residents today occupy below-sea-level areas at only a slightly lower rate than before the deluge, 61 percent as opposed to 62 percent, although that change represents the first-ever reverse (decline) of the century-long drift into below-sea-level areas. Likewise, residents’ horizontal shifts, which were in southwestward directions, seemed to suggest a movement away from hazard, but these shifts were more a product of passive than active processes .
Metro New Orleans, it is important to note, has substantially reduced its overall risk—but mostly thanks to its new and improved federal Hurricane & Storm Damage Risk Reduction System (HSDRRS) rather than shifts in residences. No longer called a “protection” system, the Risk Reduction System is a $14.5 billion integrated network of raised levees, strengthened floodwalls, barriers, gates, and pumps built by the U.S. Army Corps of Engineers and its contractors to protect the metropolis from the surges accompanying storms with a 1-percent chance of occurring in any given year.11 The HSDRRD, which worked well during Hurricane Isaac’s surprisingly strong surge in 2012, has given the metropolis a new lease on life, at least for the next few decades. But all other risk drivers—the condition of the coastal wetlands, subsidence and sea level rise, social vulnerability, and, as evidenced in this paper, exposure—have either slightly worsened, only marginally improved, or generally remained constant.
The exposure-related patterns reported here reflect who won the “Great Footprint Debate” ten years ago.12 Months after Katrina, when it became clear that no neighborhoods would be closed and the urban footprint would persist, decisions driving resettlement patterns in the flooded region effectively transferred from leaders to homeowners. Rather inevitably, the laissez faire rebuilding strategy proved to be exactly that, and people generally repopulated areas they had previously occupied, though at markedly varied densities.
Ten years later, the resulting patterns are a veritable Rorschach Test. Some observers look to the 75-90 percent repopulation rates of certain flooded neighborhoods and view them as heroically high, proof of New Orleanians’ resilience and love-of-place. Others point to the 25-50 percent rates of other areas and call them scandalously low, evidence of corruption and ineptitude. Still others might point to the thousands of scattered blighted properties and weedy lots and concede—as St. Bernard Parish President David Peralta admitted on the ninth anniversary of Hurricane Katrina—that “we probably should have shrunk the footprint of the parish at the very beginning.”13
As for the HSDRRS, continual subsidence and erosion vis-à-vis rising seas, coupled with costly and as-yet undetermined maintenance and certification responsibilities, will gradually diminish the safety dividend provided by this remarkable system. The nation’s willingness to pay for continued upkeep, meanwhile, may grow tenuous; indeed, it’s not even a safe bet locally. Voters in St. Bernard Parish, which suffered near-total inundation from Katrina, defeated not once but twice a tax to pay for drainage and levee maintenance, a move that may well increase flood insurance rates.14
Residents throughout the metropolis appear to be repeating the same mistakes they made during the twentieth century: of dismissing the importance of natural elevation, of over-relying on engineering solutions, of under-maintaining these structures in a milieu of scarce funds, and of developing a false sense of security about flood “protection.”
We need to recognize the limits of our ability to neutralize hazards—that is, to presume that levees will completely protect us from storm surges—while appreciating the benefits of reducing our exposure to them. Beyond the metropolis, this means aggressive coastal restoration using every means available as soon as possible, an effort that may well require some expropriations. Within the metropolis, it means living on higher ground or otherwise mitigating risk. In the words of University of New Orleans disaster expert Dr. Shirley Laska, “mitigation, primarily elevating houses, is [one] way to achieve the affordable flood insurance…. It is possible to remain in moderately at-risk areas using engineered mitigation efforts, combined with land use planning that restricts development in high-risk areas.”15
Planning that restricts development in high-risk areas: this was the same reasoning behind the “shrink the urban footprint” argument of late 2005—and anything but the laissez faire strategy that ensued.
Bio
Richard Campanella, a geographer with the Tulane School of Architecture, is the author of “Bienville’s Dilemma,” “Geographies of New Orleans,” “Delta Urbanism,” “Bourbon Street: A History,” and other books. His articles may be read at http://richcampanella.com , and he may be reached at rcampane@tulane.edu or @nolacampanella on Twitter.
Acknowledgements
The author wishes to thank Gulf of Mexico Program Officer Kristin Tracz of the Walton Family Foundation, Dr. Shirley Laska, and the Gulf Coast Restoration Fund at New Venture Fund, and Tulane School of Architecture, as well as Garry Cecchine, David Johnson, and Mark Davis for their reviews.
1 David Crichton, “The Risk Triangle,” in Natural Disaster Management, edited by J. Ingleton (Tudor Rose, London, 1999), pp. 102-103.
2 In this paper, “metro New Orleans” means the conurbation (contiguous urbanized area shown in the maps) of Orleans, Jefferson, western St. Bernard, and upper Plaquemines on the West Bank (Belle Chasse); it excludes the outlying rural areas of these parishes, such as Lake Catherine, Grand Island, and Hopedale, and does not include the North Shore or the river parishes.
4 Richard Campanella, Bienville’s Dilemma: A Historical Geography of New Orleans and Geographies of New Orleans (University of Louisiana Press, 2006, 2008); R. Campanella, Delta Urbanism: New Orleans (American Planning Association, 2010); R. Campanella, “The Katrina of the 1800s Was Called Sauve’s Crevasse,” Times-Picayune, June 13, 2014, and other prior works by the author.
5 H. W. Gilmore, Some Basic Census Tract Maps of New Orleans (New Orleans, 1937), map book stored at Tulane University Special Collections, C5-D10-F6.
6 Richard Campanella, Bienville’s Dilemma: A Historical Geography of New Orleans (University of Louisiana Press, 2008) and other prior works by the author.
7 Coincidently, 38 percent of all residents of the contiguous metropolis south of Lake Pontchartrain also lived above sea level in 2000. Thus, at both the city and metropolitan level, three out of every eight residents lived above sea level and the other five resided below sea level. All figures calculated by author using highest-grain available historical demographic data, usually from the U.S. Census, and LIDAR-based high-resolution elevation data captured in 1999-2000 by FEMA and the State of Louisiana.
9 Defining the study area is essential when reporting centroids. New Orleans proper, the contiguous metro area, and the Metropolitan Statistical Area, which includes St. Tammany and other outlying parishes, would all have different population centroids. This study uses the metro area south of the lake shown in the accompanying maps. It is also important to use the finest-grain—that is, highest spatial resolution—demographic data to compute centroids, as coarsely aggregated data carries with it a wider margin of error. This study uses block-level data from the decennial U.S. Census, the finest available.
10 Figures do not sum to totals because some people chose two or more racial categories while others declined the question, and because Hispanicism is viewed by the Census Bureau as an ethnicity and not a race.
12 Richard Campanella, Bienville’s Dilemma: A Historical Geography of New Orleans (University of Louisiana Press, 2008), pp. 344-355.
13 David Peralta, as quoted by Benjamin Alexander-Bloch, “Hurricane Katrina +9: Smaller St. Bernard Parish Grappling with Costs of Coming Back,” Times-Picayune/NOLA.COM, August 29, 2014.
14 Mark Schleifstein, “St. Bernard Tax Defeat Means Higher Flood Risk, Flood Insurance Rates, Levee Leaders Warn,” Times-Picayune/NOLA.COM, May 4, 2015, http://www.nola.com/environment/index.ssf/2015/05/st_bernard_tax_defeat_means_hi.html ; see also Richard Campanella, “The Great Footprint Debate, Updated,” Times-Picayune/NOLA.COM, May 31, 2015.
15 Shirley Laska, email communication with author, April 12, 2015.
Editor’s note: following is an excerpt from Tulane University geographer Richard Campanella’s new book, “Bourbon Street: A History” (LSU Press, 2014), which traces New Orleans’ most famous and infamous space from its obscure colonial origins to its widespread reknown today. This chapter, titled “Replicating Bourbon Street: Spatial and Linguistic Diffusion” and drawn from a section called “Bourbon Street as a Social Artifact,” recounts how this brand has spread worldwide and become part of the language—to both the benefit and chagrin of New Orleans.
Perhaps the best evidence of Bourbon Street’s success is the fact that, like jazz, it has diffused worldwide. It’s a claim few other streets can make. As early as the 1950s, a nightclub named “Bourbon Street” operated in New York City, and apparently successfully, because in 1957 the Dupont family formed a corporation to purchase it with plans to bring “Mambo City” entertainment to clubs named Bourbon Street in Miami and Chicago.1 Today, at least 160 businesses throughout the United States and Canada have “Bourbon Street” in their names and themes; 77 percent are restaurants, bars, and clubs; 11 percent are retailers (mostly of party and novelty items); and the remainder are caterers, banquet halls, hotels, and casinos—more eating, drinking, and entertaining. They span coast to coast, from Key West to Edmonton and from San Diego to Montreal. Greater New York has eleven, while Calgary has six, as does San Antonio (mostly near the River Walk, “the Bourbon Street of San Antonio”). Greater Toronto has sixteen, most of them franchises of the Innovated Restaurant Group’s “Bourbon St. Grill” chain—including one on Yonge Street, which has been described as “the Bourbon Street of Toronto.” There are also Bourbon-named restaurants, bars, and clubs in London, Amsterdam, Hamburg, Naples, Moscow, Tokyo, Shanghai, Dubai, and many other world cities. These replicas enthusiastically embrace Bourbon Street imagery and material culture (lampposts, balconies, Mardi Gras jesters, beads) in their signage, décor, and Web sites. Menus attempt to deliver the spice and zest deemed intrinsic to this perceptual package, as does the atmospheric music. How convincingly do these meta-Bourbons replicate the original? A review of one such venue in Amsterdam (“the New Orleans of Europe”) could easily apply to the actual street:
[T]he jovial Bourbon Street Jazz and Blues Club…attracts a casual, jean-clad crowd of all ages [dancing to] cover bands with a pop flavor [or] blues rhythms. Three glass chandeliers hanging over the bar provide an incongruous dash of glamour to an otherwise low-key and comfortable scruffy décor.2
In this spatial dissemination we see a trend: while local replication of the Bourbon Street phenomenon usually takes the form of competition tinged with contempt (witness the “anti-Bourbons”), external replicas of Bourbon Street view themselves as payers of homage to the “authentic” original, and modestly present themselves as the next best thing without the airfare. No licenses are needed in replicating Bourbon Street; there are no copyrights, trademarks, or royalties due. The name, phenomenon, and imagery are all in the public domain, a valuable vernacular brand free for anyone to appropriate. Try doing that to The New Orleans Jazz and Heritage Festival Presented by Shell and you’d have a lawsuit on your hands.
Bourbon is also among the few streets to be replicated structurally—by the State of Louisiana, which sponsored a three-acre exhibit at the 1964 World’s Fair in Queens, New York. It featured all the standard architectural tropes of the French Quarter topped off with a huge arch emblazoned LOUISIANA’S BOURBON STREET accompanied by towering Carnival royalty. In typical Louisiana fair tradition, however, the exhibit experienced construction delays and filed for bankruptcy, which caused the state to wash its hands of the fiasco and officially change the name of the exhibit to “Bourbon Street.” “The so-called Louisiana area in its present condition,” state officials solemnly proclaimed, “reflects discredit upon the State of Louisiana, its culture, heritage and people.” Wags pointed out that this was pretty much what locals thought of the original Bourbon Street. But unlike the original, a corporate entity named Pavilion Properties, Inc. took over the exhibit, and after removing all references to Louisiana and spiffing up the props, it managed the Creole food booths, Dixieland trios, sketch artists, organ grinders, street performers, and nightclubs (including the popular “Gay New Orleans”) for the remainder of the fair. Also unlike the original, Pavilion Properties’ exhibit, just like the state’s attempt, failed commercially and also filed for bankruptcy. Nevertheless, it introduced a generation of New Yorkers to the Bourbon Street brand.3
At the opposite end of the country two years later, another private-sector entity built a “New Orleans Square” at Disneyland. Based on field research conducted in the French Quarter by Walt Disney himself plus a staff of artists in 1965, the $13.5 million West Coast replica (nearly the cost of the Louisiana Purchase, Disney joked) eschewed the Bourbon moniker, presumably not to scare off parents, but nevertheless incorporated everything that worked on the real Bourbon Street minus the breasts and booze. Disney later replicated New Orleans Square at its Adventureland in Tokyo (1983), which may partly explain the popularity of the real New Orleans with Japanese visitors today. It did not, however, build a New Orleans Square at Disneyland Paris (Euro Disney) when it opened in 1992.4
Bourbon Street has also been thematically and structurally referenced in countless shopping malls, amusement parks, casinos, cruise ship parties, festivals, convention banquets, and wedding receptions, not to mention on film and theatrical sets and in computer animation for movies like The Princess and the Frog. “Bourbon Street” as an adjective has found its way onto menus, usually for spicy dishes, and into household décor, generally to describe old-world filigree inspired by the iron-lace balconies. It’s a case study of cultural diffusion which serves as free worldwide advertising for the original, across various media forms and demographic cohorts, all with zero encouragement and oversight from Bourbonites. Now that’s success.
Imitation may be the sincerest form of flattery, but it also produces competition. Once there was a time when the forbidden pleasures available on Bourbon Street were in high demand and low supply nationwide, particularly in the South. That made Bourbon Street valuable. Today the nation is a whole lot less judgmental about pleasure and much better supplied with comparable pleasure districts. A visit to Galveston’s The Strand, St. Louis’ Soulard, and Mobile’s Dauphine Street, all of which have adopted Bourbon-style Mardi Gras, may satisfy many people’s desire for the escapism that Bourbon Street once monopolized. Even just a few blocks away in downtown New Orleans, Harrah’s has quietly overseen the creation of a Bourbon alternative on the Fulton Street Mall, complete with outdoor dining, festival space, and a growing inventory of venues, all adjacent to the corporation’s hotel and casino. Might such meta-Bourbons erode the market share of the original, in the same way that regional casinos have chipped away at Las Vegas’ domination? Bourbonites would be ill-advised to rely on their fame; better to experiment with innovations, rediscover what worked in the past, and tame that which damages. That said, The Street does have certain inherent advantages: it’s bigger and longer than the competition; it’s embedded into the world-famous French Quarter and enjoys a symbiotic relationship with its tourism industry; and perhaps most importantly, it boasts that intimate historical streetscape and centuries-old civic reputation that infuses in visitors a certain credibility—shall we call it authenticity?—in a way unmatched by places like Las Vegas. On a dark note, Bourbon is also disturbingly vulnerable to accidental or intentional trauma, such as a balcony collapse, crowd stampede, or terrorist bombing, which, in addition to the human toll, could poison The Street’s allure for years. Bourbon, in short, has bright prospects and a record of widespread economic and cultural influence, but should not take its fame and success for granted.
Speaking of cultural influence, Bourbon Street has entered the language of American English, which, curiously, does not have a perfect word for the Bourbon Street phenomenon. Shall we call it an adult entertainment area? A cluster? A strip? A pedestrian mall? A tenderloin, red-light, or vice district? All are awkward, some are imprecise, and none are perfect. The linguistic lacuna is particularly perplexing because nearly every city since Sybaris has developed such spaces.
To fill the gap, some speakers convert common nouns into proper toponyms; examples include Las Vegas’ The Strip, Baltimore’s The Block, and historic New Orleans’ The Swamp or The Line. Others craft “antonamasias,” which, in rhetoric, are attempts to describe the characteristics of a new phenomenon by invoking the name of a comparable known entity, e.g., “the Paris of…,” “the Barbary Coast of…,” “the Greenwich Village of….”5 The antonamasia “the Bourbon Street of….” is among the most popular ways for Americans to refer efficiently and effectively to pedestrian-scale drinking, eating, and entertainment districts. It’s exceedingly common to hear 6th Street, for example, described as the Bourbon Street of Austin. Ybor City is routinely characterized as the Bourbon Street of Tampa, as is Carson Street of Pittsburgh, and Duval Street of Key West (or of the entire Caribbean). Beale Street was completely redeveloped by a real estate corporation in the 1980s from a boarded-up eyesore to become, inevitably, the Bourbon Street of Memphis. A review of 67 published articles since 1986, plus over 300 Internet sources, showed that at least eighty social spaces worldwide have been described as “the Bourbon Street of” their respective communities. They span from Hamburg’s Reeperbahn to Bangkok’s Patpong; from Spain’s Pamplona during the Running of the Bulls to Las Ramblas in Barcelona, from Quay Street in Galway to Lan Kwai Fong in Hong Kong. They are not always urban; sometimes the phrase it used for frisky beaches at vacation destinations, for boating coves (most notoriously in Lake of the Ozarks, a popular rendezvous for nudity and inebriation), or the Mall of America in Minneapolis, the entire town of Hyannis (“the Bourbon Street of the Cape”) or the city of Ogden (“the Bourbon Street of Utah,” historically). Some use it as a warning (“Let’s not turn the Underground into the Bourbon Street of Atlanta”) or as an ambition (“the big goal is for the Mill Avenue District to become the Bourbon Street of the Southwest”). The phrase even found a home in its own backyard; a travel writer called “Jackson Square…the Bourbon Street of daytime New Orleans,” and the Times-Picayune dubbed the Fulton Street Mall as “the Bourbon Street of the [1984] world’s fair.” Some uses emphasize the spatial clustering over the piquant aspect (“Canyon Road [is] the Bourbon Street of Santa Fe’s art scene”); others do the exact opposite: “USA Network [is] the Bourbon Street of basic cable;” “Louisiana Fried Chicken [is] the Bourbon Street of chicken.”6
One would be hard-pressed to think of another street so richly representational. The very matriculation of a street to metaphor status is fairly rare. To be sure, we speak of Wall Street to mean corporate power, Madison Avenue to mean marketing, and Broadway for theater, but as we go further down the list, we find fewer linguistic uses and users. Bourbon Street is one of the American English language’s handiest and most evocative place metaphors, a testament to The Street’s widespread renown and iconic resonance.
Richard Campanella, a geographer with the Tulane School of Architecture, is the author of Bienville’s Dilemma, Geographies of New Orleans, Lincoln in New Orleans, and Bourbon Street: A History (LSU Press, 2014), from which this article was excerpted. Please see the book for sources. Campanella may be reached through http://richcampanella.com or rcampane@tulane.edu ; and followed on Twitter at @nolacampanella.
1 “Dupont Dough Backs Murphy,” Billboard, December 2, 1957, p. 19.
2 Corinne LaBalme, “Night Moves of All Kinds: The Club Scene in Seven Cities—Amsterdam,” The New York Times, September 17, 2000.
3 Francis Stilley, “Visitors to World’s Fair Will ‘Ride Magic Carpet,’ Times-Picayune, April 15, 1964; “Hot Flashes,” Times-Picayune, May 31, 1964, p. 37; Charles M. Hargroder, “Governor, Firm Announce Plant,” Times-Picayune, June 17, 1964, pp. 1-16; Richard Phalon, “Bourbon Street Operator at Fair Is 11th Bankrupt Exhibitor,” New York Times, February 5, 1965, p. 32.
4 “Disneyland N.O. Replica, Aim,” Times-Picayune, April 11, 1965, p. 17.
5 I thank sociolinguist Christina Schoux Casey for informing me of this obscure but useful term.
6 Research by author using hundreds of news and online sources, 1986-present, searched throughout 2012.
Ever since the Great Recession ripped through the economies of the Sunbelt, America’s coastal pundit class has been giddily predicting its demise. Strangled by high-energy prices, cooked by global warming, rejected by a new generation of urban-centric millennials, this vast southern region was doomed to become, in the words of the Atlantic, where the “American dream” has gone to die. If the doomsayers are right, Americans must be the ultimate masochists. After a brief hiatus, people seem to, once again, be streaming towards the expanse of warm-weather states extending from the southeastern seaboard to Phoenix.
Since 2010, according to an American Community Survey by demographer Wendell Cox, over one million people have moved to the Sunbelt, mostly from the Northeast and Midwest.
Any guesses for the states that have gained the most domestic migrants since 2010? The Sunbelt dominates the top three: Texas, Florida and Arizona. And who’s losing the most people? Generally the states dearest to the current ruling class: New York, Illinois, California and New Jersey. Some assert this reflects the loss of poorer, working class folks to these areas while the “smart” types continue to move to the big cities of Northeast and California. Yet, according to American Community Survey Data for 2007 to 2011, the biggest gainers of college graduates, according to Cox, have been Texas, Arizona and Floria; the biggest losers are in the Northeast (New York), the Midwest (Illinois and Michigan).
For the most part, notes demographer Cox, this is not a movement to Tombstone or Mayberry, although many small towns in the south are doing well, this is a movement to Sunbelt cities. Indeed, of the ten fastest growing big metros areas in America in 2012, nine were in the Sunbelt. These included not only the big four Texas cities—Austin, Houston, Dallas-Ft. Worth, San Antonio—but also Orlando, Raleigh, Phoenix, and Charlotte.
Perhaps the biggest sign of a Sunbelt turnaround is the resurgence of Phoenix, a region devastated by the housing bust and widely regarded by contemporary urbanists as the “least sustainable” of American cities. The recovery of Phoenix, appropriately named the Valley of the Sun, is strong evidence that even the most impacted Sunbelt regions are on the way back.
A look at the numbers on domestic migration undermines the claim that most Americans prefer, like the pundit class, to live in and near the dense Northeastern urban cores. People simply continue to vote with their feet. Since 2000, more than 300,000 people have moved to Atlanta, Dallas, Houston, and Charlotte; in contrast a net over two million left New York and 1.4 million have deserted the LA area while over 600,000 net departed Chicago and almost as many left the San Francisco Bay region. These trends were slowed, but not reversed, by the Great Recession.
The Sunbelt’s recovery seems likely to continue in the future. Immigrants, who account for a rising proportion of our population growth, are increasingly heading there. New York remains the immigrant leader, with the foreign-born population increasing by 600,000 since 2000 but second place Houston, a relative newcomer for immigrants, gained 400,000, more than Chicago and the Bay Area combined. The regions experiencing the highest rate of newcomers were largely in the south; Charlotte and Nashville saw their foreign-born populations double as immigrants increasingly beat a path to the Sunbelt cities.
The final demographic coup for the Sunbelt lies in its attraction for families. Eight of the eleven top fastest growing populations under 14, notes Cox, are found in the Sunbelt with New Orleans leading the pack. Generally speaking, roughly twenty percent or more of the population of Sunbelt metros are under 14, far above the levels seen in the rustbelt, the Left Coast, or in the Northeast.
This all suggests that the Sunbelt is cementing, not losing, its grip on America’s demographic future. By 2012 and 2017, according to a survey by the manufacturing company Pitney Bowes nine of the ten leading regions in terms of household growth will be in the Sunbelt.
If the population growth rates predicted by the US Conference of Mayors continue, Dallas-Ft. Worth will push Chicago out of third place among American metropolitan areas in 2043, with Houston passing the Windy City eight years later. Now seventh place Atlanta would move up to sixth place and Phoenix to 8th. Of America’s largest cities then, five would be located in the Sunbelt, and all are expected to grow much faster than New York, Los Angeles or the San Francisco area. Overall, the South would account for over half the growth in our major metropolitan areas in 2042, compared to barely 3.6 percent for the Northeast and 8.7 percent in the Midwest.
What drives the change? Not just the sun, but the economy, stupidos!
From the beginning of the Sunbelt ascendency, sunshine and warm weather have been important lures and this may even be more true in the near future. But the key forces driving people to the Sunbelt are largely economic—notably job creation, lower housing prices and lower costs relative to incomes.
Until the housing bust, states like Arizona, Nevada and Florida were typically among the leaders in creating new jobs but their performance fell off with the decline of construction. But other Sunbelt locales, notably Texas, Louisiana and Oklahoma have picked up much of the slack. This resurgence has been centered in Texas, which created nearly a million new jobs between 2007 and 2013. In contrast, arch-rival California has lost a half a million.
Many other Sunbelt states have yet to recover jobs lost from the recession, but most of their big metros have shown strong signs of recovery. Since 2007 five of the seven fastest growing jobs markets among the twenty largest cities were in Sunbelt states. Looking forward, recent estimates of job growth between 2013 and 2017, according to Forbes and Moody’s project employment to grow fastest in Arizona, followed by Texas. Also among the top ten are several states hit hard by the Recession, notably Florida, Georgia and Nevada. No Northeastern state appeared anywhere on the list; nor did California.
For all its shortcomings, including what some may consider the overuse of tax breaks and incentives, the much-dissed Sunbelt development model continues to reap some significant gains. The area’s history of lagging economically has long spurred Sunbelt economic developers to utilize a policy of light regulation, low taxes and lack of unions to lure businesses to their area. Sunbelt states—Texas, Florida, the Carolinas, Tennessee, Arizona—dominate the ranks of the most business friendly states in the union, notes Chief Executive magazine, findings they often cite when courting footloose businesses.
The clear economic capital of the Sunbelt is now Houston, with some stiff competition from Dallas-Ft. Worth. Houston, the energy capital, now ranks second only to New York in new office construction and is the overall number one for corporate expansions. There are fifty new office buildings going up in the city, including Exxon Mobil’s campus, the country’s second largest office complex under construction (after New York’s Freedom Tower). Chevron, once Standard Oil of California, has announced plans to construct a second tower for its downtown Houston campus while Occidental Petroleum, founded more than fifty years ago in Los Angeles, is moving its headquarters to Houston.
Houston’s ascendance epitomizes the shift in the geographic and economic center of the Sunbelt. The “original in the Xerox machine” for Sunbelt style growth, Los Angeles’ rise was powered by new industries like entertainment and aerospace and oil, ever expanding sprawl and a strong, tightly knit business elite. Pleasant weather and Hollywood glitz still inform the image of Los Angeles, but under a regime dominated by government employee unions, greens and developers of dense housing, it suffers unemployment almost four points higher than Houston . Nine million square feet of space is currently being built in Houston, compared to just over one million in Los Angeles-Orange which has more than twice the population. It is not in the rising Sunbelt but in places like Southern California, where jobs lag amidst high costs, that the American dream now seems most likely to die.
Movin’ on Up
In Houston particularly but throughout the Sunbelt, job growth critically is not tied to cheap labor, but to industries like energy which pay roughly $20,000 more than those in the information sector. According to EMSI, a company that models labor market data, energy has generated some 200,000 new jobs in Texas alone over the past decade. Although Houston is the primary beneficiary, the American energy boom is also sparking strong growth in other cities, notably Dallas-Ft. Worth, San Antonio, and Oklahoma City.
Once dependent on low-wage industries such as textiles and furniture, the energy boom is pacing a Sunbelt move towards generally better paying heavy manufacturing. Texas and Louisiana already lead the nation in large new projects, many of them in petrochemicals and other oil-related production. Of the biggest non-energy investments, three of the top four, according to the Ernst and Young Investment Monitor, are in Tennessee, Alabama and South Carolina, which are becoming the new heartland of American heavy manufacturing, notably in automobiles and steel. Since 2010, Birmingham, Houston, Nashville and Oklahoma city all have enjoyed double digit growth in high paying industrial jobs that used to be the near exclusive province of the Great Lakes, California and the Northeast.
The Sunbelt resurgence is important in part because it offers some hope to millions of Americans who may not have gone to Harvard or Stanford, but have work skills and ambition. The region’s growth in what might be called “middle skilled jobs” that pay $60,000 or above has been impressive.
It may come as a surprise to some, but the Sunbelt is also pulling ahead in high tech jobs. In a recent analysis of STEM (science, technology, engineering and mathematics) job growth for Forbes we found that out of out of the 52 largest regions, the four most rapid growers over the past decade were Austin, Raleigh, Houston and Nashville, with Jacksonville, Phoenix and Dallas also in the top fifteen. In contrast New York ranked #36th out of 52 and Los Angeles, a long-time tech superpower, now a mediocre #38.
In another example of how much things are changing, when college students in the South now graduate, noted a recent University of Alabama study, they do go to the “big city” but their top four choices outside the state are in the Sunbelt—Atlanta, Houston, Nashville, Tenn., and Dallas—and followed then by New York. The biggest net gains in people with BAs and higher are primarily in the sunbelt, led by Phoenix, Houston, Dallas-Ft. Worth, Austin, Houston and San Antonio; the biggest losers, according to Cox’s calculations, have been New York, Los Angeles, Chicago and, surprisingly given its reputation, Boston.
These trends may become more pronounced as the current millennial generation starts settling down into family life. Housing costs could prove a decisive factor. In terms of the median multiple, median housing cost as share of median household income, Sunbelt cities tend to be about half as expensive as New York, Boston or Los Angeles, and one third of the Bay Area.
To be sure, many of the “best and brightest” will continue to flock to New York, the Bay Area or Los Angeles, but many more—particularly those without Ivy degrees or wealthy parents—may migrate to those places where their paycheck stretches the furthest. The Sunbelt, with its job growth, strong middle class wages and lows housing costs, is a good bet for the future.
What will the future bring?
Prosperity, Herodotus reminded us, “never abides long in one place.” Certainly the Sunbelt economy could lose its current momentum but fortunately, having been schooled by the housing bust, many Sunbelt communities are increasingly focused on improving their basic economy—jobs, income growth, and skills-based education. Tennessee and Louisiana, for example, have led the way on expanding working training, and some of most ambitious education reform is taking place in New Orleans and Houston.
Yet, there are many threats to continued growth, both internal and external. Given his penchant for executive orders and his close ties to wealthy green donors, President Obama could take steps—for example clamping down on fossil fuel development—that could reverse the steady growth along the Gulf Coast. Any draconian shift on climate change policies would be most detrimental to the energy sector Sunbelt states.
But President Obama will not be in office forever. In the long run, the biggest threat to the Sunbelt ascendency is internal. Some fear that as more easterners and Californians flock to the area, they will bring with them a taste for the very regulatory and tax policies that have stifled growth in the states they left behind . Most worryingly, so called “smart growth” regulations could drive housing costs up, as occurred in Florida and several other states in the last decade, and erode some of the Sunbelt’s competitive advantage.
Perhaps the most immediate threat comes from the angry, reactionary elements on the right, who tend to be more powerful in the sunbelt than elsewhere. These groups, sometimes including the Tea Party, have taken positions on issues like immigration and gay rights that local business leaders fear could deprive their regions of energetic and often entrepreneurial newcomers. Equally important, the right’s anti-tax orthodoxy, although perhaps not as devastating as the huge burdens placed on middle class individuals in the North and California, could delay critical outlays in transportation, parks and other essential infrastructure in regions that are growing rapidly. This is particularly true of education, a field in which most Sunbelt cities, while gaining ground, remain below the national average.
Whatever one thinks of the motivations of the green clerisy, there are clearly environmental measures, particularly in the Sunbelt’s western regions, that these cities need to enact to protect future growth. This includes reducing the amount of concrete that creates “heat islands,” expanding parks, and shifting to more drought resistant plants.
Fortunately, many leaders throughout the Sunbelt, particularly in its cities, are aware of these challenges, and are looking for ways to tackle them. This is driven not by the doomsday environmentalism common in California and Northeast, but grows instead out of a practical concern with stewarding critical resources and creating the right amenities to foster continued growth.
Combined with basics like lower housing costs and taxes, it’s a common optimism about the future that really underlies the resurgence now occurring from Phoenix to Tampa. The long-term shifts in American power and influence that have been underway since the 1950s have not been halted by the housing bust. Disdained by urban aesthetes, hated by much of the punditry, and largely ignored except for their failings in the media, the Sunbelt seems likely to enjoy the last laugh when it comes to shaping the American future.
This story originally appeared at The Daily Beast.
Joel Kotkin is executive editor of NewGeography.com and Distinguished Presidential Fellow in Urban Futures at Chapman University, and a member of the editorial board of the Orange County Register. He is author of The City: A Global History and The Next Hundred Million: America in 2050. His most recent study, The Rise of Postfamilialism, has been widely discussed and distributed internationally. He lives in Los Angeles, CA.
Houston skyline photo by Bigstock.
Last week’s conviction of former New Orleans Mayor Ray Nagin on 20 charges of bribery and fraud marks the end of a tumultuous era in the city’s history, and perhaps also the beginning of a new era in American urban politics. Perhaps most remarkable was the almost total lack of protest in New Orleans over the downfall of Nagin, who had relied heavily on polarizing racial politics in his last five years in office.
This is among the many hopeful signs in the Crescent City and its environs. Over the past year as I’ve put together a report on the future of New Orleans, I have seen a city once described by Joel Garreau in his Nine Nations of North America (1981)as a “marvelous collection of sleaziness and peeling paint,” clean up its politics, restart and diversify its economy, and begin the slow process of reducing its deep-seated crime problem.
In the past, the “pay to play” politics and corruption epitomized by Nagin and former congressman William Jefferson were widely winked at in New Orleans as if it were just local color. “We like our politics like our rice — dirty,” a Katrina evacuee in Houston once told me with a knowing smile.
Katrina changed that. The natural disaster was made far worse by the corruption and incompetence of virtually every key institution, starting with police and the levee boards. With the city largely underwater and much of its population forced to flee, some urban experts, such as Harvard’s Ed Glaeser, wondered if we would be better off to encourage people to leave the area permanently, perhaps with vouchers, to seek a better life elsewhere.
Yet it is here that the real turnaround began. Business leaders, who had seen Nagin as an ally during his first term, realized he was not up to the extraordinary challenges posed by the disaster. The man who some called “Ray Reagan” for his business-friendly policies was morphing into the worst kind of racial demagogue, a kind of bayou version of Coleman Young or Sharpe James. His appeal to keep New Orleans a “chocolate city” and his now well-documented graft frustrated those who wanted to revive the city and its surrounding region.
“When Nagin came in, he was seen as a reformer,” recalls Greg Rusovich, former chairman of the New Orleans Business Council, which includes 70 of the Crescent City’s largest businesses. “But after Katrina he really turned into a racial politician and surrounded himself with incompetents.”
This incompetence, Rusovich suggests, slowed New Orleans’ recovery as Nagin proved unable to help direct the massive federal aid, and the many private donations, that came into the city. Eventually, voters tired of poor public services and began to demand a more competent regime.
The current mayor, Mitch Landrieu, first elected in 2010 and easily re-electedwith strong black support this month, has brought a climate of technocratic competence to the city. With the active backing of business leaders, the city has attracted large-scale corporate investment, including a 300-person General Electric software development center, as well as a surge of videogame and entertainment companies.
This growth was in large part sparked by a steady movement of young, educated people into the city. For decades, New Orleans’ “best and brightest” tended to move elsewhere; now the flows for the Crescent City have turned positive, including from the West Coast and the Northeast. By last year, theAtlantic Cities, the leading mouthpiece for “hip” urbanism, proclaimed New Orleans potentially the nation’s “next great innovation hub.”
Yet for all the hoopla surrounding the growth in the information sector, it is unlikely to be enough to sustain the New Orleans region’s recovery. Not only are the total numbers of such jobs still small, in the realm of 2,600 for entertainment, STEM employment is lower than a decade ago due to cutbacks at the NASA facilities at Michoud as well as in aerospace. More important, the growth of tech and entertainment jobs will likely be insufficient to address the fundamental issues of race and poverty that have bedeviled the city throughout much of its history.
Today, in part due to the return of evacuees, the poverty rate for the metro area stands at 19%, close to the pre-Katrina level and well above the national average of 15%. The differential between white and black incomes is some $6,000 per household above the national average and some observers, including many African-Americans, fear that the gentrification of parts of the city is reinforcing the class and racial divides that existed before the flood.
Many African-Americans, notes city employee Lydia Cutrer, have “trust issues after many broken promises, and feel like outsiders are taking over.” Or, as Sherby Guillory, a health care worker who now lives in Houston, described the recovery efforts: “They want to build a shining city on a hill, but without the people.”
Ultimately, to deal with these concerns, New Orleans needs to focus on the industries that drove its economy for much of its history: energy and trade. These are the primary providers of high-wage jobs, many of which are blue collar. The New Orleans area lost energy jobs from 2007-12, in part due to the Gulf drilling moratorium in the wake of the BP disaster, but activity is rising again and low natural gas prices have prompted a surge in chemical and refinery investment in south Louisiana.
A recent report by the Greater New Orleans Community Data Center concluded that over 10,000 energy, petrochemical and related advanced manufacturing jobs could be added in the region by 2020; in contrast the digital media sector was projected to expand by roughly 2,200 positions. Finding ways to accelerate this development, while using new revenues to shore up the fragile ecosystem, needs to become the primary focus of new development efforts.
This vision for post-Katrina New Orleans will no doubt meet opposition from those who would like the city to evolve into a humid, southern version of San Francisco. Yet this makes little sense for a place whose history, location and ethnic heritage suggest a more economically diverse future. Having survived Katrina and Ray Nagin, the next task should be to see how to make sure that the recovery reaches into those neighborhoods that have historically been left behind. Rather than stand only as a charming artifact of its past, New Orleans can become a role model in showing how cities can not only survive, but create a prosperous future.
This piece originally appeared at Forbes.
Joel Kotkin is executive editor of NewGeography.com and Distinguished Presidential Fellow in Urban Futures at Chapman University, and a member of the editorial board of the Orange County Register. He is author of The City: A Global History and The Next Hundred Million: America in 2050. His most recent study, The Rise of Postfamilialism, has been widely discussed and distributed internationally. He lives in Los Angeles, CA.
New Orleans photo courtesy of Jon Sullivan.
This is the executive summary from a new report Sustaining Prosperity: A Long Term Vision for the New Orleans Region, authored by Joel Kotkin for Greater New Orleans, Inc. Download the full report from GNO, Inc. here: gnoinc.org/sustainingprosperity
The recovery of greater New Orleans represents one of the great urban achievements of our era. After decades of slow economic, political and social decline, hurricane Katrina seemed a kind of coup de grâce, smothering the last embers of the region’s vitality. In the fall of 2005 it was entirely logical to see New Orleans as just a potential exemplar of failed urbanization, much as we might see in Detroit1, Cleveland, and a host of other once great cities – for example Naples, Lisbon, Antwerp and Osaka – that have tumbled from their once great importance.2
Yet in New Orleans’ case, disaster engendered not continued decline, but the revival of the entire region, its economy, and social and political institutions. Like Chicago after the great fire of 1871, San Francisco in the wake of the 1906 earthquake and fire, or New York following 9-ll, New Orleans has rebounded in ways that have defied expectations.
Critical to making New Orleans a resilient city has been the transformation of the civic culture. This has much to do with the commitment of New Orleanians to their city – like Chicagoans, New Yorkers and San Franciscans in the past. “A city,” notes urban historian Kevin Lynch,” is hard to kill if it possesses unique cultural appeal, geographic assets and people who are determined to save the city they love.”3
New Orleans resiliency since Katrina constitutes much more than improved levees or better evacuation procedures; more than new brick and mortar applied to what had been an aging, deteriorating region. New Orleans has made enormous progress in cleaning up its famously corrupt political system, and also made huge strides in improving its educational infrastructure. Once considered one of the worst places to do business, the region, and the state of Louisiana, has undergone a marked improvement to its reputation. It has emerged as a good place for commerce – something of a “Cinderella” in economic development terms.4 Allison Plyer of the Greater New Orleans Community Data Center put it, “Greater New Orleans is in some ways rebuilding better than before”.5
Our analysis shows this progress in a host of indicators. Once a below-average job producer, the region has expanded its employment since the 2007 recession far faster than the national average. It recovered all the jobs lost in the recession by 2012 – and then some – while the nation remained three percent below its pre-recession level. Entrepreneurial activity also has grown faster than the national average by a wide margin.6
More important still, the region finally began to reverse a demographic decline that, for a generation or more, saw young, educated people and families depart for other locales to seek out a better life. The concentration of 25 to 35 year olds has increased far more quickly in the region than it has in the nation as a whole. Indeed since 2007, New Orleans region has experienced the fastest growth in educated population in the nation.7
Many economic trends favor the region’s continued ascendency. These include the still nascent US energy boom, which represents arguably the greatest shift in global economic power since the end of the Cold War and the rise of China; the massive flow of investment, domestic and foreign, into lower-cost locales and most particularly into the Third Coast, the burgeoning region around the Gulf of Mexico; and finally the expansion of US trade with Latin America and the Caribbean basin.
To these powerful forces we can also add demographic and social factors that work to the region’s advantage. One key is a relatively low cost of living, which, in effect, gives area residents and businesses a leg up on their East and West coast rivals. This is critical in attracting net migration from those regions, with their storehouse of educated residents and skilled workers.8 Another force is the breadth of skills that can be easily found in the region, including higher paid skilled professionals experienced in transportation and material moving, installation, maintenance and repair, construction, manufacturing and energy.
A future scenario can be constructed where greater New Orleans emerges as one of the brightest spots in the North American economy. Not only does the region have natural advantages in terms of energy resources and transportation, it can claim primary sources of higher-wage employment. It also possesses a cultural cachet that attracts educated workers, but in a cost and regulatory environment that appeals to business investors.
This is most notable in the growth of the region’s rapidly evolving information industry, including software, videogames and an expanding film/television industry. Over the past five years, New Orleans has come to enjoy a locational concentration equal to that of New York, and has emerged as a major player in this sector.
Challenges Ahead: Economic, Social and Environmental
As the region moves further from the immediate post-Katrina crisis, the great momentum of the last five years is clearly slowing down. Job creation remains positive, but has gradually fallen towards national norms. Indeed, since 2010, after years of running ahead, the region’s job growth rate actually trailed the national average. This could be simply a sign that, after recovering more slowly, the rest of the country is now catching up. But the slowdown relative to other cities should be taken seriously, as it could represent a loss of critical momentum.
“Concert Of Economic Forces” That Can Make Recovery Permanent
To overcome its legacy of poverty and inequality, the New Orleans region needs to focus not on just one sector but on five critical ones. In a highly competitive national and global economy, regions need to work on their unique strengths, establishing advantages that can lead to more, and better, job creation. Most particularly, the region needs to develop a broad, but still highly selective, base of industries that can create the higher-wage jobs necessary for the uplift not of a few New Orleanians, but for the many.
1. The first, and most evident, is the region’s cultural legacy, which serves as a major source of jobs for local people as well as a lure for talented people from elsewhere. This, of course, includes the still very important tourism industry, but also encompasses generally higher-wage professions in film, television, video game software and even medical research.
The growth in information sector employment, something relatively new to the region, represents a clear breakthrough. It allows the region to take advantage of its essential cultural assets, by attracting companies and highly skilled workers. Although it is unlikely that the New Orleans region will ever become as tech-dependent as, say, Silicon Valley — which may prove a good thing, given that industry’s volatility — New Orleans can look forward to a sustained increase in high-paying, and high-visibility, employment. Perhaps most critically, it has an excellent opportunity to make itself the cultural capital of the Third Coast, the burgeoning region around the Gulf, something the region desperately needs and a role that New Orleans is uniquely positioned to fulfill.
Yet although these industries are important, they alone cannot sustain a long-term, broad recovery. Wages in the tourism industry and the arts tend to be low – one reason for the city’s persistently poor income distribution in the past – and higher-wage jobs, except in engineering services and entertainment, remain below national norms in total jobs and will take many years to reach true critical mass. Perhaps most critically, these industries alone cannot produce enough high-wage skilled jobs for the region’s working class population.9
2. The river system. Its location at the shipping terminus of the Mississippi River, across the regions the region’s ports – New Orleans, South Louisiana, St. Bernard, Manchac, Plaquemines and Grand Isle Port – is the historic reason for the region’s existence and one of the key factors in its future success. The region needs to work to compete successfully with its Third Coast rivals, notably Houston, as well as Mobile and Tampa. Growing trade with the Caribbean and the completion of the Panama Canal expansion project increase the opportunities for expanded logistics and cargo handling. In addition, the river provides an ideal spur to new industrial production, such as the Nucor Steel plant in St. James Parish, which some see as the precursor of a new zone, akin to Germany’s Ruhr Valley, that could emerge between New Orleans and Baton Rouge.
Given the devastation of the region’s unique ecological environment, the river presents unique challenges to be addressed. At the same time, the river offers the region new opportunities to develop yet another nascent sector: environmental remediation. The RESTORE Act funds will bring billions to the Gulf help alleviate the region’s own environmental issues, but could also support the unique expertise and skills related to the profound challenges of maintaining coastal regions. This can be seen already in the over $210 million that has flowed to expert Louisiana companies as a result of Hurricane Sandy.10
3. The energy revolution. Perhaps no sector has more potential to generate higher wage jobs across the region, particularly for working class residents, than the current energy revolution. This is rapidly shifting economic power to North America, and it’s a shift for which the region has a front row seat. Louisiana and the greater New Orleans area boast enormous oil and gas reserves, but the region has not kept up with Houston or even smaller cities in terms of energy-related jobs. Yet there has been continued growth in many upstream services, such as petro-industrial development and exploration, even if headquarters employment has dropped. With the resolution of the BP disaster, it is hoped that the region will recover more employment in this high-wage sector.
4. Environmental remediation. This is both a major challenge and an opportunity for economic development. Simply put, there is no long-term future for the region if the environment that supports it collapses. Katrina, after all, was not the first ecological disaster to hit the region, and it won’t be the last. Finding ways to restore coastal wetlands and manage the river and other water resources in a sustainable manner not only preserves the environment that New Orleanians cherish, but could also create significant business opportunities down the road; More than 4% of Dutch GDP is related to water management, and more than 50% of that is related to international projects and the export of water expertise and services.11
The region has already received $1.3 billion from various BP criminal settlements that will be applied to river diversion and barrier island restoration projects. Over $600 million is already budgeted for projects being let in 2014 alone, signifying great potential to expand the region’s expertise and capacity in this sector.12
5. The construction of infrastructure. New industries require new or improved roads, better freight and harbor access, reliable, inexpensive electricity, and improved air service. The region is moving ahead on many of these fronts, from the expansion of the airport to major port improvements and the development of a new biomedical district along the Canal Street corridor. A region that has historically lagged in forward-looking improvements is showing clear signs of determination to catch up with competitors in the country and around the world.13
Yet all these efforts must be done in conjunction with a long-term commitment to preserve the very environment that New Orleanians treasure. This is the ultimate challenge to sustaining and expanding regional prosperity in the era ahead.
This concert of economic forces is critical to driving down poverty rates and raising incomes across class and racial lines. This can only be realized if there is a conscious effort to promote broad-based, sustainable growth in a diversity of industries. This requires placing a greater emphasis, among other things, on higher education, particularly on engineering and the biosciences, and, perhaps even more, on community colleges, technical schools and certificate training. The area may now be attracting more college-educated workers, but it still lags behind the national average, reflecting a legacy of out-migration of skilled workers over the past few decades.14
This is the executive summary from a new report Sustaining Prosperity: A Long Term Vision for the New Orleans Region, authored by Joel Kotkin for Greater New Orleans, Inc. Download the full report from GNO, Inc. here: gnoinc.org/sustainingprosperity
Joel Kotkin is executive editor of NewGeography.com and Distinguished Presidential Fellow in Urban Futures at Chapman University, and a member of the editorial board of the Orange County Register. He is author of The City: A Global History and The Next Hundred Million: America in 2050. His most recent study, The Rise of Postfamilialism, has been widely discussed and distributed internationally. He lives in Los Angeles, CA.
Endnotes
1 http://www.newgeography.com/content/003897-root-causes-detroit-s-decline-should-not-go-ignored
2 http://www.theatlantic.com/business/archive/2012/01/the-10-fastest-growing-and-fastest-declining-cities-in-the-world/251602/#slide16
3 Lawrence J. Vale and Thomas J. Campanella, “Conclusion: Axioms of Resilience”, in The Resilient City, editors, Lawrence J. Vale and Thomas J. Campanella, Oxford University Press, (New York: 2005), pp.335-353
4 http://chiefexecutive.net/best-worst-states-for-business-2012
5 The New Orleans Index, by Allison Player, 2013
6 Allison Plyer, Elaine Ortiz, Ben Horwitz and George Hobor, The New Orleans Index at Eight: Measuring Greater New Orleans Progress Towards Prosperity, Greater New Orleans Community Data Center August 13, 2013, p.6-7
7 newgeography.com/content/002044-americas-biggest-brain-magnets
8 http://www.newgeography.com/content/002950-the-cities-where-a-paycheck-stretches-the-furthest
9 Author’s analysis of data from EMSI, Inc.
10 http://www.bp.com/en/global/corporate/sustainability/environment/managing-our-impact-on-the-environment/complying-with-regulations/clean-water-act-provision.html; http://www.restorethegulf.gov/council/about-gulf-coast-ecosystem-restoration-council
11 Dale Morris, Senior Economist, Royal Netherlands Embassy
12 http://www.nfwf.org/gulf/Pages/home.aspx;
13 http://biodistrictneworleans.org/
14 Plyer, etal, op. cit., p.12
If there’s one thing that people of pretty much every political persuasion agree on, it’s the need to boost exports. This is true not just at the national level, but also the local one. The balance of world population and economic growth is outside the United States. McKinsey estimates that there will be an additional one billion people added to the global “consuming class” by 2025. An economy focused solely on a domestic American or North American market is missing a huge part of the addressable market, dooming it to slower growth.
Exports have also long been seen as a key part of economic growth in the city. Jane Jacobs noted how cities develop import substitutes. That is, cities develop replacements for goods and services they formerly imported, and subsequently start exporting these to other places. So exporting, both to domestic and to foreign destinations, is critical for cities.
The US Department of Commerce recently released foreign export totals by metropolitan area for 2012. The data series goes back as far as 2005. A number of metro regions are exporting power houses. There are 31 metro areas that export more than $10 billion in goods and services every year. Here is the top ten:
|
Rank
|
Metro Area
|
2012
|
|
1
|
Houston-Sugar Land-Baytown, TX
|
110,297,753,116
|
|
2
|
New York-Northern New Jersey-Long Island, NY-NJ-PA
|
102,298,029,869
|
|
3
|
Los Angeles-Long Beach-Santa Ana, CA
|
75,007,521,224
|
|
4
|
Detroit-Warren-Livonia, MI
|
55,387,305,415
|
|
5
|
Seattle-Tacoma-Bellevue, WA
|
50,301,690,645
|
|
6
|
Miami-Fort Lauderdale-Pompano Beach, FL
|
47,858,713,857
|
|
7
|
Chicago-Joliet-Naperville, IL-IN-WI
|
40,567,953,537
|
|
8
|
Dallas-Fort Worth-Arlington, TX
|
27,820,946,540
|
|
9
|
San Jose-Sunnyvale-Santa Clara, CA
|
26,687,656,696
|
|
10
|
Minneapolis-St. Paul-Bloomington, MN-WI
|
25,155,739,576
|
Table 1: Dollar Value of Exports, 2012
Unsurprisingly, bigger cities have more exports, but it’s not a perfect correlation. Energy and chemicals intensive Houston ranks #1, and places like #5 Seattle (home to Boeing and Microsoft) and #6 Miami (the hub of Latin American trade) punch above their weight.
But perhaps a better measure of the export intensity of an economy is exports per capita. Here’s a map of US metro areas for that metric:

Map 1: Export dollar value per capita, 2012.
Here are the top ten metros in America among those with a population greater than one million:
|
Rank
|
Metro Area
|
2012
|
|
1
|
New Orleans-Metairie-Kenner, LA
|
20209.1
|
|
2
|
Houston-Sugar Land-Baytown, TX
|
17778.0
|
|
3
|
Seattle-Tacoma-Bellevue, WA
|
14160.9
|
|
4
|
San Jose-Sunnyvale-Santa Clara, CA
|
14087.7
|
|
5
|
Salt Lake City, UT
|
13764.1
|
|
6
|
Detroit-Warren-Livonia, MI
|
12904.6
|
|
7
|
Cincinnati-Middletown, OH-KY-IN
|
9312.0
|
|
8
|
Portland-Vancouver-Hillsboro, OR-WA
|
8881.9
|
|
9
|
Memphis, TN-MS-AR
|
8522.5
|
|
10
|
Miami-Fort Lauderdale-Pompano Beach, FL
|
8304.9
|
Table 2: Top Ten Large Metros, Dollar Value of Exports Per Capita, 2012
Here we see that some top exporters like Houston, Seattle, and Miami continue to rank well. But some smaller metros crack the list like #1 New Orleans (another major petroleum center) and #7 Cincinnati (which has a major GE aircraft engine plant).
And lastly, here’s a look at the growth in total exports from metro areas over the time period for which data is available:

Map 2: Percent change in total exports, 2005-2012.
There was extremely wide variability in the growth rates of exports among metro areas. Here is the top 10 for large metro areas:
|
Rank
|
Metro Area
|
2005
|
2012
|
Percent
Change
|
|
1
|
San Antonio-New Braunfels, TX
|
2,346,954,123
|
14,010,234,128
|
496.95%
|
|
2
|
New Orleans-Metairie-Kenner, LA
|
4,857,754,172
|
24,359,505,265
|
401.46%
|
|
3
|
Salt Lake City, UT
|
3,912,555,433
|
15,989,999,420
|
308.68%
|
|
4
|
Houston-Sugar Land-Baytown, TX
|
41,747,920,224
|
110,297,753,116
|
164.20%
|
|
5
|
Las Vegas-Paradise, NV
|
716,805,170
|
1,811,480,065
|
152.72%
|
|
6
|
Birmingham-Hoover, AL
|
796,241,450
|
1,939,217,017
|
143.55%
|
|
7
|
Washington-Arlington-Alexandria, DC-VA-MD-WV
|
6,058,364,485
|
14,609,712,467
|
141.15%
|
|
8
|
Raleigh-Cary, NC
|
974,832,168
|
2,308,052,342
|
136.76%
|
|
9
|
Miami-Fort Lauderdale-Pompano Beach, FL
|
20,382,947,257
|
47,858,713,857
|
134.80%
|
|
10
|
Providence-New Bedford-Fall River, RI-MA
|
2,667,670,867
|
5,830,785,377
|
118.57%
|
Table 3: Large metro top ten, Percent change in total exports, 2005-2012.
San Antonio is the champion, but Houston and New Orleans score well again. A few unexpected metro areas like Birmingham and Providence, traditionally viewed as economic laggards, appear on the list though these are growing admittedly from small bases. What this does show is that even long struggling metros have a major opportunity to improve themselves through focusing on export growth.
While there’s a general nod of approval in the direction of boosting exports, few urban strategies seem to focus on it. Rather, sexier items like subsidized real estate development is generally front and center. But given the positive results even struggling cities like Providence have seen with exports, this type of more basic economic blocking and tackling would seem to be a better place to focus.
Aaron M. Renn is an independent writer on urban affairs and the founder of Telestrian, a data analysis and mapping tool. He writes at The Urbanophile.
Great Lakes Freighter photo by BigStockPhoto.com.
It was widely reported that the Great Recession and subsequent economic malaise changed the geography of America. Suburbs, particularly in the Sun Belt, were becoming the “new slums” as people flocked back to dense core cities.
Yet an analysis of post-2007 population trends by demographer Wendell Cox in the 111 U.S. metro areas with more than 200,000 residents reveals something both very different from the conventional wisdom and at the same time very familiar. Virtually all of the 20 that have added the most residents from 2007 to 2012 are in the Old Confederacy, the Intermountain West and suburbs of larger cities, notably in California. The lone exception to this pattern is No. 15 Portland. The bottom line: growth is still fastest in the Sun Belt, in suburban cities and lower-density, spread out municipalities.
The No. 1 city on our list, New Orleans, fits this picture to a degree as a quintessentially Southern city, but it’s a bit of an anomaly. Its fast growth is partially a rebound effect from its massive population loss after Katrina, but is also a function of a striking economic revival that I have seen firsthand as a consultant in the area.
Since 2007 New Orleans’ population has grown 28% to 370,000. Many are newcomers who came, at least initially, to rebuild the city. But the city is still way below the 2002 population of 472,000, much less its high of 628,000 in 1960.
New Orleans is one of six cities where the population of the core has grown more in total numbers than the surrounding suburbs. (The other five are New York; San Jose, Calif.; Providence, R.I.; Columbus, Ohio; and San Antonio.) This is also a product of the fact that, when the Greater New Orleans region began to recover, the return to the suburban regions, for the most part, came before that to the city.
Nothing in the data, however suggests a revival of the older, dense “legacy” cities that were typical of the late 19th century and pre-war era. Most of the fastest-growing big cities since 2007 are of the sprawling post-1945 Sun Belt variety, including Charlotte, N.C. (No. 4); Ft. Worth, Texas (No. 6); Austin, Texas, (10th); El Paso, Texas (11th); Raleigh, N.C. (12th); and Oklahoma City (18th). Some of the fastest-growers are also outside the major metropolitan areas, such as No. 5 Bakersfield in California’s Central Valley, the North Carolina cities of Greensboro and Durham, (9th and 14th, respectively), and Corpus Christi, Texas (16th).
Among the big Northeast cities, the best performer is Washington (27th with 7.8% population growth) followed by Boston (71st, 2.2%). New York has managed only 0.3% population growth since 2007 (88th). Among other leading U.S. cities San Francisco’s population is up 3.3%, Los Angeles has grown 2.1%, and Chicago’s population has dropped 3.4%.
The other somewhat surprising result is the strong performance of more purely suburban cities, that is, ones that have grown up since car ownership became nearly universal. They are not the historic cores of their regions but have developed into major employment centers with housing primarily made up of single-family residences. These include the city that has grown the second most in the U.S. since 2007: Chula Vista, a San Diego suburb close to the Mexican border, whose population expanded 17.7%. It’s followed in third place by the Los Angeles suburb of Irvine (16.3%); No. 7 Irving, Texas; and the California cities of Fremont (13th) , located just east of San Jose-Silicon Valley, and Oxnard (17th), north of Los Angeles.
What do these results tell us? First, that Americans continue to move decisively to both lower-density, job-creating cities and to those less dense areas of major metropolitan areas particularly where single-family houses, good schools and jobs are plentiful.
Irvine, a planned postwar city of some 230,000 which ranks as the country’s seventh-wealthiest municipality, has three jobs for every resident; roughly two in five residents work in the city. Irvine’s 16.3% growth rate since 2007 has been bolstered by a strong inflow of Asians. Once overwhelmingly white, Irvine’s population is now roughly 40% Asian and 9% Hispanic.
Similarly, Irving, Texas, also thrived through the recession. Like Irvine this Dallas-area suburb is a major job center. Headquarters for Nokia , NEC Corporation of America, Blackberry, and Exxon Mobil, Irving’s population has soared over 13% over the past five years to 225,000.
This contrasts with some similarly sized suburbs that boomed in the first part of the decade. North Las Vegas added 80,000 people between 2002 and 2007 but its growth slowed down considerably as the Nevada economy cratered. This extension of Las Vegas has added a relatively paltry 12,000 people since 2007. With Phoenix losing 3.2% of its population since ’07, the nearby former boomtowns of Mesa and Scottsdale have also seen net outflows of residents.
Migration numbers for 2010 to 2012 alone hammer home that suburban areas are continuing to attract people, and that the more dense core areas do not generally perform as well. Although their growth has slowed compared to the last decade, suburban locales, with roughly three-quarters of all residents of metropolitan areas, have added many more people than their core counterparts.
Where do we go from here? The urban future will continue to evolve in directions that contradict the prevailing conventional wisdom of a shift toward more crowded living. The continued dispersion of America’s population is evidenced by the persistent, and surprising, strength of suburban towns, as well as the low-density cities of Texas and the Plains. The key to growth in the next decade may depend largely on whether these rising municipalities can continue to create the jobs, favorable educational environment and amenities necessary to attract more newcomers in the future.
| MUNICIPALITIES OVER 200,000 IN 2012 |
| 25 Fastest Growing 2007-2012 |
|
|
POPULATION |
CHANGE |
| RANK |
MUNICIPALITY |
2002 |
2007 |
2012 |
2007-2012 |
| 1 |
New Orleans, Louisiana |
472,744 |
288,113 |
369,250 |
28.2% |
| 2 |
Chula Vista, California |
194,167 |
214,506 |
252,422 |
17.7% |
| 3 |
Irvine, California |
162,205 |
197,714 |
229,985 |
16.3% |
| 4 |
Charlotte, North Carolina |
590,857 |
669,690 |
775,202 |
15.8% |
| 5 |
Bakersfield, California |
259,146 |
312,454 |
358,597 |
14.8% |
| 6 |
Fort Worth, Texas |
570,808 |
680,433 |
777,992 |
14.3% |
| 7 |
Irving, Texas |
195,764 |
198,119 |
225,427 |
13.8% |
| 8 |
Laredo, Texas |
189,954 |
215,789 |
244,731 |
13.4% |
| 9 |
Greensboro, North Carolina |
231,415 |
245,767 |
277,080 |
12.7% |
| 10 |
Austin, Texas |
684,634 |
749,120 |
842,592 |
12.5% |
| 11 |
El Paso, Texas |
570,336 |
600,402 |
672,538 |
12.0% |
| 12 |
Raleigh, North Carolina |
313,829 |
379,106 |
423,179 |
11.6% |
| 13 |
Fremont, California |
205,034 |
199,187 |
221,986 |
11.4% |
| 14 |
Durham, North Carolina |
196,432 |
216,943 |
239,358 |
10.3% |
| 15 |
Portland, Oregon |
538,803 |
546,747 |
603,106 |
10.3% |
| 16 |
Corpus Christi, Texas |
276,877 |
283,445 |
312,195 |
10.1% |
| 17 |
Oxnard, California |
176,594 |
183,235 |
201,555 |
10.0% |
| 18 |
Oklahoma, Oklahoma |
519,100 |
545,910 |
599,199 |
9.8% |
| 19 |
Aurora, Colorado |
282,707 |
309,007 |
339,030 |
9.7% |
| 20 |
Denver, Colorado |
561,072 |
578,789 |
634,265 |
9.6% |
| 21 |
Fontana, California |
158,916 |
184,814 |
201,812 |
9.2% |
| 22 |
Fresno, California |
442,987 |
465,669 |
505,882 |
8.6% |
| 23 |
Orlando, Florida |
199,358 |
230,239 |
249,562 |
8.4% |
| 24 |
Colorado Springs, Colorado |
376,341 |
399,751 |
431,834 |
8.0% |
| 25 |
Riverside, California |
272,814 |
290,601 |
313,673 |
7.9% |
Joel Kotkin is executive editor of NewGeography.com and a distinguished presidential fellow in urban futures at Chapman University, and a member of the editorial board of the Orange County Register. He is author of The City: A Global History and The Next Hundred Million: America in 2050. His most recent study, The Rise of Postfamilialism, has been widely discussed and distributed internationally. He lives in Los Angeles, CA.
This piece originally appeared at Forbes.com.
New Orleans photo by Bigstock.
One hundred and fifty years after twin defeats at Gettysburg and Vicksburg destroyed the South’s quest for independence, the region is again on the rise. People and jobs are flowing there, and Northerners are perplexed by the resurgence of America’s home of the ignorant, the obese, the prejudiced and exploited, the religious and the undereducated. Responding to new census data showing the Lone Star State is now home to eight of America’s 15 fastest-growing cities, Gawker asked: “What is it that makes Texas so attractive? Is it the prisons? The racism? The deadly weather? The deadly animals? The deadly crime? The deadly political leadership? The costumed sex fetish conventions? The cannibal necromancers?”
The North and South have come to resemble a couple who, although married, dream very different dreams. The South, along with the Plains, is focused on growing its economy, getting rich, and catching up with the North’s cultural and financial hegemons. The Yankee nation, by contrast, is largely concerned with preserving its privileged economic and cultural position—with its elites pulling up the ladder behind themselves.
This schism between the old Confederacy and the Northeastern elites is far more relevant and historically grounded than the glib idea of “red” and “blue” Americas. The base of today’s Republican Party—once the party of the North—now lies in the former secessionist states, along with adjacent and culturally allied areas, such as Appalachia, the southern Great Plains, and parts of the Southwest, notably Arizona, largely settled by former Southerners.
“In almost every species of conceivable statistics having to do with wealth,” John Gunther wrote in 1946, “the South is at the bottom.” But even as Gunther was writing, the region had begun a gradual ascendancy, now in its seventh decade. That began with a belated post-WWII push to promote industrialization, much of it in relatively low-wage industries such as textiles. “Southerners don’t have any rich relatives. God was a Northerner,” the head of the pro-development Southern Regional Council told author Joel Garreau in 1980. “Without a heritage of anything except denial, Southerners, given a chance to improve their standard of living, are doing so.”
While the Northeast and Midwest have become increasingly expensive places for businesses to locate, and cool to most new businesses outside of high-tech, entertainment, and high-end financial services, the South tends to want it all—and is willing to sacrifice tax revenue and regulations to get it. A review of state business climates by CEO Magazine found that eight of the top 10 most business-friendly states, led by Texas, were from the former Confederacy; Unionist strongholds California, New York, Illinois, and Massachusetts sat at the bottom.
The South’s advantages come in no small part from decisions that many Northern liberals detest—lack of unions, lower wages, and less stringent environment laws. But for many Southerners, particularly in rural areas, a job at the Toyota plant with a $15-an-hour starting salary, and full medical benefits, is a vast improvement over a minimum-wage job at Wal-Mart, much less your father’s fate chopping cotton on a tenant farm.
And the business-friendly policies that keep costs down appeal to investors. Ten of the top 12 states for locating new plants are in the former confederacy, according to a recent study by Site Selection magazine. In 2011 the two largest capital investments in North America (PDF)—both tied to natural-gas production—were in Louisiana.
More recently, the region—led by Texas—has moved up the value-added chain, seizing a fast-growing share of the jobs in higher-wage fields such as auto and aircraft manufacturing, aerospace, technology, and energy. Southern economic growth has now outpaced the rest of the country for a generation and it now constitutes by far the largest economic region in the country. A recent analysis by Trulia projects the edge will widen over the rest of this decade, owing to factors including the region’s lower costs and warmer weather.
These developments are slowly reversing the increasingly outdated image of the South as hopelessly backward in high-value-added industries. Alabama and Kentucky are now among the top-five auto-producing states, while the Third Coast corridor between Louisiana and Florida ranks as the world’s fourth-largest aerospace hub, behind Toulouse, France; Seattle; and California.
Southern growth can also be seen in financial and other business services. The new owners of the New York Stock Exchange are based in Atlanta.
While the recession was tough on many Southern states, the area’s recovery generally has been stronger than that of Yankeedom: the unemployment rate in the region is now lower than in the West or the Northeast. The Confederacy no longer dominates the list of states with the highest share of people living in poverty; new census measurements (PDF), adjusted for regional cost of living, place the District of Columbia and California first and second. New York now has a higher real poverty rate than Mississippi.
Over the past five decades, the South has also gained in terms of population as Northern states, and more recently California, have lost momentum. Once a major exporter of people to the Union states, today the migration tide flows the other way. The hegira to the sunbelt continues, as last year the region accounted for six of the top eight states attracting domestic migrants—Texas, Florida, North Carolina, Tennessee, South Carolina, and Georgia. Texas and Florida each gained 250,000 net migrants. The top four losers were New York, Illinois, New Jersey, and California.
These trends suggest that the South will expand its dominance as the nation’s most populous region. In the 1950s, the Confederacy, the Northeast, and the Midwest all had about the same populations. Today the South is nearly as populous as the Northeast and the Midwest combined, and the Census projects the region will grow far more rapidly (PDF) in the years to come than its costlier Northern counterparts.
Yankees tend to shrug off such numbers as largely the chaff drifting down. “The Feet are moving south and west,” The Atlantic’s Derek Thompson wrote in 2010, “while the Brains are moving toward coastal cities.”
To be sure, some Yankee bastions, such as Massachusetts and Connecticut, enjoy much higher percentages of educated people than the South. Every state in the Southeast falls below the national average of percentage of residents 25 and over with at least a bachelor’s degree—but virtually every major Southern metropolitan region has been gaining educated workers faster than their Northeastern counterparts. Over the past decade, greater Atlanta added over 300,000 residents with B.A.s, more than the larger Philadelphia region and almost 70,000 more than Boston.
The region—as recently as the 1970s defined by its often ugly biracial politics—has become increasingly diverse, as newly arrived Hispanics and Asians have shifted the racial dynamics. While the vast majority of 19th-century immigrants to America settled in the Northeast and Midwest, today the fastest-growing immigration destinations—including Nashville, Atlanta, and Charlotte—are in the old Confederacy. Houston ranked second in gaining new foreign-born residents in the past decade, just behind New York City, with nearly three times its size. And Houston and Dallas both now attract a higher rate of immigration than Boston, Chicago, Seattle, or Philadelphia.
These immigrants are drawn to the South for the same reasons as other Americans—more jobs, a more affordable cost of living and better entrepreneurial opportunities. A 2011 Forbes ranking of best cities for immigrant entrepreneurs—measuring rates of migration, business ownership, and income—found several Southeastern cities at the top of the list, with Atlanta in the top slot, and Nashville coming in third.
Then there’s the most critical determinant of future power: family formation. The South easily outstrips the Yankee states in growth in its 10-and-under population. Texas and North Carolina expanded their kiddie population by over 15 percent; and every Southern state gained kids except for Katrina-ravaged Louisiana. In contrast New York, Rhode Island, and Michigan lost children by a double-digit margin while every state in the Northeast as well as California suffered net losses.
The differences are most striking when looking at child-population growth among the nation’s 51 largest metropolitan areas. Eight of the top ten cities for growth in children under 15 were located in the old Confederacy—Raleigh-Cary, Austin, Charlotte, Dallas, Houston, Orlando, Atlanta, and Nashville. New York, Los Angeles, and Boston, along with several predictable rust-belt locals, ranked in the bottom 10.
Historically, regions with demographic and economic momentum tend to overwhelm those who lack it. Numbers mean more congressional seats and more electoral votes, and governors who command a large state budget and the national stage. Unless there is a major political change, the South’s demographic elevation will do little to help Democrats there, who, like Northern Republicans, appear to be an endangered species.
Pundits including the National Journal’s perceptive Ron Brownstein suggest that the GOP’s Southern dominance has “masked” the party’s decline in much of the rest of the country. Other, more partisan voices, like the New Yorker’s George Packer simply dismiss Southern conservatives as overmatched by the Obama coalition of minorities, the young, and the highly educated. The even more partisan Robert Shrum correctly points out that the Southern-dominated GOP is increasingly out of step with the rest of the country on a host of social and economic issues, from income inequality to support for gay marriage.
“A lot of sociologists have projected that the South will cease to exist because of things like the Internet and technology,” Jonathan Wells told Charlotte Magazine. An associate professor of history at UNCC and author of Entering the Fray: Gender, Culture, and Politics in the New South, Wells predicts the region “will lose its distinctive identity that it had in the past.”
It’s unlikely, though, that the South will emulate the North’s social model of an ever-expanding welfare state and ever more stringent “green” restrictions on business—which hardly constitutes a strong recipe for success for a developing economy. It’s difficult to argue, for example, that President Obama’s Chicago, broke and with 10 percent unemployment, represents the beacon of the economic future compared to faster-growing Houston, Dallas, Raleigh, or even Atlanta. People or businesses moving from Los Angeles, New York, or Chicago to these cities will no doubt carry their views on social issues with them, but it’s doubtful they will look north for economic role models.
Instead, you might see some political leaders, even Democrats, in states such as Pennsylvania, Ohio (a Civil War hotspot for pro-Southern Copperheads), and Michigan come to realize that pro-development policies, such as fracking, offer broader benefits than the head-in-the-sand “green” energy policy that slow growth in places like New York and California. The surviving Southern Democrats (by definition, a tough breed) like Houston Mayor Anise Parker have shown that you can blend social liberalism with “good old boy” pro-business policies.
Politicians like Parker, along with Republicans such as former Florida governor Jeb Bush, represent the real future of the states that once made up the Confederacy. As they look to compete with the Northeast and California for the culture, and high-test and financial-service firms that are forced to endure the high cost of the coasts, Southerners are likely to at least begin shrugging off their regressive—and costly—social views on issues like gay marriage.
Bluntly put, if the South can finally shake off the worst parts of its cultural baggage, the region’s eventual ascendancy over the North seems more than likely. High-tech entrepreneurs, movie-makers, and bankers appreciate lower taxes and more sensible regulation, just like manufacturers and energy companies. And people generally prefer affordable homes and family-friendly cities. Throwing in a little Southern hospitality, friendliness, and courtesy can’t hurt either.
Joel Kotkin is executive editor of NewGeography.com and a distinguished presidential fellow in urban futures at Chapman University, and a member of the editorial board of the Orange County Register . He is author of The City: A Global History and The Next Hundred Million: America in 2050. His most recent study, The Rise of Postfamilialism, has been widely discussed and distributed internationally. He lives in Los Angeles, CA.
This piece originally appeared at The Daily Beast.
Photo by Belle of Louisville.
The red states may have lost the presidential election, but they are winning new residents, largely at the expense of their politically successful blue counterparts. For all the talk of how the Great Recession has driven people — particularly the “footloose young” — toward dense urban centers, Census data reveal that Americans are still drawn to the same sprawling Sun Belt regions as before.
An analysis of domestic migration for the nation’s 51 largest metropolitan statistical areas by demographer Wendell Cox shows that the 10 metropolises with the largest net gains from 2000 through 2009 are in the Sun Belt, led by Phoenix, and followed by Riverside-San Bernardino, Calif.; Atlanta; Dallas-Ft. Worth; and Las Vegas.
Migration has slowed from a high of nearly 2 million annually in 2006 to less than 800,000 last year, but the most recent numbers show that the Sun Belt states, though chastened by the recession, are far from dead, as often alleged. This part of America, widely consigned to what the Bolshevik firebrand Leon Trotsky called the “dustbin of history” by Eastern pundits, somehow manages to continue to draw Americans seeking opportunities, in particular from the large coastal metropolitan regions.
Migration data for the most recent one-year period available, July 2010 t0 July 2011, show the Great Recession has shaken the rankings up quite a bit within the circle of fast-growth regions. The biggest winner has been Texas. The Lone Star state boasts four of the 10 metro areas with the largest net migration gains for the past two years. Dallas ranks first, followed by Austin in third place, Houston in fifth and San Antonio in eighth. In contrast, some of the growth leaders over the 2000-09 period, notably Las Vegas, and to a lesser extent Phoenix, have tumbled considerably in the rankings. The lesson here: a strong economy has to be based on something more than gaming, tourism and home construction. Energy, technology, manufacturing and trade are far preferable as an economic base.
Also posting strong net migration gains for 2010-11 were Miami (second place), Washington, D.C. (sixth), and Seattle (ninth). In each of these areas, economic conditions appear to have improved. The once disastrous condo glut in the Miami area, which includes Dade, Broward and Palm Beach counties, has begun to clear up as foreign buyers pour into the region. Taxpayer-funded Washington is surging with new jobs and the highest incomes in the land. Seattle continues a long-term evolution toward the healthiest of the blue-state private economies. San Francisco, a consistent big loser for the last decade, jumped to 19th, presumably as a result of the current dot.com bubble.
Another huge turnaround can be seen in New Orleans, which ranked a dismal 43rd for 2000-09 as residents fled not only Katrina but a stagnant, low-wage, corruption-plagued economy. But in our 2010-11 ranking, the Crescent City surged to a respectable 16th, one of the biggest migration turnarounds in the country.
How about the biggest losers? From 2000-09, the metropolitan areas that suffered the biggest net domestic migration losses resemble something of an urbanist dream team: New York, which saw a net outflow of a whopping 1.9 million citizens, followed by the Los Angeles metro area (-1,337,522), Chicago, Detroit, and, despite recent improvements, San Francisco-Oakland. The raw numbers make it clear that California has lost its appeal for migrants from other parts of the U.S., and has become an exporter of people and talent (and income).
And despite the cheap money Bernanke-Geithner policies of the past few years that have benefited giant banks centered in the bluest big cities, people continue to leave these areas. The 2010-11 numbers show the deck chairs on the migratory titanic have stayed remarkably similar, with New York still ranking first among the 51 biggest metro areas for net migration losses, followed by Chicago, Los Angeles, Detroit and Philadelphia. In most of these cases only immigration from abroad, and children of immigrants, have prevented a wholesale demographic decline.
What can we expect now? It seems clear that the urban-centric policies of the Obama administration have not changed Americans’ migration patterns. The weak recovery has slowed migration, but expensive, overregulated and dense metropolitan areas continue to lose population to lower-cost, less regulated and generally less dense regions. This may speed up as recent tax hikes squeeze the hard-pressed middle class and if, as appears likely, the social media bubble continues to deflate.
If the economy somehow gains strength, it may only serve to further accelerate these trends. The incipient recovery in housing prices seems likely, at least in places like California and the Northeast, to create yet another bubble. This will give people more incentive to move to less expensive areas, particularly those who can cash in by selling a house in a pricier city and moving to a less expensive one. The differential in housing costs between New York and Tampa-St. Petersburg now stands at historic highs, and near peak bubble highs between Los Angeles and Phoenix; the traditional growth states are looking more attractive all the time for people looking to make quick money in an economy with shrinking opportunities elsewhere. This includes the massive wave of aging boomers, many of whom may see selling a house in California or the Northeast as a way to make up for less than adequate IRAs. The combination of low prices and warmer weather in the past has proven an irresistible one for those retiring or simply down-shifting their careers. This appeal is likely to grow as the senior population expands.
Other demographic factors could further drive this trend. As the millennial generation ages and starts looking for places to buy homes and raise families, many will seek out places that are both affordable and offer better economic opportunities. These will tend to be in the South and Southwest, particularly Texas, and Plains States metro areas such as Oklahoma City.
Finally we can expect immigrants, particularly from Asia, to continue to seek out housing bargains and new opportunities primarily in the Sun Belt states, as our recent study of changing Asian settlement patterns revealed. More will be shifting from the high-priced, low-growth big metros for opportunity cities such as Houston, Dallas-Fort Worth, Raleigh and Charlotte.
Overall we can expect domestic migration to pick up, and to follow the well-trodden path from the great cities of the Northeast and California to the Sun Belt’s resurgent boom towns. This may be bad news to many urban pundits and big city speculators, but it also should create new opportunities for more perceptive, and less jaded, investors.
| 2010-2011 Net Domestic Migration for the Nation’s 51 Largest Regions |
| Rank by Net Flow |
Metropolitan Area |
Net Flow |
Rate Per 1,000 Residents |
Rank by Rate |
| 1 |
Dallas-Fort Worth-Arlington, TX |
39,021 |
6.04 |
10 |
| 2 |
Miami-Fort Lauderdale-Pompano Beach, FL |
36,191 |
6.43 |
9 |
| 3 |
Austin-Round Rock-San Marcos, TX |
30,669 |
17.47 |
1 |
| 4 |
Tampa-St. Petersburg-Clearwater, FL |
27,157 |
9.68 |
3 |
| 5 |
Houston-Sugar Land-Baytown, TX |
21,580 |
3.58 |
16 |
| 6 |
Washington-Arlington-Alexandria, DC-VA-MD-WV |
21,517 |
3.80 |
15 |
| 7 |
Denver-Aurora-Broomfield, CO |
19,565 |
7.59 |
7 |
| 8 |
San Antonio-New Braunfels, TX |
19,515 |
8.97 |
4 |
| 9 |
Seattle-Tacoma-Bellevue, WA |
17,598 |
5.07 |
13 |
| 10 |
Riverside-San Bernardino-Ontario, CA |
15,131 |
3.54 |
17 |
| 11 |
Charlotte-Gastonia-Rock Hill, NC-SC |
13,778 |
7.74 |
6 |
| 12 |
Raleigh-Cary, NC |
13,262 |
11.53 |
2 |
| 13 |
Atlanta-Sandy Springs-Marietta, GA |
12,419 |
2.33 |
18 |
| 14 |
Portland-Vancouver-Hillsboro, OR-WA |
11,388 |
5.07 |
12 |
| 15 |
Orlando-Kissimmee-Sanford, FL |
10,394 |
4.82 |
14 |
| 16 |
New Orleans-Metairie-Kenner, LA |
10,153 |
8.59 |
5 |
| 17 |
Nashville-Davidson–Murfreesboro–Franklin, TN |
9,323 |
5.81 |
11 |
| 18 |
Oklahoma City, OK |
8,746 |
6.90 |
8 |
| 19 |
San Francisco-Oakland-Fremont, CA |
5,880 |
1.35 |
22 |
| 20 |
Phoenix-Mesa-Glendale, AZ |
5,585 |
1.32 |
24 |
| 21 |
Pittsburgh, PA |
3,740 |
1.59 |
20 |
| 22 |
Jacksonville, FL |
2,911 |
2.15 |
19 |
| 23 |
Sacramento–Arden-Arcade–Roseville, CA |
2,856 |
1.32 |
23 |
| 24 |
Columbus, OH |
2,219 |
1.20 |
26 |
| 25 |
Indianapolis-Carmel, IN |
1,940 |
1.10 |
27 |
| 26 |
Louisville/Jefferson County, KY-IN |
1,886 |
1.46 |
21 |
| 27 |
Richmond, VA |
1,546 |
1.22 |
25 |
| 28 |
Salt Lake City, UT |
915 |
0.80 |
28 |
| 29 |
San Diego-Carlsbad-San Marcos, CA |
816 |
0.26 |
29 |
| 30 |
Minneapolis-St. Paul-Bloomington, MN-WI |
536 |
0.16 |
30 |
| 31 |
Baltimore-Towson, MD |
-1,341 |
-0.49 |
32 |
| 32 |
Boston-Cambridge-Quincy, MA-NH |
-1,627 |
-0.36 |
31 |
| 33 |
Birmingham-Hoover, AL |
-2,452 |
-2.17 |
35 |
| 34 |
Buffalo-Niagara Falls, NY |
-2,558 |
-2.25 |
38 |
| 35 |
San Jose-Sunnyvale-Santa Clara, CA |
-2,704 |
-1.46 |
34 |
| 36 |
Kansas City, MO-KS |
-2,820 |
-1.38 |
33 |
| 37 |
Memphis, TN-MS-AR |
-2,933 |
-2.22 |
37 |
| 38 |
Rochester, NY |
-3,320 |
-3.15 |
40 |
| 39 |
Hartford-West Hartford-East Hartford, CT |
-4,749 |
-3.92 |
45 |
| 40 |
Milwaukee-Waukesha-West Allis, WI |
-4,862 |
-3.12 |
39 |
| 41 |
Providence-New Bedford-Fall River, RI-MA |
-6,254 |
-3.91 |
44 |
| 42 |
Las Vegas-Paradise, NV |
-6,353 |
-3.24 |
41 |
| 43 |
Virginia Beach-Norfolk-Newport News, VA-NC |
-7,086 |
-4.22 |
47 |
| 44 |
Cincinnati-Middletown, OH-KY-IN |
-7,149 |
-3.35 |
42 |
| 45 |
St. Louis, MO-IL |
-10,260 |
-3.64 |
43 |
| 46 |
Cleveland-Elyria-Mentor, OH |
-12,521 |
-6.04 |
51 |
| 47 |
Philadelphia-Camden-Wilmington, PA-NJ-DE-MD |
-13,133 |
-2.20 |
36 |
| 48 |
Detroit-Warren-Livonia, MI |
-24,170 |
-5.64 |
49 |
| 49 |
Los Angeles-Long Beach-Santa Ana, CA |
-50,549 |
-3.92 |
46 |
| 50 |
Chicago-Joliet-Naperville, IL-IN-WI |
-53,908 |
-5.68 |
50 |
| 51 |
New York-Northern New Jersey-Long Island, NY-NJ-PA |
-98,975 |
-5.22 |
48 |
Joel Kotkin is executive editor of NewGeography.com and is a distinguished presidential fellow in urban futures at Chapman University, and contributing editor to the City Journal in New York. He is author of The City: A Global History. His newest book is The Next Hundred Million: America in 2050, released in February, 2010.
This piece originally appeared at Forbes.
Dallas photo by Bigstock.
