Tag: New York

  • Citizen Bloomberg – How Our New York Mayor has Given Us the Business

    This piece originally appeared in the Village Voice.

    After a charmed first decade in politics, Mayor Mike Bloomberg is mired in his first sustained losing streak.

    His third term has been shaky, marked by the Snowpocalypse, the snowballing CityTime scandal, the backlash to Cathie Black and “government by cocktail party,” and the rejection by Governor Andrew Cuomo of his plan to change how public-school teachers are hired and fired. With just a couple more years left in office, Bloomberg is starting to look every one of his 70 years.

    Soon, he’ll be just another billionaire.

    The mayor’s legacy is remarkably uncertain—largely because he’s done his best to keep New Yorkers in the dark about what it is he’s really set out to do in office.

    In part, this is because the mayor has been far more effective at selling his Bloomberg brand than in getting things done. But it’s also because what he has done—remaking and marketing New York as a “luxury city” and Manhattan as a big-business monoculture—he prefers to discuss with business groups rather than the voting public.

    Withholding information while preaching transparency is a Bloomberg trademark. He aggressively keeps his private life private—meaning not just his weekends outside the city at “undisclosed” locations, but also his spending, his charitable giving, and his privately held business.

    New Yorkers who have received city, campaign, or Bloomberg bucks in one form or another and who expect to do business again in the future agreed to speak anonymously with the Voice about the mayor’s personality, the intersection of his political and private interests, and the goals he aims to achieve.

    Several sources agreed to speak only after hearing what others had said. “It’s Julius Caesar time,” said one source. “There’s lots of knives, but no one wants to be first.” Others refused to be quoted, but encouraged me to give voice to their complaints—which sometimes diverged but often built into a sort of Greek chorus, an indictment of Bloomberg’s mayoralty from those who have seen it in practice, and are vested in it.

    “Hanging out with a billionaire does bad things to your brain,” a source said. “It makes you think you’re right.”

    The candidate who first ran in 2001 on his private-sector résumé and a deluge of advertising never did bother telling voters much about his agenda.

    He pledged in that first run not to raise taxes and to step away from the daily running of his private company if elected to public office, but he brushed aside both vows after the election. In the case of his business, he claimed to have kept his word until his own testimony in a lawsuit unsealed in 2007 showed that he’d been far more active than he’d previously acknowledged.

    The vast redevelopment schemes he unveiled in office were never mentioned on the stump.

    New Yorkers have no trouble picturing Giuliani’s New York, or Dinkins’s “gorgeous mosaic,” or Koch’s “How’m-I-doing?” New York, or Beame’s bankruptcy, or Lindsay’s “Fun City.”

    After two full terms and change, what do you call Bloomberg’s New York? In many ways, the mayor has been merely a caretaker.

    While Bloomberg has called himself the “education mayor,” his claimed success with the public schools has been exposed as largely accounting tricks.

    When asked to describe the boss’s vision for the city, aides and allies tack post-partisanship on to a checklist of Bloomberg LP buzzwords: transparency, data-driven results, and a CEO fixed on the bottom line. Pressed for actual accomplishments, the city’s post-9/11 resurgence usually is mentioned first.

    The attack and its economic fallout played key roles in all three of Bloomberg’s runs, though the story has less to do with strong leadership than with good timing and salesmanship.

    The attack itself, along with his opponent Mark Green’s fumbled response to it, helped put Bloomberg over the top in 2001. The ensuing Fed-sponsored low-interest-rate bubble inflated New York’s markets just in time to help rescue the mayor from record-low approval ratings and ensure his re-election in 2005. When that bubble finally burst in 2008, the Wall Street meltdown became the public rationale for the “emergency” third term.

    “Post-partisanship” has always meant the party of Bloomberg, a convenient handle for a lifelong Democrat who left the party to avoid a contested primary in New York. After the presidential plotting that occupied most of his second term fell short (the big hit that began his losing streak), Bloomberg aimed for a soft landing with a nakedly undemocratic “emergency” bill to allow himself a third term. Instead, it alienated New Yorkers and wrecked his expensively built reputation as a “post-political” leader in the process.

    Transparency has always been something Bloomberg has preferred to pitch rather than practice. In his 1997 business memoir, Bloomberg on Bloomberg—a sometimes valuable guide to the mayor’s approach—he notes that “if public companies change what they’re doing midstream, everyone panics. In a private company like Bloomberg, the analysts don’t ask, and as to the fact that we don’t know where we’re going—so what? Neither did Columbus.” It’s a philosophy Bloomberg brought with him to City Hall.

    “Data-driven”? It’s hard to credit that when crime numbers are artificially deflated by re-classifying rapes as misdemeanors, NYC-reported public school gains disappear when compared to outside measures, and when the city’s 65 percent graduation rate is undercut by state tests showing only 21.4 percent of city students are ready for college.

    “Bloomberg’s data-driven shtick,” said one source voicing a sentiment repeated by several others, “means no one will tell him anything’s failed.”

    As the city’s “CEO,” Bloomberg has managed only to track the ups and downs of Wall Street and the national economy. It’s a strictly replacement-level performance.

    New York went through its rainy-day reserves this year and, with the federal stimulus money spent, now faces $5 billion budget holes in each of the next three fiscal years. The coming budget crunch, says Manhattan Institute fellow Sol Stern, stems in large part from the mayor’s penchant for awarding generous contracts to teachers and other public-sector workers that also add to the pension bills the mayor has at times written off as “fixed costs.”

    Pushing the idea that the city, like a corporation, has a bottom line, Bloomberg diverts attention from the fundamental issue every mayor faces: what the city ought to be doing.

    So what kind of New York has Bloomberg tried to produce?

    The “buck-a-year mayor” offered his business success and vast wealth as his main credentials for running New York. In office, he has envisioned a big-business-friendly city supporting a New Deal welfare state.

    To make that work, he’s promoted “knowledge workers” as New York’s distinguishing resource, the way that waterways, rail lines, and manufacturing facilities were for industrial cities.

    The mayor has often described that group (which, not coincidentally, matches the profile of Bloomberg terminal subscribers) as “the best and brightest,” with no irony intended. The city now acts as its own advertisement to draw in members of the so-called “creative class” who are as likely to work in ICE (Ideas, Culture, Entertainment) as in the city’s traditional FIRE (Finance, Real Estate, Insurance) base. In his typical salesman’s formulation, Bloomberg often suggests that the only alternative to courting that crowd and their wealthy employers would be a cost-cutting race to the bottom.

    How else to pay for the array of services the city provides if not by building a safe and beckoning environment for elites and their Ivy-educated service class to live and work in, unmolested by an untidy big city?

    That promised environment is the vastly expanded and uninterrupted Midtown Central Business District, a coveted goal of the business and real estate communities for nearly a century—if one viewed with suspicion farther south on Wall Street, where Bloomberg effectively ceded control of Ground Zero to a succession of bumbling governors, a major reason that it’s taken a decade for the Trade Center site to even begin rising back up.

    Bloomberg has used a series of mega-plans including his Olympics bid, historic citywide rezoning changes, and pushing the sale of Stuyvesant Town to cut down what remained of working- and middle-class Manhattan. Gone, going, or forcibly shrinking are the Flower District, the Fur District, the Garment District, the Meatpacking District, and the Fulton Fish Market. Even the Diamond District is being nudged out of its 47th Street storefronts and into a city-subsidized new office tower.

    “If New York is a business,” the mayor said in 2003, “it isn’t Walmart—it isn’t trying to be the lowest-priced product in the market. It’s a high-end product, maybe even a luxury product. New York offers tremendous value, but only for those companies able to capitalize on it.”

    (Perhaps oddly, the mayor is a big booster of Walmart’s push to open stores in the city. Earlier this month, he defended the big-box store’s $4 million donation to a city summer job program, snapping at a Times reporter, “You’re telling me that your company’s philanthropy doesn’t look to see what is good for your company?” Asked how Walmart fits into the mayor’s vision, Deputy Mayor Howard Wolfson told me on Twitter that it “fits into the strategy of creating jobs and capturing tax $$ here that are currently going to NJ and LI.”)

    But even as Wall Street has revived, ordinary New Yorkers haven’t benefited from the promised trickle-down.

    Middle-class incomes in New York have been stagnant for a decade, while prices have soared, with purchasing power dropping dramatically. Never mind Manhattan—Queens taken as its own city would be the fifth most expensive one in America. While unemployment in the city has dropped below 9 percent, through June the city had replaced only about half of the 146,000 jobs lost during the recession—and the new jobs have mostly been in low-paying retail, hospitality, and food services positions, according to the Drum Major Institute for Public Policy. Poorly paid health care and social-service jobs, often subsidized by the city, make up 17.4 percent of all private-sector jobs as of 2007, a nearly one-third increase since 1990. Only 3 percent of the private-sector jobs in New York are in relatively high-paying manufacturing positions as of 2007, a figure that’s in the low double digits in Los Angeles, Chicago, and Houston. And the jobs expected to appear over the next decade are also clustered at the bottom of the pay scale.

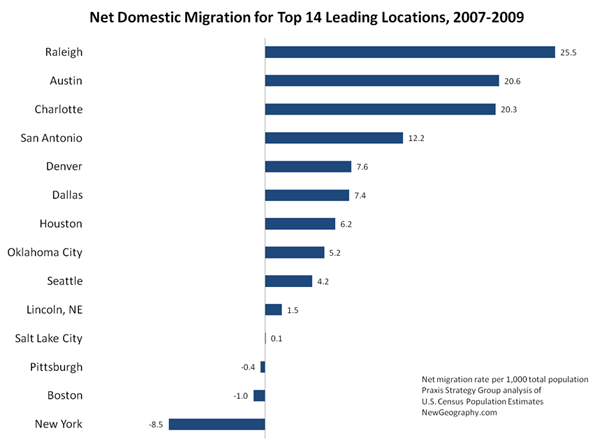
    A Marist Poll this year showed a striking 36 percent of New Yorkers under 35 intending to leave in the next five years, with 61 percent of that group citing the high cost of living. New York State already leads the nation in domestic out-migration—and New York City has had more than twice the exit rate of struggling upstate locations like Buffalo and Ithaca. More New Yorkers left the city in every year between 2002 and 2006 than in 1993, when the city was in far worse shape, with sky-high crime rates and an economy on the verge of collapse.

    Despite the mayor’s recruiting efforts, people with bachelor’s degrees continue to leave the city in greater numbers than they arrive here, with Brooklyn alone declining by 12,933 such citizens in 2006, according to the Center for an Urban Future, with many of those leaving discouraged by New York’s high costs, and the low quality of the public education available to their children.

    Mike Bloomberg thinks everyone’s dream is to come to the city with an MBA and find an inefficiency to exploit and become a billionaire, or at least get a good job with one, argued three unrelated sources who have worked with the mayor, all of whom asked not to be quoted directly on the mayor’s view of himself. His idea that everyone’s dream is to be on Park Avenue, say those sources, has alienated and insulted outer-borough “Koch Democrats.” Their dream is a house, and Mike Bloomberg diminishes that dream because he thinks everyone wants to be him.

    As Bloomberg memorably put it while floating his candidacy in early 2001: “What’s a billionaire got to do with it? I mean, would you rather elect a poor person who didn’t succeed? Look, I’m a great American dream.”

    Without an impressive public-school system, Bloomberg’s vision for New York falls apart. But the public-school “miracle” the mayor touted for years has proven all pitch and no payoff.

    Despite a massive 40 percent hike in per-pupil spending during Bloomberg’s first two terms, along with a 43 percent boost in teacher pay, the “historic” gains the mayor trumpets failed to register at all on the gold-standard national tests taken by the same students. When new state leaders put an end to the state’s easily gamed tests, what was left of the city’s years of paper gains disappeared.

    The ever-rising test scores Bloomberg had relentlessly promoted fell almost all the way back to the mundane levels that had prevailed when the mayor took control of the system in 2002. The incredible success he’s claimed in closing the achievement gap between black and Hispanic students and their white and Asian peers that’s vexed generations of educators disappeared entirely by some measures.

    Without high-quality schools to produce a cadre of well-educated citizens attractive to employers, Bloomberg’s implicit social contract with New Yorkers—that courting big businesses will help the little guy—breaks down, and the city’s appeal to those businesses is seriously tarnished, along with its long-term appeal to employees with children.

    “Bloomberg yoked his education agenda to his ambitions for higher office,” said Stern, who had initially backed both mayoral control of the schools and Bloomberg’s education agenda. “He recognized that the way he was going to prove [to voters nationwide] that he’d given more bang for the buck was through test scores, while at the same time he was also introducing cash incentives to principals and teachers for getting the scores up.” (That program was quietly shuttered this month after a city-commissioned study found the payments had no impact on student performance.)

    “So he invited the corruption,” Stern said, adding that he expects a numbers-juicing scandal to hit before Bloomberg leaves office. New Chancellor Dennis Walcott, responding to reports of grade-tampering in the city and a nationwide wave of such scandals, announced his own investigation this month, but it remains to be seen if the school system can fairly probe itself, and with the mayor’s reputation hanging in the balance.

    Asked in 2007 how New Yorkers could register their discontent with the schools now that he was presumably term-limited out of office, Bloomberg cracked, “Boo me at parades.”

    Some New Yorkers have taken him up on that, but more significantly they’ve also stopped caring enough to vote.

    The mayor has indeed governed as the city CEO he promised to be in 2001, redefining public life so that businesses are “clients,” citizens “customers,” and Bloomberg the boss entrusted with the city’s well-being, with no need to consult with the board before acting.

    After 1.9 million New Yorkers took to the polls in the 1989 and 1993 contests between Dinkins and Giuliani, less than 1.5 million voted in 2001’s nail-biter, and just 1.3 million turned out in 2005, when the outcome was never in doubt. Bloomberg nonetheless spent $84.6 million running up the score in a 19-point win intended to make him look “presidential.” In 2009, the mayor, responding to internal polls showing most New Yorkers wanted him out, broke the $100 million mark to project inevitability and discourage voters from showing up at all. Despite perfect weather on election day, three out of every four voters didn’t bother to participate. Just 1.2 million New Yorkers voted in an election that Bloomberg won by only 50,000 votes—collecting the fewest winning votes of any mayor since 1919, when there were 3 million fewer New Yorkers and women didn’t have the franchise. For the first time, Bloomberg’s spending failed to translate into popular support.

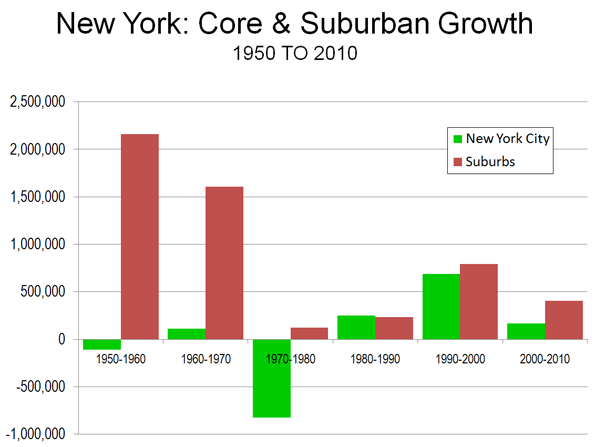
    As the city’s electorate shrank around him—even as its population grew by more than a million people between 1990 and 2010, Bloomberg’s political stature swelled. The voters who just stayed home allowed the mayor to hold on to power despite an outnumbered base of the city’s social and financial elites and the technocratic planners they often bankroll, a political and governing coalition last seen 40 years ago under fellow party-switcher John Lindsay.

    “My neighbors [in Manhattan] don’t vote in city primaries,” said a source. “They vote in presidential elections where their vote is useless. They’ve privatized their lives. Private schools, country houses, Kindles instead of libraries, cars instead of trains.”

    In exchange for Citizen Bloomberg’s benighted leadership, we’ve accepted a staggering array of conflicts of interest. The mayor’s fortune renders obsolete the “traditional” model of interest groups buying off politicians. He not only does the reverse, buying off interest groups to advance his political agenda but also uses his fortune to staff and support his business. At the same time, he builds the Bloomberg brand that supports it all: Bloomberg LP, the Bloomberg Family Foundation, Bloomberg Terminals, Bloomberg News, Bloomberg View, Bloomberg Government, Bloomberg Law, Bloomberg Markets—not to mention Mayor Bloomberg.

    The mayor wrote his own rules in a remarkably deferential 2002 agreement with the city’s toothless Conflict of Interest Board, and then ignored them when it was convenient, continuing to be regularly involved in his company’s affairs and acting in city matters where Bloomberg LP or Merrill Lynch (which until recently owned 20 percent of Bloomberg LP) had a stake.

    Top-level City Hall workers, favored legislators, and others have moved freely between City Hall and the mayor’s private interests, keeping it in the “Bloomberg Family.” Bloomberg LP is now run by former Deputy Mayor Dan Doctoroff, while the Bloomberg Family Foundation’s approximately $2 billion endowment is controlled, on a “volunteer” basis, by Deputy Mayor Patti Harris. The prospect of a private Bloomberg jackpot job is on a lot of minds around City Hall and throughout New York.

    Craig Johnson, the former state senator who lost a re-election bid after bucking his party to back the mayor in supporting charter schools, was hired this month by Bloomberg Law. “I wasn’t about to let him go to some other company,” Bloomberg said, all but winking. “I was thrilled to see my company hired him. I didn’t have anything to do with that.”

    Beyond the $267 million he spent in three mayoral runs, he documented nearly $200 million more in “anonymous” charitable contributions. And that cool half-billion is just the spending Bloomberg has chosen to disclose.

    Harris, now City Hall’s highest-paid official, came to the administration from Bloomberg LP. Through her control of Bloomberg’s ostensibly anonymous donations passed through the Carnegie Foundation to local institutions, she’s served as the Medici Mayor’s chief courtier—working for the city while using his private fortune to rent the silence, and occasionally the active assent, of its cultural groups on his behalf. That city giving dropped precipitously when Carnegie was replaced by the new Bloomberg Family Foundation, also run by Harris, which is now spreading cash to potential Bloomberg constituencies nationwide.

    As Bloomberg explained in 1997, when Harris worked for Bloomberg LP:  “Her sole job is to decide which philanthropic activities are appropriate for our company and to ensure we get our money’s worth when we donate time, money, and jobs. One of Patti’s questions is, ‘When does helping others help us?’… Not only does Patti commit our dollars, she also follows, influences, and directs how our gifts are used, ensuring our objectives are met.”

    Elsewhere in his memoir, he adds: “Peer pressure: Its impact in the philanthropic world is hard to overstate.”

    Meanwhile, Bloomberg News, supported by income from his sophisticated “Bloomberg terminals,” has grown to employ about 2,500 journalists, and at some of the best rates in the industry.

    After offering up vague statements about avoiding conflicts of interests—no easy task when the boss is a potential presidential candidate, mayor of the nation’s biggest city, and one of that city’s wealthiest men—Bloomberg View debuted in May with a remarkable opening editorial. The editors conceded that they didn’t know yet what their principles would be—”We hope that over time a general philosophy will emerge”—but they were confident they would end up aligned with the “values embodied by Mike Bloomberg, the founder of Bloomberg LP.”

    In June, brand-name Bloomberg pundit Jonathan Alter launched into an exceptionally vitriolic attack on charter school detractor and former Bloomberg education adviser-turned-foe Diane Ravitch. The piece ran with no acknowledgment of the evident conflict of interest in taking shots at perhaps the most prominent critic of Citizen Bloomberg’s education policies, under the Bloomberg View banner.

    Bloomberg seems to view himself as congenitally above such conflicts, explaining in Bloomberg on Bloomberg, “Our reporters periodically go before our sales force and justify their journalistic coverage to the people getting feedback from the news story readers…. In return, the reporters get the opportunity to press the salespeople to provide more access, get news stories better distribution and credibility, bring in more businesspeople, politicians, sports figures and entertainers to be interviewed…. Most news organizations never connect reporters and commerce. At Bloomberg, they’re as close to seamless as it can get.”

    Speaking of seamless, in 2000 Bloomberg rolled out a new city section, just in time for the boss’s run. Jonathan Capehart, brought in from Newsday, ended up doing double duty as candidate Bloomberg’s policy tutor and his host in different corners of the city, according to former Times reporter Joyce Purnick’s biography of the mayor, Mike Bloomberg: Money, Power, Politics. When the mayor-elect reached out to Al Sharpton on election night to tell him “things will be different with me as mayor,” it was Bloomberg News employee Capehart who placed the call.

    Much as City Hall staffers dream of a Bloomberg job as the big payoff for their loyal labors, few reporters will go out of their way to tweak a potential employer, let alone one who frequently lunches with their current boss. And especially one whose long-rumored ambition is to buy the Times one of these days—a buzz that the mayor’s camp hasn’t discouraged, Berlusconi comparisons be damned. (The Italian prime minister and Ross Perot are two of Bloomberg’s neighbors when he weekends in Bermuda).

    Along with Berlusconi, other comparisons heard in various conversations about Bloomberg included his Trump-like leveraging of his name (“It would be me and my name at risk. I would become the Colonel Sanders of financial information services…. I was Bloomberg—Bloomberg was money—and money talked”), his Hearst-like seduction of legislators with private jet rides and self-serving party-jumping, and his Rockefeller-like use of his private fortune on behalf of the state GOP, though for very different reasons.

    The lifelong Democrat who became a Republican to dodge the mayoral primary has also given millions to the state GOP (as well as $250,000 to the Republican National Committee in 2002, and $7 million in support of the 2004 Republican convention in Manhattan). The cash shipments continued even after the mayor left the party in 2007 to hitch his star to the misleadingly named “Independence Party”—run in the city by crackpot cultist Lenora Fulani.

    While Bloomberg’s support for the GOP dwarfed the money he channeled to the Independence Party, both received just a drop from his enormous bucket of cash—which still made Bloomberg easily the state Republicans’ biggest patron, his table scraps their feast. The party repaid that support in part with their ballot line in 2009, two years after he’d left the party, to go along with his “Independence” line, which proved crucial to his 2001 and 2009 wins, and would have been key had his presidential plans moved forward.

    His Albany cash, though, has often failed to pay off. Perhaps that’s because Bloomberg hasn’t been willing or able to salt the state’s interest groups and leadership class as thoroughly as he has the city’s—his political persuasiveness and popularity have always been coterminous with his cash. In each of his terms, major aims—Far West Side development, congestion pricing, and teacher hiring—have been simply abandoned in the capitol without so much as a vote. Those losses came despite dealing with three weak governors before Cuomo, whose dramatic ascent has left the mayor further diminished. (One of Bloomberg’s rare wins in the state capitol, mayoral control of the city schools, was actually given to him by Assembly Speaker Sheldon Silver, the mayor’s most frequent Albany foil—who had withheld the same gift from Mayor Giuliani.)

    Given Citizen Bloomberg’s success in buying off the city’s opinion makers, cultural institutions, community groups, and organized protesters, it’s no wonder the mayoralty began to feel too small for him, and he spent the bulk of his second term trying to leverage it into the presidency. While his signature congestion-pricing plan failed in the city, it succeeded in landing him on the cover of Time. He followed up by a nationwide victory tour with then-Chancellor Joel Klein and well-compensated occasional sidekick Sharpton to tout the school system’s “amazing results.”

    The master salesman, who talked of transparency while keeping his own cards down, used his fortune to establish at City Hall the “benevolent dictatorship” he saw at Salomon and then employed in his private business: “Nor did so-called corporate democracy get in the way. ‘Empowerment’ wasn’t a concept back then, nor was ‘self-improvement’ or ‘consensus,’ ” Bloomberg writes in his business memoir. “The managing partner in those days made all the important decisions. I suspect that many times, he didn’t even tell the executive committee after he’d decided something, much less consult them before. I’d bet they never had a committee vote. I know they never polled the rest of us on anything. This was a dictatorship, pure and simple. But a benevolent one.”

    But dictatorships never last. “Once Bloomberg leaves a room, it doesn’t exist to him,” said one source, skeptical that the mayor would care about maintaining his influence after he exits office. But given the value of his name, he is taking care to be sure that it isn’t damaged in the exit process.

    Campaign filings released last Friday show the lame duck nonetheless spent $5.6 million on TV and direct mail spots promoting himself in March and April. And after failing to groom a successor, the mayor has belatedly been trying to institutionalize parts of the Bloomberg way.

    “The administration is finally trying to do systematic reform, that’s what [Stephen] Goldsmith is here for,” a source said, referring to the former Indianapolis mayor who emerged as a star of the 1990s “reinventing government” movement, and signed on for Bloomberg’s third term as a deputy mayor. “I think he’s really frustrated. He complains a lot about lawyers.”

    While Police Commissioner Ray Kelly reportedly mulls a Republican run, buzz has been building that Bloomberg will support City Council Speaker Christine Quinn, his Democratic partner in changing the term-limits law, as his successor. A slush-fund scandal left her damaged, but a third term she and the mayor pushed through bought her time to recover, along with a chip to cash with him. Mayor Koch last month outright said that Bloomberg had told him he was backing Quinn, before Koch dialed back his words later the same day.
    But some of the Bloomberg-for-Quinn hype has come from operatives with reason to find a new patron once the billionaire exits office. The mayor, meanwhile, has reason to want a pliant speaker in his final years.
    “Even if he does back her,” a source noted, “he’s not giving her $100 million for a campaign, or to wield as mayor. Once he’s gone, it’s done.”

    Contact Harry Siegel at hsiegel@villagevoice.com

    Photo courtesy of Be the Change, Inc. :: Photo credit Jim Gillooly/PEI

  • The Next Boom Towns In The U.S.

    What cities are best positioned to grow and prosper in the coming decade?

    To determine the next boom towns in the U.S., with the help of Mark Schill at the Praxis Strategy Group, we took the 52 largest metro areas in the country (those with populations exceeding 1 million) and ranked them based on various data indicating past, present and future vitality.

    We started with job growth, not only looking at performance over the past decade but also focusing on growth in the past two years, to account for the possible long-term effects of the Great Recession. That accounted for roughly one-third of the score.  The other two-thirds were made up of a a broad range of demographic factors, all weighted equally. These included rates of family formation (percentage growth in children 5-17), growth in educated migration, population growth and, finally, a broad measurement of attractiveness to immigrants — as places to settle, make money and start businesses.

    We focused on these demographic factors because college-educated migrants (who also tend to be under 30), new families and immigrants will be critical in shaping the future.  Areas that are rapidly losing young families and low rates of migration among educated migrants are the American equivalents of rapidly aging countries like Japan; those with more sprightly demographics are akin to up and coming countries such as Vietnam.

    Many of our top performers are not surprising. No. 1 Austin, Texas, and No. 2 Raleigh, N.C., have it all demographically: high rates of immigration and migration of educated workers and healthy increases in population and number of children. They are also economic superstars, with job-creation records among the best in the nation.

    Perhaps less expected is the No. 3 ranking for Nashville, Tenn. The country music capital, with its low housing prices and pro-business environment, has experienced rapid growth in educated migrants, where it ranks an impressive fourth in terms of percentage growth. New ethnic groups, such as Latinos and Asians, have doubled in size over the past decade.

    Two advantages Nashville and other rising Southern cities like No. 8 Charlotte, N.C., possess are a mild climate and smaller scale. Even with population growth, they do not suffer the persistent transportation bottlenecks that strangle the older growth hubs. At the same time, these cities are building the infrastructure — roads, cultural institutions and airports — critical to future growth. Charlotte’s bustling airport may never be as big as Atlanta’s Hartsfield, but it serves both major national and international routes.

    Of course, Texas metropolitan areas feature prominently on our list of future boom towns, including No. 4 San Antonio, No. 5 Houston and No. 7 Dallas, which over the past years boasted the biggest jump in new jobs, over 83,000. Aided by relatively low housing prices and buoyant economies, these Lone Star cities have become major hubs for jobs and families.

    And there’s more growth to come. With its strategically located airport, Dallas is emerging as the ideal place for corporate relocations. And Houston, with its burgeoning port and dominance of the world energy business, seems destined to become ever more influential in the coming decade. Both cities have emerged as major immigrant hubs, attracting on newcomers at a rate far higher than old immigrant hubs like Chicago, Boston and Seattle.

    The three other regions in our top 10 represent radically different kinds of places. The Washington, D.C., area (No. 6) sprawls from the District of Columbia through parts of Virginia, Maryland and West Virginia. Its great competitive advantage lies in proximity to the federal government, which has helped it enjoy an almost shockingly   ”good recession,” with continuing job growth, including in high-wage science- and technology-related fields, and an improving real estate market.

    Our other two top ten, No. 9 Phoenix, Ariz., and No. 10 Orlando, Fla., have not done well in the recession, but both still have more jobs now than in 2000. Their demographics remain surprisingly robust. Despite some anti-immigrant agitation by local politicians, immigrants still seem to be flocking to both of these states. Known better s as retirement havens, their ranks of children and families have surged over the past decade. Warm weather, pro-business environments and, most critically, a large supply of affordable housing should allow these regions to grow, if not in the overheated fashion of the past, at rates both steadier and more sustainable.

    Sadly, several of the nation’s premier economic regions sit toward the bottom of the list, notably former boom town Los Angeles (No. 47). Los Angeles’ once huge and vibrant industrial sector has shrunk rapidly, in large part the consequence of ever-tightening regulatory burdens. Its once magnetic appeal to educated migrants faded and families are fleeing from persistently high housing prices, poor educational choices and weak employment opportunities. Los Angeles lost over 180,000 children 5 to 17, the largest such drop in the nation.

    Many of L.A.’s traditional rivals — such as Chicago (with which is tied at No. 47), New York City (No. 35) and San Francisco (No. 42) — also did poorly on our prospective list.  To be sure,  they will continue to reap the benefits of existing resources — financial institutions, universities and the presence of leading companies — but their future prospects will be limited by their generally sluggish job creation and aging demographics.

    Of course, even the most exhaustive research cannot fully predict the future. A significant downsizing of the federal government, for example, would slow the D.C. region’s growth. A big fall in energy prices, or tough restrictions of carbon emissions, could hit the Texas cities, particularly Houston, hard. If housing prices stabilize in the Northeast or West Coast, less people will flock to places like Phoenix, Orlando or even Indianapolis (No.11) , Salt Lake City (No. 12) and Columbus (No. 13). One or more of our now lower ranked locales, like Los Angeles, San Francisco and New York, might also decide to reform in order to become more attractive to small businesses and middle class families.

    What is clear is that well-established patterns of job creation and vital demographics will drive future regional growth, not only in the next year, but over the coming decade.  People create economies and they tend to vote with their feet when they choose to locate their families as well as their businesses.  This will prove   more decisive in shaping future growth   than the hip imagery and big city-oriented PR flackery that dominate media coverage of America’s changing regions.

    Cities of the Future Rankings
    Rank Metropolitan Area
    1 Austin, TX
    2 Raleigh, NC
    3 Nashville, TN
    4 San Antonio, TX
    5 Houston, TX
    6 Washington, DC-VA-MD-WV
    7 Dallas-Fort Worth, TX
    8 Charlotte, NC-SC
    8 Phoenix, AZ
    10 Orlando, FL
    11 Indianapolis, IN
    12 Salt Lake City, UT
    13 Columbus, OH
    14 Jacksonville, FL
    15 Atlanta, GA
    16 Las Vegas, NV
    16 Riverside, CA
    18 Portland, OR-WA
    19 Denver, CO
    20 Oklahoma City, OK
    21 Baltimore, MD
    22 Louisville, KY-IN
    22 Richmond, VA
    24 Seattle, WA
    25 Kansas City, MO-KS
    26 San Diego, CA
    27 Miami, FL
    28 Tampa, FL
    29 Sacramento, CA
    30 Birmingham, AL
    31 New Orleans, LA
    32 Philadelphia, PA-NJ-DE-MD
    33 Minneapolis, MN-WI
    34 St. Louis, MO-IL
    35 Cincinnati, OH-KY-IN
    35 New York, NY-NJ-PA
    37 Boston, MA-NH
    38 Memphis, TN-MS-AR
    39 Pittsburgh, PA
    40 Virginia Beach, VA-NC
    41 Rochester, NY
    42 Buffalo, NY
    42 San Francisco, CA
    44 Hartford, CT
    45 Milwaukee, WI
    45 San Jose, CA
    47 Chicago, IL-IN-WI
    47 Los Angeles, CA
    49 Providence, RI-MA
    50 Detroit, MI
    51 Cleveland, OH

    This piece originally appeared at Forbes.com.

    Joel Kotkin is executive editor of NewGeography.com and is a distinguished presidential fellow in urban futures at Chapman University, and an adjunct fellow of the Legatum Institute in London. He is author of The City: A Global History. His newest book is The Next Hundred Million: America in 2050, released in February, 2010.

    Photo by Exothermic Photography

  • Listing the Best Places Lists: Perception Versus Reality

    Often best places lists reflect as much on what’s being measured, and who is being measured as on the inherent advantages of any locale.  Some cities that have grown rapidly in jobs, for example, often do not do as well if the indicator has more to do with perceived “quality” of employment.

    Take places like Denver and Seattle. Both do well on what may be considered high-tech measurements – bandwidth, educated migration, entrepreneurial start ups – but have trailed other places in terms of creating jobs. Others, such as Oklahoma City and Raleigh, do better in terms of overall job creation and cost competitiveness.

    There are effectively few truly objective criteria, and the Area Development list does tend to weigh a bit heavy on the factors that help more expensive – although not necessarily the most costly – cities. If cost of doing business, or regulatory environments were given more weight, some of the high fliers would not do as well.

    We prefer to focus less on atmospherics and more on how people, and businesses, are voting for their feet. San Francisco and New York have generally had slower job growth and greater outmigration, but do well on lists that focus on perceived qualitative factors.

    But then there is Austin. Here is one region that has it all, the low costs and favorable regulatory climate of Texas along with the amenities associated with a high-tech region. The area creates a large number of jobs of varying types and is still inexpensive enough to attract young, upwardly mobile families. This gives it a critical advantage over places like Silicon Valley, Los Angeles or New York.  Unlike those three centers, Austin performs extraordinarily well in quantitative measurements.

    The region that most closely matches Austin in these respects is not Seattle and Denver, but Raleigh Durham. Recently a group of leaders from Raleigh made a visit to Denver to learn what makes that city successful. Speaking to the group, we pointed out that by objective measurement – job growth, educated migration, population growth – Raleigh beat Denver by a long shot, yet it was to Denver the group was looking for inspiration. In fact, over the past three years, Americans have moved to Raleigh at a rate more than three times that of Denver.  Perception can be a funny thing which makes a winner feel inferior to a clear runner-up.

    Another strange result is that New York and Houston had the same number of mentions. Yet looking at numbers — from educated migration, job growth, population increase — Houston slaughters New York. People, from the college educated on down are flocking to Houston while fleeing, in rather large numbers, from New York. One has to wonder where the rankers live and where they are coming from. Houston triumphs on performance, while New York, to a large extent, wins on perception. 

    Looking simply at job growth over the past ten years for the Leading Locations mentioned on at least five surveys, the 14 regions separate themselves into three groups.  The top tier of places – Austin, Raleigh, San Antonio, and Houston – all have seen job growth of more than 12% and seem to be recovering from the recession faster than the others.  

    Salt Lake City and Charlotte were tracking with the top tier of places until 2007 but have since fallen to the second tier of cities.  The remainder of the second tier includes steady growers Dallas and Lincoln, along with Oklahoma City, a region that has seen a boom in jobs since bottoming out in 2003.

    The final job growth tier of places includes five regions that have fewer jobs than ten years ago.  Seattle drops just below the zero line after being hit particularly hard by the 2001 and 2008 recessions, while New York and Denver finish near the national rate.  Pittsburgh and Boston spent most of the decade below their 2000 employment levels, but each seem to be recovering from the recession faster than many of the other Leading Locations cities. 

    But perhaps the biggest problem with lists has to do with the size of regions. Much of the fastest growth in America, particularly in terms of jobs, has been in small metros, many with fewer than 1 million or 500,000 residents. Smaller dynamic areas such as Anchorage, Alaska; Bismarck, North Dakota; Dubuque, Iowa; or Elizabethtown, Kentucky – all in the top 25 of NewGeography’s Best Cities for Job Growth 2011 Rankings – are too small to show up on some lists yet may be a location of choice for expansion. This reflects not so much their relative desirability but the fact that, unlike larger regions, they simply are not included on many rankings.

    Ultimately, a list of lists does tell us much, but perhaps only so much for a specific individual or business. For someone interested in the movie business, for example, Los Angeles – and increasingly places like New Orleans or Albuquerque – are great draws, but perhaps not so much for financial services.  The lists of lists are useful to identify hotspots, but for most location decisions, it may be more imperative to drill down to more detailed industry sectors and workforce attributes. And most of all, take the perception factor into account and look instead at the real numbers to tell you where to go.

    This piece first appeared at AreaDevelopment.com, as part of its Leading Locations series discussing best cities rankings.

    Joel Kotkin is a Distinguished Presidential Fellow in Urban Futures at Chapman University in California, an adjunct fellow with the London-based Legatum Institute, and the author of The Next Hundred Million: America in 2050. Mark Schill is Vice President of Research at Praxis Strategy Group, an economic research and community strategy firm.  Both are editors at NewGeography.com, a provider of two surveys for Area Development’s Leading Locations list.

    Photo by mclcbooks

  • Goodbye, New York State Residents are Rushing for the Exits

    For more than 15 years, New York State has led the country in domestic outmigration: for every American who comes to New York, roughly two depart for other states. This outmigration slowed briefly following the onset of the Great Recession. But a new Marist poll released last week suggests that the rate is likely to increase: 36 percent of New Yorkers under 30 are planning to leave over the next five years. Why are all these people fleeing?

    For one thing, according to a recent survey in Chief Executive, New York State has the second-worst business climate in the country. (Only California ranks lower.) People go where the jobs are, so when a state repels businesses, it repels residents, too. It’s also telling that in the Marist poll, 62 percent of New Yorkers planning to leave cited economic factors—including cost of living (30 percent), taxes (19 percent), and the job environment (10 percent)—as the primary reason.

    In upstate New York, a big part of the problem is extraordinarily high property taxes. New York has the 15 highest-taxed counties in the country, including Nassau and Westchester, which rank first and second nationwide. Most of the property tax goes toward paying the state’s Medicaid bill—which is unlikely to diminish, since the state’s most powerful lobby, the political cartel created by the alliance of the hospital workers’ union and hospital management, has gone unchallenged by new governor Andrew Cuomo.

    New York City doesn’t suffer from outmigration to the extent that the state does; in fact, the city grew slightly over the past decade, thanks to immigration. And there’s more work in Gotham than in the state as a whole. The problem is that the kind of work available shows that the city accommodates new immigrants much better than it supports middle-class aspirations. A recent report from the Drum Major Institute helps make sense of the Marist numbers: “The two fastest-growing industries in New York are also the lowest paid. More than half of the city’s employment growth over the past year has been in retail, hospitality, and food services, all of which pay their workers less than half of the city’s average wage.” Worse yet, more than 80 percent of the new jobs are in the city’s five lowest-paying sectors. Parts of the country are seeing a revival of manufacturing—traditionally a source of upward mobility for immigrants—but not New York City, whose manufacturing continues to decline. The culprits here include the city’s zoning policies, business taxes, and declining physical infrastructure.

    Then there’s the cost of living in New York City. A 2009 report by the Center for an Urban Future found that “a New Yorker would have to make $123,322 a year to have the same standard of living as someone making $50,000 in Houston. In Manhattan, a $60,000 salary is equivalent to someone making $26,092 in Atlanta.” Even Queens, the report found, was the fifth most expensive urban area in the country.

    The implications of Gotham’s hourglass economy—with all the action on the top and bottom, and not much in the middle—are daunting. The Drum Major report, which noted that 31 percent of the adults employed in New York work at low-wage labor, came with a political agenda. The institute wants the city to subsidize new categories of work by expanding the scope of “living-wage” laws, which require higher pay than minimum-wage laws do, to all businesses that receive city funds or contracts. But that would mean higher taxes for the middle class and a further narrowing of the hourglass’s midsection.

    Governor Cuomo is calling for a property-tax cap, but without “mandate relief” for localities—for example, relaxing state laws that require localities to pay out exorbitant pension benefits. Mayor Michael Bloomberg has pledged not to increase local taxes, but even at their current level, city taxes and regulations will keep serving as an exit sign for aspiring twentysomething workers. In short, we can expect New York to lead the country in outmigration for the near future.

    This piece first appeared in the City Journal.

    Fred Siegel is a contributing editor of City Journal, a senior fellow at the Manhattan Institute, and a scholar in residence at St. Francis College in Brooklyn.

    Photo by Christopher Schoenbohm

  • Transit: The 4 Percent Solution

    A new Brookings Institution report provides an unprecedented glimpse into the lack of potential for transit to make a more meaningful contribution to mobility in the nation’s metropolitan areas. The report, entitled Missed Opportunity: Transit and Jobs in Metropolitan America, provides estimates of the percentage of jobs that can be accessed by transit in 45, 60 or 90 minutes, one-way, by residents of the 100 largest US metropolitan areas. The report is unusual in not evaluating the performance of metropolitan transit systems, but rather, as co-author Alan Berube put it, "what they are capable of." Moreover, the Brookings access indicators go well beyond analyses that presume having a bus or rail stop nearby is enough, missing the point the availability of transit does not mean that it can take you where you need to go in a reasonable period of time.

    Transit: Generally Not Accessible: It may come as a surprise that, according to Brookings, only seven percent of jobs in the nation’s largest metropolitan areas can be reached by residents in 45 minutes during the morning peak period (when transit service is the most intense). Among the 29 metropolitan areas with more than 2,000,000 population, the 45 minute job access average was 5.6 percent, ranging from 12.6 percent in Boston to 1.3 percent in Riverside-San Bernardino. The New York’s metropolitan area’s 45 minute job access figure was 9.8 percent (Figure 1).

    Brookings did not examine a 30 minute transit work trip time. However, a bit of triangulation (Note 1) suggests that the 30 minute access figure would be in the range of 3 to 4 percent, at most about 4,000,000 jobs out of the more than 100 million in these metropolitan areas.   At least 96 percent of jobs in the largest metropolitan areas would be inaccessible by transit in 30 minutes for the average resident (Figure 2).

    The Brookings report also indicates that indicates that 13 percent of employment is accessible within 60 minutes by transit and 30 percent within 90 minutes (Note 2). Brookings focuses principally on the 90 minutes job accessibility data. However, the reality is that few people desire a 45 minute commute, much less one of 90 minutes.

    In 2009, in fact, the median one way work trip travel time in the United States was 21 minutes (Note 3). Approximately 68 percent of non-transit commuters (principally driving alone, but also car pools, working at home, walking, bicycles, taxicabs and other modes) were able to reach work in less than 30 minutes. The overwhelming majority, 87 percent, were able to reach work in 45 minutes or less, many times transit’s seven percent. Transit’s overall median work trip travel time was more than double that of driving alone (Figure 3).

    A mode of transport incapable of accessing 96 percent of jobs within a normal commute period simply does not meet the needs of most people. This makes somewhat dubious claims that transit can materially reduce congestion or congestion costs throughout metropolitan areas. The Brookings estimates simply confirm the reality that has been evident in US Census Bureau and US Department of Transportation surveys for decades: that transit is generally not time-competitive with the automobile. It is no wonder that the vast majority of commuters in the United States (and even in Europe) travel to work by car.

    Much of the reason for transit’s diminished effectiveness lies in the fact that downtowns — the usual destination for transit — represent a small share of overall employment. Downtown areas have only 10 percent of urban area employment, yet account for nearly 50 percent of transit commuting in the nation’s largest urban areas (Figure 4).

    Meanwhile, core areas, including downtown areas, represent a decreasing share of the employment market as employment dispersion has continued. Since 2001, metropolitan areas as different as Philadelphia, Portland, Dallas-Fort Worth, Salt Lake City, Denver and St. Louis, saw suburban areas gain employment share. Even in the city of New York, outer borough residents are commuting more to places other than the Manhattan central business district (link to chart).

    Transit: The Long Road Home: Transit problem stems largely from its relative inconvenience.    In 2009, 35 percent of transit commuters had work trips of more than 60 minutes. Only six percent of drivers had one way commutes of more than 60 minutes. For all of the media obsession about long commutes, more than twice as many drivers got to work in less than 10 minutes than the number who took more than an hour. In the case of transit, more than 25 times as many commuters took more than 60 minutes to get to work as those who took less than 10 minutes.

    Economists Peter Gordon and Harry W. Richardson have shown that the continuing dispersion of jobs (along with residences) has kept traffic congestion under control in the United States. Available data indicates that work trips in the United States generally take less time than in similar sized urban areas in Europe, Japan, Canada and Australia.

    Transit Access is Better for Low Income Citizens: The Brookings report also indicated that job accessibility was better for low income citizens than for the populace in general. Approximately 36 percent of jobs were accessible to low-income residents in 90 minutes, compared to the overall average of 30 minutes. This, of course, is because low income citizens are more concentrated in the central areas of metropolitan areas where transit service is better. But even this may be changing. For example, Portland’s aggressive gentrification and transit-oriented development programs are leading to lower income citizens, especially African-Americans, being forced out of better served areas in the core to more dispersed areas where there is less transit. Nikole Hannah Jones of The Oregonian noted:

    "And those who left didn’t move to nicer areas. Pushed out by gentrification, most settled on the city’s eastern edges, according to the census data, where the sidewalks, grocery stores and parks grow sparse, and access to public transit is limited." 

    Realistic Expectations: More money cannot significantly increase transit access to jobs. Since 1980, transit spending (inflation adjusted) has risen five times as fast as transit ridership. A modest goal of doubling 30 minute job access to between 6 and 8 percent would require much more than double the $50 billion being spent on transit today.

    Moreover, there is no point to pretending that traffic will get so bad that people will abandon their cars for transit (they haven’t anywhere) or that high gas prices will force people to switch to transit. No one switches to transit for trips to places transit doesn’t go or where it takes too long.

    Nonetheless, transit performs an important niche role for commuters to some of the nation’s largest downtown areas, such in New York, Chicago, Boston, San Francisco, and Philadelphia. Approximately half or more of commuters to these downtowns travel there by transit and they account for nearly 40 percent of all transit commuters in the 50 largest urban areas.   

    Yet for 90 percent of employment outside downtown areas, transit is generally not the answer, and it cannot be made to be for any conceivable amount of money. If it were otherwise, comprehensive visions would already have been advanced to make transit competitive with cars across most of, not just a small part of metropolitan areas.  

    All of this is particularly important in light of the connection between economic growth and minimizing the time required to travel  to jobs throughout the metropolitan area.

    The new transit job access is important information for a Congress, elected officials, and a political system seeking ways out of an unprecedented fiscal crisis.

    A four percent solution may solve 4 percent of the problem, but is incapable of solving the much larger 96 percent.

    Notes:

    1. For example at difference between transit commuters reaching work in less than 30 minutes and 45 minutes, Brookings employment access estimate of 7 percent at 45 minutes would become 3 percent at 30 minutes.

    2. The Brookings travel time assumptions appear to be generally consistent with data from the Census Bureau’s American Community Survey (ACS) and the US Department of Transportation’s National Household Transportation Survey (NHTS). Brookings, ACS includes the time spent walking to transit in work trip travel times (For example, the ACS questionnaire asks respondents how long it takes to get from home to work and thus includes the time necessary to walk to transit).

    3. Median travel times are estimated from American Community Survey data for 2009 and includes working at home. The "median" is the point at which one half of commuters take more time and one-half of commuters take less time to reach work and is different from the more frequently cited "average" travel time, which was 25.5 minutes in 2008.

    4. Is Transit Better in Smaller Metropolitan Areas? It is generally assumed that transit service is better in larger metropolitan areas than in smaller metropolitan areas. Yet, the Brookings data seems to indicate the opposite. Larger metropolitan areas tended to have less job access by transit than smaller metropolitan areas. In the largest 20 percent (quintile) of metropolitan areas, only 5.5 percent of employment was accessible within 45 minutes. This was the smallest quintile accessibility score, and well below the middle quintile at 9.2 percent and the bottom quintile at 8.3 percent. The top quintile included metropolitan areas with 2.6 million or more people, the middle quintile included metropolitan areas with 825,000 to 1,275,000 population and the bottom quintile included metropolitan areas between 500,000 and 640,000 (Figure 1). This stronger showing by smaller metropolitan areas probably occurs because it is far less expensive for transit to serve a smaller area. Further, smaller metropolitan areas can have more concentration in core employment.  Even so, smaller metropolitan areas tend to have considerably smaller transit market shares than larger metropolitan areas.

    Wendell Cox is a Visiting Professor, Conservatoire National des Arts et Metiers, Paris and the author of “War on the Dream: How Anti-Sprawl Policy Threatens the Quality of Life

    Photo: Suburban employment: St. Louis (by author)

  • World Urbanization Update: Delhi 2nd in a World of Smaller Urbanization

    Perhaps the most surprising development in urban areas over the past year was the ascendancy of Delhi to rank second in the world in population, following only Tokyo – Yokohama. Based upon the new United Nations population estimate, the 7th annual edition of Demographia World Urban Areas places Delhi’s population at 22.6 million. Tokyo – Yokohama, however, is in no immediate jeopardy of losing its number one status, with a population estimated at 36.7 million, approximately 70 percent greater than that of Delhi (Note 1). Demographia World Urban Areas includes population estimates  for all identified urban areas in the world with 500,000 or more residents. Among these 796 urban areas, 169 are in higher income nations and 627 are in lower income nations.

    The Largest Urban Areas: For years, demographers have been watching Mumbai on the assumption that it might eventually emerge as the largest urban area outside Tokyo – Yokohama. However, Mumbai, at 21.3 million, has fallen behind faster growing Delhi and now ranks as the sixth largest urban area in the world. Seoul-Incheon, in Korea, has emerged as the number three urban area, based upon higher than anticipated  suburban growth registered in the 2010 census and now shows a population of 22.5 million. Jakarta, Indonesia’s capital, now stands as number four, with a population of 22.2 million, followed by number five Manila at 21.3 million (Note 2). The next three largest world urban areas are in the Americas with New York at 20.7 million, Sao Paulo at 20.4 million and Mexico City at 19.6 million. The world’s 10th largest urban area is Shanghai (18.7 million), which experienced larger than anticipated growth toward the end of the decade (Table).

    10 Largest Urban Areas in the World: 2011
    Rank
    Geography Urban Area
    Current Year Population Estimate
    Land Area: Square Miles
    Density
    Land Area: Km2
    Density
    Density Year
    1 Japan Tokyo-Yokohama
    36,690,000
    3,500
    10,500
    9,065
    4,000
    2011
    2 India Delhi, DL-HAR-UP
    22,630,000
    605
    37,000
    1,567
    14,300
    2011
    3 South Korea Seoul-Incheon
    22,525,000
    835
    27,000
    2,163
    10,400
    2011
    4 Indonesia Jakarta
    22,245,000
    1,075
    20,400
    2,784
    7,900
    2011
    5 Philippines Manila
    21,295,000
    550
    37,000
    1,425
    14,300
    2009
    6 India Mumbai, MAH
    21,290,000
    300
    70,300
    777
    27,100
    2011
    7 United States New York, NY-NJ-CT
    20,710,000
    4,349
    4,500
    11,264
    1,800
    2000
    8 Brazil Sao Paulo
    20,395,000
    1,125
    18,100
    2,914
    7,000
    2011
    9 Mexico Mexico City
    19,565,000
    780
    25,000
    2,020
    9,700
    2011
    10 China Shanghai
    18,665,000
    1,125
    16,500
    2,914
    6,400
    2011


    Among the top ten urban areas, New York is by far the least dense, followed by Tokyo-Yokohama. They are also the most affluent, with seven of the remaining 10 far more dense and located in lower income countries, while Seoul-Incheon is more dense, but in a nation that is among the latest entrants to higher income status (Figures 1 & 2).


    Highest Population Densities: Dhaka, the capital of Bangladesh is the most dense with 90,600 persons per square mile or 35,000 per square kilometer. Dhaka ranks 24th in population in the world and crowds its approximately 11.5 million residents into 125 square miles or 325 square kilometers (less than the land area of the municipality of Portland, Oregon). Mumbai ranks second in population density, with 70,300 per square mile or 27,100 percent per square kilometer. Among high income urban areas, Macau is the most dense, at 70,000 per square mile or 27,000 per square kilometer, slightly ahead of its neighbor across the Pearl River, Hong Kong, which is estimated to have 66,100 residents per square mile or 25,500 per square kilometer. Of course, both Hong Kong and Macau have artificially high densities, driven by their enclave status. Comparatively few urban areas in the high income world exceed 15,000 per square mile (6,000 per square kilometer).

    Largest Urban Land Area: Although we commonly identify Gotham with the density of high-rise Manhattan, New York sprawls more than any of the top urban areas. Its urban area contains far the largest  land area, stretching to cover 4,350 square miles or 11,300 square kilometers. Los Angeles, more noted for its physical expanse, has approximately one-half the land area of New York and it extends less than both Tokyo – Yokohama and Chicago. Perhaps astonishingly, the Boston urban area covers approximately 95 percent of the land area of Los Angeles, though with only one-third the population.

    Larger Urban Areas, Higher Density: As urban areas become larger, their population densities also increase. Moreover, as in the top 10 urban areas, lower income nations tend to have far higher densities than the urban areas located in the higher income nations(Figures 3 & 4).


    • Overall urban densities are approximately 9,000 per square mile (3,500 per square kilometer) in urban areas with between 500,000 and 1 million population and rise to 15,500 per square mile (6,000 per square kilometer) among urban areas with more than 10 million population.
    • Urban areas in higher income nations range from a population density of 3,800 per square mile (1,500 per square kilometer) among urban areas with from 500,000 to 1,000,000 population. Larger urban areas with more than 10 million population average o 8,900 per square mile (3,400 per square kilometer).
    • The urban areas located in lower income nations have far higher densities densities, ranging from 15,100 per square mile (6,000 per square kilometer) in the 500,000 to 1,000,000 population category and up to 22,100 residents per square mile (8,500 per square kilometer) in the over 10 million population category.           


    Population Density by  Region: There is also considerable variation in urban population densities between the regions of the world (Figures 5 & 6).


    The lowest densities are in affluent areas. The United States and Canada, at 3,600 per square mile (1,400 per square kilometer), Oceania at 4,100 per square mile (1,600 per square kilometer) and Europe at 8,400 per square mile (3,200 per square kilometer). Latin American urban densities are 15,900 per square mile (6,200 per square kilometer), followed by Africa at 18,600 per square mile (7,200 per square kilometer) and Asia, at 18,800 per square mile (7,300 per square kilometer).

    The overall population density of urban areas with more than 500,000 residents in India is estimated at 37,000 per square mile (14,400 per square kilometer), which is more than double that of China, at 17,000 per square mile (6,700 per square kilometer).

    A Smaller Urban World? A review of the size of the world urban areas shows the planet to be made up principally of rural areas and towns and cities with less than 500,000 population. In 2011, approximately 51 percent of the world is urban and 49 percent is rural. Urban areas ranging from just a few thousand residents to under 500,000 residents account for 27 percent of the world’s population, which constitutes a majority of its urban population. Among the larger urban areas, megacities (10,000,000 and larger) and the urban areas with between 1 million people and 2.5 million people each for approximately 6 percent of the world population. The other larger categories of urban areas each account for approximately 4 percent of the world’s population (Figure 5).

    The McKinsey Global Institute recently reported that the world’s megacities were growing less quickly than the other large urban areas. This development, along with the distribution of world urban population may indicate that world’s largest urban areas, especially the megacities, may not be the wave of the future; instead it may be smaller urbanized regions between 500,000 and 10 million.  These regions, with three times the population of the megacities, will likely shape urbanity over the next few decades.

    —————-

    Note 1: An urban area is an urban agglomeration or an urban footprint (area of continuous development). An urban area is the organism of the “city” in its spatial dimension. Census authorities in a number of nations have adopted similar definitions for urban areas (Examples are United States, Canada, United Kingdom, France, Norway, Sweden and Australia). Demographia World Urban Areas uses national census bureau data for both population and land area estimates where it is available and estimates urban land area from satellite imagery for all others.

    Note 2: for the purposes of this analysis, higher income urban areas are generally in nations with a gross domestic product of $20,000 per capita, purchasing power parity.

    Note 3: The urban area population estimates of Seoul-Incheon, Jakarta and Manila are considerably of love those reported by the United Nations. The United Nations data for these urban areas is based upon a far smaller definition of urbanization than is used in other urban areas. As additional explanatory notes are found in Demographia World Urban Areas.

    Photo: India Gate, Delhi (by author)

    Wendell Cox is a Visiting Professor, Conservatoire National des Arts et Metiers, Paris and the author of “War on the Dream: How Anti-Sprawl Policy Threatens the Quality of Life

  • Queens, New York: Mr Bornstein’s Neighborhood

    Beauty is in the eye of the beholder. And most people who drive through blocks of industrial urban neighborhoods in Queens County, New York find them ugly, depressing, and sometimes dangerous. I spend a great deal of time in these kinds of neighborhoods, and to the shock and surprise of many – especially my close friends and family – I find them just as interesting and usually more exotic than the overly-planned communities touting the new urbanism popping up all over the country.

    Queens is the second largest borough of New York City. With a population that is arguably the most diverse in the world – 165 languages and counting – it is more than a melting pot. It is what’s in store for counties the world over. Before the word “globalization” hit the Economics 101 textbooks, trading and sharing by people from all over the world was already underway in the 50+ neighborhoods of Queens.

    While I always knew this on an instinctive level, it was brought home to me over the past year. In January 2011, the Queens Economic Development Corporation took over a former union-operated job training facility/commercial kitchen and transformed it into an incubator for start up food and other small businesses. Located on 37th Street in Long Island City, just over the Queensborough Bridge from midtown Manhattan, it is literally ten minutes away from the glamor of midtown sophistication.

    But that ten minute drive demonstrates how fast urban landscapes can change.

    At one time, Long Island City was one of the great manufacturing hubs of the metropolitan region. Any late 1800’s through the mid 20th century photo of the east side of New York City showed belching smokestacks in the background, across the East River. Driving from Manhattan into Queens over the Queensborough Bridge, one would see a giant neon stapler jumping up and down atop the Swingline factory. Above the Eagle Electric plant another neon sign would remind us that ‘Perfection Is Not An Accident.” A few blocks away, Chiclets, Sunshine Biscuits and Silvercup Bakery employed thousands. Those large manufacturers are now history. Long Island City has been transformed; sleek residential and office towers are the new landmarks.

    The streets are now largely populated by office workers and residents who no doubt shop in the posh Manhattan emporiums, though there are more than just a few traces of the area’s industrial past. While large swaths of the community have been rezoned to allow new uses, there are still manufacturing and service areas protected by the zoning codes.

    These blocks are not on the New York City tourist trail. But they are the heart and guts of the city. Just like those internal organs, they are not pretty to look at, but are essential to the life of our city. Though the great manufacturing operations are gone, there are still thousands of small workshops and factories that, when aggregated, are viable economic engines.

    On these streets, the Queens Economic Development Corporation has opened a new center to accelerate small business development. The Entrepreneur’s Space: An Incubator for Food & Business is home to 5,000 square feet of kitchens and 2,000 square feet of small office space and classrooms. Over 100 clients represent the diverse population of New York City. They turn out French pastries, Finnish breads, Indian candies, Mexican salsas, and Caribbean specialties, in addition to vegan cupcakes, granola bars, and exotic artisan chocolates. All clients are provided with business consultations. Our goal is to nurture growing businesses, and, when they are ready, send them out into the world.

    The press has taken notice: a front page story in the New York Times>, plus Fox Business Channel, BBC, and others. In a period when most small business news is negative, stories about The Entrepreneur’s Space have been positive, with one exception: Inevitably, our location on this block of 37th Street is referred to as “a gritty industrial zone,” “a street with repair shops,” and, most hurtful to me, “unattractive.”

    This one square block is home to over 40 businesses, an eclectic mix that includes a family-owned plumbing company that has been around for 50 years, an immigrant-owned commercial laundry, a repair shop for food vending carts, a lighting-equipment business for the film industry, a day treatment program for the disabled, and a coffee shop, among many others.

    This block is a village.

    While it is not considered pretty (not many Bloomingdale’s-clad folks strolling the streets), it is certainly neighborly. Just as in small town America, residents help each other out. Last winter we split the cost of a snow blower with the electric company next door, least we both end up with violations for not clearing our sidewalks during the snowiest winter in memory. The disabled folks in the day treatment program down the block are probably more welcome here than they would be in many residential areas. And, at the coffee shop on the corner — 90 cents a cup and served in nanoseconds — the counterman knows how every one likes their coffee.

    Our block employs about 400 people ranging from the highly skilled and highly paid to those recently released from incarceration and rehab programs and earning the minimum wage. Combined, it probably has a payroll of a few million dollars, and generates enough in property and sales taxes to pave a lot of streets and pay the salaries of all the teachers in the nearby public school. Many of the 100 clients in the Entrepreneur’s Space were cooking and baking in home kitchens prior to signing up with us. Aside from the fact that it is illegal to cook at home and sell commercially, these clients understood that if they wanted their businesses to grow they had to find suitable accommodations. I think of the Entrepreneur’s Space as a “halfway house” between life in a tiny New York residential kitchen and a slick commercial kitchen with gleaming industrial equipment.

    But until then, the Entrepreneur’s Space clients are just like the rest of the occupants of the neighborhood, working hard to develop their businesses. They’ve created new occupations for themselves, and many have even begun to hire part time assistants.

    No business on 37th Street is a Fortune 500 company or listed on a stock exchange. The block is like so many in the industrial neighborhoods of New York’s boroughs: not very pretty to look at, but a solid community, diverse in every sense of the word. These neighborhoods are home to thousands of jobs throughout our city… and the jobs they create are truly beautiful.

    Seth Bornstein is the Executive Director of the Queens Economic Development Corporation, a non-profit organization that helps to create and retain jobs through neighborhood development, entrepreneurial assistance and business and tourism attraction programs. The Entrepreneur’s Space: An Incubator for Food & Business is their newest program. A native New Yorker, he lives in Forest Hills, Queens.

    Photo: Fanny Reboul and Victoria Khaydakova of Entrepreneur’s Space Zoj Granola.

  • Cities and the Census: Cities Neither Booming Nor Withering

    For many mayors across the country, including New York City’s Michael Bloomberg, the recently announced results of the 2010 census were a downer. In a host of cities, the population turned out to be substantially lower than the U.S. Census Bureau had estimated for 2010—in New York’s case, by some 250,000 people. Bloomberg immediately called the decade’s meager 2.1 percent growth, less than one-quarter the national average, an “undercount.” Senator Charles Schumer blamed extraterrestrials, accusing the Census Bureau of “living on another planet.” The truth, though, is that the census is very much of this world. It just isn’t the world that mayors, the media, and most urban planners want to see.

    Start with the fact that America continues to suburbanize. The country’s metropolitan areas have two major components: core cities (New York City, for example) and suburbs (such as Westchester County, Long Island, northern New Jersey, and even Pike County in Pennsylvania). During the 2000s, the census shows, just 8.6 percent of the population growth in metropolitan areas with more than a million people took place in the core cities; the rest took place in the suburbs. That 8.6 percent represents a decline from the 1990s, when the figure was 15.4 percent. The New York metropolitan area was no outlier: though it did better than the national average, with 29 percent of its growth taking place within New York City, that’s still a lot lower than the 46 percent that the center region saw in the 1990s.

    This may be shocking to some. For years, academics, the media, and big-city developers have been suggesting that suburbs were dying and that people were flocking back to the cities that they had fled in the 1970s. The Obama administration has taken this as gospel. “We’ve reached the limits of suburban development,” Housing and Urban Development secretary Shaun Donovan opined in 2010. “People are beginning to vote with their feet and come back to the central cities.” Yet of the 51 metropolitan areas that have more than 1 million residents, only three—Boston, Providence, and Oklahoma City—saw their core cities grow faster than their suburbs. (And both Boston and Providence grew slowly; their suburbs just grew more slowly. Oklahoma City, meanwhile, built suburban-style residences on the plentiful undeveloped land within city limits.)

    All this suburbanization means that the best unit for comparison may not be the core city but the metropolitan area, and the census shows clearly which metropolitan areas are growing and which are not. The top ten population gainers—growing by 20 percent, twice the national average or more—are the metropolitan areas surrounding Las Vegas, Raleigh, Austin, Charlotte, Riverside–San Bernardino, Orlando, Phoenix, Houston, San Antonio, and Atlanta. These areas are largely suburban in form. None developed the large, dense core cities that dominated America before the post–World War II suburban boom began. By contrast, many of the metropolitan areas that grew at rates half the national average or less—San Francisco, Los Angeles, Philadelphia, Boston, New York—have core areas that are the old, dense variety. Planners and pundits may like density, but people, for the most part, continue to prefer more space.

    If you do look at cities themselves, rather than at larger metropolitan areas, you’ll see that the census reveals three different categories. The most robust cities, with population growth over 15 percent for the decade—Raleigh, Austin, Charlotte, Las Vegas, Jacksonville, and Orlando—were located within the kind of metropolitan area that urbanists tend to dislike: highly suburbanized, dominated by single-family homes, and with few people using public transit. That’s partly because these cities developed along largely suburban lines by annexing undeveloped land and low-density areas. This has been the case in virtually all the fastest-growing cities. Raleigh has expanded its boundaries to become 12 times larger than it was in 1950; Charlotte and Orlando are nine times larger, and Jacksonville an astounding 25 times larger.

    At the opposite end of the spectrum are core cities, mostly in the Midwest and Northeast and often land-constrained, that have continued to shrink. These include longtime disaster zones like Detroit and Cleveland as well as newer ones like Birmingham in the South. They include Pittsburgh, a city much praised for its livability but one that is aging rapidly and whose city government, based disproportionately on revenue from universities and nonprofits, is among the nation’s most fiscally strapped. They even include Chicago, which lost some 200,000 people during the 2000s, its population falling to the lowest level since the 1910 census. The reasons aren’t hard to identify: despite all the hype about Chicago’s recovery and the legacy of Mayor Richard M. Daley, the Windy City is among the most fiscally weak urban areas in the country, its schools are in terrible shape, and its economy is struggling.

    Finally, there are cities that have grown, but not quickly. New York City’s population, for example, inched to a record high in the 2000s, but that growth was less than the national average. The population of Los Angeles grew a mere 97,000—the smallest increase since the 1890s. Many of the slow-growing cities (New York, San Francisco, and Boston, for example) suffer from high housing costs, which inhibit population growth. But they also host high-end industries—finance, technology, and business services—and enough well-paid workers in these industries to afford pricey housing and sustain a small rate of growth. The cities also attract already wealthy people from elsewhere.

    The census provides information on a smaller level, too, telling us not just which cities have grown, but where the growth has taken place within cities. Often, it has been in and around the historic downtowns. This is a trend in many cities that otherwise differ starkly (New York, St. Louis, Chicago, Los Angeles), and it reflects a subtle shift in the role of the downtown. Rather than reasserting themselves as dominant job centers, downtowns are becoming residential and cultural—a change that H. G. Wells predicted when he wrote that by 2000, the center of London would be “essentially a bazaar, a great gallery of shops and places of concourse and rendezvous.” What may have been an office, industrial, or retail zone morphs into a gentrified locale attractive to the migratory global rich, to affluent young people, and to childless households.

    This downtown recovery (which many cities subsidized heavily) was partly why so many urbanists and developers identified a broader back-to-the-city movement; but in reality, the phenomenon was usually limited to a relatively small population and a relatively small area. Since 1950, for example, St. Louis has lost a greater share of its population than any American city ever boasting 500,000 or more residents. The area from downtown to Central West End experienced strong growth during the 2000s, however, adding more people than Portland’s Pearl District, a favorite of urban planners. Yet this gain of 7,000 people was far from enough to offset the loss of 36,000 in the rest of St. Louis.

    It’s also worth noting that in economic terms, downtowns are losing their hold. For example, though the residential population of Chicago’s Loop tripled to 20,000 in the past decade, that famed business district lost almost 65,000 jobs; its share of the metropolitan area’s employment also fell. Los Angeles’s downtown, whose population has likewise grown, lost roughly 200,000 jobs from 1995 to 2005. Manhattan is losing employment share to the other four boroughs, as it has been for decades; but as a recent report from the Center for an Urban Future reveals, the process accelerated over the last ten years. From 2000 to 2009, Manhattan lost a net 41,833 jobs, while other boroughs saw net increases. This employment dispersion is even more evident in the suburbs. Of commuters who live in the inner-ring suburbs (such as Yonkers and East Orange), 60 percent work in their home counties and only 14 percent in Manhattan. Of commuters from such outer-ring suburbs as Haverstraw and Morristown, 73 percent work in their home counties and 6 percent in Manhattan.

    What, in the end, does the census tell us about America’s cities today? Certainly not that they’re dying, as they threatened to do in the 1950s, but equally certainly that they aren’t roaring back. Cities remain a successful niche product for a relatively small percentage of the population. Most people, though, even in the New York metropolitan area, continue to move toward the periphery rather than the core. That said, New York’s continuing growth over the past decade suggests that its recovery will likely prove durable. As for Senator Schumer’s “another planet” allegations, the census is simply confirming the fact that terrestrial Americans continue to disperse, both within and among metropolitan areas. So far, there’s little that planners, policy makers, and urban boosters can do about that.

    This piece originally appeared in City Journal.

    Joel Kotkin is executive editor of NewGeography.com and is a distinguished presidential fellow in urban futures at Chapman University, and an adjunct fellow of the Legatum Institute in London. He is author of The City: A Global History. His newest book is The Next Hundred Million: America in 2050, released in February, 2010.

    Wendell Cox is a Visiting Professor, Conservatoire National des Arts et Metiers, Paris and the author of “War on the Dream: How Anti-Sprawl Policy Threatens the Quality of Life

    Photo by caruba

  • Bicycle Commuting: A US System and A World-Wide Guide

    To my pleasure, there is now a United States Bicycle Route System that goes more places than Amtrak and Greyhound do. Have a look at the proposed map of the national corridor plan.

    The goal is to create clearly marked north-south and east-west routes, as romantic as the Oregon Trail or as functional as the Erie Canal. The trail of Lewis and Clark is on one of the routes.

    I can only hope that the plan serves as an inspiration to would-be cyclists and every-day bike commuters. To be fair, it takes years to master the dark and often wet arts of cycling. My riding-to-work garb includes reflective gear from London, Alaskan socks, a headlight from San Diego, a lock from Amsterdam, and a rain jacket from Ohio. On my first commute, after a year of wondering of “whether I could do it,” I searched so hard to find a safe route that I got lost.

    Serious bike commuting requires owning two or three bikes, as one or two will always have flats or breakdowns, and, you need a rain bike. Plus, strategic wardrobe planning can take hours. But bike commuters get to have the satisfaction of passing cars stuck in traffic, and tired legs at the end of day leave you feeling more virtuous than Mother Teresa (if you want more inspiration, there’s a cycling jersey with her picture).

    Just to be clear: No one behind the car wheel likes a cyclist, because bicyclists run red lights, hop up on curbs, pound on hoods, drop F-bombs, and give drivers the middle finger salute. Politically, cyclists fall on the spectrum somewhere between Greens and Anarchists. In some 300 cities — it’s a global movement— to protest local (car-inspired) injustices, they have formed into Critical Masses that parade around like errant storm troopers.

    I am surprised that no one has articulated a bicycle foreign policy — in German it would be Fahrradweltanschauung — given that there are more bikes in the world than cars and they are used more often. Fifty million bikes are manufactured annually worldwide, versus twenty million cars. China’s market share is 400 million. But many American states and counties fight having a bicycle coordinator on their payroll.

    Here’s a highly personal comparison of where some cities and regions currently stand in relation to a world of bicycles:

    Geneva: My hometown, so I know the roads well. The city is trying to expand its bike lanes and trams. Whenever road construction is completed, a new bike lane emerges from the rubble. Biking works in Geneva, despite the hills, wind and rain, but many bike lanes are stopped by dead ends or traffic. I am forever lifting my bike over curbs, cobblestones, or rails, and searching for a better way around the medieval town.

    New York: I can thank former New York mayor Ed Koch for converting me into a bicycle romantic. In spring 1980, he decided to accept a strike from New York’s Transport Workers Union that, for eleven days, mothballed the city’s buses and subway. (Koch referred to the strikers as “wackos.”) The only way to get around New York was to walk or ride a bike. I dusted off my childhood Raleigh Grand Prix and rode off to work, never looking back on a life that did not involve bicycles.

    Although I no longer live in New York, I still like riding there. The West Side, Central Park, and the Brooklyn Bridge are bike friendly. If you want to understand why George Washington lost the battle of Harlem Heights (as I do), a bike is the only way to get there. But, as much as biking has improved in and around New York in the last thirty years, it remains a “car” city. Cyclists are an afterthought, and poorly represented by messengers flying down Seventh Avenue, no hands on their bars, talking on their cell phones, flipping off confused pedestrians.

    The administration of Mayor Michael Bloomberg has proposed a master plan of 900 miles of bike lanes around New York, up from 400 miles, bringing out pools of angry car drivers who hate sharing the road with cyclists and haunted pedestrians. A New York Magazine cover story called it “Bikelash.” But 100,000 riders mount a bike every day in Manhattan.

    Hanoi: In 1993, before the Politburo began importing waves of noisy scooters and small motorcycles, to bike around the old French quarter and West Lake (past General Giap’s house and Ho’s mausoleum) was a delight. Everyone rolled at slow speeds, and no one stopped at the intersections; the bike traffic just melded together, like DNA. In the Vietnam War, bikes beat B-52s.

    Berlin: It’s expansive, like Los Angeles, but flat as a dish and with many bike lanes, all of which go to places of historical interest: the Reichstag, the Holocaust Memorial, the remnants of the Berlin Wall, or Checkpoint Charlie. Each time I am there, I rent a bike, and it takes me everywhere. The only downside to Berlin biking is the weather, which has a lot of cold rain. Bikes make Berlin.

    Amsterdam: I find the biking to be hair-raising. The Dutch power through intersections or along bike paths as though they were in a bonus sprint on the cobblestones of Paris-Roubaix (the famous bike race). Yes, the lanes go everywhere, and bikes in Holland — at least those not stolen and thrown into the canals — are sacred objects. But think about wearing some body armor.

    Beijing: My favorite bicycle city. To be in the saddle enables you to go almost anywhere. Bike lanes are wider than many Western boulevards, and you can bike around Tiananman Square, to the Forbidden City, down to South Station, and out toward the Marco Polo Bridge (where World War II began in China). The way to see the hutong — ancient alleys — is on a bike. Beijing treats its citizens with more respect when they are cycling than it shows them at other times.

    London: Cyclists wear reflective vests, stretch rubber bands on their pants legs, and blow strange whistles at anything in their way. Coming out of the mist, they look prehistoric and think nothing of biking in rain, sleet or snow, doing battle with buses, cars, and pedestrians, or riding bikes that look like they survived the Blitz. The London mayor has introduced a fleet of shared bikes that can be used around town, based on annual membership. Because traffic is on the “wrong side,” I find biking in London scary, but it delivers the goods.

    Suburbia, USA: I have spent more time that I would have wished biking around suburbs, exurbs, malls, highways, and developments. It’s the least satisfying bicycle experience. I grew up in the suburbs, with baseball cards in my spokes. Suburban drivers hate cyclists. Integrating bicycles into suburban life, with its SUV panzer divisions, will be a national challenge.

    Toronto: Canada’s guerrilla team, the Urban Repair Squad, goes out at night to paint bike lanes onto city streets. (“They say the city is broke. We fix it. No charge.”) So effective is their painting that the city of Toronto maintained the counterfeit lanes for two years, thinking they were official.

    Southampton, New York: Southampton prohibits riding a bike through town. It’s fine to thunder through the Potemkin village of million dollar boutiques in a gas-guzzling, tinted-windowed pimp mobile, but God forbid that anyone should roll through on their own power. It gets my vote as the worse bicycle town in America.

    ***

    Like all bikevangelists, I dream of highways given over to cyclists, and see cycling as the way wean the U.S. from Middle Eastern oil and solve every problem from global warming to obese children. Consider this: Compared to the costs of high-speed rail and highway construction, the U.S. Bicycle Route System requires only maps, sign posts, imagination… and strong legs.

    Photo by the author: “My bike in Beijing. One gear. Heavy as bricks, but very smooth”.

    Matthew Stevenson is the author of Remembering the Twentieth Century Limited, a collection of historical essays. He is also editor of Rules of the Game: The Best Sports Writing from Harper’s Magazine. He lives and rides in Switzerland.

  • The Accelerating Suburbanization of New York

    Some of the best evidence that the tide has not turned against dispersion and suburbanization comes from an unlikely source:  New York’s 2010 census results. If dense urbanism works anywhere in America, it does within this greatest of US traditional urban areas.

    Before the actual count, the Census Bureau estimated, in large part as a result of a successful historical core municipality (city of New York) challenges, that as of Census Day (April 1, 2010), the city would have added 413,000 residents since 2000 and would have accounted for more than one-half of the metropolitan area growth. But the numbers turned out startlingly different. In fact, the city’s census count came in nearly 250,000 below projections and accounted for the lowest share of New York metropolitan area growth since the 1970s.

    Overall the 2010 census figures paint a picture of continuing dispersion in the nation’s largest metropolitan area, New York. The metropolitan area stretches from Manhattan, with the world’s second largest business district (after Tokyo) to the four outer boroughs of the city of New York, more than 100 miles to the eastern end of Long Island, north to Putnam and Rockland counties, completely across northern New Jersey, jumping the Delaware River to include Pike County, Pennsylvania and south to Ocean County (New Jersey), nearly all the way to Atlantic City. In all, this 23 county metropolitan area has the nation’s largest population and actually extended its margin over second place Los Angeles, which has been converted from a growth leader to a laggard giant growing slower than most Midwestern metropolitan areas. New York added 574,000 residents, while Los Angeles added 473,000. If New York continues to add more people than Los Angeles in future censuses, its position as the nation’s largest metropolitan area be secure.

    Major metropolitan areas in general did poorly in terms of growth in the new cesusus. This was particularly true in New York. Between 2000 and 2010, the New York metropolitan area population rose from 18,323,000 to 18,897,000, a modest growth rate of 3.1 percent, one of the slowest among major metropolitan areas in the country. The national growth rate was three times as high

    Suburbanization Accelerating Again: If you had read the New York Times and other Manhattan-based media over the last decade you would have assumed the suburbs were in decline and cities ascendant, particularly in the New York area. Yet in reality over the past decade, the suburban counties captured their largest share of New York metropolitan area growth in three decades. During the 2000s, the suburbs accounted for 71 percent of growth, up from 54 percent during the 1990s and 48 percent in the 1980s. The outer suburbs grew the fastest, while the inner suburbs – some of which are denser than historical core municipalities in other metropolitan areas – grew faster than the historical core municipality, the city of New York (Figure 1 and Table)


    NEW YORK METROPOLITAN AREA
    POPULATION TREND BY COUNTY: 2000 TO 2010
    2000 2010 Change %
    HISTORIC CORE MUNICIPALITY (New York)
    Bronx County, NY       1,332,650       1,385,108        52,458 3.9%
    Kings County, NY       2,465,326       2,504,700        39,374 1.6%
    New York County, NY       1,537,195       1,585,873        48,678 3.2%
    Queens County, NY       2,229,379       2,230,722          1,343 0.1%
    Richmond County, NY         443,728         468,730        25,002 5.6%
    Subtotal       8,008,278       8,175,133       166,855 2.1%
    INNER SUBURBAN
    Bergen County, NJ         884,118         905,116        20,998 2.4%
    Essex County, NJ         793,633         783,969         (9,664) -1.2%
    Hudson County, NJ         608,975         634,266        25,291 4.2%
    Middlesex County, NJ         750,162         809,858        59,696 8.0%
    Nassau County, NY       1,334,544       1,339,532          4,988 0.4%
    Passaic County, NJ         489,049         501,226        12,177 2.5%
    Union County, NJ         522,541         536,499        13,958 2.7%
    Westchester County, NY         923,459         949,113        25,654 2.8%
    Subtotal       6,306,481       6,459,579       153,098 2.4%
    OUTER SUBURBAN
    Hunterdon County, NJ         121,989         128,349          6,360 5.2%
    Monmouth County, NJ         615,301         630,380        15,079 2.5%
    Morris County, NJ         470,212         492,276        22,064 4.7%
    Ocean County, NJ         510,916         576,567        65,651 12.8%
    Pike County, PA           46,302           57,369        11,067 23.9%
    Putnam County, NY           95,745           99,710          3,965 4.1%
    Rockland County, NY         286,753         311,687        24,934 8.7%
    Somerset County, NJ         297,490         323,444        25,954 8.7%
    Suffolk County, NY       1,419,369       1,493,350        73,981 5.2%
    Sussex County, NJ         144,166         149,265          5,099 3.5%
    Subtotal       4,008,243       4,262,397       254,154 6.3%
    SUBTOTAL: SUBURBAN     10,314,724     10,721,976       407,252 3.9%
    TOTAL     18,323,002     18,897,109       574,107 3.1%


    Critically, the city of New York did worse than at any time since the 800,000 population loss that was sustained in the 1970s, representing all of the loss since 1950. Between 1950 and 1980 the suburbs added 3.9 million residents. The city’s fortunes had improved measurably in the 1980s and 1990s, with approximately one-half of the metropolitan area’s growth. The last decade’s share of metropolitan area growth – only 29 percent – in the historical core municipality indicates a startling acceleration of dispersion, although fortunately not a return to the population decline of the 1970s (Figure 2).

    City of New York: The city of New York grew from 8,008,000 to 8,175,000 between 2000 and 2010, a rate of 2.1 percent.

    Staten Island (Richmond County), which is largely suburban in form, was the fastest growing of New York’s boroughs, with a growth rate of 5.6 percent. The Bronx grew the second fastest, at a rate of 3.9 percent. Only Staten Island and Queens (below) reached their population peaks in the 2010 census (Figure 3).

    The Bronx has experienced perhaps the nation’s most successful urban turn-arounds, after a disastrous period in the 1970s and 1980s, when large swaths of the South Bronx were literally leveled. The population fell from 1,472,000 in 1970 to 1,204,000 in 1990. By 2010, the population had recovered nearly two-thirds of the loss, to 1,385,000.

    Manhattan (New York County) added 3.2 percent to its population (49,000) and reached 1,586,000. This is approximately one-third below its population peak of 2,232,000 in 1910.   Manhattan’s population, however, remained approximately 45,000 below the Census Bureau estimates.

    Brooklyn (Kings County) continues to be the largest borough in New York, with 2,505,000 residents, an increase of 39,000 (1.6 percent) between 2000 and 2010. Brooklyn reached its population peak of 2,738,000 in 1950. Brooklyn’s population proved approximately 75,000 below the Census Bureau’s estimates.

    The slowest growing borough was Queens, which added only 2,000 residents (a 0.1 percent population increase), yet reached its population peak of 2,231,000. Queens had added more residents than any other borough since 1950 and added approximately 275,000 residents in the 1990 to 2000 census period.

    Inner Ring Suburbs: The inner ring counties (Nassau, Westchester, Bergen, Passaic, Essex, Hudson, Union and Middlesex) grew 2.4 percent from 6,306,000 to 6,460,000. Growth rates varied significantly, from a loss of 1.2 percent in Essex County (where Newark is located) to 8.0 percent in Middlesex County. Middlesex County includes newer suburban areas further away from the core than in any other inner ring county. Much of the Middlesex County growth occurred in these areas. The inner ring suburbs captured 26.7 percent of the metropolitan area growth.

    Outer Ring Suburbs: By far the e fastest growth was in the outer ring counties, with a population increase of 6.3 percent, from 4,008,000 to 4,262,000. Monmouth County was the slowest growing outer ring county, adding 2.5 percent to its population. Pike County, Pennsylvania, which is the farthest to the west of any county in the metropolitan area, had by far the highest growth rate, at 23.8 percent. Ocean County, New Jersey, had the second fastest growth rate, at 12.8 percent. Ocean County lies at the extreme southern end of the metropolitan area. The outer ring counties captured 44.3 percent of the metropolitan area growth.

    Suburban Growth and Projections: Overall suburban growth was from 10,314,000 to 10,712,000, for a gain of 407,000 (4.0 percent). This was above the Census Bureau estimate of 392,000. The suburbs now contain 57 percent of the metropolitan area population.

    New York’s Continuing Dispersion: The dispersion of the 2000s is an extension of the overall metropolitan area trend since 1950 (Note). The historical core municipality, New York, has added less than 300,000 residents, or 3.6 percent. The suburbs have added 5.3 million residents, nearly doubling their population. Approximately 95 percent of the metropolitan area’s growth was in the suburbs between 1950 and 2010 (Figure 4).

    The dispersion is apparent even in the city of New York. Since 1950, Queens, the outermost of the inner four boroughs, added nearly 700,000 residents, while the more inner boroughs of Manhattan, Brooklyn and the Bronx, lost nearly as many residents. Overall these four inner boroughs gained only 6,000 residents since 1950. Staten Island, which is largely post-war suburban, grew 277,000, while the city overall was growing by 283,000, leaving only a net gain of 6,000 for the four inner boroughs of New York.

    A recent newgeography.com article documents similar patterns in employment dispersion and commuting during the 1990 to 2008 period.

    Consistency with the National Trend: The accelerating suburbanization of New York is consistent with the national trends in major metropolitan areas in the new census data. Between 1990 and 2000, historical core municipalities accounted for 15 percent of metropolitan area growth. Between 2000 and 2010, the share of historical core municipality growth had fallen to 9 percent.

    Note: This analysis is based upon the metropolitan area boundaries as currently defined.

    Wendell Cox is a Visiting Professor, Conservatoire National des Arts et Metiers, Paris and the author of “War on the Dream: How Anti-Sprawl Policy Threatens the Quality of Life

    Photo by Mike Lee