Tag: New York

  • NY Borough to Borough Commute? Fuhgeddaboudit

    As the country’s largest and densest metropolis, New York City has been able to offer a level of public transit service that most other cities can only dream about. Commuting to Downtown or Midtown Manhattan has been—and still is to a large degree—a remarkably easy affair for hundreds of thousands of residents, whose travel options include commuter train, subway, ferry and bus. However, like a lot of older American cities, New York has changed dramatically since most of those services were put into place, and more and more residents, particularly among lower-income workers, no longer travel to Manhattan for work.

    Census data show that between 1990 and 2008 the number of residents who traveled to work in their own borough or a neighboring borough or county increased much faster than the number who made the more traditional commute to Manhattan. For instance, the number of Bronx residents who traveled to Queens or Westchester County for work increased by 38 percent, and the number who traveled inside the borough jumped by 25 percent, while the number commuting to Manhattan increased by only 13 percent in the same period.

    The discrepancies on Staten Island are even starker: During the same period, the number of Staten Island residents traveling to work inside their own borough increased by 32 percent, and those going to Brooklyn or New Jersey increased by 22 percent, while the number heading into Manhattan barely changed at all—a four percent increase in those 18 years. Although not as dramatic, Brooklyn and Queens both saw significant gains in non-traditional commutes as well. In fact, the number of Brooklyn residents traveling to Queens grew by 32 percent, compared to a 13 percent increase in the number going to Manhattan. In 2008 despite being a notoriously difficult trip for public transit riders, nearly 160,000 people crossed the Brooklyn/Queens border for work everyday.

    One big reason for this shift in commuter patterns is New York’s changing economic landscape. For decades Manhattan has been steadily losing its share of jobs to the other four boroughs, but over the last ten years that process has sped up considerably. From 2000 to 2009, New York City lost a net 41,833 jobs, but that was because of the huge concentration of losses in Manhattan during 2008 (over 100,000 in that single year). Every other borough saw a net increase in jobs during that period. Queens saw 2.4 percent growth, Staten Island 4.6 percent growth and the Bronx and Brooklyn 7.7 and 7.9 percent growth, respectively.

    It won’t come as surprise to those who have been paying close attention to the economy that robust job gains in the health care and education sectors are what lie behind sustained growth in the outer boroughs. Between 2000 and 2009, New York City gained nearly 120,000 jobs in those two sectors alone. And although Midtown Manhattan has several prominent hospitals and universities, collectively, the hundreds of hospitals, nursing homes, community health clinics, colleges and professional schools in the other four boroughs—from Montefiore Hospital in the Bronx and SUNY Downstate Medical Center in Brooklyn to Queensborough Community College in Bayside—accounted for the lion’s share of jobs in those sectors.

    New York City’s transit system wasn’t designed for commuter trips to jobs within and between boroughs outside of Manhattan, and as a result the city’s median commute times have been rising steadily for decades. According to American Community Survey data released last December, New York’s four outer boroughs all have median commute times that are north of 40 minutes, which puts them among the longest in the country. And among public transit riders they are significantly longer, ranging from 52 minutes each way in Brooklyn to a barely comprehensible 69 minutes each way in Staten Island.

    In our study, we interviewed a number of outer borough employers who felt that a lack of dependable rapid transit service has exacted a toll on their businesses. A lack of transit effectively shrinks their labor pool, they said, and causes more turnover as disgruntled employees decide to leave rather than suffer through two hour commutes every day. The chief operating officer at SUNY Downstate Medical Center in East Flatbush Brooklyn even said that it could cause the hospital to rethink its plans for expansion. “I’ve been here 24 years,” he said, “and I still haven’t seen any improvements in mass transit.”

    New York’s biggest investments in transit are still almost entirely focused on Manhattan commuters. Tens of billions of dollars are being invested in what amounts to an extension of the Q train along Second Avenue, a new Long Island Railroad tunnel to Grand Central, a one stop extension of the number 7 train on the west side, and a Santiago Calatrava-designed Fulton Street Station in lower Manhattan. A new Moynihan Station on 34th Street is apparently next on the agenda. These projects may spawn billions more in lucrative real estate deals, but they don’t reflect the city’s true economic geography.

    A lack of transit investments in the outer boroughs might be understandable if these new outer borough jobs were spread out evenly over a large territory, but a huge percentage are located in relatively dense clusters. Over 20,000 commuters descend on the SUNY Downstate and Kings County Medical Campuses — right across the street from each other —every morning, for example. But very little has been done to facilitate commutes to that area, and many employees and patients depend on a dizzying array of livery cabs and dollar vans to get them where they’re going. Similarly, JFK airport in Queens is home to over 55,000 jobs; Hunts Point in the Bronx 20,000; the Sunset Park waterfront in Brooklyn 32,000, and so on.

    Making much needed investments in service and upgrades to the bus system may not be as sexy as a new train terminal in Midtown. But if New York is going to sustain job growth and retain a truly world-class transit system, then it will have to start looking beyond Manhattan and invest in solutions that make commutes to job centers in the outer boroughs easier for residents.

    David Giles is a research associate at the Center for an Urban Future, a Manhattan-based think tank. He is the author of Behind the Curb, a Center for an Urban Future report about the gaps in transit service in the four boroughs of New York City outside of Manhattan, from which this article was adapted. For the whole report, please visit BehindtheCurb or www.nycfuture.org.

    Photo: The Brooklyn Bridge by S J Pinkey

  • New York City Population Growth Comes Up Short

    Just released census counts for 2010 show the New York metropolitan area historical core municipality, the city of New York, to have gained in population from 8,009,000 in 2000 to 8,175,000 in 2010, an increase of 2.1 percent. This is the highest census count ever achieved by the city of New York.

    Nonetheless, the figure was 245,000 below the expected level of 8,420,000 (based upon 2010 Census Bureau estimates). The higher population estimate had been the result of challenges by the city to Census Bureau intercensal estimates. The city of New York attracted 29 percent of the metropolitan area growth. Approximately 43 percent of the metropolitan area’s population lives in the city.

    Overall, the New York metropolitan area grew from 18,323,000 to 18,890,000, an increase of 3.1 percent. The suburbs grew approximately twice as rapidly as the city of New York, at 4.0 percent, and attracted 71 percent of the metropolitan area growth.

  • Asthma: The Geography of Wheezing

    Are you familiar with the Hygiene Hypothesis? The HH — or, as some of us call it, the “pound of dirt theory” — is grabbing attention again. A minor medical press feeding frenzy followed the publication in the New England Journal of Medicine of a study based on data from Europe. The summary?

    “Children living on farms were exposed to a wider range of microbes than were children in the reference group, and this exposure explains a substantial fraction of the inverse relation between asthma and growing up on a farm.”

    This is the Hygiene Hypothesis incarnate. The HH posits that part of our immune system produces an antigen called IgE, which evolved to fight parasites in unhygienic conditions that have prevailed for most of human history, and since we are now cleaner, these antigens attack otherwise harmless proteins in some of us, making us sick, in the form of allergies. Instead of attacking, say, hookworms, the antigen goes after that just-chomped peanut butter sandwich.

    Proponents of the HH compare the prevalence of allergies in East and West Germany before and after unification. East Germany had more children growing up on farms and in larger families than West Germany, and much lower rates of allergies and asthma. Now, with its more westernized culture, East German rates of allergies and asthma have nearly caught up with West Germany.

    It makes a great story. The whole farm-city thing resonates deep in the American mind. It evokes the mythic hold that farm life has over our national psyche. Farms good; cities bad. Wholesome Jeffersonian America is good for our children not only morally, but physically. The implication is that if we all grew up on farms, asthma wouldn’t be at the epidemic levels we now have. The trouble is that in medical science there are too many variables to draw sweeping conclusions from one set of data, and anyone who would do so is not a serious scientist, or is driven by an agenda (or both).

    A case in point is a Forbes blogger who took a pot shot at mold-inspired litigation against landlords, interpreting the study to mean that mold is good for us. The Forbes blogger mentioned the case of Bianca Jagger, who sued her landlord about mold growing in her Park Avenue apartment. Erin Brockovich, Michael Jordan, and Ed McMahon are other celebrities who have coped with mold contamination, along with countless sufferers whose names are not familiar to us.

    Some mold is, undoubtedly, good. Without it, we wouldn’t have penicillin or blue cheese. But some mold can kill, particularly stachybotrys chartarum – a toxic black mold – which is often found in buildings with water damage. Other molds, while not immediately life threatening, are still potent allergens, including the ones you find in the woods behind the back 40, in Central Park, and in virtually any basement anywhere. In fairness, it’s not as easy for landlords to decide which molds to allow in their properties as it is, say, to choose between Stilton or Roquefort. As for that wet laundry you left in the washing machine for two days, it may not make you sneeze, let alone kill you, but it does stink.

    As objectionable as I find enlisting a specious inference in service of an ideological argument against the American tort bar, there are medical considerations to look at before we let the kids run barefoot through the barnyard as immunotherapy against asthma.

    First, these were European farms under study. The European farm population may or may not be a fairly homogeneous group compared to city dwellers, and genetics make a large difference in who develops asthma. It stands to reason that generations of working the family farm may have bred a hearty cohort of kids who can breathe the local air without wheezing.

    Second, there may be something about European farming practices that makes their farm/city dynamic different from ours. European farms are regulated very differently from our own, in part because of the health fears of the European commissioners. For example, genetically modified food is much more tightly restricted in Europe, if it is legal at all. This means that Europeans use different fertilizers and pesticides than the ones we use here, which undoubtedly affects the rural health picture.

    And European farm asthma may just be lagging behind ours. Typical farms are rampant with chemicals. Add to that the effects of weather on the pollen count and the aromatic plumes from manure lagoons, and no wonder rural America is suffering from an asthma epidemic that rivals the one we’re seeing in urban America.

    CDC researcher Dr. Teresa Morrison, medical epidemiologist in the Air Pollution and Respiratory Health Branch, was lead author of an article in the Journal of Asthma which concluded that “Asthma prevalence is as high in rural as in urban areas.” The goal of their research is “… to document patterns of asthma symptoms among rural residents in Midwestern states, and learn more about possible environmental exposures that potentially lead to asthma attacks.”

    David Van Sickle, who has worked with Morrison, holds a doctorate from the University of Wisconsin, and is founder of a Madison-based company called Reciprocal Sciences. In a guest editorial for www.asthmaallergieschildren.com in November, he wrote that studies of farm workers in California showed that exposures to agricultural dusts were associated with the development of persistent wheeze, exposure to pesticides was associated with the development of asthma in women, and that community exposures to airborne waste from large scale animal agriculture might also be associated with exacerbations of asthma. As he also pointed out, this may have remained hidden because it’s hard to study, but that is changing, in no small part because Van Sickle has developed an iPhone app called Asthmopolis, which can transmit information to doctors every time the patient—say a farmer—toots on his inhaler.

    No one who has studied immunology, as I have, can ignore the contribution farms have made to the treatment of the human immune system. As every biology student should know, vaccination began because Edward Jenner noticed that milk maids exposed to cow pox gained immunity from small pox. I have my doubts that a similar benefit can be derived with asthma.

    The country — where the air is full of all kinds of pollen and chemicals — is probably not the ideal choice for a Fresh Air Fund-style migration of wheezing children. But who knows? Maybe some of those farm microbes do have a salutary effect on kids’ immune systems. I wouldn’t recommend sending the kids to the city, either (check out some of the reasons a Bronx neighborhood has the nation’s highest asthma rates). If I sound equivocal, it’s because I am. Maybe sneezing, wheezing, and itching are the price we — that’s an urban and rural “us” — pay for “progress.”

    Dr. Paul Ehrlich is co-author with Dr. Larry Chiaramonte and Henry Ehrlich of Asthma Allergies Children: A Parent’s Guide (Third Avenue Books), available only from Amazon.com and from Barnes & Noble. He is co-founder of asthmaallergieschildren. He is a fellow of the American Academy of Pediatrics, the American Academy of Allergy, Asthma & Immunology, and the American College of Allergy, Asthma & Immunology, as well as a clinical assistant professor of pediatrics at New York University School of Medicine, and an attending physician at Beth Israel Medical Center and at the New York Eye & Ear Infirmary. He has been featured as one of the top pediatric allergy and immunology specialists in New York Magazine for the last 10 years and counting.

    Photo by Nathan T. Baker: “I might have to get a cooler style for this asthma inhaler.”

  • Perspectives on Urban Cores and Suburbs

    Our virtually instant analysis of 2000 census trends in metropolitan areas has the generated wide interest. The principal purpose is to chronicle the change in metropolitan area population and the extent to which that change occurred in the urban core as opposed to suburban areas.

    From a policy perspective, this is especially timely because of the recurring report that suburbanites have been moving to the urban core over the last decade. We have dealt with this issue extensively, noting the lack of data for any such interpretation. As of this writing, with data for more than half of the major metropolitan areas (over 1,000,000 population) in, there remains virtually no evidence that people are "moving back to the city" (actually, most suburban growth came from outside metropolitan areas, not from the "cities").

    The Policy Context: Urban Cores and Suburbs

    This discussion is not new, and generally pits anti-automobile interests – including much of the urban planning community – who favor the urban development patterns of prewar America (generally the urban planning community) against those who would prefer allowing people to make their own choices about where they live or work..

    Over the past 60 or more years, the data indicates that consumers have nearly exclusively chosen less dense and more suburban areas. This is not to suggest, however that many of us, including this author, automatically favor suburbs over urban cores. Indeed, I have enjoyed years of alternating between living in suburban America and the urban core of the (inner) ville de Paris (arrondissements I, II, V, VII and XI). But if you have a taste for urban living, that does not mean high-density cities are inherently superior to suburban living. People, after all, have different preferences.

    Urban areas include both urban cores and suburbs. The delineation of urban cores and suburbs is subjective. There was for example a time – say around 1820 – when development to the north of New York’s Houston Street would have been considered suburban. More than two thirds of the present ville de Paris was suburban before the city limits were expanded in the 1860s. Now, no one would consider, for example, Washington Square or Herald Square to be suburban and the suburbs of Paris now extended to more than 80 times the land area of the 1860s ville de Paris.

    One overlooked way to approach the current debate would be to look not at municipal boundaries but forms of development. Around 1950 we began the breakneck expansion of automobile oriented suburbanization which had proceeded more modestly for two or more decades before.

    The Urban Core:

    This analysis defines the urban core consistent with the criteria of the US Bureau of the Census in 1950. Metropolitan areas are organized around urban areas (urbanized areas). We use the "central cities" of the core urban areas in 1950 as the urban core in the analysis. Those portions outside the 1950 urban core are thus considered suburban. Where an urban area did not exist in 1950 (such as in Las Vegas and Tucson), the urban core is the central city of the urban area when it was first established.

    No existing specification of the urban core is ideal, though the present one is appropriate for the policy purpose stated above. Clearly, the urban core would be far better defined at the census tract or even census block level based upon the characteristics of an urban core. This would include factors such as high residential population density, high transit usage, walkability and a high percentage of multiple unit residential buildings.

    Such an ideal definition of the urban core cannot be measured with municipal boundaries. Yet, municipal boundaries have routinely been used by researchers to delineate the urban core, not least because the data is readily available. However there three notable difficulties with the use of municipal boundaries to define the urban core.

    First; some areas with urban core characteristics are outside the core municipalities. As The Infrastructurist notes, municipalities like Jersey City or Hoboken have the characteristics of urban cores. However, since they are not a part of the core municipality (city of New York), they are classified as suburbs in our analysis. It is well to remember that both Hoboken and Jersey City represented suburban development, during their period of greatest growth, before 1930.

    Second, other areas with postwar suburban characteristics are inside the core municipalities. For example, Richmond County (Staten Island), a part of the city of New York is principally suburban. Much of it was developed well after 1950 and consists largely of single family homes. The median construction date of owner occupied housing in Staten Island is 1970, which compares to 1965 in adjacent Middlesex County, New Jersey. It is newer than in Morris County New Jersey (1965), much of which is outside the urban area (all median house construction years from the 2000 census). Major portions of core municipalities such as Los Angeles, Houston, Dallas, Portland, Seattle, Denver and others are also postwar suburban.

    Third, in a number of core municipalities, there is little, if any urban core, at least from a residential perspective. For example, one would be hard-pressed to identify an urban core in municipalities such as Phoenix or San Jose (despite the fact that the San Jose urban area is more dense than New York urban area). In metropolitan areas such as these, it might be preferable to define virtually all growth as suburban, though our analysis still defines these municipalities as the urban core.

    Based upon the early results from the census it seems that if the more ideal census tract-based urban core definition were used, the urban cores would be shown to be capturing an even smaller share of growth, while suburban areas would be capturing more. But this analysis will have to wait until all the numbers are in.

    Historical Core Municipality

    The term "historical core municipality" is used to denote the urban cores using municipal boundaries.  The term "city" is avoided because of its multiple definitions. Cities can be municipalities (such as in the city of New York), urban areas (such as the New York urban area), metropolitan areas (such as the New York metropolitan area) or multi-county regions or prefectures of countries like China (such as Wuhan or Shenyang).

    This lack of clarity can be routinely seen in media reports that indiscriminately (and without comprehension) make comparisons between cities, using differing definitions. This can even extend even to more technical literature (see pages 12-14 of Urban Transportation Policy Requires Factual Foundations).

    Principal Cities: Starting in 2003, the Census Bureau substituted the term "principal city" for the previous "central city" term. The use of principal city designations and the largest municipality as the principal name of a metropolitan area are appropriate for the purposes intended by the Census Bureau.

    In its State of Metropolitan America, the Brookings Institution uses up to the three largest principal cities (which it calls "primary cities") and consider other parts of metropolitan areas as suburbs.

    Neither approach, however, is appropriate in analyzing postwar suburbanization. Any municipality in a metropolitan area with more than 250,000 population is considered a principal city, regardless of its urban form. Any municipality with more than 50,000 population but which also has more jobs than resident workers is also a principal city, regardless of its actual on the ground reality.

    This leads to a situation in which, for example, Los Angeles has 26 principal cities. Any postwar urban form definition would classify nearly all as suburban (and much of the historical core municipality of Los Angeles, notably the San Fernando Valley, itself is suburban). For example, the suburban city of Cerritos is a principal city, yet was largely filled by dairy farms well into the 1950s and was called Dairy Valley.

    Other principal cities hardly existed in 1950. Virginia Beach has become the largest municipality in its metropolitan area, having displaced Norfolk. Yet, in 1950 Virginia Beach had a population of only 5,400, well below the 50,000 threshold that was required of central cities (smaller than Ponchatoula, Louisiana, doubtless an unfamiliar municipality to most readers). Arlington, Texas, the third municipality in the Dallas-Fort Worth-Arlington metropolitan area, had a population of 7,700 in 1950, again well below the central city threshold. Arlington is not an urban core, it is a suburban jurisdiction.

    Virginia Beach is a good example of a suburban area that has become the largest municipality in a metropolitan area. Its greater size, however, does not make Virginia Beach the urban core. Otherwise, Contra Costa County in California could, by consolidating with its constituent municipalities (God forbid), replace San Francisco as the metropolitan area’s urban core.

    Perhaps the ultimate example of the problem of principal cities being confused with urban cores is Hemet, California, a principal city of the Riverside-San Bernardino metropolitan area that is, in fact an exurb and not in the primary urban area.

    Toward the Future

    An eventual more precise analysis of urban cores and suburban trends will be welcome. Yet, as our analysis of trends in New Jersey indicated, even the growth in more urban core oriented municipalities was minuscule compared to the state’s suburban growth. Further, much of the urban core growth in the nation came from areas that, although formally located within “city limits” actually were on the suburban fringe. This was true, for example, in Kansas City, Oklahoma City and even Portland.  This suggests that the small share of growth reported in urban cores would be even less if it were based on census tract data; and suburbanization, as a way of life, may indeed be even more prevalent than this year’s numbers suggest. 

    Wendell Cox is a Visiting Professor, Conservatoire National des Arts et Metiers, Paris and the author of “War on the Dream: How Anti-Sprawl Policy Threatens the Quality of Life

    Photo by urbanfeel

  • New Jersey: Still Suburbanizing

    The state of New Jersey virtually defines suburbanization in the United States.  New Jersey is not home to the core of any major metropolitan area but, major portions of the nation’s largest metropolitan area (New York) and the fifth largest metropolitan area (Philadelphia) are in the state (See map). These two metropolitan areas comprise 17 of the state’s 21 counties. Another county (Warren) is in the Allentown, Pennsylvania metropolitan area, while Atlantic (Atlantic City), Cumberland and Cape May are single-county metropolitan areas. No one, however, should make the mistake of imagining that New Jersey is wall to wall suburbanization. In the 2000 census, more than 60 percent of the state’s land area was rural, with urban areas (areas of continuous urban development) making up less than 40 percent of the state’s land area, while 94 percent of the 2000 population was urban (which includes suburban).

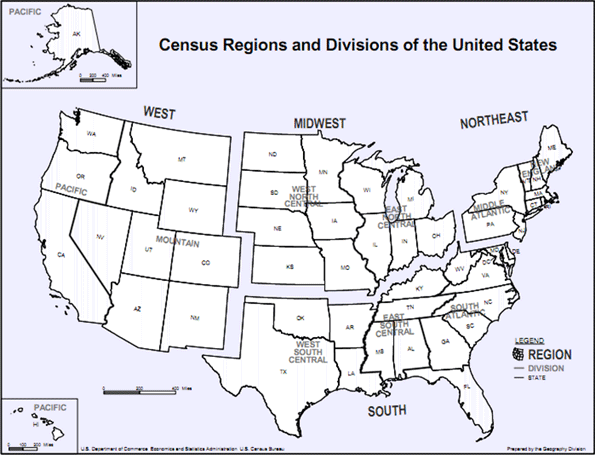
    Map courtesy of Passaic Public Library

    The recently released 2010 census data indicates that the dispersion of New Jersey population, which was underway by 1900 and continued apace in the last decade.

    New Jersey’s Larger Municipalities: This is not to suggest that it was a bad decade for the larger municipalities in the state. However, the 20th century was not kind to New Jersey’s largest municipalities. At some point during the century, six municipalities reached a population of 100,000 or more. Four of these municipalities were near the city of New York and were eventually engulfed by its suburbanization (Newark, Jersey City, Paterson and Elizabeth). Another, Camden, was engulfed by Philadelphia’s expansion and the last, the state capital Trenton, is midway between the cores of the two metropolitan areas and has more recently become a part of the New York metropolitan area.

    The new decade started out better for these municipalities. Newark, Jersey City, Elizabeth and Camden gained population between 2000 and 2010. However, even after the population gains, Newark’s population remains 165,000 (37 percent) below its 1930 peak. Jersey City remains 70,000 (22 percent) below its 1930 peak, despite the growth of a new financial district just across the Hudson River from lower Manhattan. Camden remains approximately 35,000 (37 percent) below its 1950 peak. Of the four municipalities gaining population, Camden did the best, adding 6.9 percent to its population, a full 50 percent above the statewide increase of 4.5 percent.

    Paterson and Trenton posted small population losses. Trenton remains nearly 45,000 (33 percent) below its 1950 peak (Table 1).

    Table 1
    New Jersey Municipalities Achieving 100,000 Population
    Census Population Peak
    Municipality 2000 2010 Change % Change Population Year
    Newark      273,946    277,140       3,194 1.2%     442,337 1930
    Jersey City      240,055    247,597       7,542 3.1%     316,715 1930
    Paterson      149,222    146,199      (3,023) -2.0%     149,227 2000
    Elizabeth      120,568    124,969       4,401 3.7%     124,969 2010
    Trenton        85,403      84,913         (490) -0.6%     128,009 1950
    Camden        78,672      84,136       5,464 6.9%     124,555 1950
    Total      947,866    964,954     17,088 1.8%   1,285,812
    Balance of State   7,466,484  7,826,940    360,456 4.8%
    New Jersey   8,414,350  8,791,894    377,544 4.5%   8,791,894 2010


    Elizabeth and Paterson however have been far more successful in retaining their population than other older municipalities, both in New Jersey and around the nation. Both Elizabeth and Paterson have become majority Hispanic and have a sizeable African American community. They also have a large immigrant community.  In Elizabeth, 45 percent of the population is foreign born, almost four times the national rate. Paterson has an immigrant population of 25 percent.  

    The Older Suburban Counties: Nonetheless, even with the modest population reversals in four of the five municipalities in the Philadelphia and New York metropolitan areas, their corresponding older suburban counties grew slower than the rest of the state in the 2000s. Combined, Camden, Essex, Hudson, Passaic and Union counties – fast growing suburbs of the early 1900s – grew at a rate of 1.6 percent, compared to the statewide growth rate of 4.5 percent, capturing 12 percent of the statewide growth.  (Table 2).

    Table 2
    New Jersey County Population Growth by Area
    Area 2000 2010 Change % Change Share of Growth
    5 Older Suburban Counties  2,923,130  2,969,617    46,487 1.6% 12.3%
    Balance of NY & Phila Metropolitan Counties  4,887,467  5,184,873  297,406 6.1% 78.8%
    Outside NY & Phila Metropolitan Area     603,753     637,404    33,651 5.6% 8.9%
    Total  8,414,350  8,791,894  377,544 4.5% 100.0%
    Note: 5 Older Suburban Counties Include Camden, Essex, Hudson, Passaic and Union


    The Newer Suburban Counties: The bulk of New Jersey’s growth has taken place, as in the rest of the country, in more newly suburbanizing counties of the Philadelphia and New York metropolitan areas (Note 1). The growth rate in these counties was 6.0 percent, well above the statewide growth rate of 4.5 percent. Overall, the outer suburban counties accounted for 73 percent of the state’s population growth during the 2000s. The strongest growth was in Ocean County, which is at the furthest distance (fifty to one hundred miles) from New York City.  Ocean County grew 13 percent, adding 66,000 people to its population, nearly one-fifth of the state population gain. Gloucester County, in the Philadelphia area also grew 13 percent, adding 33,000 to its population. Ocean and Gloucester accounted for more than one-quarter of New Jersey’s population growth. Only one other county added more than 50,000 people, Middlesex, which is adjacent to the New York City borough of Staten Island in New York, much of which is made up of postwar suburbanization.

    Counties Outside the Large Metropolitan Areas: The counties outside the New York and Philadelphia metropolitan area, Atlantic, Cape May, Cumberland and Warren added 5.6 percent to their population and nine percent of the state’s population gain. The largest growth was in Atlantic County (8.7 percent) and Cumberland County (6.1 percent), both adjacent to counties of the Philadelphia metropolitan area. Cape May County had the largest population loss in the state, at 4.9 percent (Essex County, where Newark is located, lost 1.2 percent, the only other county to lose population).

    Small Area Analysis: The dispersion of the population is also illustrated by "place" data, which includes incorporated municipalities (Note 2) and "census designated places."

    Generally, newer housing reflects the distance of suburbs from the urban core. Gaining a larger share of population growth, this demonstrates a primarily  suburban, rather than urban core oriented, expansion.  An analysis of the more than 500 places (municipalities and "census designated places") indicates that the greatest share of New Jersey’s growth is in new suburban areas.

    Among places in which housing has a median construction date of 1945 or earlier, there was a 0.8 percent reduction in population. The growth rate then rises with each 10 year increment, reaching 4.0 percent in places with a median construction date of 1976 to 1985 and 11.1 percent for places with a median construction date of later (though this is the smallest category).

    However, the growth in these places accounts for only 18.5 percent of the state’s population gain. The other 81.5 percent was outside the incorporated municipalities and the census designated places. This population is generally in the state’s townships, some of which are older (such as North Bergen or Woodbridge), but most of which are much newer.  However, much of the growth in the townships was in newer areas, with 84 percent in areas with median construction dates of 1966 or later (Note 3)

    Thus, all-metropolitan New Jersey is becoming more suburban, while older, major municipalities such as Newark, Jersey City and Camden are enjoying a welcome respite from their generally steep declines.

    Note 1: These counties include Bergen, Burlington, Cumberland, Hunterdon, Mercer, Middlesex, Monmouth, Morris, Ocean, Salem, Somerset and Sussex.

    Note 2: New Jersey township officials have been engaged with the Census Bureau in a dispute over whether New Jersey townships should be considered incorporated. This analysis uses the "non-incorporated" status as defined by the Census Bureau, without taking a position on the nature of the disagreement.

    Note 3: The Census Bureau routinely makes changes to "census designated places" between censuses. As a result it is not possible to reconcile the township and place totals to the state total. There is a discrepancy of approximately 1.5 percent. This discrepancy is small enough to make the township figures generally reflective of the median construction dates.

    Wendell Cox is a Visiting Professor, Conservatoire National des Arts et Metiers, Paris and the author of “War on the Dream: How Anti-Sprawl Policy Threatens the Quality of Life

  • America’s Biggest Brain Magnets

    For a decade now U.S. city planners have obsessively pursued college graduates, adopting policies to make their cities more like dense hot spots such as New York, to which the “brains” allegedly flock.

    But in the past 10 years “hip and cool” places like New York have suffered high levels of domestic outmigration. Some boosters rationalize this by saying the U.S. is undergoing a “bipolar migration”–an argument recently laid out by Derek Thompson in The Atlantic. On the one hand the smart “brains” head for cool, coastal cities like New York and Boston, while “families” and “feet”–a term that seems to apply to the less cognitively gifted–trudge to the the nation’s southern tier–a.k.a. the Sun Belt–for cheap prices and warm weather. “College graduates with bachelor’s degrees or higher,” Thompson notes, “have been moving to the coasts, like salmon swimming against the southwesterly current.”

    However, this analysis–no matter how widely accepted in the media–is grossly oversimplified, perhaps even misleading. Indeed, college graduates, for the most part, are heading not to the big cities on the coasts, but to smaller, less dense and quite often Sun Belt cities.

    To come up with our list of the country’s biggest brain magnets, we took the 52 largest metropolitan areas (all those over 1 million population) and ranked them by gains in people with college educations compared to the population over 25 years of age between 2007 and 2009, using the latest data from the American Community Survey provided by demographer Wendell Cox. It turns out that none of the top 10 gainers were large Northeastern cities, but largely Southern or Midwestern. New Orleans; Raleigh, N.C.; Austin, Texas; Nashville; Birmingham, Ala.; Kansas City, Mo.-Kan.; and Columbus, Ohio, all scored high marks. Only one California city, San Diego, made the top 10. Perennial “brain gainers” Denver, Colo., and Seattle round out the top 10.

    Among those metropolitan statistical areas with populations over 5 million, the best ranking went to the Philadelphia region (No. 12 overall), arguably the least glitzy and most affordable of the large northeast cities. The San Francisco metropolitan area, long a leader in its percentage of college-educated adults, held the next spot at No. 13. On the other hand, supposed “brain” magnets Boston and Chicago managed middling rankings, right behind Charlotte, N.C., and just ahead of San Antonio, Texas. Both fell well behind such overlooked “brain gain” areas as Jacksonville, Fla.; St. Louis, Mo.-Ill.; and Indianapolis. New York, the nation’s intellectual capital, ranked a mediocre 29th and Los Angeles an even worse 37th. To put in perspective, Nashville’s rate of college educated migration growth was 3.7%, compared with 1.4% for New York and a measly 0.7% for Los Angeles.

    Rather than following a clear path to the world of the “hip and cool,” college graduates appear influenced by a more nuanced and complex series of factors in terms of their location. New Orleans’ No. 1 ranking, for example, is likely product of the continuing recovery of its shrunken population, where the central city appears to be somewhat more attractive to professionals than before Katrina while the suburban populations have recovered more quickly from the disaster. The strong showing of Birmingham may likely be traced not to changes in the core city itself, but to the rapid growth in its surrounding suburban counties and the rapid expansion of the region’s medical complex.

    This reflects something not often mentioned: the spreading out of intelligence. Conventional theory suggests that the new generation of college graduates will go to the largest, densest places, eschewing, as The Wall Street Journal put it snidely, their parent’s McMansions for small abodes in the inner city. Yet the ACS numbers indicate that, overall, college migrants tend to choose less dense places. In the two years we covered, the growth rate in urban areas with lower urban area densities (2,500 per square mile) boasted a 5% increase in college-educated residents, compared with roughly 3.5% for areas twice as dense.

    This can be seen in the pattern of migration toward relatively low-density metropolitan areas like Nashville, Columbus, Raleigh or Kansas City as opposed to more packed regions like New York, Los Angeles or San Francisco. And wherever these college graduates migrate, they are at least as likely to settle outside the urban core. Another overlooked fact: Most places with the highest percentages of college-educated people are in suburbs. Only two of the 20 most-educated counties in the country are located in the urban core: New York (Manhattan) and San Francisco. Virtually all the rest are suburban.

    Another somewhat surprising statistic revolves around affordability and job growth. The college-educated, particularly in this tepid economy, are not immune to reality. They may want to go one place–for example, ever-alluring New York or sunny Los Angeles–but may soon find they can find neither a good job there nor an affordable place to live in order to stay there. Overall our analysis shows that many end up in places with lower housing prices. Areas with the highest price housing experienced college-educated growth at a rate only 60% of those with more affordable real estate. This is one thing that makes an Austin or Raleigh, even a Columbus or Kansas City, more attractive than a Boston, New York or Los Angeles

    Finally we have to consider employment trends. For the most part college graduates, like most folks, preferred cities with lower unemployment and more job growth. Some top gainers, such as Raleigh, Columbus and Kansas City, all boast lower than average unemployment and appear to be recovering from the recession. But this is not always the case: Some relatively poor performers on the job front, like Portland, Ore., and San Diego, have managed to maintain their appeal–for now.

    As the economy recovers these patterns are likely to accelerate, although they could also shift a bit as regions gain or lose employment momentum. Meanwhile, the best strategy for attracting graduates lies in creating jobs, as well as in offering both affordable housing and a range of housing options, including both reasonably priced urban and lower-density living. Generally speaking an area that is economically vital as well as physically or culturally appealing will do best. In the next decade advantages will also fall to family-friendly regions, particularly as the current crop of millennial-generation graduates starts entering en masse their family-forming years. These factors, more than hipness or dense urbanity, may well be more influential in determining which regions do best in the ongoing war for talent.

    —-

    No. 1: New Orleans-Metairie-Kenner, La.

    Grad Gain: 36,666

    Gain as a Share of Total 25+ 2007 Population: 5.42%

    New Orleans’ No. 1 ranking is likely due to former exiles returning after Hurricane Katrina. A recent report from the Census Bureau estimates that area’s population in the past decade has shrunk 29%. Recovery in the urban core has remained patchy, but suburban populations have recovered more quickly from the disaster.

    No. 2: Raleigh-Cary, N.C.

    Grad gain: 28,748

    Gain as a Share of Total 25+ 2007 Population: 4.27%

    Even in hard times Raleigh-Durham–the fastest-growing metro area in the country–has repeatedly performed well on Forbes’ list of the best cities for jobs. The area is a magnet for technology companies fleeing the more expensive, congested and highly regulated northeast corridor. Affordable housing and short commute times are no doubt highly attractive to millennials seeking to start a family. Indeed, a 2010 Portfolio.com/bizjournals survey ranked the city the third-best for young adults.

    No. 3: Austin-Round Rock, Texas

    Grad gain: 42,117

    Gain as a Share of Total 25+ 2007 Population: 4.23%

    Brains are flocking to Austin for good reason. Forbes ranked it the best large urban area for jobs in 2010. Along with Raleigh-Durham, Austin is emerging as the next Silicon Valley, luring lots of brains who would have previously headed toward the West Coast. Austin owes much both to its public-sector institutions (the state government and the main campus of the University of Texas) and its expanding ranks of private companies–including foreign ones–swarming into the city’s surrounding suburban belt. Its vibrant cultural scene certainly helps in attracting college-educated millennials.

    No. 4: Nashville-Davidson-Murfreesboro-Franklin, Tenn.

    Grad gain: 36,975

    Gain as a Share of Total 25+ 2007 Population: 3.68%

    A high quality of life, a vibrant cultural and music scene and a diverse population make Nashville a desirable place to live. Low housing costs drive down the cost of living, which is even lower than in other affordable cities like Raleigh, Austin or Indianapolis. Nashville is also home to a growing health care industry: More than 250 health care companies have operations in Nashville, and 56 are headquartered there.

    No. 5: Kansas City, Mo./Kan.

    Grad gain: 38,398

    Gain as a Share of Total 25+ 2007 Population: 2.96%

    The two-state Kansas City region boasts strong population growth and net in-migration– and for good reason. The city has one of the lowest costs of living, one of the highest personal-income growth rates and one of the healthiest real estate markets in the country. Short commute times also add to the attractiveness of the city for families. The city is the second-largest rail hub in the U.S. and is actively growing its life science and technology sectors.

    No. 6: Birmingham-Hoover, Ala.

    Grad gain: 21,111

    Gain as a Share of Total 25+ 2007 Population: 2.86%

    Birmingham’s strong showing on this list is likely due to the rapid growth in its surrounding suburban counties. One big development sure to lure brains: the rapid expansion of the University of Alabama’s medical center and surrounding private medical industry.

    No. 7: San Diego-Carlsbad-San Marcos, Calif.

    Grad gain: 51,151

    Gain as a Share of Total 25+ 2007 Population: 2.71%

    The only MSA from the "hip and cool" state of California to make the top 10, despite high levels of out-migration and a relatively poor performance in the job front. For now, at least, the area’s beautiful beaches and idyllic weather manage to attract plenty of college graduates, but it will need to get out of its slump in order to retain them.

    No. 8: Denver-Aurora-Broomfield, Colo.

    Grad gain: 43,853

    Gain as a Share of Total 25+ 2007 Population: 2.69%

    A perennial magnet for college graduates, and one of the "hip and cool" cities to make the top of our list, Denver was one of the darlings of the information age, and its suburbs have long incubated tech companies. Its technology sector is still strong, but higher prices and greater regulation have driven companies to regions like Austin and Raleigh, which are more business-friendly and cheaper.

    No. 9: Columbus, Ohio

    Grad gain: 29,515

    Gain as a Share of Total 25+ 2007 Population: 2.6%

    While the recession has taken a huge toll on the rest of Ohio, Columbus has been thriving, thanks to being home of the state capital, a booming startup culture and the largest college campus in the country–Ohio State University, a major employer and information center. Forbes named the Columbus metropolitan area–home to 1.8 million residents– one of America’s best housing markets, as well as one of the best places for businesses and careers. The city enjoys below-average unemployment and a strong tech presence that includes Battelle Memorial Institute, which oversees laboratories for several federal agencies.

    No. 10: Seattle-Tacoma-Bellevue, Wash.

    Grad gain: 53,869

    Gain as a Share of Total 25+ 2007 Population: 2.39%

    Seattle has long been one of the big winners in the brain battle as well. It has some of the country’s most important cutting-edge firms–Microsoft, Costco, Amazon, Starbucks–one of the country’s best arrays of urban and suburban neighborhoods. Housing is no longer cheap, but remains far less expensive than its main rival, the San Francisco Bay Area.

    —-

    Photo by Jeanette Runyon

    This piece originally appeared in Forbes.

    Joel Kotkin is executive editor of NewGeography.com and is a distinguished presidential fellow in urban futures at Chapman University, and an adjunct fellow of the Legatum Institute in London. He is author of The City: A Global History. His newest book is The Next Hundred Million: America in 2050, released in February, 2010.

  • Regional Exchange Rates: The Cost of Living in US Metropolitan Areas

    International travelers and expatriates have long known that currency exchange rates are not reliable indicators of purchasing power. For example, a traveler to France or Germany will notice that the dollar equivalent in Euros cannot buy as much as at home. Conversely, the traveler to China will note that the dollar equivalent in Yuan will buy more.

    Economists have attempted to solve this problem by developing "purchasing power parities," which are used to estimate currency conversion rates that equalize values based upon prices (Note 1). This helps establish the real value of money in a particular place.

    When people move from one region of the United States to another they can encounter a similar phenomenon. For example, a dollar is not worth as much in San Jose as it is in St. Louis. Research by the US Department of Commerce Bureau of Economic Analysis (BEA), for example, found that in 2006 a dollar purchased roughly 35 cents less in San Jose than in St. Louis. BEA researchers estimated "regional price parities" for states and the District of Columbia and for all of the nation’s metropolitan areas (Note 2). Regional price parities can be thought of as the equivalent of regional (state or metropolitan area) exchange rates. This research was covered in previous newgeography.com articles by Eamon Moynihan and this author.

    This article uses Department of Labor, Bureau of Labor Statistics metropolitan area consumer price indexes to estimate the 2009 cost of living and per capita personal income adjusted for the cost of living.

    Cost of Living: At the regional level (See Census Region Map, Figure 1), there are substantial differences in the cost of living (Figure 2). The lowest cost of living is in the Midwest, at 4.8 percent below the nation. The South has the second lowest cost of living at 3.9 percent above the national level. The West is the most expensive area, 13.5 percent above the national cost-of-living, while the Northeast’s cost-of-living stands 11.3 percent above the national rate.

    The cost of living in the South may seem higher than expected. But if the higher cost metropolitan areas of Washington, Baltimore and Miami are excluded, the cost of living in the South falls to 1.5 percent below the national rate. If the California metropolitan areas are excluded from the West, the cost of living still remains 4.0 percent above the national rate.

    Per Capita Income: The highest unadjusted per capita incomes are in the Northeast, followed by the West, the South and the Midwest. Yet when metropolitan area exchange rates are taken into consideration, the order changes significantly. The Northeast remains the most affluent, and the Midwest moves from last place to second place. The South is in third place, the same as its income rating, while the West falls from second place to fourth place (Figure 3).

    Cost of Living: Variations in the cost of living, which is reflected by the metropolitan area exchange rates, remains similar in 2009 to the 2006 rankings.

    The Top Ten: The lowest costs of living were in (Table 1):

    1. St. Louis, where $0.891 purchased $1.00 in value at the national average.
    2. Kansas City, where $0.903 purchased $1.00 in value at the national average.
    3. Cleveland, where $0.921 purchased $1.00 in value at the national average.
    4. Pittsburgh, where $0.941 purchased $1.00 in value at the national average.
    5. Cincinnati, where $0.944 purchased $1.00 in value at the national average.

    Rounding out the most affordable 10 are two metropolitan areas in the South (Atlanta and Dallas-Fort Worth), two in the Midwest (Detroit and Milwaukee) and one in the West (Denver). No Northeastern metropolitan area was ranked in the top 10.

    Table 1
    Estimated Cost of Living: 2009
    Metropolitan Areas over 1,000,000 with Local CPIs
    Rank Metropolitan Area
    Metropolitan Exchange Rate: to Purchase $1.00 at National Average
    Compared to Lowest Cost of Living
    1
    St. Louis, MO-IL
    $0.891
    0%
    2
    Kansas City, MO-KS
    $0.903
    1%
    3
    Cleveland, OH
    $0.921
    3%
    4
    Pittsburgh. PA
    $0.941
    6%
    5
    Cincinnati, OH-KY-IN
    $0.944
    6%
    6
    Atlanta. GA
    $0.958
    8%
    7
    Detroit. MI
    $0.959
    8%
    8
    Milwaukee. WI
    $0.959
    8%
    9
    Dallas-Fort Worth, TX
    $0.976
    10%
    10
    Denver, CO
    $0.996
    12%
    11
    Minneapolis-St. Paul, MN-WI
    $1.000
    12%
    12
    Houston, TX
    $1.000
    12%
    13
    Tampa-St. Petersburg, FL
    $1.006
    13%
    14
    Phoenix, AZ
    $1.011
    14%
    15
    Portland, OR-WA
    $1.034
    16%
    16
    Chicago, IL-IN-WI
    $1.041
    17%
    17
    Philadelphia, PA-NJ-DE-MD
    $1.054
    18%
    18
    Baltimore, MD
    $1.068
    20%
    19
    Riverside-San Bernardino, CA
    $1.078
    21%
    20
    Miami-West Palm Beach, FL
    $1.085
    22%
    21
    Seattle, WA
    $1.120
    26%
    22
    San Diego, CA
    $1.151
    29%
    23
    Boston, MA
    $1.175
    32%
    24
    Washington, DC-VA-MD-WV
    $1.181
    33%
    25
    Los Angeles, CA
    $1.222
    37%
    26
    San Francisco-Oakland, CA
    $1.258
    41%
    27
    New York, NY-NJ-PA
    $1.281
    44%
    28
    San Jose, CA
    $1.343
    51%
    Estimated from BEA 2006 data, adjusted by local Consumer Price Index for 2006-2009


    The Bottom Ten: The most expensive metropolitan areas were:

    28. San Jose, where $1.343 purchased $1.00 in value at the national average.
    27. New York, where $1.281 purchased $1.00 in value at the national average.
    26. San Francisco, where $1.268 purchased $1.00 in value at the national average.
    25. Los Angeles, where $1.222 purchased $1.00 in value at the national average.
    24. Washington, where $1.181 purchased $1.00 in value at the national average.

    The bottom ten also included three metropolitan areas in the West (Riverside-San Bernardino, San Diego and Seattle), one in the Northeast (Boston) and one in the South (Miami). There were no Midwestern metropolitan areas in the bottom 10.

    Per Capita Income: Per capita income in 2009 was then adjusted for the cost of living.

    Top Ten:Washington has the highest per capita income, adjusted for the cost of living, at $47,800. San Francisco placed second at $47,500. Denver ranked third at $46,200, while the cost-of-living adjusted income in Minneapolis-St. Paul was $45,800 and $45,700 in Boston. The top 10 also included two Midwestern metropolitan areas (St. Louis and Kansas City), two from the Northeast (Baltimore and Pittsburgh) and one from the West (Seattle).

    Bottom Ten: The least affluent metropolitan area was Riverside-San Bernardino, with a per capita income of $27,800. Phoenix was second least affluent at $33,900 while Los Angeles was third least affluent at $35,000. The fourth least affluent metropolitan area was Tampa-St. Petersburg at $36,600 and the fifth least affluent metropolitan area was Portland at $37,400. The bottom 10 also included two metropolitan areas from the South (Atlanta and Miami), two from the Midwest (Cincinnati and Detroit) and one from the West (San Diego).

    The cost of living adjusted income data includes surprises. New York, commonly considered a particularly affluent metropolitan area, ranked 17th in cost-of-living adjusted income, and below such seemingly unlikely metropolitan areas as Pittsburgh, Kansas City, Cleveland, St. Louis and Milwaukee. These metropolitan areas also ranked above San Jose, which ranked first in unadjusted income in 2000, but now ranks 16th in cost of living adjusted income (Table 2).

    Table 2
    Personal Income Per Capita Adjusted for  the Cost of Liviing
    Metropolitan Areas over 1,000,000 with Local CPIs
    Rank (Cost of Living Adjusted)
    Rank (Unadjusted Income)
    Metropolitan Area
    Per Capita Income 2009: Adjusted for Cost of Living
    Per Capita Income 2009: Unadjusted
    1
    2
    Washington, DC-VA-MD-WV
    $47,780
    $56,442
    2
    1
    San Francisco-Oakland, CA
    $47,462
    $59,696
    3
    8
    Denver, CO
    $46,172
    $45,982
    4
    9
    Minneapolis-St. Paul, MN-WI
    $45,772
    $45,750
    5
    4
    Boston, MA
    $45,707
    $53,713
    6
    18
    St. Louis, MO-IL
    $45,288
    $40,342
    7
    7
    Baltimore, MD
    $44,908
    $47,962
    8
    15
    Pittsburgh. PA
    $44,848
    $42,216
    9
    19
    Kansas City, MO-KS
    $43,862
    $39,619
    10
    6
    Seattle, WA
    $43,730
    $48,976
    11
    13
    Houston, TX
    $43,581
    $43,568
    12
    16
    Milwaukee. WI
    $43,477
    $41,696
    13
    11
    Philadelphia, PA-NJ-DE-MD
    $43,247
    $45,565
    14
    21
    Cleveland, OH
    $42,734
    $39,348
    15
    12
    Chicago, IL-IN-WI
    $41,990
    $43,727
    16
    3
    San Jose, CA
    $41,255
    $55,404
    17
    5
    New York, NY-NJ-PA
    $40,893
    $52,375
    18
    20
    Dallas-Fort Worth, TX
    $40,494
    $39,514
    19
    23
    Cincinnati, OH-KY-IN
    $40,437
    $38,168
    20
    10
    San Diego, CA
    $39,647
    $45,630
    21
    24
    Detroit. MI
    $39,147
    $37,541
    22
    17
    Miami-West Palm Beach, FL
    $38,124
    $41,352
    23
    26
    Atlanta. GA
    $38,081
    $36,482
    24
    22
    Portland, OR-WA
    $37,446
    $38,728
    25
    25
    Tampa-St. Petersburg, FL
    $36,561
    $36,780
    26
    14
    Los Angeles, CA
    $35,045
    $42,818
    27
    27
    Phoenix, AZ
    $33,897
    $34,282
    28
    28
    Riverside-San Bernardino, CA
    $27,767
    $29,930
    Estimated from BEA 2009 income data and 2006 regional price parity data, adjusted by local Consumer Price Index for 2006-2009


    Some expensive metropolitan areas such as Washington, San Francisco and Boston ranked at or near the top, but their cost-of-living adjusted incomes were considerably less than the unadjusted incomes. On average, it took $1.20 to purchase $1.00 of value at national rates in these three metropolitan areas. Washington’s unadjusted per capita income was 40 percent ($16,100) higher than that of St. Louis, however when the cost of living is factored in, Washington’s advantage drops to 6 percent ($2,500).

    Caveats: The analysis above does not consider cost-of-living differentials within metropolitan areas. For example, data from the ACCRA cost of living index indicates generally higher prices in the cores of the largest metropolitan areas, such as New York (especially Manhattan), Chicago and San Francisco. Further, these data make no adjustment for relative levels of taxation. A cost of living analysis using disposable income would produce different results, dropping higher taxed metropolitan areas to lower rankings and raising lower taxed metropolitan areas higher.

    Cost of Living Differences: Will They Continue? The spread in cost-of-living between metropolitan areas have been driven wider over the last decade by the relative escalation of house prices in some metropolitan areas in the West, Florida and the Northeast. Whether these shifts in cost of living will be reflected in migration patterns will be one of the things to look for in the new Census.

    ———

    Note 1: Purchasing power parity data is published by the World Bank, the International Monetary Fund (IMF) and the Organization for Economic Cooperation and Development (OECD).

    Note 2: The BEA research applied regional price parity factors only to employee compensation and excluded other income. It is possible that, had the analysis been expanded to these other forms of income, the differences in cost of living would have been greater.

    Photo: Rosslyn, VA business district, Washington (by author)

    Wendell Cox is a Visiting Professor, Conservatoire National des Arts et Metiers, Paris and the author of “War on the Dream: How Anti-Sprawl Policy Threatens the Quality of Life

  • Chicago: The Cost of Clout

    The Chicago Tribune has been running a series on the challenges facing the next mayor. One entry was about the Chicago economy. It described the sad reality of how Chicago’s economy is in the tank, and has been underperforming the nation for the last few years. I’ll highlight the part about challenges building an innovation and tech economy in Chicago:

    The region also has lagged in innovation, firm creation and growth in productivity and gross metropolitan product over the past decade, according to economic development consultant Robert Weissbourd, president of RW Ventures LLC. Daley’s two long-held dreams of Chicago emerging as a high-tech center and a global business center remain just out of reach… “We haven’t made the real global jump yet, and we have not made the tech jump either, but we are finally poised,” said Paul O’Connor, who for many years ran World Business Chicago, the city’s economic development affiliate. “We are still a major contender, but, yeah, we can blow it.” Or, as [Chicago Fed Economist William] Testa put it, “Given the poor performance of this decade, we need to rethink the challenges for Chicago.”

    “If I could wave a magic wand, I would get government to start thinking differently about … what are the levers that we need to push, away from the traditional (tax increment finance district) thinking and away from the traditional thinking of, ‘Let’s just get a big company to move here,’ and toward thinking about how to foster innovation and creativity,” Christie Hefner, former chairman and chief executive of Playboy Enterprises Inc., said at a recent economic forum.

    It has been extremely rare to see people with establishment positions ever say a discouraging word about the city. Most honest observers would have to rate Daley highly has a leader, but certainly not perfect. Yet any criticism at all of him (directly or implicitly by that of the city he runs) has been studiously avoided by most. They are terrified of being excommunicated or broken on the wheel if they deviate from the script. To have corporate executives asking tough questions is unusual, and hopefully an example of a forthcoming “Great Thaw” we need to have here in the wake of Daley’s retirement.

    Chicago’s inability to build an innovation/tech economy is pretty remarkable if you think about it. Here’s third largest city in the country, one with enormous human capital, tremendous wealth, incredible academic institutions, and above all an ability to execute that far outclasses virtually any city I know. How is it then that Chicago has been unable to execute on this?

    Believe it or not, a lot of it goes back to that bane of Chicago politics: Clout. People in Chicago tend to write off clout and political corruption in Chicago with a shrug, as a unique or even amusing local affectation, or just part of the character of purely political life of the city, but one that doesn’t fundamentally change its status as the “City That Works.” But nothing could be further from the truth. Chicago’s culture of clout is a key, perhaps the key, factor holding the city back economically.

    Chicago’s Ambition: Clout

    In Paul Graham’s essay Cities and Ambition, he writes about the subtle messages cities send about what you should try to achieve, and how that shapes their fortunes:

    “Great cities attract ambitious people. You can sense it when you walk around one. In a hundred subtle ways, the city sends you a message: you could do more; you should try harder. The surprising thing is how different these messages can be. New York tells you, above all: you should make more money. There are other messages too, of course. You should be hipper. You should be better looking. But the clearest message is that you should be richer.

    What I like about Boston (or rather Cambridge) is that the message there is: you should be smarter. You really should get around to reading all those books you’ve been meaning to. When you ask what message a city sends, you sometimes get surprising answers. As much as they respect brains in Silicon Valley, the message the Valley sends is: you should be more powerful.

    How much does it matter what message a city sends? Empirically, the answer seems to be: a lot. You might think that if you had enough strength of mind to do great things, you’d be able to transcend your environment. Where you live should make at most a couple percent difference. But if you look at the historical evidence, it seems to matter more than that.

    Chicago’s ambition, the message it sends is: “You should have more clout.” Does that matter? You bet it does.

    What Is Clout?

    Clout is a term of art in Chicago that normally refers to the ability to use connections to obtain jobs, contracts, subsidies or other favors from government. But more broadly, we can think of clout as the ability to influence organizational action within the context of a particular power structure.

    But if that’s the definition, isn’t saying you should have clout the same thing as saying you should have power like Graham said of Silicon Valley? No. Having power, like that held by Mark Zuckerberg or Larry Page and Sergey Brin, is about being autocephalous. It’s about have an independent base of authority or ability to act others are forced to respect. Clout, by contrast is all about petty privileges. Clout can be given, but it can also be taken away. That’s what makes it so corrupting. Tellingly, no one ever talks about Mayor Daley as having clout. That’s because he has real power instead. Having power is like being a king or a duke or a baron. Clout is all about being a courtier.

    To see this in action, just contrast Jesse Jackson with Al Sharpton. Both are prominent national civil rights leaders and black ministers. But Jackson rarely goes hard after anyone in Chicago, at least not anymore. Jackson has clout. One son is a congressman. Another somehow managed to acquire ownership of a lucrative beer distributorship. Jackson bought into the system in Chicago.

    By contrast, Sharpton wants to be a power player in New York, to be someone to whom even a would-be mayor has to come visit and, as they say, kiss the ring. He’s not interested in being bought off. Sure, he’ll make alliances. But he’ll never give up his independent base of power that makes him someone to be reckoned with. That’s the difference between power and clout.

    The Chicago Nexus

    John Kass likes to talk about clout in terms of the “the Combine,” or the bi-partisan system in Illinois in which the Democrats and Republicans have often proven less rivals than partners in crime, sometimes literally. But I prefer to think of “the Nexus” – a unitary social structure that pretty much everyone who’s anyone in Chicago is part of, one that goes far beyond the world of politics.

    Ramsin Canon had a good illustration of the Nexus in a piece he wrote over at Gapers Block:

    With big city economies cratering all around him, the Mayor was able to raise in the neighborhood of $70 million dollars to fund the Olympic Bid. At the same time he was able to get everybody that mattered–everybody–on board behind the push for the Olympics. Nobody, from the largest, most conservative institutions to the most active progressive advocacy group, was willing to step out against him on that issue.

    The list of big donors to the Chicago 2016 bid committee is a comprehensive list of powerful Chicago institutions. I mean, it’s exhaustive. Economy be damned, when the Mayor called, they listened. Why? What did those conversations sound like? And do we believe that the Mayor is so powerful–or that their relationship with him is so close–that they must obey him? Or–more likely–is it a mutual back-scratching club with an incentive to protect the status quo? Chicago’s political infrastructure isn’t about the Democratic Party or “the Machine” or special interest groups or labor unions. Those are elements of varying importance. It’s real power lives in the networks that tie that list together.


    Replace the man on the Fifth Floor–Bureaucracy Man, the superhero who keeps our alleys clear–and will these networks evaporate? Will they just disappear? How long would it take them to reorganize around the new personalities that moved in there?

    All cities have elite networks, but I have never seen a city that has a unitary power nexus to the extent Chicago does. I believe the Nexus resulted from the culture of clout combined with the fact that, with the exception of the interregnum between Daley pere and fils, power has been centralized on the 5th floor of city hall for decades. The Nexus may have come into being around the mayor, but now it has become a feature of civic life, one that practically longs for what Greg Hinz has labeled a “Big Daddy” style leader to sustain the system.

    Clout’s Effect on the Culture of Chicago

    The emergence of the Nexus is one of the key cultural impacts of clout in Chicago. If clout is only effective within a given power structure, then clearly the clouted want to see their power structure expand. The ultimate dream of the clout seeker is a centralized unitary state like Louis XIV’s France. In Chicago, we’ve come amazingly close to achieving it. It’s not that there’s no conflict, but it is all of the palace intrigue variety, not true conflicts between rival power centers. Without centralized political power and a tradition of clout, the Nexus would never have come into being.

    There are many other cultural impacts as well. As Douglas and Wildavsky note in Risk and Culture, “An individual who passes his life exclusively in one or another such social environment internalizes its values and bears its marks on his personality.”

    People are bought into and defend the system. They mapped these social environments along the axes of “grid” and “group” – the degree of hierarchy in the system and the degree of group cohesion. The Chicago Nexus is a high-grid, high-group structure, or collective hierarchy, with centralized decision making and a high cost of defection. Even groups that in other cities tend to be more oppositional to government will say something like, “Decisions get made in the mayor’s office here, so we have to play that game” and buy into the system. I’ve lost track of the number of times I’ve heard, “That’s just how it works here.” Of course, this means the basis of their own ability to make things happen then becomes influence – clout – within the Nexus. Thus they defend the system, because if it went away, so would their ability to make things happen because they’ve cultivated no alternative vectors for action. Also, the Council Wars period of the 1980’s still looms large in many leaders’ minds. Chicago remains heavily segregated and racially balkanized, as the recent quest for a single black mayoral candidate illustrates. There’s a lot of worry about what might happen if the current system breaks down.

    Conservatism and favoring of the establishment. Following on from that, the system fosters a sort of generalized conservatism, one dominated by a desire for institutional stability. It takes a heavy hitter to get the mayor’s attention or even access to the mayor, which reinforces establishment control, an inherently conservative model. This conservatism is even visible the realm of public design, as I’ve noted in discussion the retro-nostalgia design of the city’s streetlights and other streetscape elements. The evidence of clout-fed conservatism is literally graven in into the very streets of the city.

    Parochialism. Though fancying itself a cosmopolitan burg, I don’t see that Chicago is that much less parochial than most other Midwest cities. You see this in a thousand little ways. For example, in the way beloved long time personalities dominate the local airwaves. As the New York Times noted about turmoil at long time ratings leader WGN-AM, “Chicago tends to be unforgiving to newcomers. And with WGN pulling in the second- most radio revenue in the market behind WBBM, its moves are fraught with risk. ‘It was always difficult to bring someone in from out of town,’ said Bob Sirott, a longtime Chicago broadcaster.” (Longevity seems particularly prized here generally, as unless you are fortunately enough to be born to the right family or in the right parish, it takes time to accumulate clout). Or in the focus on local and hyper-local news in the local internet journalism community.

    Fear. As a high-group social structure, people are terrified of being kicked out of the club. Hence the unwillingness to cross the party line on almost any issue. As Tocqueville put it: “That which most vividly stirs the human heart is not the quiet possession of something precious, but rather the imperfectly satisfied desire to have it and the continual fear of losing it again.” People are even afraid of collateral damage if others near them cross the line. As Mike Doyle said, “In systems like Chicago’s, people don’t just refrain from rocking the boat, they do their best to keep anyone else from rocking it either.”

    Total Rejection of the Other. Anyone who exists outside the structure is a potential threat. Hence they are either co-opted or marginalized. The best illustration of this is the very title of that wonderful book on Chicago politics, We Don’t Want Nobody Nobody Sent. Or as Steve Rhodes said to me:

    One of the bartenders at the Beachwood says it took her awhile to figure this city out. In other cities you apply for a job with a resume, talk about your experience, etc. Here they just want to know who you know, who sent you – even at the bartender level….I’m not naive enough to believe this doesn’t happen elsewhere, but nowhere near as it does here, where it’s in the DNA. …Here, merit counts for next to nothing…In New York, everyone wants to know: “What do you do?” In Chicago, everyone wants to know: “Who do you know?”

    Why Clout Is Toxic to the Innovation Economy

    When you think about these cultural impacts of clout on Chicago, it becomes obvious why the city has failed to build an innovation economy. Innovation is fundamentally about new ideas, new ways of doing things, new players in the game, those from the outside, about merit, about dynamism. Clout is about what happened yesterday, the fruits of long years of efforts, and the same old – sometimes really old – players, about insiders, about connections, about stasis. As Jane Jacobs noted, “Economic development, no matter when or where it occurs, is profoundly subversive of the status quo.” Innovation driven economic development is fundamentally about disrupting the status quo. Clout is all about preserving it. Innovation welcomes the outsider, the clout-fueled Nexus abhors the Other. Innovation and clout are enemies.

    Think about the innovation hubs in America. They are all places that welcome the new. Not that it’s easy to make it in them. In fact, these place are often brutally competitive. And of course they have elite networks where the scions of the rich and powerful have a leg up and such. But the new is an important part of what makes them tick. In Silicon Valley, they are always looking for the tomorrow’s HP, Apple, Cisco, Google, Facebook, or Twitter, not just celebrating the past. They know that success today is ephemeral and, as Andy Grove put it, “only the paranoid survive.” DC loves its establishment, but the very nature of the place assures there will always be new players in the game. President Obama comes out of nowhere to gain the White House. But two years later it is the upstart Tea Party’s turn. Possibly because of their entertainment industry clusters, NYC and LA are always on the lookout for the fresh face and the next big thing.

    But Chicago? What do you think is going to happen when an ambitious 20-something with a great idea for a new business but no clout shows up in Chicago trying to make it happen and knocks on the door?

    I may not be 20 anymore, but at the risk of making this post sound like merely a bit of personal pique, I’ll share a true personal story to illustrate one example of how this plays out in real life in Chicago. In 2009 I received an award from the Chicagoland Chamber of Commerce for innovative thinking on public transit, winning first prize in a global competition they ran to solicit ideas for boosting public transit ridership in Chicago.

    I was thinking at the time that I might want to do something more entrepreneurial. I knew that the Chamber ran a sister organization called the Chicagoland Entrepreneurship Center chartered with boosting startups in Chicago. In the wake of my award I decided to check them out and see how they might be able to help me.

    There was just one problem: they wouldn’t return my phone calls. I made many attempts to get in touch with them by phone and email, and couldn’t even get them to give me a “No Thanks” or pawn me off on a peon. Now I’m a guy who a) had significant business experience, who b) built up one of America’s top urbanist sites from scratch, an inherently entrepreneurial act, and a successful one, if you think about it, and c) just got an award for innovation from the Chamber itself. Yet they wouldn’t even give me the time of day.

    What’s more, the Chamber mothership never showed any interest in engaging with me post-competition either. It was clearly just a PR exercise for them. Now don’t get me wrong, I’m delighted to report it was a very successful one. I got my picture on the front page of the Chicago Tribune above the fold. It exceeded my wildest expectations. I think the folks at the Chamber are nice people and I was extremely pleased with how it went. But clearly from their perspective, that’s where it ended. Actually uncovering innovators or something was not part of the agenda.

    From standpoint of the the Chicago system, this experience actually makes perfect sense, as I don’t have clout, nor can I bestow it on anyone. So why burn cycles on me?

    If you think about my profile and the treatment I got, can you imagine what a 23 year old armed with nothing but a crazy idea would get? A lot of ink has been dedicated to talking about how far Chicago and Illinois have come since they days when Mark Andreesen was actively harassed while trying to commercialize his web browser, then run out of town on a rail. But there is no doubt in my mind that if the next the next Andreesen showed up today, he’d get the exact same treatment. (I’m not familiar enough with Andrew Mason’s history to know how he was treated pre-Groupon, and pre-his association with the likes of big money Eric Lefkofsky. It would make an interesting case study to look at the history there – though he is a possible exception. I don’t know. In any case, his major local profile came after Groupon was already a huge success).

    This is what clout in Chicago hath wrought. The culture of the establishment Chicago is simply incompatible with an innovation economy. It’s not just about money or resources. It’s about respect. It’s about what this town respects, and more importantly what it doesn’t. It’s about what Chicago whispers to you about what you should aspire to achieve, what success means in this city, and the subtle – and not so subtle – messages about how you get ahead here.

    Until you’ve already made your millions or somehow wormed your way into connections or up through the hierarchy, establishment Chicago has no use for you in its economic plans, no matter what talent, ideas, or ambitions you might harbor. (Ironically, the biggest exception is Daley himself, who was famous for seeking out and rapidly promoting young talent like Ron Huberman and Richard Rodriguez. That’s another example of how he is head and shoulders above your average leader).

    By contrast, the local entrepreneurial tech community gets it, is energized, knows where the city is and where it needs to be, and is working hard to make progress with a sense of legitimate optimism backed up by recent good news. Grass roots and “by tech for tech” institutions ranging from Technori, to the Chicago Lean Startup Circle, to the folks at Groupon – which is a huge, inspirational success story, with people who get it and are committed to trying to build up Chicago’s tech scene – are hugely supportive of anyone trying to make a go at it no matter what stage they are in, and providing legitimately useful info and help along the way. Every single person in this group I’ve talked to has been more that willing to do anything to try to help me out, sometimes even more than I’d hoped or asked for – 100% of them. (Yes, this does mean I am starting an internet business myself – watch this space).

    I’ve long said Chicago isn’t going to be the next Silicon Valley and should seek only to get its “fair share” of tech. Having said that, as the third largest city in America, a fair share is still pretty big. If Chicago’s going to make it, this collaborative effort by the local tech community is what is going to get it there – not the Nexus.

    The Way Forward

    Pretty much every report out of officialdom – from Gov. Quinn’s Illinois Economic Recovery Commission Report to CMAP’s Go To 2040 Plan – suggests the public and quasi-public sectors need to do more to boost innovation. But what’s really needed is cultural change in the establishment. Until that happens, I’d suggest that what’s really needed is to take a page from the Getting Real playbook and for them to do less.

    Think about it. If Joe Investor shoots you down, you know the odds were probably long in the first place. While you might not come away feeling good about him, you probably don’t feel any worse about Chicago. But if you approach an official or quasi-official organization chartered with promoting “innovation”, “entrepreneurship”, “clusters”, “technology” or whatever in Chicago and they shoot you down, it’s not just them but your city you feel has rejected you. It’s one thing to generate a negative interaction with a private entity, but with an official entities that hurts the very thing they’re trying to promote. If an official or quasi-official organization can’t say Yes, or at least make sure that well over 50% of the people it says No to feel good about the experience, it should be shut down, because it’s doing more harm than good.

    What’s more, these organizations and leaders glom on to these hot phrases du jour and, as someone put it, “suck the oxygen out of the room.” They hog the microphone and the real stories and the real discussion that need to happen out there don’t get told in the press because big names are the default easy answer for reporters. Just look at the number of big titled civic folks and such quoted in the Tribune piece, for example. Startup blog Technori has already told me more in two months about things that matter in tech than the Tribune and the Sun-Times combined did all last year. As Mike Madison said of Pittsburgh:

    Tech-based economic development is not something that can be conjured in  meetings of mayors and CEOs.   That’s top-down, old-school, clear-the-skies, ACCD thinking.  In fact, I would guess that the more that the Downtown Duquesne Club crew gets in the middle of this process, the more the real entrepreneurs and innovators and risk-capital investors get turned off.

    Or as Paul O’Connor put it in that Tribune piece I led off with:

    “What we have now, to some extent, is a stodgy Midwest establishment, and underneath them are the kids who moved here, some of them in their 30s now,” he said. “They get it; they know how to do it. … We either give them permission and invite them to the table, which the next mayor should do and which Mayor Daley has begun to do a little bit lately, or we let them do it themselves.”

    Blowing Up the Culture of Clout

    Clout is so persistent in Chicago not just because of the people who personally benefit from it, but because there’s little perception of the ways the culture of clout affects Chicago outside the political realm. Indeed, to the extent people regard the Chicago Way at all, it’s often positively, because it enabled the city to “get things done.” It’s the same thing that causes Thomas Friedman to have his schoolgirl crush on China.

    But unfortunately for Chicago (and likely China too down the road) it doesn’t just matter if you can get things done, it matters what it is you do. And it also matters how you do it and who is involved. Until people understand the linkage between clout and other parts of the city like its economic under-performance, and care enough to change it, the non-political members of the Chicago Nexus are not going to feel the need to change the way things are done here. It’s not that these folks are corrupt by any means. Far from it. I believe they are completely sincere in their desire to better the city. But they don’t perceive the issue at the level that will collectively move them to action, or else feel the status quo is better for their institutional interests.

    Changing the culture is mission critical to Chicago realizing its ambitions as a global city and a center of the innovation economy, and a lot of other things too. The notion that you can have a centralized, top-down, clout driven Nexus infusing your civic culture but that somehow you’ll have an innovation driven economic culture – that’s just impossible. The attempt to fix and transform Chicago’s economy with a bunch of behind the scenes maneuvering and initiatives by a few heavy hitters has failed. We need to try a different way. That doesn’t mean Chicago has to become paralyzed with dysfunction of in-fighting or civic anarchy. But there need to be multiple power centers and a receptivity to everything innovation is all about. And it will be a bit messier. I think that’s a good thing. There’s no doubt Chicago is a great city with incredible assets and capabilities. There’s no reason it can’t join the ranks of the innovation elite – if it’s willing to start jettisoning the culture of clout the so hobbles its ambitions and embracing a more dynamic future for the city. What will it be, Chicago?

    Aaron M. Renn is an independent writer on urban affairs based in the Midwest. His writings appear at The Urbanophile, where this piece originally appeared.

    Photo by Bryce Edwards

  • Why Affordable Housing Matters

    Economists, planners and the media often focus on the extremes of real estate — the high-end properties or the foreclosed deserts, particularly in the suburban fringe. Yet to a large extent, they ignore what is arguably the most critical issue: affordability.

    This problem is the focus of an important new study by Demographia. The study, which focuses largely on English-speaking countries, looks at the price of housing relative to household income. It essentially benchmarks the number of years of a region’s household income required to purchase a median-priced house.

    Overall, the results are rather dismal in terms of affordability, particularly in what Wharton’s Joe Gyourko dubs “superstar cities.” These places — such as London, New York, Sydney, Toronto and Los Angeles — generally tend to be more expensive than second-tier regions commonly found in the American South and heartland.

    Even with their usually higher incomes, these regions, for the most part, still have a ratio of five years median income to median house price; this is far higher than the historical ratio of three. In some areas the ratios are even more stratospheric. Sydney and Melbourne, for example, have ratios over nine; London, New York, San Jose and Los Angeles approach six or more.

    Urbanists often assume that these high prices — unprecedented in a tepid economy — reflect the greater attractiveness of these regions. This is somewhat true, particularly for parts of London and New York, which can survive high ratios because their markets are less national and middle-income and more tied to the global upper classes.

    In places like Mayfair or New York’s Upper East Side, the buying “public” extends beyond the local market to high-income markets in places like the United Arab Emirates, Moscow, Shanghai, Singapore or Tokyo. Many owners are not full-time residents and consider a home in such places as just another expression of their wealth and privilege.

    Yet such markets are exceptional. In most regions, the vast preponderance of homebuyers are either natives or long-term migrants. Their less glamorous tastes — notably access to affordable single-family dwellings — drives migration  from one region to another. Over the past decade, and even since the crash, this has meant a general trend of migration from high-end, unaffordable markets to less expensive regions. In the U.S., for example, people have been flocking to the South, particularly the large metropolitan areas of Texas.

    One factor driving this migration, the Demographia study reveals, is differing levels of regulation of land use between regions. In many markets advocacy for “smart growth,” with tight restrictions on development on the urban fringe, has tended to drive up prices even in places like Australia, despite the relatively plentiful supply of land near its major cities.

    More recently, “smart growth” has been bolstered by claims, not always well founded, that high-density development is better for the environment, particularly in terms of limiting greenhouse gases. Fighting climate change (aka global warming) has given planning advocates, politicians and their developer allies a new rationale for “cramming” people into more dense housing, even though most surveys show an overwhelming preference for less dense, single-family houses in most major markets across the English-speaking world.

    Limits on the kind of residential living most people prefer inevitably raises prices. As the Demographia study shows, the highest rise in prices relative to incomes generally has taken place in wherever strong growth controls have been imposed by local authorities.

    Perhaps the poster child for “smart growth” has been the U.K. Long before the climate change debate, both of England’s major parties embraced the notion of strict constraints on suburban development — not only in London, but across the country. As a result, even places with weak economies are not as affordable as they should be. Liverpool, Newcastle and the Midlands have affordability rates higher than Toronto, Boston, Miami and Portland — and not much lower than those of New York or Los Angeles.

    But the most remarkable impact of “smart growth” policies has been in Australia, which once had among the most affordable housing prices in the English-speaking world. Houses in Sydney and Melbourne, for example, are now less affordable than in London or San Francisco.  Even secondary markets like Adelaide and Perth are more expensive than Toronto, New York, Los Angeles or Chicago. Most recently these policies have even caught the attention of the OECD, which linked overly regulated housing markets not only to the Great Recession, but to a continued slow economic recovery.

    Compared with the U.K. and Australia, the U.S. housing market is more hopeful, with a host of regions — notably Houston, Dallas, Austin, San Antonio, Phoenix and Kansas City — with affordability rates around three and under. Low prices by themselves, of course, are no guarantor of success; in economically challenged places like Detroit and Cleveland, out-migration and high unemployment have driven prices down.

    But in many, if not most, cases affordability has promoted economic and demographic growth.  Generally speaking, affordable markets tend to draw migrants from overpriced ones, for example to Houston or Austin from Los Angeles or New York.

    Nor is this necessarily a case of “smart” people heading to dense, expensive cities while the less cognitively gifted head to the low-cost regions — as news outlets like The Atlantic have claimed. In fact, the American Community Survey reveals that between 2007 and 2009 college graduates generally gravitated toward lower-cost, less dense markets — such as Austin, Houston and Nashville — than to the highly constrained, denser ones. Overall  growth in affordable markets — with a ratio of three or four — among college graduates was roughly 5%; in the more expensive places , it was barely 3%.

    How could this be, if everyone with an above-a-room-temperature IQ supposedly favors hip, cool, dense cities? Perhaps it’s because of factors often too small or mundane for urban pundits to acknowledge. Most people, particularly as they enter their 30s, aspire to a middle-class lifestyle — and being able to afford a house constitutes a large part of that.

    So what does this tell us about future growth? Clearly affordability matters. Areas that combine strong income and job growth, along with affordable housing, are poised to do best. This will be particularly true once the economy recovers and a new generation of millennial buyers, entering their 30s in huge numbers over the next decade, start their search for a place where they can settle down and start raising families.

    This piece originally appeared in Forbes.

    Joel Kotkin is executive editor of NewGeography.com and is a distinguished presidential fellow in urban futures at Chapman University, and an adjunct fellow of the Legatum Institute in London. He is author of The City: A Global History. His newest book is The Next Hundred Million: America in 2050, released in February, 2010.

    Photo by Je Kemp

  • The Next Urban Challenge — And Opportunity

    In the next two years, America’s large cities will face the greatest existential crisis in a generation. Municipal bonds are in the tank, having just suffered the worst quarterly performance in more than 16 years, a sign of flagging interest in urban debt.

    Things may get worse. The website Business Insider calculates that as many as 16 major cities — including New York, Los Angeles, Chicago and San Francisco — could face bankruptcy in the next year without major revenue increases or drastic budget cuts. JPMorgan Chase’s Jamie Dimon notes that there have already been six municipal bankruptcies and predicts that we “will see more.”

    Big cities face particularly steep challenges. Many, notes the Manhattan Institute’s Steve Malanga, have extraordinarily generous compensation systems for their public employees. New York City, for example, owes nearly $65 billion in municipal debt, as well as a remarkable $122 billion for unfunded pension obligations.  President Barack Obama’s hometown of Chicago has it even worse: Its total public pension liability adds up to roughly $42,000 per household.

    This all should give some pause to the relentless hoopla about the country’s supposed “urban renaissance.” The roots of the current economic crisis lie deep in urban economies, where employment growth that has lagged even in good times.  During the last economic expansion, urban job growth was roughly one-sixth that of suburbs and one-third that of smaller communities.

    Population flows are also less favorable than commonly perceived.  Even since the onset of the Great Recession, the vast majority of urban regions have seen population continue to grow more robustly in the suburbs than in the urban core. Similarly, the largest increases in the much-coveted educated population continue to be in smaller, less dense urban areas such as Raleigh-Durham, Austin and Nashville and away from the largest, densest regions such as New York or Los Angeles.

    True, many cities now boast more residential complexes, often built from abandoned office and industrial space, but there are few new office towers outside the public sector. Stadiums, convention centers, luxury hotels and other ephemera may gain public notoriety, but they have done little to boost the private sector economic base  as can be seen in the lack of growth in places like downtown Cleveland, Detroit and Baltimore. In contrast, job growth has flourished  in low-density regions in suburban rings, particularly in fast-growing metropolitan regions of the South , particularly in Texas and Intermountain West locales such as Salt Lake City.

    Initially, the Great Recession was widely held to have reversed this pattern. As private sector growth retrenched, companies pulled out of newer offices in suburbia, sometimes consolidating in downtown office. The Bush-Obama stimulus also bailed out the two sectors — finance and government — that drive employment in most inner cities. Meanwhile, suburbs, with their collections of small companies that have little political heft and depend more on home construction, suffered greater drops in occupancies.

    This urban tilt was, until recently, reinforced by political trends. After the 2008 election urban interests had secured a degree of political power unprecedented in recent history. The White House was occupied by a confirmed urbanite who found suburbs “boring” and had little connection with small town residents. The president stocked his EPA, Housing, Transportation and Education bureaucracies with pro-urban advocates who shared his vision to re-densify a country that has been steadily dispersing for half a century.

    At the start of the Obama presidency virtually every critical committee post in the House was controlled by urban Democrats led by Speaker Nancy Pelosi — such old lions as Henry Waxman, Barney Frank and Charles Rangel. In concert with an urban-focused White House, they constructed a stimulus tilted toward key urban interests: public employees, large universities, mass transit and high-speed rail systems.

    Now the cities’ political ascendency has come to an end. Suburban and small town voters, who represented a large majority of the electorate, shifted heavily the November toward the GOP. Unlike the city-focused old Congress, the new GOP dominated House’s primary loyalty is to the metropolitan periphery as well as smaller cities and towns.

    This shift will affect big cities across the country. Urban land speculators counting on a national  high-speed rail speed  and expanded rail transit networks to boost central cores now face a Congress more concerned with roads than ultra-expensive new trains. You can also forget the hundreds of millions ascribed for “smart growth” plans, which, in essence, seek to direct development and housing towards high-density urban areas.

    Even more serious for cities will be the fiscal fallout from the new order in Washington. Pushed by the Tea Party base, the GOP-led Congress will unlikely provide bailouts to fiscally challenged states and cities. This will hit those big cities — New York, Los Angeles, San Francisco and Chicago, –  located in heavily indebted states — New York, California and, arguably the worst of the pack, Illinois — the hardest.

    There is widespread concern, bordering on panic, about how potential cutbacks in state spending could further savage already strapped city budgets. In California, for example, Governor Jerry Brown’s proposed scaling back of state redevelopment funds was described in the Los Angeles Downtown News as a “budget bomb” for the city’s widely hyped but already tottering downtown renaissance.

    Yet these challenges also present an opportunity for cities. As one prominent urban booster, Brookings’ Chris Leinberger, has pointed out in a recent radio interview (KPCC-FM-NPR), many of the nation’s cities no longer require the assistance deemed necessary back in the ’60s and ’70s. As they have developed somewhat stronger downtown cores, lowered crime rates and reduced “white flight,” the stronger urban cores are better positioned now, though perhaps less so than the boosters believe,  to succeed on a market-oriented basis.

    Even setbacks, like the largely failed condo boom, can turn into an advantage. No longer commanding high prices from the never-quite-materialized hordes of affluent “empty nesters,” the new units could provide a stock of lower-cost housing for the younger, educated and childless demographic attracted to urban core. Although most millennials consider suburbs their ultimate destination, a sizable number, roughly one in five, rank an urban center as their “ideal” location.

    Cities need to break their reliance on outside help from a country that is, for the most part, not dense or urban. Future urban progress cannot rely on Washington’s largesse or diktats. Instead cities need to focus on how to create a greater competitive advantage in the demographic and employment marketplace. Rather than obsessing over government-driven employment, they have to create conditions that will lead to job creation in the private sector, particularly from the oft-neglected and usually politically impotent small business sector.  These include such things as relaxing some regulations, including taxes on home-based businesses, incubator centers and more consistent standards on building construction.

    City governments will need to shift their priorities away from ephemera and concentrate on such basics as improving schools, promoting entrepreneurial growth and nurturing sustainable middle class neighborhoods. The current shift in political power away from cities may be painful at first, but it could prove the elixir that will turn the urban renaissance fantasy into something closer to reality.

    This piece originally appeared in Forbes.

    Joel Kotkin is executive editor of NewGeography.com and is a distinguished presidential fellow in urban futures at Chapman University, and an adjunct fellow of the Legatum Institute in London. He is author of The City: A Global History. His newest book is The Next Hundred Million: America in 2050, released in February, 2010.

    Photo by asterix611