Tag: New York

  • Baseball Goes For Broke

    Other than the banking business, is there an industry more dependent on government handouts, sweetheart tax breaks, and accounting gimmicks than major league baseball?

    What other than a baseball depletion allowance explains the economics of a team like the New York Yankees, which is paying Alex Rodriguez $275 million over ten years while building a new $1.3 billion stadium and charging front row season tickets holders $800,000 for a box of four seats?

    If the rules of baseball included free enterprise, the Yankees would be playing on a diamond in Central Park, and skyboxes (which would not be deductible business expenses) would be limited to nearby apartment buildings.

    What accounts for all the growth in baseball economics — the salaries, the extortionate ticket prices, the new stadiums — is that the game varies little from some nineteenth century oligopoly trust, not unlike J.P. Morgan’s railroads or Andrew Carnegie’s steel mills.

    Let’s start with the basics: Since 1922, baseball has enjoyed anti-trust exemption, which means that league owners (best understood as robber barons) cannot move teams about willy-nilly. At the same time, the law makes it nearly impossible for competitors to establish rival competing franchises.

    The Yankees coughed up $1.3 billion for their new Yankee Stadium (of which local and state government are in for about $520 million) with the knowledge that neither the Royals nor the Pirates are allowed to move their home games to the Bronx or Brooklyn.

    The reason state and municipal governments — not just in New York, but all over the country — put taxpayer money into stadium white elephants is because voters identify more passionately with their professional teams than they do with their local politicians. Imagine the vote in New York if the choice was between Derek Jeter and Governor David Patterson?

    Just because modern baseball is fixed with more precision than the 1919 World Series was does not mean that the game (or at least a number of its teams) will not someday go bankrupt.

    Anti-trust exemptions, Tammany Hall municipal bond financings, and incestuous cable franchise awards may explain why teams like the New York Mets feel that they can spend $12 million a year on pitcher Oliver Perez. But it does not mean that they will be able to cover their obligations when the economy goes O-for-August (as once happened to Darryl Strawberry).

    To best understand baseball economics, think of the sport as similar to the investment banking business: a few large market firms (that have monopoly pricing power and cozy government relations) and then a lot of boutique establishments betting the franchise on some out-of-the-money option (Milton Bradley, Alfonso Soriano, and Alex Rios come to mind). The 2009 payroll for the Yankees is $201 million; for the Florida Marlins, it’s $36 million.

    To close the gap between rich and poor teams, municipalities from Philadelphia ($173 million) to Seattle ($392 million) have subsidized new stadiums, on the hope that sky-boxed, sellout crowds will allow team owners, usually mayoral pals, to pay for free agents. In turn, winning teams are to do for the local economy what the stimulus money may fail to achieve, namely, provide faith in the political system and interest cover for outstanding municipal bonds.

    Keep in mind that the baseball season is shorter than that for gladiolas. Many teams are out of the playoffs by July 4th, which means that the big, revenue-paying crowds must be attracted in the first three months of the season…when Kansas City fans still believe that they have a chance. Not long ago a double header between the Reds and Pirates started and ended with about seventy-five, yes that’s 75, fans in the stadium.

    Is it any wonder that the players union and many team managements, the Yankees included, turned a blind eye to steroids in order to pump up their products? In banking, executives went into sub-prime, hedge funds, and pyramid schemes to cover their bonuses. In baseball, the clear and the cream explain how the owners figured they would be able to afford the likes of Manny Ramirez.

    No one quite knows the precise debt figures of major league baseball, but the liability side of the balance sheet looks something like this: the league itself funds money-losing teams with a revolving line of credit, drawn against anticipated television rights. That’s like borrowing against next year’s equity in a house that has yet to be built.

    As for team debts, some franchises backload free agent contracts in order to defer liabilities until a new general manager may be on the job or the team has won a wild card game. Plus many teams have huge debts on new stadiums and skyrocketing payrolls. Even the Detroit Tigers, who play in a ghost town, run up $115 million per year.

    By my calculations, the Tigers would have to attract an average of about 40,000 fans per game, paying $35 a ticket, just to break even. In 2008, they averaged 25,000 fans a game, and I bet a lot of the unemployed autoworkers who attended didn’t pay $35 a ticket. Some of the debt service for the new Detroit stadium needs to be covered with casino money from an Indian reservation. (Pete Rose’s problem was that he played in casinos but did not own one.)

    To be sure, the plug figures in major league baseball’s finances are the local and national television contracts, not to mention the intramural luxury tax that has rich teams helping out the poor. National television revenue amounts to about $400 million per year, much of which is shared with the teams. That’s another attraction of anti-trust exemption; it limits supply. Why share the pie with, say, a hundred owners?

    Total revenue in the sport is about $6 billion, or an average of $200 million per major league team. Overall, baseball economics would work only if fans were prepared to spend $200 per game on warm beer and cold hot dogs, and renew cable television subscriptions to get games that have little meaning after July.

    The model is also predicated on the assumption that corporations can write off $800,000 in season ticket subscriptions, that the Internet does not blow away TV ads, and that Mariners fans will show up in September to watch their $99 million team wallow 10 games out of first place.

    If I had to bet on an MLB franchise going broke, my action would be on the Mets, who after all play in the House That Sub-prime Built, “Citi Field.”

    Not only did the owners, the Wilpon family, bet the ranch with Bernie Madoff, but they also spent $850 million on the new ballpark, and $25 million (over four years) on the likes of second baseman Luis Castillo. Attendance is down about 20 percent from 2008, and that’s before the team collapsed in the standings or bankrupt ex-Met Lenny Dykstra started sleeping in his car.

    Of course, baseball is no more exposed to the vagaries of the free market than is the banking business. Federally-funded banks, for example, can discount government-granted cable contracts, and pump money into the sport. Or a city like Washington can bailout another failing franchise, as it did with the Expos, and tax dollars can build a second $611 million stadium near the Potomac.

    Anti-trust exempted owners can even mothball a few teams (as they tried to do to the Twins a few years back), and boost the revenue share in that manner. Think of Commissioner Bud Selig’s office as a variant on the Texas Railroad Commission.

    Nevertheless, financial failure is nothing for baseball to dread. The only reason the Yankees could acquire Babe Ruth from the Red Sox in 1919 is because the Boston owner needed cash to invest in the Broadway show, “No, No, Nanette.” Maybe if they are squeezed, the Wilpons can swap Oliver Perez for some of their Madoff paper? At the very least they could get behind the sure hit, “Bye, Bye, Bernie.”

    Matthew Stevenson was born in New York, but has lived in Switzerland since 1991. He is the author of, among other books, Letters of Transit: Essays on Travel, History, Politics, and Family Life Abroad. His most recent book is An April Across America. In addition to their availability on Amazon, they can be ordered at Odysseus Books, or located toll-free at 1-800-345-6665. He may be contacted at matthewstevenson@sunrise.ch.

  • Rome Vs. Gotham

    Urban politicians have widely embraced the current concentration of power in Washington, but they may soon regret the trend they now so actively champion. The great protean tradition of American urbanism – with scores of competing economic centers – is giving way to a new Romanism, in which all power and decisions devolve down to the imperial core.

    This is big stuff, perhaps even more important than the health care debate. The consequence could be a loss of local control, weakening the ability of cities to respond to new challenges in the coming decades.

    The Obama administration’s aggressive federal regulatory agenda, combined with the recession, has accelerated this process. As urban economies around the country lose jobs and revenues, the D.C. area is not merely experiencing “green shoots” but blossoming like lilies of the field.

    To be sure, the capital region has been growing fat on the rest of America for decades, but its staggering success amid the recession is remarkable. Take unemployment: Although the district itself has relatively high rates, unemployment in Virginia and Maryland – where most government-related workers live – has remained around 7% while the nation’s rate approaches 10%.

    The reason is obvious: an explosion of government amid a decline in the private sector. Factories may be closing in Michigan, tech jobs and farms may be disappearing in California, but the people who grease the skids of the ever-expanding federal machine seem to be doing just fine.

    This is most evident at the top of the job market. The capital region now boasts the healthiest technology employment picture in the nation. Virginia has the highest proportion of tech workers in the nation. Maryland ranks fifth, and the district itself is seventh.

    The area also continues to enjoy continued growth in the lucrative professional and business service jobs category. Over the past year, according to latest estimates by www.jobbait.com, the D.C. area was the only region in the nation to enjoy growth in this field.

    Signs of Washington’s ascent abound. The local real estate market appears to be on the mend even as others suffer continued strong declines in values and rising foreclosures. Hotel prices, dropping virtually everywhere else, look to be rising as well.

    Occupancy rates, falling in most places, actually increased during the first half of 2009, as did revenues, which have taken a nosedive elsewhere. In New York prices have plunged – even the mighty Waldorf has been slashing rates.

    In many ways, the economic disasters in New York and other cities have proved a boon for Washington. Wall Street’s demise, for example, has been D.C.’s gain as the locus of financial power leaves New York for the Treasury, Fed, White House and the finance-related congressional committees. K Street is the new Wall Street, where you play for the really big stakes.

    This shift may soon spread beyond the financial sector. Want to get into the energy business? You can bypass Houston and head to the Energy Department and Environmental Protection Agency – they are the ones handing out subsidies and grants to “deserving” applicants. Thinking of expanding your city to accommodate new middle-class families? The people at the Departments of Transportation and Housing and Urban Development have their own ideas on how your cities and regions should grow.

    Manufacturing might be important to your economy, but Washington – a region with virtually no history of productive industry – generally regards factories as polluters, greenhouse gas emitters and labor exploiters. If you have enough lobbyists you might be able to hang on, but don’t really expect much in the way of positive help.

    Some “progressives” may like this model – after all, it originated in Europe, the supposed fount of all that is enlightened. Since the 18th century, Europe’s urban history has been largely dominated by great imperial centers – London, Paris, Moscow and Berlin – that treat other cities like something akin to poor relations.

    Even today European cities and localities tend to have far less control over their destiny than in the U.S. Zoning, planning decisions and even economic strategy often originate from the center, as does the power to tax and spend. For decades, Europe’s legacy of ancient urban privilege – so critical in emerging out of the dark ages – has ebbed before the increasing power of the national capitals. More recently the super-capital of Brussels, like Washington, thrives in hard times that are decimating other European urban economies.

    The great European capitals rose largely because they also served as the domicile of princes, bureaucrats and, until recent times, the clerical establishment. Other cities might have enjoyed a boom – such as Manchester during the industrial revolution – but, ultimately, hierarchy served to concentrate power in the great capital cities.

    In contrast, American cities and communities traditionally have retained control over planning, development and other critical growth factors. Equally important, American cities, noted the great sociologist E. Digby Baltzell, were not dominated by aristocracy but were “heterogeneous from top to bottom.” Urban growth came primarily not by central design but as a result of the often ruthless schemes and lofty aspirations, often ruthlessly expressed, of local political and business leaders.

    For example, the quintessential American city, New York, started as a commercial venture. As early as the mid-17th century 18 languages were spoken on Manhattan Island (population of 1,000) and numerous faiths practiced. In early New Amsterdam, the counting house, not the church or any public building, stood as the most important civic building.

    Even after the Dutch were pushed out by the more powerful British military, the bustling island city – renamed New York – retained its fundamentally commercial character. It served briefly as the nation’s capital, but its power grew from its port and its immigrants. The city’s entrepreneurial spirit and social mobility startled many Europeans. As the French consul to New York complained in 1810, “The inhabitants…have in general no mind for anything but business. New York might be described as a permanent fair in which two-thirds of the population is constantly being replaced; where huge deals are being made, almost always with fictitious capital; and where luxury has reached alarming heights.”

    This entrepreneurial pattern also drove the growth of New York’s many competitors – first the great industrial cities such as Cleveland, Chicago and Detroit and, later, West Coast metropolises like Los Angeles, the San Francisco Bay area and Seattle. More recently, there has been a similar spectacular rise of formerly obscure places like Dallas, Houston, Atlanta and Miami.

    Through much of this time Washington barely registered among the ranks of American urban centers. Despite early expectations that Washington would become “the Rome of the New World,” it lagged behind other American cities through much of the 19th century. The city was widely reviled as a fetid, swampy place with atrocious cuisine – hog and hominy grits were its staples – that offered little in the way of commerce, industry or culture. Even its great buildings were compared to “the ruins of Roman grandeur.”

    The First World War, the Depression and then the Second World War each boosted Washington’s status but hardly into the first rank of cities. Few entrepreneurs were attracted to a city dominated by regulators, clerks and lawyers. The cultural center lay in New York and Boston – and later Los Angeles. The Bay Area, Massachusetts and later Texas evolved into the primary technological centers.

    Not until the 1960s did Washington begin to emerge as something like a traditional national capital, with a large permanent population of well-educated and cultured citizens as well as a robust economy based on the defense industry and the expanding welfare state.

    But the financial crisis of 2008 has set the stage for an unprecedented growth of the region, with a Democratic president and majority seemingly determined to expand federal mandates into every crevice of community life. There is an eagerness to use federal authority in unprecedented ways that could bring federal influence into virtually every minute decision made in an urban area.

    This concentration of power is also bad news for urban economies, including New York’s. As New York University’s Mitchell Moss has observed, Gotham may be losing its perch as the true national financial center. But other cities also should take note of the trend. Polycentric sprawling cities like Los Angeles, Dallas, Houston, Phoenix and Atlanta soon may find themselves forced to reorganize themselves along lines preferred by federal urban “experts.” Hard-pressed industrial cities may find new environmental restrictions on ports and other key infrastructures an impediment to a much-needed renaissance.

    American cities are at a critical moment. Our competitive, commercial urban tradition certainly has its flaws, but it also has produced the advanced world’s most dynamic roster of modern cities and regions. Ceding the power of urban planning to Washington will cripple the American city – except, of course, for the one that reigns as locale for imperial control.

    This article originally appeared at Forbes.

    Joel Kotkin is executive editor of NewGeography.com and is a presidential fellow in urban futures at Chapman University. He is author of The City: A Global History. His next book, The Next Hundred Million: America in 2050, will be published by Penguin early next year.

  • California Wastes Its Public Space

    California’s favorable climate makes it a haven for outdoor activity. Enlightened and forward-looking planning has largely preserved the waterfronts for public access and set aside a lot of space for public use and activity. Yet despite this, there are few great urban gathering spaces. This is most obvious in the two largest population centers – Los Angeles and San Francisco.

    As a result, potentially great urban districts are dragged down by a dearth of desirable activity, something exacerbated by an already damaging real estate slump. Although all is not lost in these cities, some of the most high profile public spaces fail to attract large numbers of visitors on a daily basis, particularly when no special events are planned.

    Pershing Square, Los Angeles – Located in the heart of downtown, Pershing Square is poorly designed, both as its own project and in a contextual sense. In an already warm climate made even hotter by its CBD location, there is too much hardscape. Extensive softscape, whether flowers, grass, and/or trees, would provide a cooling effect. There are also too many symbolic structures serving no purpose. These are expensive to install and maintain; they provide very little benefit. Also, an already bad relationship to the street was made worse by restricting access points and hiding the interior space. Although some changes over the past several years have softened the space somewhat, it still lacks some basic creature comforts, such as adequate lighting and clean restrooms, to make it a daily destination for the scores of office workers within easy walking distance.

    County Mall, Los Angeles – County Mall, located west of Los Angeles City Hall between Broadway and Grand Avenue, is in the unenviable position of being relatively unknown. Poor graphics and signage do little to improve its profile. Although there was extensive softscape in the design, many of the original shrubs and flowers have eroded. Further, the large space is not properly organized to allow and encourage different types of activity. Adjacent uses alone are not enough to sustain the park. Unlike in Pershing Square, the design here is not the primary issue. Instead, more programming and better maintenance would make County Mall successful, and provide for a dramatic promenade connecting City Hall and the Los Angeles Music Center.

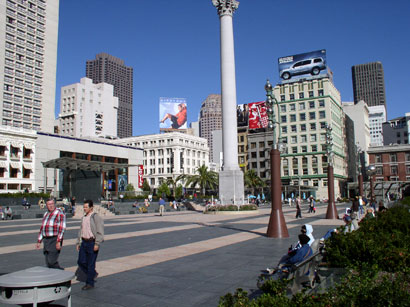
    Union Square, San Francisco – Despite an expensive redesign nearly five years ago, Union Square is still not the central urban gathering space for San Francisco. Although it does serve as an incidental focus of pedestrian activity within the immediate neighborhood, the primarily hardscaped design is too fussy and too formal to encourage casual passive use and extended stays, except, perhaps, within limited zones at the fringes. The little available seating is poorly designed, intended to prevent homeless use rather than to promote use by casual park visitors. Primarily a concrete space with grass at the corners, Union Square lacks the “warmth” that makes such spaces comfortable. Imagine a Union Square with a great lawn in the middle, rather than cold (and expensive) hardscape.

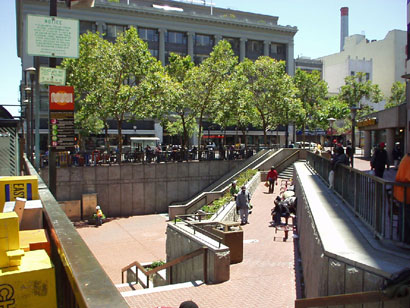
    Market Street, San Francisco – Punctuated by intermittent triangular plazas along most of its downtown stretches, portions of Market Street’s public space are more the domain of homeless panhandlers than workers, residents, strollers, and the like (it should be noted, however, that some parts of Market Street, such as in the Financial District, can be pleasant at times). The plazas, quality architecture, and mix of uses create potential. But the pedestrian environment discourages extended dwell times, except by the homeless, panhandlers and drug dealers, many of whom, the city has documented, commute daily to Market Street from elsewhere in the Bay Area. The design offers little in the way of seating options and softscape. Sanitation and maintenance need to be substantially upgraded and programming is needed.

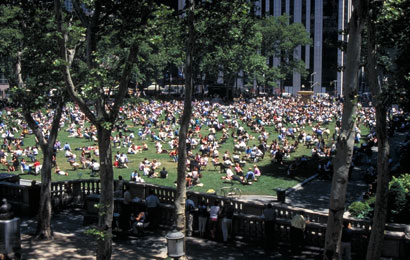
    Proper seating, adequate lighting, and extensive horticultural displays would serve to populate these public spaces. Proper management and maintenance would ensure long-term success. Places such as Bryant Park in Midtown Manhattan, itself the beneficiary of a remarkable turnaround masterminded by Daniel Biederman of the Bryant Park Restoration Corporation, have shown what visionary management can do to struggling urban public spaces. [Kozloff worked for BRV Corp., Biederman’s private consulting company that is independent of the Bryant Park Restoration Corporation, from 2001-2004.] Although once run on a city budget of $200,000, Bryant Park is now managed on a privately-funded budget. Biederman turned Bryant Park – once the domain of drug dealers and other such undesirables – into Manhattan’s premier address without using public coffers.

    Given the warm weather, long growing seasons, and urban renaissance occurring in adjacent portions of Los Angeles and San Francisco, even in the midst of our current downturn, there are opportunities to improve the public realm so that it serves its intended purpose, including boosting civic pride and, in turn, encouraging public stewardship. And, these improvements could be made without costly redesigns and extensive capital construction. Urban environments do not need places that drain public funds and then are shunned by the citizenry; there are enough other issues for urban mayors to deal with. Great cities need comfortable and inviting gathering places that both anchor and bolster civic pride, and simultaneously provide backdrops for special events and day-to-day activity.

    Howard Kozloff is Manager of Development Strategies and Director of Operations at Hart Howerton, an international strategy, planning and design firm based in New York, San Francisco and London. Kozloff is also a lecturer on Urban Real Estate Markets at the University of Pennsylvania.

  • Why The ‘Livable Cities’ Rankings Are Wrong

    Few topics stir more controversy between urbanists and civic boosters than city rankings. What truly makes a city “great,” or even “livable”? The answers, and how these surveys determine them, are often subjective, narrow or even misguided. What makes a “great” city on one list can serve as a detriment on another.

    Recent rankings of the “best” cities around the world by the Economist Intelligence Unit, Monocle magazine and the Mercer quality of life surveys settled on a remarkably similar list. For the most part, the top ranks are dominated by well-manicured older European cities such as Zurich, Geneva, Vienna, Copenhagen, Helsinki and Munich, as well as New World metropolises like Vancouver and Toronto; Auckland, New Zealand; and Perth and Melbourne in Australia.

    Only Monocle put a truly cosmopolitan world city – Tokyo – near the top of its list. The Economist rankings largely snubbed American cities – only Pittsburgh made it anywhere near the top, at No. 29 out of 140. The best we can say is most American cities did better than Harare, Zimbabwe, which ran at the bottom. Honolulu got a decent No. 11 on the Monocle list and broke into the top 30 on Mercer’s, as did No. 29 San Francisco. But regarding American urban boosters, that’s all, folks.

    To understand these rather head-scratching results, one must look at the criteria these surveys used. Cultural institutions, public safety, mass transit, “green” policies and other measures of what is called “livability” were weighted heavily, so results skewed heavily toward compact cities in fairly prosperous regions. Most of these regions suffer only a limited underclass and support a relatively small population of children. In fact, most of the cities are in countries with low birthrates – Switzerland’s median fertility rate, for example, is about 1.4, one of the lowest on the planet and a full 50% below that of the U.S.

    These places make ideal locales for groups like traveling corporate executives, academics and researchers targeted by such surveys. With their often lovely facades, ample parks and good infrastructure, they constitute, for the most part, a list of what Wharton’s Joe Gyourko calls “productive resorts,” a sort of business-oriented version of an Aspen or Vail in Colorado or Palm Beach, Fla. Honolulu is an exception, more a vacation destination than a bustling business hub.

    Yet are those the best standards for judging a city? It seems to me what makes for great cities in history are not measurements of safety, sanitation or homogeneity but economic growth, cultural diversity and social dynamism. A great city, as Rene Descartes wrote of 17th century Amsterdam, should be “an inventory of the possible,” a place of imagination that attracts ambitious migrants, families and entrepreneurs.

    Such places are aspirational – they draw people not for a restful visit or elegant repast but to achieve some sort of upward mobility. By nature these places are chaotic and often difficult to navigate. Ambitious people tend to be pushy and competitive. Just think about the great cities of history – ancient Rome, Islamic Baghdad, 19th century London, 20th century New York – or contemporary Los Angeles, Houston, Shanghai and Mumbai.

    These represent a far different urbanism than what one finds in well-organized and groomed Zurich, Vienna and Copenhagen. You would not call these cities and their ilk with metropolitan populations generally less than 2 million, “bustling.” Perhaps a more fitting words would be “staid” and “controlled.”

    Peace and quiet is very nice, but it doesn’t really encourage global culture or commerce. Growth and change come about when newcomers jostle with locals not just as tourists, or orbiting executives, but as migrants. Great cities in their peaks are all about this kind of yeasty confrontation.

    Alas, comfort takes precedence over dynamism in these new cities. Take the immigration issue: Unlike Amsterdam in its heyday or London or New York today, most northern European countries have turned hostile to immigration and many have powerful nativist parties. These are directed not against elite corporate executives or academics, but newcomers from developing countries. In some cases, resentment is stoked by immigrants taking advantage of well-developed welfare systems that worked far better in a homogeneous country with shared attitudes of social rights and obligations.

    Of course, these cities aren’t total deadweights. After all, Switzerland has its banks, Helsinki boasts Nokia and Denmark remains a key center of advanced and green manufacturing technology. For its part, Vancouver gets Americans to shoot cheap movie and TV shows with massive tax breaks and will host the Winter Olympics. But none can be considered major shapers of the modern world economy.

    The one American city favored by The Economist, Pittsburgh, represents a pale – and less attractive – version of these top-ranked European, Canadian or Australian cities. Its formerly impressive array of headquarters has shrunk to a handful. Once the capital of steel, it now pretty much depends on nonprofits, hospitals and universities.

    You will be hearing a lot more about Pittsburgh – the city has a prodigious PR machine funded largely by nonprofit foundations and universities – as it gets ready to host the G-20 meeting next month. Fans claim that the former steel town has developed a stable – if hardly dynamic – economy. Its torpidity is being sold a strength; boom-resistant in the best of times, it’s also proved relatively recession-proof as well.

    In this sense, Pittsburgh represents the American model of the slow-growth European city. This may appeal to those doing quality-of-life rankings, but not to those who have been fleeing the Steel City for other places for generations. Immigrants are hardly coming in droves either – Pittsburgh ranks near last among major metropolitan areas in percentage of foreign-born residents. As longtime local columnist and resident Bill Steigerwald notes, since 1990 more Pittsburghers have been dying than being born. If this represents America’s urban future, perhaps it’s one that takes its inspiration from Alan Weisman’s “A world without us.”

    Yet the future of urbanism, here and abroad, will not be Pittsburgh. Based on current preferences, something like 20 million – or more – people will have moved to U.S. cities by 2050. Most will likely settle in more dynamic places like New York, Los Angeles, Houston, Phoenix, Dallas, Chicago and Miami. These cities have become magnets for restless populations, both domestic and foreign-born. They also contain all the clutter, constant change, discomfort and even grime that characterize great cities through history.

    But it’s economics that drives migrants to these dirtier, busier metropolitan centers. Many of the cities at the top of the livability lists, by contrast, are also among the world’s most expensive. They generally also have high taxes and relatively stagnant job markets.

    Many U.S. cities, however, offer far more materially to their average residents than their elite European counterparts do. American cities, when assessed by purchasing-power parity, notes demographer Wendell Cox, do very well indeed. Viewed this way, the U.S. boasts eight of the top 10 – and 37 of the top 50 – metropolitan regions in terms of per capita income.

    The top city on Cox’s list, San Jose, Calif., epitomizes both the strengths and weaknesses of the American city. The heartland of Silicon Valley, the San Jose region has generated one of the world’s most innovative – and well-paid – economies. On the other hand, its mass transit usage is minuscule, its cultural attributes measly and its downtown hardly a tourist destination.

    Meanwhile, pricey and scenic Zurich, No. 2 on the Mercer list and No. 10 on The Economist rankings, comes in 74th when considering adjusted per capita income. Economist favorite Vancouver, one of the most expensive second-tier cities on the planet, ranks 71st. For the average person seeking to make money and improve his or her economic status, it usually pays not to settle in one of the world’s “most livable” cities.

    This is not to say that rambunctious urban centers like Los Angeles, New York or London couldn’t learn from their more “livable” counterparts. Anyone who has braved the maddening crowds in Venice Beach, Times Square or London’s Piccadily knows a city can have too much of a good thing. Los Angeles could use a more efficient bus system. Better-maintained subways and commuter trains in New York would be welcome by millions as they would in Greater London.

    Ultimately great cities remain, almost by necessity, raw (and at times unpleasant) places. They are filled with the sights and smells of diverse cultures, elbowing streetwise entrepreneurs and the inevitable mafiosi. They all suffer the social tensions that come with rapid change and massive migration. New York, Los Angeles, London, Shanghai, Mumbai or Dubai may not shoot to the top of more elite, refined rankings, but they contain the most likely blueprint of our urban future.

    This article originally appeared at Forbes.

    Joel Kotkin is executive editor of NewGeography.com and is a presidential fellow in urban futures at Chapman University. He is author of The City: A Global History. His next book, The Next Hundred Million: America in 2050, will be published by Penguin early next year.

  • New York City Closes Shop

    Mayor Michael Bloomberg owes 200,000 small business owners an apology.

    When Michael Bloomberg was first elected Mayor of New York City in 2001, the city’s small business owners were hopeful and confident that finally a successful businessman would be creating the city’s economic policy. They hoped to see an end to powerful special interests that, through political donations, had gained control over the economic policy of the city.

    New York’s small business community had been in a state of crisis ever since former Mayor Ed Koch gave the keys to the city and opened all the city’s government doors to real estate speculators and developers. His economic policy of favoring only a handful of developers and real estate speculators resulted in tens of thousands of long established small businesses being forced to close. New York City had the worst anti-small business environment in the nation, and the July, 1986 Inc. magazine headline said it all, “New York, New York the Worst Place in America to Start a Business.” This anti small business environment continued under two more Mayors, David Dinkins and Rudy Giuliani. It would be up to Bloomberg to change course and save the city’s small businesses from the “death grip” that landlords had on them.

    The small business community anticipated that Bloomberg’s first change would be to appoint a small business owner as Commissioner of Small Businesses. The best choice would be a Hispanic business person with no ties to the real estate industry. This would be a major change in policy because previous policy makers were closely tied to the real estate industry, and none had ever owned a small business. A Hispanic Commissioner would be justified because Hispanics owned between 42 and 45% of all the city’s small businesses.

    To the disappointment of the city’s desperate small business owners, Bloomberg appointed Robert Walsh Commissioner of Small Businesses. Walsh had never owned or operated a small business. He was in North Carolina at the time of his selection, managing the Charlotte Center City Partners, a property owners/banks organization promoting a business district in that city. His background included working for the property owners as director of a Business Improvement District, the Union Square Partnership, in New York City. Walsh’s selection would create the worst anti-small business environment of any city in the nation.

    A reliable way to evaluate the stability of New York City’s small business community is to examine the number of Commercial Warrants for Eviction. The majority of these warrants are issued to “holdover commercial tenants” whose leases have expired, and who can’t afford to pay the new, higher rent. The consensus of business organizations is that these warrants represent about one third of small businesses; the ones that stay and fight in court. The other two-thirds walk away without a fight. During what many consider the reign of terror for small businesses — 1986-1989, the last 4 years of Koch’s term — 17,433 warrants were issued to evict small businesses, out of approximately 53,000 total small business failures. During the last full four years under Bloomberg, 2005-2008, 27,809 warrants were issued to evict, with about 83,000 small businesses forced to close. Since the successful businessman Bloomberg took office, around 152,964 small businesses have been forced to go out of business.

    The circus is not the greatest show on earth; Walsh’s Small Business Services department is. For the past seven years, on paper, the department has had numerous programs to assist small businesses. If you did not see for yourself the long established neighborhood small businesses that have been forced to close every month, and the empty stores on every block in every neighborhood, you might believe that the SBS was actually helpful. The testimony by Walsh and Bloomberg on the state of the city’s small businesses before the city council is a long list of SBS programs and their successes.

    Two things happened to highlight the true state of NYC’s small businesses. The first was the decline of tax dollars generated by Wall Street. This caused a shift in the focus to NYC’s 200,000 small businesses, which were now called upon to carry more of the tax burden and job creation.

    The second was a survey of Hispanic small businesses (see PDF, below). A new Hispanic chamber, the USA Latin Chamber of Commerce, was recently formed in New York City and conducted a citywide survey of 938 Hispanic business owners in early 2009. Over half of the businesspeople believed they were at risk to close due to high rents. Seventy percent had been forced to lay off workers due to high rents. When they first opened their businesses in NYC, 91% believed it was the best city in the nation to invest in the American Dream. Today, 84% believe New York City is no longer a good place for immigrants to open their businesses. The main reason given, again, high rents and unreasonable lease terms. Of those surveyed, 82% would not recommend to a friend or family to open a business in the city.

    One of the survey’s biggest surprises concerned demands by landlords or agents for “cash money” under the table to negotiate a new lease; 31% answered yes, and business organizations have come forward to predict that the real figure is between 45-55% of mostly immigrant small businesses. The results confirmed another survey (see PDF, below), this one by the USA Bodegas Assoc., that the city’s small businesses were in a “Crisis” and in peril of disappearing completely without government protection.

    Bloomberg did not follow the leadership of President Obama, who called for quick actions to save small businesses. Walsh expanded his “dog and pony show” with a citywide PR campaign which claimed that the city’s small business problems resulted from the recent decline in the economy, and by offering a series of government programs: business conferences, business forums, loan programs, initiatives, all intended to stimulate start-ups and expansions. But at a recent city council hearing, Councilman Robert Jackson asked “Does the SBS have a single program to save or keep a single small business from going out of business in New York City?” Walsh reluctantly had to answer “no”.

    In March, 2009 a coalition of 67 citywide business/union/tenant organizations was formed; The Coalition to Save Hispanic Small Businesses released a final report recommending that the best solutions could be found in Jackson’s Small Business Survival Act. The bill is based upon a simple system of regulating the commercial lease renewal process. It would give tenants the right to renewal, and encourage bargaining in good faith between the landlord and tenant.

    A city council hearing was finally held this past June before the city council’s small business committee. The three SBS representatives took the side of the property owners against the city’s small businesses. They testified that Bloomberg would not support the bill because it would be too costly to administer at a time when funds were scarce. When asked how costly, they admitted they did not do any actual accounting, but thought it would be costly. An attorney for the Small Business Coalition explained that there was no costs associated with administering the bill since it would be a contractual process where costs would be shared equally between the tenant and the landlord.

    SBS also objected that there was no need for the bill since the rental market was weakened by the recession, and landlords were negotiating with tenants to keep them. Supporters explained that the timing was ideal because it would have no impact on those landlords negotiating in good faith.

    During the recent impasse, the SBS spokespeople made clear that they did not wish to seek a compromise or alternative solution. And the apology that Mayor Bloomberg owes to New York City’s hard working small business people is also nowhere to be found on the table.

    Stephen Null was the owner of three small businesses in New York City during the 1970s and ’80s. In 1984 he founded the Coalition for Fair Business Rents, and in 1991 he co-founded the New York Small Business Congress. He is currently Director of the Lead Free Children Foundation.

  • High life on New York’s High Line

    Last month, an old elevated train track on Manhattan’s west side was re-opened to the public as a public park. The High Line was a 1.5-mile stretch of track constructed in the 1930s to carry freight trains. The last train ran on the platform in 1980 and the space has been the subject of battles ever since between park-minded preservationists and residents who wanted to tear down the steel monstrosity with no apparent function.

    It is a great thing the preservationists won. The High Line is a magnificent and inspiring park, a one-of-a-kind public space with views of the Hudson River that shows a great respect for the industrial history of the surrounding uber-hip Meatpacking District. It manages to feel both modern and classic at once, with moveable wooden chez lounges that look like they could belong by the pool at a W Hotel sliding along the original tracks at places. Gardens are planted along the walkway and amidst the old tracks making it a perfect place to stroll, visit and view the west side of the city.

    The first phase of the park runs from Gansevoort Street to 20th Street with the second phase slated to open next year extending all the way to 30th Street. The Promenade Plantee in Paris was the first elevated garden to be transformed into a public space but the bug is catching on and other projects are planned in St. Louis, Philadelphia, Jersey City and Chicago.

    To get to the High Line, get off the subway at the 14th Street and 8th Avenue station and walk west towards the river. You will not be disappointed, even it rains like the day I visited.

  • Tracking Business Services: Best And Worst Cities For High-Paying Jobs

    Media coverage of America’s best jobs usually focuses on blue-collar sectors, like manufacturing, or elite ones, such as finance or technology. But if you’re seeking high-wage employment, your best bet lies in the massive “business and professional services” sector.

    This unsung division of the economy is basically a mirror of any and all productive industry. It includes everything from human resources and administration to technical and scientific positions, as well as accounting, legal and architectural firms.

    Overall there are roughly 17 million professional and business services jobs, 4 million more than manufacturing. This makes it twice as big as the finance sector and five times the size of the much-ballyhooed tech sector. While its average salary – roughly $55,000 a year – is somewhat lower than in those other elite sectors, its wages are still higher than those in all the other large sectors, like health. The sector’s $1 trillion in total pay per year accounts for nearly 20% of all wages paid in the nation; finance and tech together only account for $812 billion.

    More than that, the business and professional services sector has encompassed the fastest-growing part of the high-wage economy. Employment in lower-wage sectors like education has also grown quickly. But employment in other sectors that pay their employees well, such as technology, has remained stagnant; jobs in some, such as manufacturing, have fallen sharply. Critically, the business services sector – particularly at the better-paying end – seems to have weathered the current recession better than these other high-wage sectors.

    The crucial question remains: In what regions is this critical economic cog booming? In a new analysis with my colleagues at the Praxis Strategy Group, we examined Bureau of Labor Statistics employment data for this sector, keeping an eye on trends over both the last year and the last decade. Some of the metropolitan areas that boasted short-term growth in this sector also maintained steady employment success over the long-term, which suggests that these particular cities have sturdy economies that aren’t as prone to intense boom-bust cycles.

    At the top of our list of best places is greater Washington, D.C., and its surrounding suburbs in Virginia and Maryland. Government jobs may drive that economy, but it is the lawyers, consultants and technical services firms who harvest the richest benefits. As New York University public policy professor Mitchell Moss observes, Washington has emerged as the “real winner” in the recession – not just for public-sector workers but private-sector ones too.

    Fastest Growing Professional and Business Services Sectors
    Area Name Jobs in Sector 2009
    (thousands)
    Sector Share of Jobs 2009
    (percent of total)
    Growth 2008 – 2009
    (percent growth)
    Cumulative Growth 2001 – 2009
    (percent growth)
    2001-2009 Job Change (thousands) 2008-2009 Job Change (thousands)
    Northern Virginia, VA 355.2 27.2% 1.5% 22.4% 65.0 5.2
    Washington-Arlington-Alexandria, DC-VA-MD-WV 558.7 23.0% 0.9% 22.8% 103.6 5.1
    Austin-Round Rock, TX 112.4 14.4% 3.3% 18.7% 17.7 3.6
    Houston-Sugar Land-Baytown, TX 382.3 14.7% 0.9% 19.2% 61.5 3.2
    Virginia Beach-Norfolk-Newport News, VA-NC 106.6 14.0% 2.8% 8.0% 7.9 2.9
    Bethesda-Frederick-Rockville, MD 125.7 21.9% 2.1% 9.0% 10.4 2.6
    Wichita, KS 31.5 10.1% 3.5% 16.4% 4.4 1.1
    Chattanooga, TN-GA 25.9 10.6% 4.3% 11.8% 2.7 1.1
    Peoria, IL 23.0 12.1% 4.5% 43.2% 6.9 1.0
    Rochester, NY 61.8 11.9% 1.5% 1.9% 1.1 0.9
    Augusta-Richmond County, GA-SC 31.0 14.5% 3.0% 7.5% 2.2 0.9
    Mansfield, OH 5.1 9.1% 19.4% 4.1% 0.2 0.8
    Kennewick-Pasco-Richland, WA 20.8 22.2% 4.2% 20.2% 3.5 0.8
    St. Louis, MO-IL 195.4 14.6% 0.4% 3.9% 7.4 0.8
    Fayetteville-Springdale-Rogers, AR-MO 33.5 16.2% 2.2% 34.2% 8.5 0.7
    Macon, GA 12.1 11.9% 5.5% 31.2% 2.9 0.6
    Pittsburgh, PA 158.9 13.9% 0.4% 14.5% 20.1 0.6
    Fresno, CA 30.7 10.3% 1.9% 23.3% 5.8 0.6
    Provo-Orem, UT 23.3 12.4% 2.5% 16.7% 3.3 0.6
    Charleston-North Charleston-Summerville, SC 42.2 14.3% 1.3% 31.1% 10.0 0.5

    Over the past year, parts of northern Virginia – ground zero for the so-called “beltway bandits” who work in industries the government depends on to do its job – have enjoyed the fastest growth in business and professional services, adding over 5,200 jobs despite the current downturn.

    Other areas around the nation’s capital have also seen strong growth. The Washington D.C.-Arlington-Alexandria area, for example, came in second on our list, gaining nearly 5,100 positions, while No. 6 the Bethesda-Frederick-Rockville, Md., metro area added 2,600. In addition, yet another Virginia area – No. 5-ranked Virginia Beach-Norfolk-Newport News, a center for military-related industries – gained nearly 2,900 jobs in this sector.

    It’s far too early to thank the free-spending ways of Barack Obama’s administration for all this growth. As anyone can tell you, the Bush White House and its Republican Congress were not exactly models of fiscal restraint. Plus, Washington and Northern Virginia have seen growth in their business services sectors over the last several years, in the period stretching from 2001 to 2009. Together those two metros added over 165,000 new jobs in this critical, high-wage sector.

    Of course, you don’t have to head to Washington to find a high-paying job – although you might not be able to escape unpleasant summer weather. The other major group of business-services hot spots includes Austin, Texas, at No. 3, and Houston, at No. 4. These Lone Star local economies have continued to thrive not only during the current recession but also over the last decade.

    The others winners include farther-afield locales in Kansas, Tennessee, Illinois and New York. These areas could be gaining both from companies seeking to lower costs and from the new capabilities for remote work due to the Internet. Even though they didn’t make our list, a host of smaller communities – like Mansfield, Ohio; Provo, Utah; and Charleston, S.C. – also enjoyed significant growth in the business services sector over the past year.

    So if these are the places where this segment of the economy is growing and high-paying jobs are easier to come by, where is the opposite true? The worst cities on our list span three archetypes: Rust Belt basket cases, Sunbelt flame-outs and expensive big cities. Perhaps the toughest losses were in Michigan: Detroit and the Warren-Troy metro area suffered big setbacks both in the last year and over the last decade.

    Fastest Declining Professional and Business Services Sectors
    Area Name Jobs in Sector 2009
    (thousands)
    Sector Share of Jobs 2009
    (percent of total)
    Growth 2008 – 2009
    (percent growth)
    Cumulative Growth 2001 – 2009
    (percent growth)
    2001-2009 Job Change (thousands) 2008-2009 Job Change (thousands)
    Phoenix-Mesa-Scottsdale, AZ 289.2 16.0% -10.8% 7.9% 21.2 -35.1
    Warren-Troy-Farmington Hills, MI 202.5 18.5% -12.0% -21.2% -54.4 -27.7
    Chicago-Naperville-Joliet, IL 633.6 16.8% -4.1% -2.9% -19.0 -27.0
    Los Angeles-Long Beach-Glendale, CA 574.7 14.3% -4.2% -3.4% -20.4 -25.2
    Atlanta-Sandy Springs-Marietta, GA 390.3 16.4% -5.9% -1.3% -5.1 -24.4
    Orlando-Kissimmee, FL 170.9 16.2% -8.5% 7.7% 12.3 -16.0
    Santa Ana-Anaheim-Irvine, CA 261.9 18.0% -4.7% 4.0% 10.2 -12.8
    Minneapolis-St. Paul-Bloomington, MN-WI 253.4 14.4% -4.6% -4.6% -12.2 -12.3
    Edison-New Brunswick, NJ 164.5 16.3% -6.7% -2.6% -4.4 -11.9
    Detroit-Livonia-Dearborn, MI 108.9 14.7% -9.5% -20.9% -28.8 -11.4
    Indianapolis-Carmel, IN 120.3 13.4% -8.3% 13.6% 14.4 -10.8
    Riverside-San Bernardino-Ontario, CA 133.7 11.2% -6.5% 36.0% 35.4 -9.2
    Tampa-St. Petersburg-Clearwater, FL 223.2 18.5% -3.7% 12.3% 24.5 -8.6
    New York City, NY 595.7 15.8% -1.4% -0.8% -5.1 -8.4
    Newark-Union, NJ-PA 163.5 16.0% -4.7% -0.5% -0.8 -8.0
    Bergen-Hudson-Passaic, NJ 130.6 14.6% -5.8% -9.1% -13.0 -8.0
    Milwaukee-Waukesha-West Allis, WI 107.6 12.9% -6.6% -1.7% -1.8 -7.6
    Miami-Miami Beach-Kendall, FL 139.1 13.4% -4.7% 2.2% 3.0 -6.8
    Oakland-Fremont-Hayward, CA 158.0 15.6% -4.0% -7.1% -12.2 -6.7
    Las Vegas-Paradise, NV 108.2 12.1% -5.8% 38.1% 29.9 -6.6
    Boston-Cambridge-Quincy, MA 308.8 18.2% -2.0% -6.8% -22.5 -6.4
    Sacramento–Arden-Arcade–Roseville, CA 106.1 12.3% -5.6% -1.8% -1.9 -6.3
    Cleveland-Elyria-Mentor, OH 137.8 13.3% -4.3% -5.2% -7.6 -6.1
    Denver-Aurora-Broomfield, CO 207.0 16.9% -2.9% 4.0% 8.0 -6.1

    Consistent job losses in business services in these areas – some 54,000 in the Troy area since 2001 – reveal the clear connection between employment in business services and in the region’s fundamental auto industry. It turns out that elite services often prove dependent on basic industry. When industrial plants shut down, it’s not just blue-collar workers and company executives that suffer; as a result, these firms will use fewer lawyers, accountants, architects and technical consultants.

    A similar picture emerges in cities like Phoenix, which lost about 35,000 business-services jobs in just one year. This loss stems from the collapse of the housing bubble, which powered the rest of the regional economy. The same meltdown caused smaller but still significant reversals in one-time boomtowns like Orlando, Fla., Atlanta and Southern California’s Santa Ana region, which encompasses Orange County, where business service employment dropped by double-digit rates over the past year.

    Yet these same areas should see some recovery, perhaps more so than the traditional auto manufacturing-focused towns. Phoenix, Orlando and other Sun Belt locations – including a host of other areas in Florida – all saw increasing employment in business services over the past decade. If the economy comes back, along with a stabilization of the residential real estate market, business-services job growth will likely begin to take off again. After all, the fundamental reasons for the success of these areas, such as warm weather, lower costs and the need to serve a growing population, have not fundamentally changed.

    Perhaps most perplexing is the fate of some of the other places on our worst cities list, particularly the biggest metropolitan areas. The professional and business services sector is widely considered ideal for large, cosmopolitan centers, since lots of industries require support. But Chicago experienced a huge chunk of job losses – almost 25% – in this sector during the last year. Other big cities, including Los Angeles, Minneapolis and New York, also suffered.

    This is not a new phenomenon. These and other big cities, like Boston and San Jose, San Francisco and Oakland in California, have been shedding these types of jobs since 2001. These losses, however, have been concentrated at the lower-wage end of the business service pyramid, in areas like human resources and administration. These are the positions that companies can fill more easily and cheaply using the Internet or by hiring in less expensive outposts.

    That’s why Washington and its environs, which has seen across-the-board business growth, remain the great exception. Many business-services jobs outside the beltway appear to be becoming more nomadic, based in places where firms face lower costs and where workers can afford to live well on middle-income salaries. Even the long-term resiliency of higher-wage employment like law and accounting in traditional business hubs like New York could be at risk over time, with some jobs shifting to less expensive locales or even overseas.

    The changing nature of business services presents a boon to some communities and a challenge to others as they seek to survive and thrive in spite of the current recession. How some cities manage to grow this segment of their economies may well presage which parts of the country will thrive best during the years of recovery – and beyond.

    This article originally appeared at Forbes.

    Joel Kotkin is executive editor of NewGeography.com and is a presidential fellow in urban futures at Chapman University. He is author of The City: A Global History. His next book, The Next Hundred Million: America in 2050, will be published by Penguin early next year.

  • Manhattan’s Declining Share of New York City Jobs

    The amount of private sector jobs in Manhattan has been declining since 1958, according to the Center for an Urban Future. An increase in job-spread among the other four boroughs – Queens, Brooklyn, the Bronx, and Staten Island – has led to a shift in the New York City job market.

    Still, Manhattan has the largest slice of the Big Apple job pie with a share of 61.59 % in 2008. This number has fallen about 6 percentage points over the past 5 decades. In 1958 Manhattan had a hefty 67.59% share of private sector jobs.

    Needless to say, as Manhattan’s shares have declined, the other borough’s collective shares have increased overall. However, Queens has grown to eclipse Brooklyn with the second largest share in 1978 and has yet to rescind the title. Queens share of private sector jobs sits at 15.07%, while Brooklyn has a 14.09% share. From 1958 to 2008, the Bronx’s share has increased from 5.36% to 6.50% while Staten Island’s share has grown from a minute 0.75% to 2.76%.

    This shift away from the city’s traditional financial sector of Manhattan can seem alarming to those not living in the Outer Boroughs. However, Manhattan-ites can take comfort in the fact that the city’s unemployment rate remains slightly lower than the national average.

  • Unsustainable Transit: New York City

    When it comes to transit, as like many things in the United States, there is no place like New York City. The subways and buses of the New York City Transit Authority (NYCTA) carry more than 40 percent of the nation’s transit rides (unlinked trips). To account for 40 percent of the nation’s ridership is quite an accomplishment inasmuch as the city represents less than 3 percent of the nation’s population.

    Of course, New York City’s ridership domination stems from the evolution of an ideal environment for transit. Most of the ridership comes from the heavily urban boroughs of Manhattan, Brooklyn, Queens and the Bronx, with a much smaller ridership in Staten Island, most of which looks like the second ring adjacent New Jersey suburbs. The four highly urban boroughs have exceedingly high population densities, averaging above 30,000 per square mile. The city of San Francisco, with its reputation for density, is little more than one-half as dense. The four boroughs are nearly as dense as city (23 ku area) of Tokyo, denser than most European core cities and nearly three times as crowded as Amsterdam.

    The most important factor, however, is the concentration of destinations in the central business district, south of 59th Street in Manhattan. This is the world’s second largest central business district and the home of approximately 2,000,000 jobs. Only the geographically larger business district inside Tokyo’s Yamanote Loop has more jobs. The Manhattan business district (really two, Uptown and Lower Manhattan and the area between) has at least four times as many jobs as Chicago’s Loop, the second largest central business district in the nation.

    The share of people commuting to work by transit is far higher than anywhere else in the nation. Approximately 75 percent of the people commuting to jobs in Manhattan get there by transit. Approximately 55 percent of the city’s working population commutes by transit, double the percentage of automobiles. By comparison, other highly urbanized central cities have far smaller transit work trip market shares, with Boston at 34 percent, San Francisco at 33 percent and Chicago at 26 percent. In each of these cities, considerably more people commute by car than by transit.

    Suffice it to say that New York is the penultimate transit city. If transit is the answer anywhere, it is the answer in New York.

    Yet the history of New York City Transit Authority has been one of financial crisis. From the NYCTA’s founding in 1953, transit riders of New York City have been faced by recurring threats of service reductions and fare increases. Over the years, transit fares have risen sharply despite increased subsidies. The financial downturn has generated yet another financial crisis at NYCTA, as well as at many other transit agencies around the country. There may be a financial bail-out from Albany, or there could be significant fare increases or service reductions. But the present financial crisis is by no means the first and it is unlikely to be the last. The problem is that transit is characterized by perverse incentives that keep if from focusing on its principal mission.

    Transit’s mission, as my late Los Angeles County Transportation Commission colleague (and Santa Monica city councilwoman) Christine Reed so eloquently put it, is to serve both riders and taxpayers. Regrettably, however, the riders and taxpayers routinely take a back seat to other more concentrated and powerful groups with a strong interest in getting themselves more money and scant interest in cost efficiency.

    As a result, the story is always the same in New York and elsewhere. Financial crises are characterized as funding crises and the answer to every question is more money. Little or no serious attention is paid to the cost side of the equation. In the present environment, the riders and the taxpayers are unlikely to ever be able to provide enough money to make transit financially sustainable.

    Both labor and management operate in an environment of perverse incentives. Labor unions understandably seek to improve the wages and working conditions of their members. In a competitive environment, there are some limits. But transit remains immune to competitive pressures; it is rather a political environment. Transit board members are appointed by elected officials, many of whom rely heavily on political contributions from labor unions and their often sophisticated get out the vote operations.

    Transit managers must live with this reality and any who become too courageous in their dealings with transit labor can expect to be shown the door. At the same time, transit labor negotiations are often not really conducted between parties across the table from one-another. Indeed, often the table is shoved up against the wall, since the gains that are won by the labor unions are largely duplicated in the pay and benefits packages of transit managers. Thus, costs are higher in transit – whether at NYCTA or at other agencies – than they would be for similar work in the private sector.

    One might expect transit to face frequent crises in Eugene, Madison or even Los Angeles or Seattle. But New York City? Perverse incentives are the problem, but other cities have managed to have successful transit systems without such incentives. In some of the world’s largest cores, such as Tokyo and Hong Kong, transit obtains virtually all of its funds from commercial revenues, principally fares. Without access to the deep pockets of taxpayers, transit is required to live within their means. Serious attention is paid both to funding and costs. It may be too much to ask for transit in New York City to be converted from its heavy subsidies to a profitable operation. But improvements can be made.

    In transit operations, one answer is competitive contracting (competitive tendering), whereby the transit agency seeks competitive bids on bus and rail routes for private operation. The competitive market reduces costs, while the transit agency specifies all aspects of the service. The best example of competitive contracting in the world is the London Transport bus system, which is the largest city bus system in the developed world. Buses are operated by multiple private contractors, under the control of Transport for London, which determines fare levels, routes, schedules and transfer arrangements. To the public, London Transport’s buses look and act like a single system. There is, however, a big difference. Competitive contracting has reduced costs per mile by nearly 40 percent after adjustment for inflation over the past 25 years. The savings have been plowed back into substantial service increases, which have led to strong ridership increases. Subway operating costs have also been reduced through competitive contracting, such as in Stockholm.

    But so long as the focus is on revenues and costs are largely ignored, the only thing sustainable about transit in New York City will be its fiscal crises. Even if there is an eventual financial bailout of NYCTA this time, expect the clock to start ticking towards the next inevitable crisis.

    Wendell Cox is a Visiting Professor, Conservatoire National des Arts et Metiers, Paris. He was born in Los Angeles and was appointed to three terms on the Los Angeles County Transportation Commission by Mayor Tom Bradley. He is the author of “War on the Dream: How Anti-Sprawl Policy Threatens the Quality of Life.

  • Credit Cards Flash At The White House

    Back in the 1980s, Citibank CEO John S. Reed looked at the bank’s earnings and said, more or less: This is really a credit card company with six other lines of business. That is, the card portfolio was making lots of dough, and carrying the rest. Commercial lending, real estate lending, clearing, foreign exchange, branch banking — all of them were flat or losing money, while the card business was cooking.

    Membership has its privileges indeed. I am reminded of this today because this past week President Obama has been meeting with the CEOs of the big credit card companies and trying to jawbone them into giving up some of the power they enjoy to goose their earnings by opportunistic manipulation of terms of service to their customers. It’s as if Mobil or BP had the power to come back in the dark of night and siphon off some of the gas they sold you in the afternoon.

    I wish the president well. He made it clear during his session with the card executives that he was familiar with their machinations from personal experience. We have come a long way since the first President Bush marveled at a bar code reader. But I have my doubts. Right now, the whole banking portfolio looks a good deal like Citibank did in those days. Commercial lending, mortgages, trading… all underwater.

    Credit cards may or may not be making money—that shoe doesn’t drop all at once—but when you can squeeze your customers the way all that fine print allows, you don’t give up the franchise lightly. Let’s not forget, the credit card business already had its bailout, in the form of the Bankruptcy Abuse Prevention and Consumer Protection Act of 2005, which functions according to the Law of Goodfellas: Drowning in medical bills? “F* you, pay me.” Swamped by alimony and child support? “F* you, pay me.”

    To that, add: Lost your job, house, and health insurance? “F* you!”

    When I arrived at Citibank in 1980, one of the first speeches I wrote was for the opening of Citibank, South Dakota, which was created expressly for the purpose of lodging the credit card business. Citibank had transplanted this business from New York State because New York still had usury laws, which capped retail interest rates at 12%.

    The bank was in big trouble. In the preceding years, Mr. Reed had flooded the nation with credit cards, a bold move in an era when people did their banking locally. A credit card was generally an extension of an existing banking relationship, replete with a credit history and some suasion of banker over customer. Reed’s folly, as it was occasionally called, entailed giving cards to total strangers by mass mailing—unlike retail banks, the U.S. Post Office could branch across state lines—many of whom were of dubious creditworthiness, or dubious character for that matter. With interest rates capped at 12% by New York law, and overnight money, borrowed as needed from other banks, floating north of that—this was when Paul Volcker was Fed chairman—something had to give. As Walter Wriston put it, “When you borrow money at 14% and lend it at 12%, you can’t make it up on volume.” When I was recruited as a Citibank speechwriter, among the perks my boss mentioned was that I could take out a loan at a low employee rate and buy a CD that paid a higher one.

    New York State legislators never imagined that one of the most venerable of banking institutions would relocate the business to a more favorable venue, a practice called jurisdiction shopping. But armed with some combination of the Bank Holding Company Act and other legislation, and something called the Commerce Clause of the U.S. Constitution, they found their way to South Dakota and its accommodating four-term Governor William Janklow. Governor Janklow’s signature legislative accomplishments were the reinstatement of capital punishment, and lifting the State’s usury limits. (He was later convicted of running a stop sign and hitting a motorcyclist, killing him. The family was precluded from collecting damages because Janklow was heading home from a speech at a country fair, and thus on official business. He is now a practicing lawyer.)

    But enough local color. Suffice it to say that the bank got what it wanted, and so did the State. The bank instantly became South Dakota’s largest employer, and, as we pointed out in our speeches, its college graduates found an employer where they could put their degrees to work without leaving home.

    This was so soon after I started working at Citibank that I was denied my first credit card because I hadn’t been at my job long enough. “I’m writing speeches for the chairman of the bank and for your boss, Rick Braddock,” I told the phone rep. “That may be,” she said, “but you haven’t been employed long enough to qualify.” When I told Rick, he laughed and said, “At least they’re doing their jobs. What do you want, plain vanilla or preferred?”

    Freed from the constraints of New York State law, Citibank survived its catastrophic loan losses and pioneered many now-standard innovations, including risk-based pricing, affinity cards, and a portfolio of cards targeted to different categories and classes of users.

    Even then, the promiscuous marketing of cards and the potential resulting horrors were manifest. Like pornographers’ lawyers, we found the germ of redeeming social importance. We were providing consumers with a tool for managing their personal and family finances. We were freeing working people from the necessity of relying on loan sharks from payday to payday. We were dealing with consenting adults.

    The bankers were fully aware, of course, that in spite of talk about sensible use of credit and managing the household budget, they were really selling liquor to the natives. Behind the scenes was a laboratory where young people with degrees in psychology were kicking the consumer behavior of millions around like a soccer ball, finding ways to hype the impulse to buy, buy, buy, and mining data to place “choices” in front of people based on their previous purchases. We take it all for granted now, with Amazon.com and a thousand other websites, but this took place in the years of the mid-1980s, one of which was 1984.

    By the end of last week, the biggest story out of the credit card summit was that Larry Summers fell asleep, a serendipity that is almost a reenactment of regulatory behavior over the past eight years or more (I am aware of the role Summers played under Clinton). The New York Times reported, “One executive told the president that although her assignment had been to try to persuade the president not to support new restrictions, ‘it was pretty clear I won’t succeed.’” The biggest underlying argument is that with the banks’ other businesses so weak, they don’t want to give up the one cash cow.

    My fear is that whatever new restriction is placed on this weasel industry, whether we have to wait for new Federal Reserve regulations in 2010 or they are expedited, the evil minions at the banks will find a way around it. This is the game they have long played. I have seen their tricks in my own accounts, including that first one that Mr. Braddock granted me. Lower the interest rate? They accelerate the repayment schedule, which means the customer has to pay just as much each month, resulting in lower repayment of interest as a share of the payment.

    It reminds me of the way cigarette companies lower the tar content of cigarettes by perforating the paper. The poor addict drags more often and harder, just to maintain the accustomed nicotine levels. Or the time I paid my balance in full—thousands of dollars worth—when my interest rate was low, then used the card in an emergency, only to find that my rate had shot up to Tony Soprano levels. Why? Because when I had paid my bill in full, they hadn’t yet posted $6 in new interest charges, which went unpaid, and therefore I was now being charged at deadbeat levels.

    Or, as Michael Corleone would put it, just when I thought I was out, they pulled me back in.

    Henry Ehrlich has written speeches as a freelancer for both the new, white-knight CEO of Fannie Mae and the former, disgraced CEO of Freddie Mac. He is author of Writing Effective Speeches and The Wiley Book of Business Quotations.