Tag: New York

  • Commuting in New York

    The New York commuter shed (combined statistical area) is the largest in the United States, with 23.6 million residents spread across 13,900 square miles in New York, New Jersey, Connecticut and Pennsylvania. It includes 35 counties, in eight metropolitan areas, including New York (NY-NJ-PA), Allentown-Bethlehem (PA-NJ), Bridgeport-Stamford (CT), East Stroudsburg (PA), Kingston (NY), New Haven (CT), Torrington (CT) and Trenton (NJ). The criteria for designation of combined statistical areas is here and Figure 1 is a map of the New York CSA.

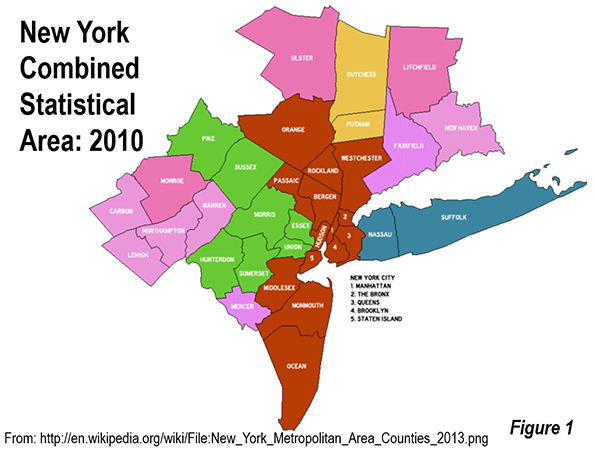
    This article examines employment and commuting in the New York area by broad geographic sector. The core sector, of course, is Manhattan (New York County). The second sector is the balance of the city of New York, the outer boroughs of the Bronx, Brooklyn, Queens and Staten Island. The inner counties are Westchester and Nassau in New York as well as Bergen, Essex, Hudson, Middlesex, Passaic and Union in New Jersey. The balance of the CSA is in the outer counties.

    Distribution of Employment

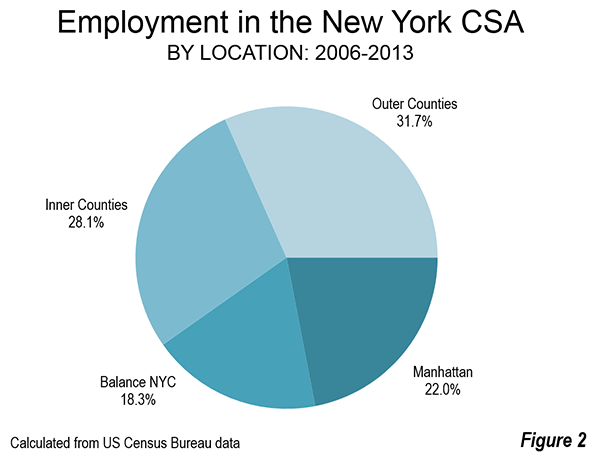
    The New York CSA is home to the world’s second largest central business district (CBD). Only Tokyo’s Yamanote Loop has more employment. Overall, Manhattan (New York County) has 2.4 million jobs, with approximately 2.0 million jobs in the CBD, which covers virtually all of the area to the south of 59th Street. Yet, despite this impressive statistic, unmatched anywhere in the country, Manhattan contains only 22 percent of the employment in the New York area. The largest portion of employment is in the outer counties, with 32 percent (Figure 2). Combined, the inner and outer county suburbs represent 60 percent of the jobs in the New York commuting shed.

    Where People Live and Work

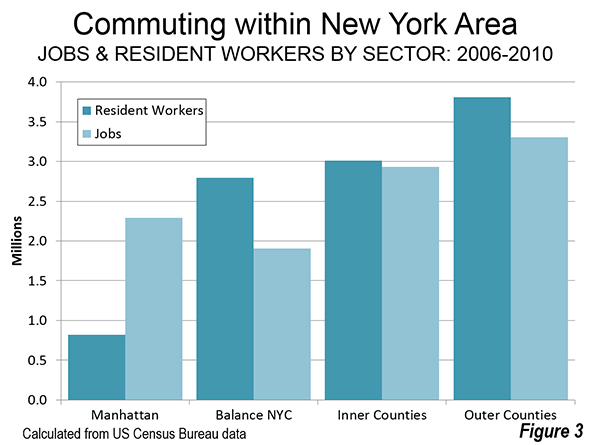
    The distribution of employee residences contrasts sharply with that of employment. Manhattan displays the most extreme imbalance between jobs and where people live. (Figure 3). There are nearly three times as many jobs as resident employees in Manhattan (2.8 jobs per resident employee). The most evenly balanced sector is the outer counties, which are at near parity, with 0.97 jobs for every resident employee. The outer counties are relatively balanced, with 0.87 jobs per resident employee. The balance of New York City has 2.7 million resident workers and only 1.9 million jobs. There are only 0.68 jobs per resident employee. When the entire city is considered, including Manhattan, there is a much closer balance, with 1.16 jobs per resident worker.

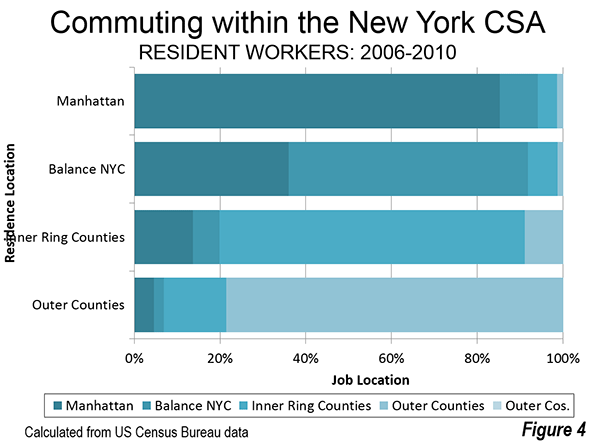
    Most employees work in their sector of residence. About 85 percent of Manhattan residents work in Manhattan. Nearly 79 percent of outer county residents work in the outer counties, while 71 percent of inner county residents work in the inner counties. Perhaps surprisingly, nearly two-thirds as many inner county residents work in the outer counties as work in Manhattan. Only 55 percent of resident workers in the four outer boroughs of New York City work in the outer boroughs (Figure 4)

    Commuting to Manhattan

    One of the most enduring urban myths is built around the idea of the monocentric city. This is the conception that most people work downtown (the CBD). This has been an inaccurate characterization for decades, even in New York. In New York, as noted above, the CBD accounts for little more than 20 percent of employment. By comparison, however, this is a substantial number compared to other large North American commuter sheds. The Chicago CSA, for example (the Loop) has about 11 percent of its employment downtown (the Loop), Toronto has less than 15 percent and Los Angeles is under two percent.

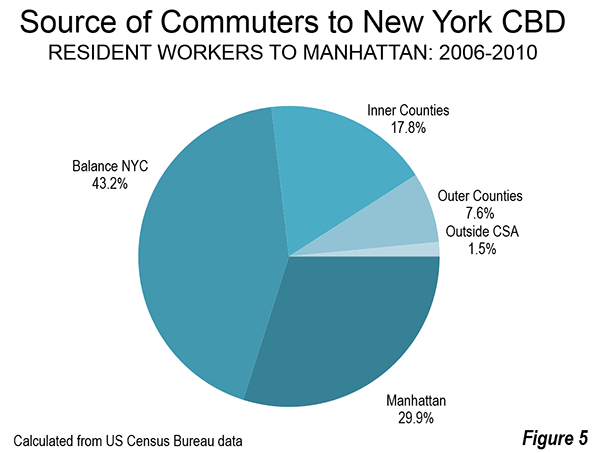
    The overwhelming majority of jobs in Manhattan are filled by local residents or nearby commuters. According to American Community Survey "flow" data for 2006-2010, 73 percent of Manhattan commuters live in Manhattan or in the balance of New York City. Another 18 percent of commuters travel from the inner counties. This leaves less than eight percent of commuters traveling from the outer counties. Less than two percent of commuters travel to Manhattan from outside the CSA (Figure 5).

    How Commuters Travel

    New York relies on transit far more than any other US commuter shed. Overall approximately 27 percent of work trip travel is on transit. However, the extent of transit use varies widely by sector. Transit accounts for 75 percent of work trip travel to Manhattan employment. Transit also has a significant market share to jobs in the outer boroughs (38 percent). Jobs in the city of New York account for 88 percent of the transit commuting in the CSA. Outside the city, transit carries a much smaller share. In the inner counties, transit captures nine percent of commuters, while accounting for a much smaller 2.6 percent in the outer counties. In the outer counties, transit’s market share is slightly more than one-half the national average (Table).

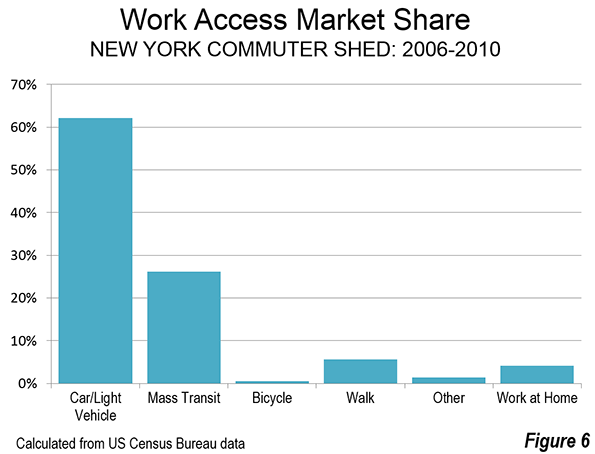
    Cars have the largest work trip market share in every commuter shed in the nation, including the New York area, where they provide 61 percent of trips. Again, however, there is a very wide variation between the sectors. Cars provide less than 15 percent of commute trips to jobs in Manhattan. They provide a larger 44 percent share in the outer boroughs. In the inner counties and outer counties, cars are strongly dominant, providing for 80 percent and 88 percent of the commutes respectively.

    The walking commuter share is lower than might be expected in famously pedestrian oriented Manhattan. Manhattan has by far the densest urbanization in the United States. With more than 70,000 residents per square mile (28,000 per square kilometer), Manhattan is nearly four times as dense as San Francisco, which has the highest density of any large municipality in the US outside New York. With such a high density, and a job density of more than 100,000 per square mile (nearly 40,000 per square kilometer), it may be surprising that workers in the outer boroughs rely on walking to work to a greater extent. Walking has a 7.4 percent commuting share in Manhattan, and a 9.6 percent share in the outer boroughs, despite their much lower population and employment densities.

    Table
    New York CSA Means of Transportation: Work Location: 2013
    Area Drive Alone Car Pool Transit Bicycle Walk Other Work at Home
    Manhattan 10.0% 2.7% 74.7% 1.0% 7.4% 1.8% 2.4%
    Balance: NYC 37.0% 7.3% 38.7% 1.1% 9.6% 1.4% 4.8%
    Inner Counties 71.6% 8.6% 9.4% 0.3% 4.2% 1.7% 4.2%
    Outer Counties 79.6% 8.6% 2.6% 0.3% 2.8% 1.1% 5.0%
    New York CSA 54.3% 7.1% 26.9% 0.6% 5.4% 1.5% 4.2%
    Exhibit: United States 76.4% 9.4% 5.2% 0.6% 2.8% 1.3% 4.4%
    Calculated from American Community Survey


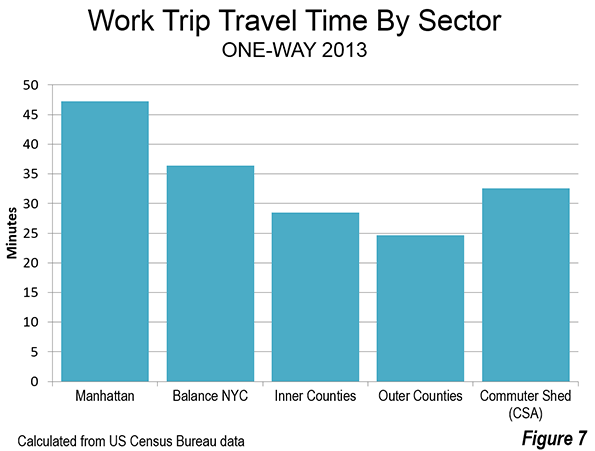
    The faster work commute trips of cars is illustrated in the sectoral analysis. Automobile commuting is most dominant in the outer county suburbs, which have the largest number of resident workers and jobs. The average one-way work trip travel time is 24.7 minutes in the outer counties, little more than one half the 49.7 minute one way trip to jobs in Manhattan. The inner counties have the second shortest travel time, at 28.5 minutes. Jobs in the outer boroughs of New York City have an average work trip travel time of 36.4 minutes (Figure 7).

    A Dispersed Commuter Shed

    Despite its reputation for monocentricity, and its primacy in terms of the sheer numbers of core area employees, the New York combined statistical area remains surprisingly dispersed when it comes to jobs, contrary to popular accounts, although less so than others.

    —–

    Wendell Cox is Chair, Housing Affordability and Municipal Policy for the Frontier Centre for Public Policy (Canada), is a Senior Fellow of the Center for Opportunity Urbanism (US), a member of the Board of Advisors of the Center for Demographics and Policy at Chapman University (California) and principal of Demographia, an international public policy and demographics firm.
    He is co-author of the "Demographia International Housing Affordability Survey" and author of "Demographia World Urban Areas" and "War on the Dream: How Anti-Sprawl Policy Threatens the Quality of Life." He was appointed to three terms on the Los Angeles County Transportation Commission, where he served with the leading city and county leadership as the only non-elected member. He served as a visiting professor at the Conservatoire National des Arts et Metiers, a national university in Paris. 

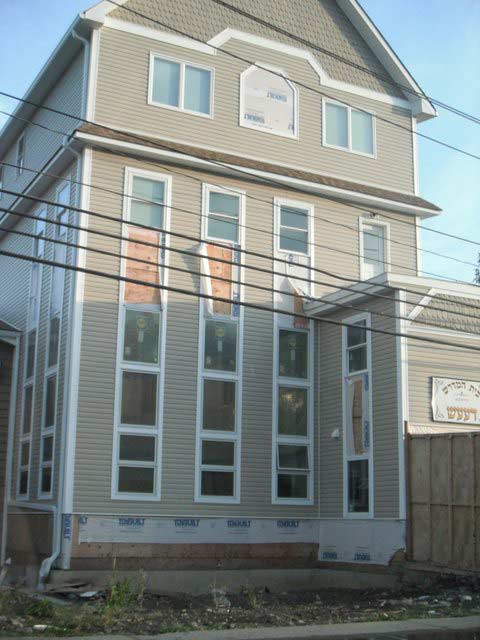
    Photograph: Inner County New York CSA: City of Elizabeth, seat of Union County, New Jersey (by author)

  • Malls Washed Up? Not Quite Yet

    Maybe it’s that reporters don’t like malls. After all they tend to be young, highly urban, single, and highly educated, not the key demographic at your local Macy’s, much less H&M.

    But for years now, the conventional wisdom in the media is that the mall—particularly in the suburbs—is doomed. Here a typical sample from The Guardian: “Once-proud visions of suburban utopia are left to rot as online shopping and the resurgence of city centers make malls increasingly irrelevant to young people.”

    To be sure, there are hundreds of outmoded malls, long-in-the-tooth complexes most commonly found in working-class suburbs and inner-ring city neighborhoods. Some will never come back. By some estimates, something close to 10 to 15 percent of the country’s estimated 1,000 malls will go out of business over the next decade; many of them are located in areas where budgets have been very tight, with locals tending to shop at “power centers” built around low-end discounters such as Target or Walmart.

    But the notion that Americans don’t like malls anymore is misleading. The roughly 400 malls that service more-affluent communities—like those typically anchored by a Bloomingdale’s or Nordstrom—recovered most quickly from the recession, and now appear to be doing quite well.

    To suggest malls are dead based on failure in failed places would be like suggesting that the manifest shortcomings of Baltimore or Buffalo means urban centers are not doing well. Like cities, not all malls are alike.

    Looking across the entire landscape, it’s clear the mall is transforming itself to meet the needs of a changing society but is hardly in its death throes. Last year, vacancy rates in malls flattened for the first time since the recession. The gains from e-commerce—6.5 percent of sales last year, up from 3.5 percent in 2010—has had an effect, but bricks and mortar still constitutes upwards of 90 percent of sales. There’s still little new construction, roughly one-seventh what it was in 2006, but that’s roughly twice that in 2010.

    Shopping in stores, according to a recent study from A.T. Kearney, is preferred over online-only by every age group, including, most surprisingly, millennials, although many of them research on the web, then visit the store, and sometimes then order on line. The malls that are flourishing tend to be newer or retrofitted and are pitched at expanding demographic markets. These “cathedrals of commerce” in the past tended to reflect the mass sameness of mid-century America; those in the future focus on distinct niches—ethnic, income, even geographical—that are not only viable but highly profitable.

    This leaves us with a tale of two kinds of malls. One clear dividing line is customer base. In the ’80s and before, malls succeeded fairly universally, notes Houston investor Blake Tartt. But now it’s a matter of being in the right place. “Everything has changed and you have to be with the right demographics,” he suggests. “It’s not so much about the mall but the location that matters.”

    Old malls in declining areas, notes a recent analysis by the consultancy Costar, do truly face a “bleak future” and should look to be converted into apartments, houses, corporate headquarters, or churches.

    In contrast, affluent urban areas are becoming an unexpected hotspot for malls—even outlet malls are opening open in the urban core. You now see gigantic malls in places like Manhattan: the Shops on Columbus mall in Manhattan, the world’s fifth-most profitable mall, looks inside like it was teleported from Orange County, California, or, god forbid, Long Island.

    This is not unusual across the world. Malls are on the march in many of the world’s biggest cities, including Istanbul, Mumbai, Singapore, and Dubai. Today Asia is the site of seven of the world’s 10 largest malls, in places like Beijing, Dubai, and Kuala Lumpur.

    In the developing world, malls grow as local shopping streets either gentrify or decay. This is particularly true in fast-growing developing countries where malls are often seen as an escape from hot, humid, dirty and even dangerous urban environments. Indian novelist and Mumbai blogger Amit Varma suggests that these folks like malls “because they are relatively clean and sanitized” as opposed to the city’s pollution-choked, beggar-ridden and often foul-smelling streets.

    Ethnic Malls

    Within the U.S., demographic change is creating opportunities for a new breed of mall-maker. Across the country, savvy investors and developers have been buying older malls, which tended to serve either Anglo or African-American customers, and shifting them instead to focus on fast-growing ethnic markets. Such malls can now be found in traditional Latino areas such as Southern California and Texas, but they also exist in Atlanta, Las Vegas, Oklahoma City, and Charlotte, places that have recently become major hubs for immigrants.

    “We had a terrific recession,” notes Los Angeles-based mall maven Jose Legaspi, who has developed 12 such malls around the country. “You do well if you target specific niches that are growing. You can’t make it with a plain vanilla mall. We are creating in these places a Hispanic downtown.”

    Fort Worth’s 1.2 million-square-foot La Gran Plaza, which Legaspi manages, epitomizes the advantages of such marketing. When investor Andrew Segal bought the mall in 2005, it was a failing facility that primarily serviced a working-class Anglo population. Barely 15 percent of the mall’s tenants were both open and paying rent.

    Segal quickly recognized that the area around the mall—like much of urban Texas—was becoming more diverse, in this case largely Latino.

    Segal and Legaspi redid the once prototypical plain vanilla mall to look more like a Northern Mexican town plaza, a design pattern developed by Los Angeles architect David Hidalgo. Latino customers are drawn to amenities like large and comfortable family bathrooms, an anchor supermarket, mariachi music shows, and even Catholic masses. There is also a “swap meet” that accommodates small vendors, something that Legaspi sees as essential to creating “a carnival of retail experiences.” By 2008, when the face-lift was complete, the mall achieved 90 percent occupancy. Today La Gran Plaza is effectively “full,” says Segal, who is considering a further expansion of the mall.

    The viability of ethnic malls in hard times demonstrated their viability in better ones. When Dr. Alethea Hsu opened her Diamond Jamboree Center in Irvine, California, the state was reeling from the recession. Yet from the time she opened in 2008, her mall, which focuses on Orange County’s large and expanding Asian population, has been fully occupied. It includes various realty offices, hair salons, medical offices, a Korean supermarket, and a small Japanese department store, all primarily aimed at a diverse set of Asian customers. The biggest problem—for those interested in choosing among various kinds of Chinese, Vietnamese, Korean, or Japanese cuisine—is not that it’s deserted but that it’s often difficult to get a parking space.

    Be sure of this: The ethnic mall is no flash in the pan, at least as long as immigrants pour into this country. By 2000, one in five American children already were the progeny of immigrants, mostly Asian or Latino; today they make up as much as one-third of American kids. These kids, and their own offspring, not to mention Anglo or African-American friends, have been brought up with food and fashion tastes that often originate in Mexico, Taiwan, Japan, Korea, or China. When I was a kid growing up in New York, you went to Chinatown or Little Italy for an ethnic infusion. Now you get in your car, park, and get options not so dissimilar than what you would find—usually in a mall—in Mexico City, Mumbai, or Singapore.

    The World According to Rick

    For most of America, says Los Angeles developer Rick Caruso, the future lies in replicating the function that Main Street once served. Rather than simply a center for instant consumption and transactions, the mall is a social meeting point, says Caruso, who has 10 developments under his belt. To make it all work means adding often unconventional amenities such as live entertainment or the lighting of Christmas trees and the Chanukah menorah.

    This is part of a broader mall trend in which developers see their properities as community and entertainment centers, an approach adopted now by mainstream mall developers such as Westfield, whose projects are increasingly open-air and built around amenities such as health clubs and trendy restaurants and cafes.

    The ultimate example may be the Caruso-owned Grove, a giant open-air mall that lies next to the Farmers’ Market, one of the oldest and beloved shopping areas in Los Angeles. The world’s eighth-most profitable mall, the Grove is laid out like a Disneyesque Main Street and is particularly appealing to families and tourists. Overall, the Grove now ranks among L.A.’s leading tourist attractions. This reflects both the development’s pleasant, pedestrian-oriented design as well as proximity to the Farmer’s Market, which remains, as has been traditional, largely a collection of small, idiosyncratic stalls.

    A sense of place is what makes the Grove—and, to a lesser extent, Caruso’s other developments—work. Located in the Miracle Mile district of L.A., it attracts a huge urban population that includes old Jewish shoppers from the immediate area as well as the growing ranks of hipsters, tourists, and the rest of the vast diversity that is Los Angeles. Caruso’s other centers, like the Commons in suburban Calabasas and The Promenade in Westlake, may lack global appeal but they succeed as anchors of their communities. Without developed, large historic downtowns, these communities still need a central place, and for them, the malls, however imperfectly, come closest to delivering it.

    In today’s environment, Caruso suggests, a mall has to offer something that online retailers, power centers, or catalogs cannot provide: a social experience. “You have to differentiate yours, offer a place for people to gather for holidays. People are yearning for a place to connect with each other. We are not building just town centers, but the centers of towns.”

    Ironically these malls are fulfilling a role that some urbanists have denounced the suburbs for lacking. “What do most urbanists want?,” asks David Levinson, director of the Networks, Economics, and Urban Systems Research Group. “A lively, pedestrian realm, clean, free of automobiles, with a variety of activities, the ability to interact with others and randomly encounter friends and acquaintances. This is what the shopping mall gives.”

    The New Town Center: With Suburban Revival, New Hope for Malls

    The notion of dead malls has been connected to a similar idea about the inevitable demise of the suburbs, which appeared possible at the height of the recession, but has since been shown to be largely false. Suburbs may not be booming as in the ’90s, but they are now growing as fast as core cities, and constitute more than 70 percent of all new population and 80 percent of new job growth since 2010.

    Surprisingly, the most recent numbers suggest that the outer suburbs and exurbs, once consigned to Hades by the new urbanist crowd, have begun to roar back. Millennials, as they get older, notes Jed Kolko, now seem to be moving to what he calls “the suburbiest” areas farther out on the periphery. 

    It is in these areas that malls may have their greatest future. In communities like Irvine, where the Spectrum development has become the de facto downtown, or Sugar Land, a highly diverse outer suburb of Houston, the “town center” is essentially a mall in brick, made to look like an old Main Street but filled with chain stores and specialty restaurants. Many residents of fast-growing communities like Sugar Land, which has 83,000 residents, are relative newcomers, and for them such town centers are the focus of their communities.

    It is time to dispense with the twin memes of mall- and suburb-bashing, and begin appreciating and improving how most Americans live and shop. The malls of the future indeed may be very different in many ways—more segmented by income and ethnicity, more entertainment- and experience-oriented. But they will continue to serve an important focus for most American communities. And at a time when many of our most celebrated cities have themselves become giant malls (is there any place on Earth more boring than the area around Times Square?), the future of malls may prove brighter, and even more transformative, than commonly imagined.

    This piece first appeared at The Daily Beast.

    Joel Kotkin is executive editor of NewGeography.com and Roger Hobbs Distinguished Fellow in Urban Studies at Chapman University, and a member of the editorial board of the Orange County Register. He is also executive director of the Houston-based Center for Opportunity Urbanism. His newest book, The New Class Conflict is now available at Amazon and Telos Press. He is also author of The City: A Global History and The Next Hundred Million: America in 2050.  He lives in Los Angeles, CA.

    Photo: “Thegrove“. Licensed under CC BY-SA 3.0 via Wikipedia.

  • In NYC, Throwing Good Infrastructure Money After Bad

    Ten billion dollars — for a bus station. And if other projects are any guide, this price tag for a Port Authority Bus Terminal replacement is only going up from there.

    That’s after we’ve committed: $4.2 billion at the PATH World Trade Center station; $1.4 billion for the Fulton St. subway station; $11 billion for the East Side Access project; $4.5 billion for just two miles of the Second Ave. Subway, and $2.3 billion for a single station extension of the 7-train.

    Having grown numb to multi-billion price tags for building almost anything, New Yorkers might not know just how messed up all this is. In any other American city, even just one of these fiascoes might well have sunk the entire town.

    Read the entire piece at the New York Daily News.

    Photo by Metropolitan Transportation Authority of the State of New York (East Side Access: January 13, 2014) [CC BY 2.0], via Wikimedia Commons

  • Transit Ridership Increases: No Escape from New York

    Transit ridership is increasing in the United States. The American Public Transportation Association (APTA) has reported that 10.8 billion trips were taken on transit in 2014, the largest number since 1956. With a more than 80% increase in gasoline prices since 2004, higher transit ridership was to be expected. However, it would be wrong to suggest the transit ridership is anywhere near its historic peak, nor that the increases have been broadly spread around the nation.

    Highest Ridership Since 1956 (Which was the Lowest Since 1912)

    Total transit ridership in 2014 was the highest since 1956. That’s just the beginning. The 2014 modern record ridership was lower than every year from 1956 all the way back to at least 1912, the last year of William Howard Taft’s presidency, when transit carried 13.2 billion riders.

    Transit ridership has virtually collapsed since that time in relative terms. In 1912, the average man, woman and child rode transit at least 170 times a year. Today, the figure is about 35, down 80% from 1912. During the intervening century, non-farm employment increased by more than five times and the urban population, transit’s principal market, also increased more than five times. Ridership was elevated to its peak by gasoline rationing during World War II. Before that, transit ridership had peaked in 1926, as car ownership and suburbs rose before the Great Depression.

    The Continuing Dominance of New York

    Further, contrary to some media accounts, recent transit increases have not really been national in scope. Nearly all of it was on transit systems that serve local mobility in the City of New York as well as the rail systems serving the City from the suburbs. In the City, most of the service is provided by the Transit Authority. Additional services are provided by the New York City Department of Transportation and the Staten Island Railway. The suburban rail systems are the Long Island Railroad, the Metro North Railroad, New Jersey Transit Rail and PATH Rail. On these systems, nearly 90% of national work trip travel was to the city of New York and nearly three-quarters of those were to Manhattan.

    Transit and New York: The Last Decade

    Overall, the enormous system of buses and subways of New York City alone accounted for 88 percent of the national ridership increase from 2013 to 2014. If the ridership on the four large suburban rail systems that serve New York City (the Long Island Railroad, the Metro-North Railroad, New Jersey transit commuter rail, and the PATH trains) is added, City related transit accounts for 94 percent of the increase. A great achievement for the City, but not one that is being repeated in the rest of the nation.

    This is nothing new. National transit ridership has increased about 10 percent over the decade since 2004. Much of the increase — 79 percent — has been on New York City’s buses and subways. The suburban rail systems raise that total to 84 percent. This does not include the many commuter buses that enter the city especially from New Jersey and other suburbs, which cannot extracted from the data because it is not separately reported (Figure).

    New York’s transit turnaround has been nothing short of impressive. Nearly all of the nation’s progress in transit has been on a bus and subway system that carries one third of the national rides.

    The results have not been nearly so positive in the rest of urban America, where 30 times as many people live. While New York City related transit services experienced a ridership increase of 33% in the last decade, in the rest of the nation, the increase was less than three percent. Even huge ridership increases in New York City cannot make much of a difference nationally. In 2004, transit accounted for approximately 1.6% of urban travel. By 2014, it had risen to only 1.7%. Without taking anything from New York City’s impressive transit record, these results are not likely to be replicated elsewhere. New York City is a very unique place. It is home to the world’s second largest business district, after Tokyo, the area south of Central Park in Manhattan. Approximately 2 million peoplework in this small area, a number approximately four times the next largest central business districts, in Chicago and Washington.

    Approximately three quarters of Manhattan employees reach work by transit. This is 15 times the national average, New York City’s population density (excluding Staten Island, with its postwar suburbanization) is by far the highest and most extensive in the nation. The city of San Francisco comes the closest to New York City, with little more than half the population density and only 1/10 the total population.

    Transit is often suggested as a substitute for the car. The reality is that transit can compete with the car only to the largest downtowns. Destinations within the six transit "legacy cities," (not metropolitan areas) of New York, Chicago, Philadelphia, San Francisco, Boston, and Washington account for most of the nation’s transit work trips. And, 60% of these trips are to downtown.

    Transit cannot compete elsewhere, because travel times tend to be double those of the automobile (according to the American Community Survey) and it provides little practical access to most jobs.  University of Minnesota research indicates the average employee can reach fewer than 10 percent of jobs in less than one hour by transit in 46 major metropolitan areas. By contrast, approximately 65% of people who drive reach their jobs in less than 30 minutesby car in the major metropolitan areas. Building new rail systems doesn’t change the equation. At least 20 new urban rail systems have been built in the last four decades, though transit’s percentage of work trips has generally not improved, despite representations about reducing traffic congestion to the contrary. For example, in Portland, Washington, Los Angeles, Dallas-Fort Worth, and Atlanta, which have among the most extensive new rail systems, a smaller percentage of commuters use transit than before rail opened, when there were only buses.

    Even low income workers, who are often portrayed as "transit dependent," use cars much more than transit, and at a rate nearly equal to that of others in the labor force.

    Yet, transit funding advocates continue to seek even more money, claiming that transit can attract drivers from their cars and reduce traffic congestion. That may be true in New York City’s uniquely transit-friendly environment, but not elsewhere.

    Wendell Cox was a three-term member of the Los Angeles County Transportation Commission and chaired two APTA national committees. He is a public policy consultant in St. Louis and is a senior fellow at the Center for Opportunity Urbanism.

    Photo: Bart A car Oakland Coliseum Station

  • Demography & Destiny: America’s Youngest Community

    The village of Kiryas Joel is a perfect illustration of how demographic differences can play out spatially. An enclave of ultra-orthodox Satmar Hasidic Jews tucked in the woods of Orange County, about 60 miles north of New York City, Kiryas Joel is an uncharacteristically high-density settlement filled with individuals whose high birth rate and dependence on federal aid often incurs the anger of the upper-middle class suburbs that surround it.

    Between a few hills in a picturesque but otherwise none-too-remarkable part of a mostly automobile-oriented suburban county of New York City, the settlement of Kiryas Joel has the distinction of being one of the fastest-growing communities in the entire country. In 1980, the Census recorded its population at around 2,080 people; by 2010, it had over 20,000. While such rates might not cause public officials in Nevada, Arizona or Idaho to bat an eyelash, in a slow-growth state like New York, this is unusual—all the more so because, prior to 1975, Kiryas Joel didn’t exist.

    The original founders were a group of Jews belonging to the Satmar Hasidic dynasty. Most lived in Brooklyn, and, like so many who fled to the suburbs at that time, the first arrivals in “KJ” were escaping what they perceived as the ills and crowds of the big city.

    The community has an Orthodox and Haredi population that surpasses virtually everywhere in the world outside of Israel. Its ethos is distinctive for its vocal opposition to Zionism: no Satmar Hasidim would ever culturally identify with Israel; the Hebrew lettering in its signs use Yiddish orthography. While the population in Williamsburg burgeoned, it was only a matter of time before the surrounding, secular neighborhoods of Brooklyn encroached on the enclave. After scouting several sites in New Jersey and Staten Island (rejected fiercely by locals), they discovered an area 60 miles north of their prior home, which at the time was still lightly populated, dirt-cheap and primarily exurban in character.

    Kiryas Joel grows largely through natural increase. It has among the highest birth rates of any municipality not just in the US, but in the developed world. In 2010, an astonishing 730 of 1000 women between ages 20 and 34 gave birth, a high figure even for many developing countries. Hasidic women marry young, usually shortly after completing the equivalent of high school. They do not practice birth control, so they then almost immediately begin to have children every year or two, resulting in a community with the nation’s lowest median age: thirteen years. It’s an extreme outlier, since no other place in the country has a median age under 20.

    The community can claim a number of distinctions, but among those for which it is the most notorious is that it is the poorest municipality with a population of over 10,000 in the entire country, with many estimates placing approximately 70 percent of the population at incomes that would qualify them as below the federal poverty line. About half of the residents receive food stamps, while one-third receive Medicaid benefits. This poverty correlates directly to the fact that virtually none of the women work full-time jobs, and a significant number of the men devote most of their lives to studying the Torah and Talmud; not even 40 percent of them have the equivalent of a high school degree, and the low levels of English proficiency make them further unemployable.

    Visually, its most prominent feature is its housing. It may not be architecturally distinctive, but the density is atypical for outer suburbs, even considering that these are outer suburbs to the nation’s largest and most densely populated city. Since the median household size is nearly six people, homes are both thickly clustered together and crowded within.


    And they’re expanding, often using construction standards that appear dubious.


    Virtually none of the housing is single-family. Approximately 95 percent is attached, a higher rate than much of New York City, meaning yards are virtually unheard of, which explains why the streets become a play area so much of the time. And more multifamily goliaths are popping up along the forested fringe.

    In its earliest years, Kiryas Joel was almost exclusively residential. Those (mostly male) KJ residents who worked would often take buses for the lengthy trip back to the City. A Park-and-Ride service is still available on the village’s outskirts. But in more recent years, the community has become increasingly self-contained, with retail tucked in the street level of these large residential complexes, as well as basic services to meet other needs.

    With more than one synagogue, multiple commercial buildings, emergency response, and dedicated recreational space, it broadly occupies the goods-and-services domain one might expect of a smaller city of 20,000 inhabitants.

    Bearing in mind that Kiryas Joel is surrounded on all sides by mid-century homes on large, wooded lots, accessed only by undulating rural collector roads, it is really the most urban community around. It’s safe to say that KJ comprises the highest concentration of pedestrian activity in the entire area, at least on the Sabbath day, when its residents do not ride, and probably every other day of the week as well.

    The community bears more than a passing resemblance to other religiously inspired outliers in the United States, also characterized by fundamentalist interpretations of their sacred texts, atypically high birth rates, and an overt repudiation of certain contemporary mores. Certain Anabaptists (particularly the Amish) and the Fundamentalist Church of Jesus Christ of Latter-Day Saints come to mind. Perhaps the principles that shape the way of life of Satmar Hasidim are not as distinct as they may initially seem. Kiryas Joel isn’t the only exurban settlement of Hasidic or Haredi Jewry in metro New York. While Kiryas Joel is the largest, most of the others share its growth rate and are likely only to escalate in public visibility in the years ahead.

    Kiryas Joel embodies a collision of values written many times over. Apparently, the surrounding population in the Town of Monroe has vigorously protested its further growth because it represents suburban sprawl. The irony of such an accusation is obvious. Not only was the development pattern of the 1960s and 1970s a glorification of a decentralized, anti-urban ethos that many deride as sprawl, most recent development in Orange County comes far closer to the “sprawling” densities of Monroe than does Kiryas Joel.

    Even if Kiryas Joel is not unique, it’s still such an anomaly that it is impossible to ignore. It’s a greenfield development more tightly packed than the densest neighborhoods in many American cities. It required no market analyses to determine if a sufficient demand existed to support such high density; the demand was obvious to the rabbinical leadership. The Town of Monroe did not overtly incentivize the development of this concentrated settlement through density bonuses in order to bolster its tax base (quite the opposite). While KJ looks nothing like the Traditional Neighborhood Development (TND) planned communities that have popped up across exurbs throughout the country, it shares at least a few of their objectives: mixed uses and high densities promote the sort of walkability that an increasing number of suburbanites find appealing. And for the Satmar Hasidim, walkability is essential.

    The community remains antithetical to what most of its neighbors would define as the “American Dream” as it applies to housing—a catchphrase that by now is hackneyed, not just from overuse, but from the narrow cultural implications it evokes. Yet Kiryas Joel continues to boom in population The American Dream is diversifying exponentially, fueled by disparate, self-actualizing initiatives, and manifesting in ways that depend largely upon their location. Kiryas Joel is just one example of many that are only “bad” or “good” when compared to their counterparts, whose own goodness or badness depends just as much on subjective judgment. The escalating elasticity of the American Dream must therefore concede to another catchphrase: live and let live.

    Eric McAfee is an itinerant urban planner/emergency manager who fuses his cross county (and trans-national) travels and love of contemporary landscapes into his blog, American Dirt (http://dirtamericana.com/). A longer and slightly different version of this post originally appeared in American Dirt: Part I and Part II.

    Photos by the author.

  • Roadmap to Surprises of the Rustbelt

    Back in New York, no one quite believed my accounts of urban renewal across the Midwest, through a piece of the Rustbelt, and then back — that St. Louis is the Brooklyn of the heartland, or that even downtown Buffalo has charms. I tended to be on safer ground when I described Targeted small towns in Ohio, or drive-by shootings in Chicago.

    Despite the skepticism I knew I would eventually encounter, my idea was to go intercity with mass transit and to get around locally with my bike. I found that the downtown areas of many Midwestern cities are vibrant, rust free, and often ideal for biking, as well as for hotels, trendy restaurants, and funky businesses.

    It’s on the periphery of these Potemkin-convention cities that the bright lights dim on the porches of ramshackle wooden frame houses. That’s where the new ghettos look less like rundown public housing and more like rural shanties that have washed up in earlier working-class suburbs.

    Does it work to travel from Chicago to New York with a folding bike on trains and buses? Give or take, I managed fine. Amtrak grudgingly accepts folding bikes as normal luggage (it is easier to take a gun on board Amtrak than a full-sized bike), and intercity bus drivers (many are cheerful souls) are indifferent about baggage stowed below.

    The bigger problem in my planning was that few trains other than freights cut across the heartland from St. Louis to Cleveland. While buses do make the connections — say, from Terre Haute to Bloomington, Indiana — many of my departures took place between 5 and 6 a.m., the time that a friend calls o’dark.

    Nor were the intermodal connections seamless. Routinely, I was dumped off the bus at a Hardee’s in Nowheresville. Between Quincy, Illinois, and Hannibal, Missouri, the only place open at lunchtime was an adult superstore, but I hadn’t worked up an appetite for lace underwear.

    Herewith, by city, are some observations from behind the handlebars:

    Chicago: I went all over Chicago on the bike, from Frank Lloyd Wright’s show-homes in Oak Park to the South Side slums (where that weekend twelve people were wounded in assorted shootings). I also made it to the old stockyards, Haymarket Square (of anarchist fame), and the Hyde Park home of President Barack Obama, which now is unpleasantly hidden away behind tall trees, concrete anti-terror barriers, and snarling guards, giving it the air of a Beirut embassy.

    Beyond the elegant Loop, lakefront, university districts, and various solid neighborhoods, Chicago has endless stretches of abandoned warehouses—no man’s lands between the city and suburbs, belts in search of manufacturing.

    I felt better when I found where the Marx Brothers had lived when they were still playing vaudeville; Ernest Hemingway’s boyhood home (when he sported curls in what he famously called that place of “broad lawns and narrow minds”); and a magnificent bike lane that sweeps along Lake Michigan. I even found myself agreeing with former vice president Dan Quayle, who said “It is wonderful to be here in the great state of Chicago.”

    St. Louis: Few city downtowns are as pleasant as that of St. Louis, which struck me as having a perfect mix of parks, restaurants, stadiums, hotels, and office buildings converted into residential lofts, many with views of the Mississippi and the Gateway Arch. I biked out as far as Clayton, Missouri, through the incomparable Forest Park, and looped around several universities, hospitals, and museums, all of which add to the city’s infrastructure luster.

    Most of what I saw was white St. Louis, as gracious as a southern plantation, although coming and going I went through northern and eastern satellite suburbs — Ferguson is one of many — where the local economy seems to revolve around selling tires, check cashing, and all-night convenience stores.

    Indianapolis: On the way from St. Louis to Indianapolis, I stopped in Springfield (part of a Lincoln haj) and Terre Haute. My bus into the Indiana capital left me at the “downtown transit center,” a dreary cave of broken vending machines, now that the former railroad station is an elegant hotel.

    The rest of downtown Indianapolis sparkled, and I spent the best day of my travels ducking into the Eiteljorg Museum of American Indians and Western Art, drinking coffee on sunny terraces, following bike paths, exploring the canals, and touring the city’s many universities, Butler and Indiana-Purdue among them.

    Only when I went out on the bike that night looking for the boyhood home of writer Kurt Vonnegut did I find the other Indianapolis, which is camped out in dilapidated wooden frame houses or low-rise housing projects, clearly off the convention-city grid. No wonder Vonnegut wrote “So it goes.”

    Canton: So poorly is Ohio served with public transportation that I was forced to rent a car to go from Dayton Trotwood (a sad shopping center where the Indianapolis bus dropped me) to Canton and Cleveland. I stuck mainly to the secondary roads, often clogged with traffic and slow lights. Unless someone can add a dome, Astroturf, and The Gap to Hometown USA, it will be lost.

    Canton was the saddest city on my travels. Not even the presence of the Pro Football Hall of Fame or William McKinleyism can put a positive spin on the vacant lots and boarded-up storefronts.

    Cleveland: I was back on the bike, and loved much of what I saw downtown in the canyons of Art Deco office buildings.

    Cleveland is more of an extended suburb than a city — if not a state of mind with a football team — although it can quickly change from blocks of lakefront mansions to rows of seedy body shops… emphasis here on the word “body”.

    Buffalo: On my night bike ride into the city from Amtrak’s suburban Depew Station, I passed through a series of depressing slums and at one point had to out-sprint a highwayman who wanted to steal my rig. (“Give me that fucking bike,” is how he introduced himself.)

    The new ghetto arose from the old working class neighborhoods; a nether world in the shadows of subsidized convention centers and urban renewal towers. Buffalo at night is a ghost town, although I loved riding north along Delaware Avenue to the state university.

    In upstate New York, I made a loop around the Finger Lakes through such rustbelt stalwarts as Corning, Binghamton, Syracuse, and Auburn. The delight was Elmira, with its local college that has the Mark Twain writing studio in which he wrote Tom Sawyer and Huckleberry Finn. Ithaca is a labyrinth of universities and dead-end streets that gets my vote for the most confusing city grid in America.

    Syracuse at night — on the bike or waiting at the bus station — felt like the set of a sci-fi movie in which everyone has been vaporized. Binghamton aspires to hipness, but, well, it’s Binghamton. At least Auburn has the prison, and at midnight its strange aurora borealis of klieg lights made my bike vest glow like medieval chain-mail.

    A series of buses and commuter trains took me down to New York City. I had booked on Amtrak, but its Lake Shore Limited was routinely seven or more hours late. One conductor blamed the delays on the weather from the previous winter, although my seat mate said impoverished locals robbed the copper from the track signals.

    At the end of my riding, I think I came across as someone as morose as the novelist Theodore Dreiser, who took what he called “a Hoosier holiday,” at a time when, as he wrote, “America was in the furnace stage of its existence.” But I defy anyone who doesn’t take heart from a Lake Erie sunrise.

    Photo by the author: Downtown Cleveland from Lake Erie

    Matthew Stevenson, a contributing editor of Harper’s Magazine, is the author, most recently, of Remembering the Twentieth Century Limited, a collection of historical travel essays, and Whistle-Stopping America. His next book, Reading the Rails, will be published in 2015. He lives in Switzerland.

  • Long Island Suburbs: How Planners Should Treat Age Spots

    Long Island is the birthplace of suburbia, from colonial-period Brooklyn to Levittown and beyond, and its economy has survived booms and busts since the 1950s. As stagnant as it may be, if it’s anything, it is resilient. Today, its problems mirror those of many older suburban areas scattered across the country, and, like many other suburbs, its problems cannot be solved by simply shoehorning in more development – and more tax revenue. Are policymakers addressing the true thorns in the region’s side: Affordable housing, cost-of-living, taxes, racism and fear of change? Planners nationwide could learn much from Long Island if they looked closely at its successes and its failures, and how both evolved.

    In the push to expand housing after WWII, Long Island’s potato fields became subdivisions that, with the passage of time, became increasingly monochromatic, as well as increasingly expensive. The planners of yesteryear crafted strategies that set national precedents in farmland and open space preservation, while simultaneously working to manage unprecedented residential and commercial expansion. During these boom years, planners urged municipalities to protect open space, resulting in yet another set of national benchmarks in regard to groundwater protection.

    Yet the recommendations for an overtly aggressive open space acquisition program were pared down and never fully capitalized upon. Few, if any, of other recommendations leapt from the leather-bound pages of the academic planning texts to become fully implemented. Planning had its moment in the sun on Long Island, but it was quickly eclipsed by special interests with money to spend and projects to greenlight. Today,the academic approach of the previous decades is mostly gone, with the Island’s growth being managed by development firms and nonprofit stakeholder groups. Our current long-term strategies lack a detached professionalism that is unhindered by political forces and agenda-driven ideas.

    The solution being currently proposed is a call for more “responsible” growth. The question is, if growth got Long Island into this mess, how can it eventually get us out? Multifamily units are being proposed under the umbrella of responsible growth, as is the placement of additional sewers. With the arrival of sewers, it is said that growth will be allowed to flourish, helping to keep the wealthy Millennials, stop the cries of “brain drain” and subsequent regional death, and generate jobs.

    At last month’s Destination LI conference (#LIREDI hashtag on Twitter), a group of Millennials spoke about the need for sewers as well as the need for additional growth of multifamily-type units. It was nice to see a new generation become interested and invested in Long Island, and even go so far as to say that this next generation will “fight” to stay in the region. But there was little mention of the fact that there has been an overall 89% increase of units from 1989 to present, or that groundwater quality is compromised as a direct link to overdevelopment, or about the region’s sole source aquifer that dictates appropriate density levels.

    What are the realities of building truly affordable housing in suburban Long Island’s aging suburbs? How can costs be pared down so developers are enticed to build without relying on density to generate profit?

    Planners by trade have to be optimistic, but they must also be realistic when assessing a region’s needs and growth strategies. The current approach by developers and stakeholders is fueled by optimism, but studies the issues on a shallow level instead of working to solve our long-established problems.

    The biggest one? In each town and village hall across Long Island, and in our Nassau-Suffolk region, municipalities often grant density in places where it is simply not appropriate. If an area has a comprehensive plan in place, development should follow the usage that was already determined. But, more often than not, local government awards variances that drastically increase density under the guise of “responsible growth”. These variances add up to a high density sprawl that is worse than the traditional sprawl that they were meant to replace in the first place. They fly in the face of the professional planning efforts undertaken on Long Island over the previous decades. We need a return to professionalism if we are going to create legitimate and workable solutions.

    Urban planning is not merely saying that development is “responsible,” it’s assessing our regions needs by quantifying market trends, environmental data and resident feedback. Planning for our future should not be about catering to one age demographic, but rather, about addressing the needs of all Long Islanders over the course of the future decades. Instead of planning sessions focused on urging downtown development to attract jobs, planners should be justifying why development should be placed in a given downtown, or anywhere else.

    Many tout the expansion of transit, but few address the marked lack of population density that’s necessary to drive the demand and fiscal support of such expansions, or discuss the MTA’s frequent capital budget shortfalls. Planning should be crafted from a scientific and methodological approach, not from buzzwords, faulty surveys or ideal conditions that are neatly summed up on a PowerPoint slide.

    Saying we need affordable housing is easy. Execution of the concept on Long Island has been extremely difficult for decades. Yet this uncomfortable reality is not discussed on panels. Our regional problems require us to confront our balkanized districts, dissect the unbalanced economics of our real estate development, and deal with a heritage of racism furthered by exclusionary municipal jurisdictions.

    Sheer density won’t change sixty years of racial division, jumpstart our stagnant economy , or upgrade our infrastructure to 21st century standards. And, despite what county officials and a myriad of developers are saying, more sewers alone will not solve our woes. We need a sewer plan that works in conjunction with a robust open space plan, which in turn works to complement our approaches to economic development.

    In other words, we need true regional planning.

    To execute our plans, we need professionals. In recent years, municipalities have cut planning staff, and outsourced critically important planning functions to politically-connected boards and stakeholder groups. In Suffolk, the County merged a once nationally-acclaimed department of planning with the economic development department. Despite what anyone says to the contrary, crafting strategies for economic development is not planning. It is a piece of the puzzle, but there are important distinctions that have been forgotten in recent years.

    The convenient narratives of ‘brain drain’, downtown revitalization, and smart growth make it easy to stand behind a podium and tout the benefits of pure, unhindered economic development. But the elephant-sized problem in the room remains. Only this time, instead of being in a single-family home, the elephant’s room will be in in a shiny, new multi-family complex.

    Richard Murdocco regularly writes on land use and policy issues. A collection of his published work can be found on www.TheFoggiestIdea.org, and you can follow him on Twitter @TheFoggiestIdea.

    Flickr photo by Sean Marshall, Weber House in Hempstead, Suffolk County, on Long Island. A plaque in front of the house, built 1947, commemorates one of the first homes in Levittown, New York, considered America’s first planned suburb.

  • RIP, NYC’s Middle Class: Why Families are Being Pushed Away From the City

    Mayor de Blasio has his work cut out for him if he really wants to end New York’s “tale of two cities.” Gotham has become the American capital of a national and even international trend toward greater income inequality and declining social mobility.

    There are things the new mayor can do to help, but the early signs aren’t promising that he will be able to reverse 30 years of the hollowing out of the city’s once vibrant middle class.

    As the cost of living has skyrocketed while pay has stagnated except for those at the very top, New York has shifted from a place people go to make it to a place for those who already have it made, or whose families have.

    And once here, the rich are indeed getting richer even as the rest of the city is barely holding on.

    Manhattan is now the most unequal county in America (it was 17th in 1980), with a Gini coefficient — which measures the disparity between the richest and poorest residents — higher than that of Apartheid-era South Africa.

    Between 1990 and 2010, the city’s 1% saw their median income shoot up from $452,415 to $716,625 in 2010 dollars, even as the bottom 60% hardly saw their incomes budge at all, according to a recent City University study. The trend precedes Michael Bloomberg, the billionaire mayor who envisioned New York as a “luxury city,” and it won’t be easy for de Blasio to reverse — especially as he rolls out pricey new public-employee contracts and programs like universal pre-K that further expand the city’s dependence on its wealthiest citizens.

    In 2009, the 0.5% of New Yorkers who made $1 million or more accounted for 27% of the city’s income (nearly three times their share nationally), and an even higher share of its tax take. But while the smart set that attends President Obama’s frequent Manhattan fundraisers has prospered, in no small part thanks to low-interest Federal Reserve policies that have helped big banks more than working people, just across the Harlem River roughly one in three Bronx households lives in poverty — making it the nation’s poorest urban county.Over the Bloomberg years, New York was the national leader in both luxury housing and in homelessness — with a 73% jump in the number of homeless families here. Last January, an unprecedented 21,000 children were in the city’s shelter system each night. This year, that number is rising.

    And as the city becomes more economically unequal, it’s also become more racially segregated. Demographer Daniel Herz’ census analysis shows New York is now America’s second most racially divided city, behind only Milwaukee.African-American incomes in New York are barely half those of whites, as compared to nearly 70% in Phoenix and Houston.

    And New York City now has the nation’s single most segregated public school system, according to a devastating report from the Civil Rights Project at UCLA.

    As the 2014 report put it: “In 2009, black and Latino students in the state had the highest concentration in intensely-segregated public schools (less than 10% white enrollment), the lowest exposure to white students, and the most uneven distribution with white students across schools.”

    Nowhere are these divergences more obvious than in nouveau hipster and increasingly expensive Brooklyn. In my parents’ native borough, the average income has actually dropped between 1999 and 2011, despite huge increases of wealth in areas closer to Manhattan.

    Roughly one in four Brooklynites — most of them black or Hispanic — lives in poverty.

    Bloomberg’s notion that if “we can find a bunch of billionaires around the world to move here, that would be a godsend,” with prosperity trickling down, hasn’t panned out, at least for most New Yorkers. The billionaires came, bought and flourished, but the same can not be said for Gotham’s middle and working classes.

    Using Bureau of Economic Analysis data, analyst Aaron Renn estimates that the city’s per capita GDP has grown a bare 2.3% since 2010, below the mediocre 3.8% national rate and behind such traditional hard-luck cases as Buffalo, Cleveland and Baltimore.

    The percentage of New Yorkers living in poverty has actually gone up by 1.1% since 2010, while household income has been flat.

    Rather than forge a more upwardly mobile society, New York epitomizes what Citigroup researchers have labeled a “plutonomy,” an economy and society driven largely by the investment behavior and spending of the uber-rich. This creates great demand for low-end service workers — dog-walkers, baristas and waiters — but not much for New York’s middle or aspiring middle class.

    Adjusting for the cost of living here, the average paycheck in New York is one of the lowest of any major metropolitan area. Put otherwise, working New Yorkers pay a huge premium to live in the five boroughs, one that repels middle-class individuals and families who aren’t compelled to be here.

    The exodus of the middle class has been ongoing for 30 years, with New York by one measure now having the second lowest share of middle-income neighborhoods of America’s 100 largest cities.As the middle class has waned, even exemplars of the celebrated creative class — musicians, artists, writers — find the going increasingly rough, and unrewarding. Laments rock icon Patti Smith: “New York has closed itself off to the young and the struggling. New York City has been taken away from you.”

    This is the dynamic New Yorkers elected de Blasio to fix. And he’s right the reality of rising inequality and, more important, diminishing opportunity, must be confronted.

    Critically — and here de Blasio has better instincts than his predecessor — more emphasis needs to be placed on the outer boroughs. Even if Manhattan remains the prototypical luxury city, the rest of New York can be reinvented as a generator of middle-class jobs and opportunities.

    One approach that’s paid dividends for workers in cities such as Houston, Dallas-Ft. Worth, Nashville and Pittsburgh is to concentrate on diversified economic growth.

    Certainly some middle class jobs could be created by boosting such things as the port and logistics, resuscitating industries such as food processing and specialized household goods, and rolling out policies that encourage, rather than overregulate, smaller firms in the business-service industry.

    But de Blasio’s press to bring in more tax revenue to pay for ambitious new programs, more generous social services and new contracts for city workers have the perverse effect of doubling down on Bloomberg’s bet on the wealthy.

    His ambitious ramping up of green-energy policy could be the straw that breaks the back of what remains of the logistics and manufacturing industries in New York, something that has already occurred in California.

    And his kowtowing to the teachers union and attempted assaults on charter schools threaten to further undermine the effectiveness of public education, something vital to middle and working class residents.

    In fact, the effect of de Blasio’s policies may turn out to be more neo-Victorian than progressive. Rather than new homeowners, the city may see a greater concentration of people dependent on government largesse.

    The poor-door phenomena, with a few lucky members of the lower class winning subsidized units in buildings for the rich, but with separate entrances and no access to luxury amenities, recreates not social democracy but the Victorian upstairs-downstairs society.

    The critical point is this: New York is losing its role as a place of opportunity, and the de Blasio toolbox is unlikely to put back the ladder that’s been pulled up.

    A great city does not only serve the rich, transforming others into their servants or recipients of noblesse oblige. New York need to be, as Rene Descartes described Gotham’s founding city, 17th century Amsterdam, “an inventory of the possible.”

    That must hold true for most New Yorkers, not just for the very rich.

    This piece first appeared at the New York Daily News.

    Joel Kotkin is executive editor of NewGeography.com and Roger Hobbs Distinguished Fellow in Urban Studies at Chapman University, and a member of the editorial board of the Orange County Register. His newest book, The New Class Conflict is now available at Amazon and Telos Press. He is author of The City: A Global History and The Next Hundred Million: America in 2050. His most recent study, The Rise of Postfamilialism, has been widely discussed and distributed internationally. He lives in Los Angeles, CA.

    Photo by Kevin Case from Bronx, NY, USA (Bill de Blasio) [CC-BY-2.0], via Wikimedia Commons

  • How Segregated Is New York City?

    The online reaction to the reports on racial segregation in New York state’s public schools reminded me, yet again, that most people think of New York as an integrated city, and are surprised or incredulous when that impression is contradicted.

    This is somewhat jarring, since virtually every attempt to actually measure racial segregation suggests that New York is one of the most segregated cities in the country. This University of Michigan analysis of 2010 Census data, for example, suggests that New York is the second-most-segregated metropolitan area in the U.S., exceeded only by Milwaukee, and that about 78% of white and black people would have to move in order to achieve perfect integration. (Chicago’s corresponding number is just over 76%, good enough for third place.)

    Why is this so surprising? One obvious reason, I think, is that most people’s conception of New York is limited to about 1/2 of Manhattan and maybe 1/6 of Brooklyn, areas that are among the largest job and tourist centers in the world. As a result, they attract people of all different ethnic backgrounds, especially during the day, even if the people who actually live in those areas tend to be monochromatic. Imagine, in other words, trying to judge racial segregation in Chicago by walking around the Loop and adjacent areas: you would probably conclude that you were in a pretty integrated city.

    But it goes beyond that, I think. Segregation in New York doesn’t look like segregation in Chicago, or a lot of smaller Rust Belt cities. For one, there just aren’t very many monolithically black neighborhoods left in New York. Here, for example, I’ve highlighted every neighborhood that’s at least 90% African American (see note on method at the bottom of this piece):


    NYB90

    Were we to do this in Chicago, half the South and West Sides would be lit up. But in New York, black neighborhoods have become significantly mixed, in particular with people of Hispanic descent. This is a phenomenon Chicagoans are used to in formerly all-white communities – places like Jefferson Park or Bridgeport, which as recently as 1980 were overwhelmingly white, now have very large Latino and Asian populations – but in New York, it’s happened in both white and black neighborhoods.

    That said, white folks in New York have still on the whole declined to move to black areas, except for some nibbling along the edges in Harlem and central Brooklyn. That means that instead of measuring segregation the way we might in Chicago – by looking for very high concentrations of a single ethnic group – it makes more sense to look for the absence of either white or black people.

    Here, then, I’ve highlighted all the places where white people make up less than 10% of the population:


    NYW10

    It’s a lot. And, correspondingly, here are all the places where black people make up less than 10% of the population:


    NYB10

    It’s also a lot. And if we put the two maps together, we see that these two categories cover the overwhelming majority of NYC:


    NY10

    The same pattern holds pretty well if we lower the threshold to no more than 5% white or black:


    NY5

    And there are even a significant number of areas that are truly hypersegregated, with fewer than 2% of residents being either white or black:


    NY2

    Because I now love GIFs, here’s a summary GIF.


    NYSeg

    What does all this tell us? For one, it confirms graphically what the Census numbers suggested, which is that the median black New Yorker lives in a neighborhood with very few white people, and vice versa.

    But it also suggests a racial landscape that looks different from that of Chicago, and lots of other American cities, in important ways. In particular, where Chicago has a relatively simple racial geography – white neighborhoods at various levels of integration with Hispanics and Asians to the north and northwest, black and Hispanic neighborhoods to the south and west, with only a few small islands like Hyde Park and Bridgeport that break the pattern – New York’s segregated neighborhoods form a more complex patchwork across the city. That means that while a North Sider in Chicago might go years without having to even pass through a black neighborhood, lots of white New Yorkers have to get through the non-white parts of Brooklyn or the Bronx to reach job and entertainment districts in Manhattan or northern Brooklyn.

    I imagine that structural-geographic fact, combined with New York’s relatively high level of black-Hispanic integration, goes a long way to explaining my anecdotal experience that white New Yorkers tend to be less ignorant and scared of their city’s non-white neighborhoods than white Chicagoans are of Chicago’s. (There’s some interesting research that suggests white people tend to be more sympathetic to brown people, and their neighborhoods, than black people and theirs.) There’s also, of course, the fact that Chicago’s segregated non-white neighborhoods tend to have much higher violent crime rates, and much more modest business districts, than New York’s, although that’s likely both an effect and cause of their relative isolation.

    All of this is another reason that I’m kind of excited about the growing entertainment and shopping district on 53rd St. in Hyde Park, since the more that the South Side has “neighborhood downtown” strips that draw people from across the city, the more likely North Siders and suburbanites are to travel through the black and Latino neighborhoods that surround them, observe that many of them are actually quite nice, become less committed to shunning them, and thus contribute less to the social and economic dynamics that have created the institution of the ghetto, and the poor job prospects, failing schools, and high crime rates that accompany it.

    In conclusion: New York is super segregated, but the numbers aren’t everything.

    Also, let me have another Talk To Me Like I’m Stupid moment: suggestions for books about the racial history of New York? What’s the equivalent of Making the Second Ghetto or Family Properties? I’ve already read Caro’s Moses book.

    Note:  This piece focuses on white-black segregation because that, for various social and historical reasons, has been by far the most significant geographic separation in American cities, certainly in the Midwest and Northeast. But by far the second most significant separation – white-Latino segregation – is also very extreme in New York. The same Census analysis that found NYC was the second-most-segregated metro area in terms of white and black people found that it was the third-most-segregated metro area in terms of white and Latino people. That’s obviously not the end of the story either, though. If you know about or are curious about some other aspect of segregation, leave a comment.

    Daniel Hertz is a masters student at the Harris School of Public Policy at the University of Chicago. This post originally appeared in City Notes on April 14, 2014.

    Photo by Mike Lee

  • Battle of the Upstarts: Houston vs. San Francisco Bay

    “Human happiness,” the Greek historian Herodotus once observed, “does not abide long in one place.” In its 240 years or so of existence, the United States has experienced similar ebbs and flows, with Boston replaced as the nation’s commercial capital first by Philadelphia and then by New York. The 19th century saw the rise of frontier settlements—Cincinnati, Pittsburgh, Cleveland, and finally Chicago—that also sought out the post position. In the mid 20th century, formerly obscure Los Angeles emerged as New York’s most potent rival.

    Today we are seeing yet another shuffling of the deck among American regions. New York remains the country’s preeminent city, but its most powerful rivals are likely to be neither Chicago nor Los Angeles, but rather two regions rarely listed in the hierarchy of influential regions: the San Francisco Bay Area and Houston.

    Making of a new pecking order

    The Bay Area does not rank among the 20 top global cities in most studies, such as the 2014 A.T. Kearney listings. In the respected rankings of the London-based Globalization and World Cities Network, the Bay Area stood below not only Chicago, which is considered an “alpha” global city, but also such places as Toronto and Mexico City.

    Yet such rankings vastly underestimate the power now being wielded by the San Francisco region. As the headquarters for the largest concentration of cutting edge tech firms in the world, the Bay Area increasingly shapes the operations of companies from manufacturing and marketing to retail and media. And given that roughly half the nation’s venture capital is still being lavished on area start-ups, it is not surprising that Silicon Valley ranks number one in the world as a place to launch tech ventures, according to the Startup Genome.

    Tech dominance, according to a recent study on global cities conducted by my firm NewGeography, explains why the San Francisco Bay Area nudges out much larger Los Angeles for bragging rights on America’s Pacific Rim. Technology leaders, including Intel, Apple, Oracle, Google, and Facebook, are based in Silicon Valley, while Asian global tech firms such as Samsung also have North American headquarters there. Top technology firms from other cities often have their key R&D functions in the Bay Area. Even a frugal firm like Wal-Mart is enlarging its Silicon Valley presence.

    The current social media bubble will surely pop, but as Michael S. Malone and others have noted, the Bay Area’s preeminence will likely continue, fueled by its unique concentration of engineers, entrepreneurs, and risk capital. As a lure for the ambitious, Silicon Valley and San Francisco are replacing Wall Street. Google alone has 1,200 employees who formerly worked for large U.S. investment banks, and migration from the Big Apple to California is now at its highest level since 2006.

    Much of the appeal of the Bay Area is a result of happy coincidence of history and geography. The Bay Area—where I went to school and got my start in journalism, and where parts of my family have resided since the ’50s—has been blessed with excellent higher education and is centered around what is arguably America’s most beautiful city. Good weather, beautiful vistas, and access to nature have made the Bay Area a natural lure for people who can afford to live wherever they want.

    The Energy Capital

    Houston, where I have been working as a consultant, hardly qualifies as one of the most physically attractive or temperate cities. San Francisco may well have been, as Neil Morgan suggested a half century ago, “the Narcissus of the West,” but Houston, in most accounts, has been widely disparaged as hot, steamy, ugly and featureless. Yet despite this, its ascendency is no less compelling than that of the Bay Area.

    Houston’s trump card, like the Bay Area’s, resides in its control of one strategic industry, in this case energy. The majority of traded foreign oil majors, such as London-based Shell and British Petroleum, have their U.S. headquarters in Houston, and even companies based elsewhere boast a significant Houston presence. For example, Exxon, although it has its headquarters in Dallas-Fort Worth, is opening a massive Houston campus that will be home to 10,000 employees. Additionally, a majority of the world’s largest oil services companies, such as Baker Hughes, Schlumberger, and FMC Technologies, are based in Houston.

    Altogether, more than 5,000 energy-related companies call Houston home. The city employs three times more people in energy than its second place rival, Dallas-Ft. Worth, and more than the next five cities combined. This growth is likely to accelerate because foreign companies, notably from Germany, have begun buying up energy firms in the area, including Siemens’s recent $7.6 billion dollar purchase of the Dresser Rand Group, an energy equipment firm.

     Houston has added more than 10 percent more jobs since 2008, almost twice the increase in the Bay Area. Since 2000 Houston’s employment figures have shot up 32 percent, while the Bay Area has grown by barely 4 percent. And it’s not just energy that’s driving things—Houston is now the nation’s largest export port and boasts the world’s largest medical center. It has also become, by some measurements, the most ethnically diverse (PDF) region in the country. In the last decade, for example, Houston increased its foreign-born population by 400,000, second only to New York and well ahead of much larger Los Angeles.

    The big losers: LA and Chicago—but also New York

    In the past century New York and Los Angeles have dominated American media. This is being severely undermined by the Bay Area’s digital economy. Since 2001, notes Mark Schill at Praxis Strategy (where I am a senior fellow), book, periodical, and newspaper publishing—all traditionally concentrated in the New York area—have lost some 250,000 jobs, while Internet publishing and portals generated some 70,000 new positions, many of them in the Bay Area or Seattle.

    Google and Yahoo are already among the largest media companies in the world. (Yahoo now refers to itself as a digital media company rather than a technology company). With the ubiquity of its iTunes platform, Apple exercises ever greater control over consumer distribution of entertainment products such as music and video; Netflix, Hulu, and YouTube could become the studios of the future. This could shift global media decision-making from its familiar New York-Los Angeles axis to the Bay Area.

    This is particularly bad news for Los Angeles, whose grip on the entertainment industry was weakening even before Silicon Valley’s rise. Since 2004, LA’sentertainment industry lost roughly 11 percent of its jobs, as production shifted to Canada, Louisiana, and other locales.

    The decline in media employment comes on the heels of a rapid industrial decline—the area has lost more than 90,000 aerospace jobs since the end of the Cold War. The situation is so dismal that a report issued by many of the region’s top business and political leaders concluded that the city “is barely treading water while the rest of the world is moving forward.”

    Chicago’s situation is arguably even worse, but it is more threatened by Houston, which has already passed the Windy City in numbers of corporate headquarters. Since 2010, when U.S. industry began recovering, Houston manufacturing employment expanded by more than 17 percent, compared to flat growth in Chicago.

    “Houston is the Chicago of this era—like the old Chicago,” remarks David Peebles, who runs the Texas office of Odebrecht, a $45 billion engineering firm based in Brazil. “In the ’60s you had to go to Chicago, Cleveland, and Detroit. Now Houston is the place for new industry.”

    With its industrial base eroding, Chicago is no longer a strategic hub for any key industry. Outside of trading commodities, it also no longer serves as a major global financial center. Regional population growth has been meager over the past decade, and the city’s own pension issues may be worse than Detroit’s.

    Chicago retains its brilliant skyline, great cultural institutions, powerful political influence, and a strong business community. But its days of America’s number two city are long gone, and, as we enter the mid-2000s, it is falling behind not only Los Angeles and New York but the two rising Texas cities, Houston and Dallas, both expected to pass the “city of big shoulders” in population by mid-century, or earlier.

    Engineering the Future

    In the coming decades, New York will remain the nation’s top global city, due to its remarkable urban legacy, the power of Wall Street, and the entrenched traditional media. But its Achilles heel is a lack of the engineering power necessary to address key challenges such as the digitization of industry, energy efficiency or climate change. New York is profoundly weak in engineering talent (PDF)—ranking 78th out of 85 metropolitan areas in engineers per capita.

    In contrast, the Bay Area represents the epitome of engineering power, with the San Jose area boasting the largest per capita concentration of engineers of any major metropolitan area. The Bay Area’s power to develop new technologies and its almost unfathomable wealth will continue to undermine traditional institutions, from Hollywood and Wall Street to business services, tourism, automotive, and even aerospace industries.

    Far less appreciated, Houston, rather than being a southern city of duller wits, actually ranks second in engineers per capita. If the Bay Area is master of the digital economy, Houston ranks as the technological leader of the material one; it is the capital for the energy-driven revival of U.S. industry, not only in Texas but throughout the old industrial heartland. Revealingly, Houston actually has seen far more rapid growth in both college educated and millennial population since 2000 than the Bay Area, as well as New York, Chicago, and Los Angeles.

    Rival Approaches to Urbanism

    The Bay Area, for all its vaunted progressivism, increasingly resembles a “gated community” whose high prices repel most potential newcomers, particularly families. Already by far the nation’s least affordable city—only 14 percent of current residents can possibly afford to buy a home—it represents a growth model that is by definition exclusive, almost a throwback to medieval forms where the rich clustered inside the city gates.

    High housing prices, notes economist Jed Kolko, account for the fact that, despite the boom, population growth in the Bay Area remains well below national averages. From 2000 to 2013, the region lost approximately 550,000 domestic migrants. Despite sizable immigration, the regional population growth rate has fallen below the national average.

    In contrast, Houston is among the fastest growing regions in the country, with rapid increases both in domestic migrants and newcomers from abroad. This stems from both lower housing prices and a growth model that is far more amenable to higher paid blue collar and middle management positions. Since 2000, Houston’s population has grown by 30 percent compared, three times that of the Bay Area.

    Ironically, Houston’s growth has been more egalitarian than that of the notionally super-progressive San Francisco region. A recent Brookings report found that income inequality has increased most rapidly in what is probably the most left-leaning big city in America, where the wages of the poorest 20 percent of all households have actually declined amid the dot com billions.

    This inequality has a distinct racial element. The Bay Area gap between white residents (who dominate the tech economy) and minorities is among the highest in the nation while, during the boom, income has fallen for Hispanics and African-Americans, according to Joint Venture Silicon Valley.

    This racial divergence is far less pronounced in Houston, while the growth of poverty since 2000 has been slower, increasing at one third the rate of New York and San Francisco, and half that of Los Angeles. The Texas city may lack the great views of San Francisco, but Houston has turned out to be a better city for middle class minorities. Homeownership among African Americans stands at 42 percent and for Latinos at more than 53 percent; this compares to 32 and 37 percent in the Bay Area.

    Perhaps the biggest differences can be seen in families. Of the nation’s 52 largest metropolitan areas, the Bay Area has the lowest percentage, 11.5 percent, of people ages 5 to 14. In Houston, 23 percent of the population fits this age category. In particular San Francisco is notoriously inhospitable to families, with the lowest percentage of kids of any major city.

    The two regions also reflect very different urban forms. The Bay Area’s leadership has opted to favor dense “in fill” growth and sought to restrict suburbandevelopment. Houston has taken a different tack. As its population has expanded, so too has the metropolitan area. This includes the development of many planned communities that appeal to middle class families and many immigrants. In 2013, Houston alone had more housing starts than the entire state of California.

    But it would be wrong to dismiss Houston’s model as merely “sprawl.” Instead it is better seen as simply expansive. In fact, arguably no inner ring in the country has seen more rapid growth, with high-rise, mid-rise and townhouse development in many long neglected districts. The increase in high-density housing tracts (more than 5,000 per square mile) since 2000 has been almost ten times higher than the Bay Area.

    The Political Battle for the Future

    Increasingly America’s future will be determined by these two cities, with the issue of addressing climate change at the fore. Much of the Bay Area’s leadership—led by the likes of Google Chairman Eric Schmidt and investor Tom Steyer—have all but declared war on the oil and gas industry. Several colleges and universities in the region, including Stanford, have shed their energy holdings, and Silicon Valley has nurtured movements such as Bill McKibben’s 350.org that seek to revoke the “social license” of big oil, a tactic used previously against the tobacco companies and firms that did business in apartheid South Africa.

    The elites of Silicon Valley and San Francisco are not just interested in saving the earth; they wish to profit from a change in the nation’s energy economy. Google, Sun Microsystems founder Vinod Khosla, and top venture capitalists such as John Doerr have bolstered their already ultra-thick wallets by capitalizing on “green energy” subsidies and outright grants from various levels of government. Given these investments, it’s easier to understand the Valley’s support for draconian climate change legislation, complete with attempts to demonize “Texas oil.” (One won’t see such populist zeal on , say, increasing capital gains rates.)

    The Valley’s hostility to fossil fuel energy, and its jihad to destroy an entire industry, is only barely recognized in Houston. I also have never heard anyone there suggest that Silicon Valley should be closed down as a danger to the planet (or at least a threat to the attention span of younger Americans). Houstonians, particularly in the energy industry, generally lack media savvy, which is one reason why energy is widely rated as the country’s least popular industry. Also missing, thankfully, is the sense of entitlement and self-congratulation one finds in the Bay Area. But once the intention to devastate the oil and gas industry is better understood, expect the energy capital to square off against the tech center, generating what may be the regional battle royal of our era.

    This piece originally appeared at The Daily Beast.

    Joel Kotkin is executive editor of NewGeography.com and Roger Hobbs Distinguished Fellow in Urban Studies at Chapman University, and a member of the editorial board of the Orange County Register. His newest book, The New Class Conflict is now available at Amazon and Telos Press. He is author of The City: A Global History and The Next Hundred Million: America in 2050. His most recent study, The Rise of Postfamilialism, has been widely discussed and distributed internationally. He lives in Los Angeles, CA.

    Photos courtesy of University of Texas Health Science Center at Houston Office of Communications and Vincent Bloch.