Tag: New York

  • The Last Stop in Brooklyn

    Getting out was essential but I was stuck in Brooklyn until I could plot my escape…

    There was no such thing as “diversity” in white, working-class Bensonhurst in the 1950s. Only the Jews and the Italians.

    My tribe descending from Yiddish-speaking East European immigrants who settled in cramped tenements and worked in the schmatta trade of Manhattan’s lower east side.

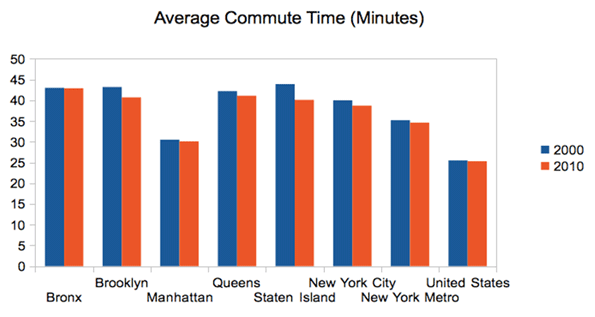
    Moving – after the war – across the East River to apartments with bedrooms and bathrooms; a 50 minute commute to “the city” on the west end line of the BMT. Sharing the neighborhood with Southern Italian Catholics, a few Irish and fewer blacks and Puerto Ricans who worked for – but rarely lived among – us white “ethnics.”

    My father drove a cab six days a week and my mother typed for a living. We weren’t poor but sometimes for dinner my mother would serve macaroni with ketchup. Sally and Irv enjoyed themselves occasionally – they played penny poker with friends on Saturday night, she watched Liberace, he watched the Yankees, and now and then they would go out for “Chinese.”

    But much of the time they were frustrated and miserable. Irv was known to friends and cousins as “easy going” and – though he didn’t drink – could “snap” and do a lot of damage. Sally was always worrying and felt ashamed of her divorce in the 1940s. Her daughter, my “half” sister, twelve years older, lived with us and hated my father (for good reason).

    I was acting out at home – yelling, cursing and defiant – and in junior and senior high: cutting classes and on my way to becoming an official “truant” and dropout.   In the grip of adolescent anguish, by 14 I would ruminate incessantly about girls, particularly the local Italians, whose appeal was intensified by a taboo that would prevail into the 1970s and beyond.

    Even my pre-pubescent preferences leaned in that direction, stimulated by those lusty Italian ladies of Bensonhurst. Cleavaged, tight-skirted and toe-nail polished, they seemed more overtly libidinal than the Jewish women in the neighborhood. My fascination was a distraction from family problems and a way to imagine my escape.  I enjoyed other diversions, as well: scooting around the corner to play punchball or pedaling my bike to the Cropsey Avenue Park or buying an egg cream – for twelve cents – on Bay Parkway and 86thStreet.

    Rivalries erupted from time to time between the Jewish and Italian boys. I was involved in some of these courtyard fist fights. Though the violence was minimal (no weapons: just a few punches in the face, a headlock and then a submissive “I give.”), these neighborhood battles would not only contest virility but would reveal an ethnic-based class resentment.

    While many of my Italian peers became very successful academically, professionally and financially, it was the Jewish kids who were most eager to leave the old neighborhood (this is decades before the borough became trendy for Gen X bohemians). This ethic of upward and outward mobility, built into Jewish cultural DNA, has fashioned a Jewish-American Diaspora – from Hester Street to the “outer boroughs” to the upper west side, Hempstead Long Island, Southern California and points in between.

    For a time, I resisted the traditionally available route for a smart Jewish kid to get ahead.  Depressed and anxious, I was flunking out of school.  Developing instead the style of free spirit, a malcontent and a wanderer; a persona which required that I reject my parent’s values with a simplistic, snotty and condescending critique of them as vacuous and conventional.

    This fit right in with “generation gap” rhetoric and prevailing notions of liberation pulsing through the counter culture in 1967.  I could distance myself from my painful past and pathetic parents, disparage their “material values” – appalled, for example, by their choice to cover their sofa with clear, thick, sticky plastic – and fashion myself as superior.

    It would take awhile before I would better understand how my parent’s lives shaped my political values. By my late teens I saw as merely incidental the fact that they had joined the ranks of  New York’s unionized civil service. My father was forced out of taxi driving by his health, becoming a clerical for the state insurance fund; my mother putting her fast fingers to work for the city’s board of education.

    But a lonely 17-year-old had no time for such reflections.  On nights when I had trouble sleeping, I would slink out of my parent’s apartment to wander the streets. There was always the faint hope of an exotic sexual encounter, but most of these three-in-the-morning outings were a time for thoughtful solitude.

    Walking past the Coney Island Terminal – the last stop for Brooklyn-bound trains from Manhattan – just a few blocks from the Atlantic Ocean and the famous Boardwalk, Aquarium, Cyclone and Nathan’s, I was ruminating over my academic circumstances.

    In a few hours, I would be starting a new high school. (My parents and I had, in fact, deserted Bensonhurst – but only barely – relocating a few neighborhoods south to Brighton Beach which, ten years later, would take in thousands of Soviet émigrés and gain national fame as “Odessa by the Sea.”)

    I stayed up all night, walked along Surf Avenue as far as “Seagate,” (one of America’s oldest gated communities on the western edge of Coney Island) and – somewhere along the way – decided to stop screwing around in school.

    I could tell this was a big deal.  Later in life when I started to chart these pivotal events, I would mark my Surf Avenue expedition as the first of many.

    That semester in Lincoln High I stuck to my resolve, dropping bookkeeping and merchandising, flipping back to a college prep curriculum, re-taking failed classes – geometry, biology – and planning an extra year in high school.

    Though I would finish Lincoln with a weak overall record, my academic performance improved substantially the final two years – enough to let me shop around for a college which would recognize my potential.

    The last stop on my exit from Brooklyn would be the NYU psychology clinic for nine months of analytic psychotherapy with a grad student who would later become a successful New York analyst. Nowadays, concerned and proactive parents who detect problems in their kids are quick to refer them to psychologists for therapy and psychiatrists for medication. But this was my initiative and I jumped at the chance to see a “shrink.” Twice a week I rode the subway into lower Manhattan and – for 50 cents a session – began what would be decades of various forms of psychotherapy (including a brief period in which I aspired to be a therapist myself).

    Coincidentally – and ironically (given my ultimate career choice) – in 1970, the NYU psychology clinic building was located at 23-29 Washington Place which, 60 years earlier (then known as the Asch Building) was the site of the Triangle Shirt Waste Factory fire which killed 146 immigrant garment workers – mostly young Jewish women.

    I didn’t find out until years later that the building held such enormous historical significance; that this epic tragedy – which triggered fire code and workplace safety reforms across the country – took place at the spot where I was preparing for my life as an adult.

    Though oblivious to quite a bit happening around me (preoccupied with, among other things, overcoming my awkwardness with girls), I was however starting to absorb some of what was going on in the world.

    I could recount stories here about my cultural and political “awakenings” – tying my personal development to iconic historical events: the M.L. King and Bobby Kennedy killings, Woodstock (I was there), the Democratic National Convention police riot (I wasn’t there) – but I’ll save for another time my detailed reflections on this period in American culture and politics. Hasn’t enough already been said about how sex, drugs and rock ‘n roll changed our lives?

    Though I was linked to prevailing counter-culture sentiments – appropriately appalled by the War in Vietnam and other U.S. “atrocities” – my political views were confined (or should I say restrained) by a mainstream liberal tendency that I’ve maintained to this day.

    Sure I was impressed by Ivy League SDSers taking over the dean’s office – I respected their dedication to social causes (and the fun they seemed to be having). But my own working-class resentments may have been surfacing in reaction to what was then perceived – not always correctly – as the “privileged” student protesters of American middle class families.

    My working-class “liberal populism” reflected my parent’s political values pretty closely (though I couldn’t know this at the time).  One example would be my lack of resistance to Hubert Humphrey in the 1968 presidential.  The “no difference” argument didn’t hold as I lined up happily with New Deal Labor Dems to try to beat Nixon.

    I also took an intense interest in the reform movement in Eastern Europe against communist totalitarianism.  While I assume most American liberals and radicals at the time aligned with Czechoslovakians in their protest against Soviet tyranny, I felt a particular affinity for the young reformers.   My revulsion to Soviet Communism was sealed for life when Russian tanks and troops crushed Alexander Dubcek’s Prague Spring.

    I don’t want to make too much of all this – I was just a kid – but I always felt a slight pull to the political center and couldn’t quite wrap my head around radical-chic notions about the Panthers, Mao or a range of utopian ideas espoused by elements of the new left. Though I might have looked like one, I was not a revolutionary.

    Twenty years later, I would find a very nice fit within the American Labor Movement, navigating comfortably among the so-called old guard and the new generation of union militants.  I would develop a revisionist view of Sally and Irv, less critical of their values and more appreciative of how a few extra dollars in their pockets – thanks partly to the New York public sector unions – could make a big difference in workers’ lives.

    I would also take on a more balanced – you could say compromised – view on the potential for personal transformation and social change.  Economic conditions do shape peoples lives, but individual choice enters the mix.  America – at its best – gives you a shot (at least it used to) and you make of it what you will.

    As a Brooklyn, working-class, Jewish American – introspective and inclined toward progressive (but practical) politics – I feel lucky to have come as far as I have.

    I’ve spent my life trying to overcome an agitated mother and angry father.  By 10, I was bratty and foul-mouthed; by 13, sexually-fixated and withdrawn; by 16, defiant and delinquent.  To compensate, I would develop very subtle behaviors to conceal my feelings of isolation.

    But I’m getting ahead of myself.  By the end of the 1960s, these formations were incubating.  In the 1970s I would work on my narrative: success on my own terms and an ongoing struggle for American justice and personal salvation.

    I would also figure out that blaming parents or “society” for low self-esteem – even if it opens the door to self-acceptance – can only take you so far.

  • Facebook’s False Promise: STEM’s Quieter Side Of Tech Offers More Upside For America

    Facebook‘s botched IPO reflects not only the weakness of the stock market, but a systemic misunderstanding of where the true value of technology lies. A website that, due to superior funding and media hype, allows people to do what they were already doing — connecting on the Internet — does not inherently drive broad economic growth, even if it mints a few high-profile billionaires.

    Of course Facebook is a social phenomenon that has affected how people live and interact, but its economic impact — and future level of profitability — is less than clear. This stands in sharp contrast to Apple‘s iTunes, which has become a new distribution platform for small software companies and musicians, not to mention the role of Amazon in the distribution of books and other products.

    From the standpoint of economic development, it’s time to focus on the growing divergence between two different aspects of technology. One is largely an information sector that focuses on such things as information software (think Facebook or Google), publishing and entertainment. For most journalists and urban theoreticians, this is the “sexy” sector, particularly since it tends to employ people just like them: younger, products of elite college educations, often living in “hip and cool” places like San Francisco, Manhattan or west Los Angeles.

    Then there’s a larger, less-heralded group of workers that my colleague Mark Schill at Praxis Strategy Group has focused on: those in STEM (science-, technology-, engineering- and mathematics-related) jobs. These workers perform technology work across a broad array of industries, including but not limited to computers, media and the Internet, representing some 5.3 million jobs in the nation’s 51 largest metropolitan areas. This compares to roughly 2.2 million jobs classified as in the information sector in these 51 regions.

    These STEM occupations are about harnessing technology to improve productivity in mundane traditional industries and the service sector. STEM workers are as likely, if not more so, to be working for manufacturers, retailers or energy producers as for software firms. These workers epitomize the notion of technology, as the French sociologist Marcel Mauss once put it, as “a traditional action made effective.”

    The information sector may be increasingly important, but it is STEM workers, working in a diverse set of industries (including information), who hold the broader hope for the U.S. economy. Over the past decade, the information sector has created many stars, but about as many flameouts. Overall information employment peaked in 2000 at 3.6 million jobs; by 2011 this number had dropped by almost a million. Things have not much improved even in the current “boom”; between February and May this year, the sector lost over 8,000 jobs.

    Essentially the information sector has created a huge amount of churn, as the nature of its employment changes with shifts in technology. For example, the software sector within information has seen real growth, adding some 10,000 jobs the past two years, while other parts of the information sector have suffered significant drops. These include, sadly for aged scribblers, traditional publishing, such as newspapers and book publishing, which has gone from nearly 1 million jobs in 2002 to under 740,000 in May of this year.

    With Facebook stock in the tank, and other major social media sites languishing, the current “boom” may prove among the shortest-lived in recent memory. Shares of less well-anchored companies — meaning those with only a vague outlook for long-term profits — such as Zynga and Groupon have fallen dramatically. The market for the next round of ultra-hyped IPOs also seems to be dissipating rapidly. The carnage has led at least one analyst to suggest Facebook’s fall could “destroy the U.S. economy.”

    Fortunately the overall picture in technology is more hopeful than you’d understand from reading about social media startups. STEM employment has grown 3% over the past two years, more than twice the national average. In the 51 largest metros areas, 150,000 STEM jobs were added from 2009 through 2011. More important still, this reflects a long-term pattern: Over the past decade, STEM employment — despite a drop during the recession — expanded 5.4%.

    These two different classifications underpin geographical differences between and within regions. Sometimes the “hot” areas don’t look so great when it comes to actual job creation in these generally well-paying fields.

    Silicon Valley’s social media boom, for example, may have propelled it once again, at least temporarily, into the ranks of the fastest-growing employment centers. Yet it’s not seeing the gains in STEM jobs that took place during earlier Valley booms in the ’80s or ’90s that were broader based, encompassing manufacturing and industry-oriented software. Indeed STEM employment in the Valley still has not recovered from the 2001 tech bust — the number of STEM jobs is down 12.6% from 10 years ago.

    Metropolitan STEM Job Growth, Sorted by 10-year Growth
    MSA Name 2001-2011 Growth 2009-2011 Growth 2011 Concentration
    Las Vegas-Paradise, NV 25.5% -3.4% 0.51
    Washington-Arlington-Alexandria, DC-VA-MD-WV 20.8% 4.4% 2.16
    San Antonio-New Braunfels, TX 20.1% 3.0% 0.82
    Nashville-Davidson–Murfreesboro–Franklin, TN 18.5% 3.1% 0.74
    Riverside-San Bernardino-Ontario, CA 18.3% -1.6% 0.55
    Seattle-Tacoma-Bellevue, WA 18.1% 7.6% 1.95
    Salt Lake City, UT 17.5% 4.5% 1.17
    Jacksonville, FL 17.4% 3.0% 0.88
    Baltimore-Towson, MD 17.2% 3.9% 1.36
    Raleigh-Cary, NC 14.9% 1.4% 1.56
    Houston-Sugar Land-Baytown, TX 14.3% 3.6% 1.25
    Orlando-Kissimmee-Sanford, FL 14.2% -1.4% 0.90
    San Diego-Carlsbad-San Marcos, CA 13.1% 6.5% 1.38
    Austin-Round Rock-San Marcos, TX 8.8% 2.4% 1.75
    Charlotte-Gastonia-Rock Hill, NC-SC 8.1% 2.1% 0.97
    Columbus, OH 7.8% 3.8% 1.32
    Buffalo-Niagara Falls, NY 7.7% 2.4% 0.96
    Virginia Beach-Norfolk-Newport News, VA-NC 7.5% -3.1% 1.05
    Miami-Fort Lauderdale-Pompano Beach, FL 7.5% 2.8% 0.73
    Indianapolis-Carmel, IN 7.5% 1.2% 1.06
    Oklahoma City, OK 7.3% 2.9% 0.89
    Dallas-Fort Worth-Arlington, TX 6.2% 3.7% 1.21
    Cincinnati-Middletown, OH-KY-IN 6.1% 4.6% 1.08
    Sacramento–Arden-Arcade–Roseville, CA 6.0% -1.6% 1.19
    Louisville/Jefferson County, KY-IN 5.6% 4.3% 0.77
    Phoenix-Mesa-Glendale, AZ 5.4% 1.5% 1.00
    Portland-Vancouver-Hillsboro, OR-WA 5.2% 4.2% 1.24
    Atlanta-Sandy Springs-Marietta, GA 4.8% 4.3% 1.10
    Denver-Aurora-Broomfield, CO 4.0% 2.8% 1.47
    Richmond, VA 3.8% 0.4% 1.14
    Providence-New Bedford-Fall River, RI-MA 3.6% 2.4% 0.90
    Pittsburgh, PA 3.1% 3.6% 1.07
    Hartford-West Hartford-East Hartford, CT 3.1% 1.2% 1.18
    Minneapolis-St. Paul-Bloomington, MN-WI 2.6% 3.1% 1.37
    Tampa-St. Petersburg-Clearwater, FL 2.4% 2.0% 0.88
    Philadelphia-Camden-Wilmington, PA-NJ-DE-MD 2.2% 0.3% 1.19
    Kansas City, MO-KS 1.9% -2.6% 1.15
    New York-Northern New Jersey-Long Island, NY-NJ-PA 1.2% 2.9% 1.00
    San Francisco-Oakland-Fremont, CA 0.8% 3.7% 1.60
    Memphis, TN-MS-AR 0.0% 0.7% 0.56
    Boston-Cambridge-Quincy, MA-NH 0.0% 4.8% 1.64
    Los Angeles-Long Beach-Santa Ana, CA -2.2% 1.7% 0.98
    Milwaukee-Waukesha-West Allis, WI -2.3% 0.2% 1.04
    St. Louis, MO-IL -3.5% -1.4% 1.05
    Birmingham-Hoover, AL -3.9% -3.4% 0.70
    Cleveland-Elyria-Mentor, OH -4.9% 1.2% 0.93
    Chicago-Joliet-Naperville, IL-IN-WI -5.2% 1.1% 0.96
    New Orleans-Metairie-Kenner, LA -6.7% 3.6% 0.71
    Rochester, NY -8.9% 2.1% 1.19
    San Jose-Sunnyvale-Santa Clara, CA -12.6% 4.9% 3.09
    Detroit-Warren-Livonia, MI -14.9% 8.8% 1.42
    Total in Top 51 Regions 4.2% 3.0%

    Data source: EMSI Complete Employment, 2012.1. The “2011 Concentration” figure is a location quotient. That’s the local share of jobs that are STEM occupations divided by the national share of jobs that are STEM occupations. A concentration of 1.0 indicates that a region has the same concentration of STEM occupations as the nation.


    Joel Kotkin is executive editor of NewGeography.com and is a distinguished presidential fellow in urban futures at Chapman University, and contributing editor to the City Journal in New York. He is author of The City: A Global History. His newest book is The Next Hundred Million: America in 2050, released in February, 2010.

    This piece originally appeared in Forbes.

    Computer engineer photo by BigStockPhoto.com.

  • Megalopolis and its Rivals

    Jean Gottman in 1961 coined the term megalopolis (Megalopolis, the Urbanized Northeastern Seaboard of the Unites States) to describe the massive concentration of population extending from the core of New York north beyond Boston and south encompassing Washington DC. It has been widely studied and mapped, including by me. (Morrill, 2006, Classic Map Revisited, Professional Geographer).  The concept has also been extended to describe and compare many other large conurbations around the world.

    Maybe it’s time to see how the original has fared?   And what has happened to other metropolitan complexes in the US, most notably Los Angeles, San Francisco, Chicago and should we say Florida?


    Table 1 summarizes the population of Megalopolis from 1950 to 2010 and Table 2 compares Megalopolis with other US mega-urban complexes.  Megalopolis grew fastest in the 1950s and 1960s, with growth rates of 20 and 18.5 percent. The  northeast has since been outpaced by the growth in other regions, but growth was still substantial in the last decade. Megalopolis added almost 3 million people, by 6.8 %, to reach an amazing 45.2 million.

    Table 1: Growth of Megalopolis 1950-2010
    Year Population Change % Change
    2010 45,357 2,983 7
    2000 42,374 5,794 15.8
    1990 36,580 2,215 6.4
    1980 34,365 360 1.2
    1970 34,005 5,436 18.5
    1960 29,441 4,910 20
    1950 24,534

    From Table 2 I note four major subregions of Megalopolis: Boston, New York, Philadelphia and Washington, DC. New York is still the biggest player, but the locus of growth over time has shifted South. This reflects the increasing world importance of Washington, DC. New York’s almost 20 million may not surprise, but the fact that greater Boston has grown to almost 9.5 million may be more surprising.  The Washington-Baltimore area grew by far the fastest at almost 15 percent (not much sign of shrinkage of government!). In contrast New York, Boston and Philadelphia’s growth was relatively paltry.

    Table 2: Megalopolis and Its Rivals
    Place
    2010 Pop
    2000 Pop
    Change
    % change
    Megalopolis
      New York 19,923 19,209 717 3.7
      Boston   9,445 8,967 478 5.3
      Philadelphia 8,415 76,781 773 9.5
      Baltimore-Washingt 7,403 7,681 960 14.9
    All 45,181 42,302 2,888 6.8
    Chicago 10,817 10,305 512 5
    Los Angeles 12,151 11,789 362 3.1
      Central 903 857 46 5.4
      North 928 634 294 46
      East 2,884 2,105 475 37
      South 3,543 3,210 337 10.4
    All Los Angeles 20,404 18,599 1,810 9.8
    San Francisco-Sacramento
      San Francisco 7,330 6,946 384 5.5
      Sacramento 3,171 2,604 572 22
    All San Francisco-Sacramento 10,501 9,550 951 10
    Florida
      Miami 6,027 5,311 716 13.5
      Tampa 4,818 3,894 974 25.3
      Orlando 2,915 2,193 722 33
      Jacksonville 1,483 1,191 2,242 24.5
    All Florida 15,243 12,544 2,699 21.5

    Greater Los Angeles is the second largest conurbation, with some 20.4 million, growing by 1.8 million, and 10 percent from 2000. In the table I distinguish between the core Los Angeles urbanized area and the satellite urbanized areas west, north, south and east. The core LA area grew by only 3 percent, while the spillover areas to the north and east had astonishing growth, at 46 and 37 percent over the decade.  These include several places with a fairly long history, such as Riverside and San Bernardino, San Diego and Santa Barbara, but many are rapidly growing large suburbs and exurbs, a spillover of growth from the Los Angeles core. Much of the fastest growth has been in  Mission Viejo, Murietta-Temecula, Indio, Lancaster, Santa Clarita and Thousand Oaks.

    For greater San Francisco, I distinguish two subregions, the Bay area of San Francisco-San Jose (west) and Sacramento (central valley).  Some might consider these totally distinct, but they have become one in a conurbation sense, as evidenced by commuting patterns. Many people live in the less costly Central Valley area but commute to the expensive Bay Area cities. Together, the conurbation is now 10.5 million, up 10 percent from 2000. The central valley (Sacramento) portion grew far more rapidly than San Francisco-San Jose (22 percent compared to 5.5 percent).  

    Compared to its rivals the Chicago conurbation has grown less rapidly but is still large, with a population of 10.8 million in 2010 , growing 512,000 (5 percent) since 2000.  Chicago and Milwaukee are the well-known core cities, but there are also less well known components with far faster growth such as Round Lake-McHenry and West Bend, WI.   

    Florida

    The more interesting and difficult conurbation to try to define is what might be called the Florida archipelago. Greater Miami has long been recognized as a conurbation, but I contend that virtually all the urbanized areas of the state are in effect a complex web of urban settlement, with little clear demarcation. This is in part a reflection of   rapid and expansive  growth.  Nevertheless it makes sense to recognize four sub-regions, centered on Miami, Tampa-St. Petersburg, Orlando and Jacksonville. 

    Together these areas have reached an astonishing 15.2 million, up 2.7 million or 21.5 percent in one decade.  Because settlement is spread across the state in such a web-like fashion with no single dominant center, they constitute a newish form of urban concentration. Besides the well-known centers such as   Miami, Tampa-St. Petersburg ), Orlando and Jacksonville,  there are many satellite cities, often quite large. These include North Port, Cape Coral  encompassing older Ft. Meyers, Bonita Springs, Kissimmee, Palm Bay-Melbourne, Palm Coast-Daytona, and Port St. Lucie.  An interesting but hard to answer question is how much of Florida’s phenomenal growth is a result of transfer of people and accumulated wealth from the North (and especially from the original Megalopolis).

    The United States is a large and diverse country, with many other giant cities and a vast countryside. But it is important to realize the importance of these megalopolitan areas, with an aggregate population of 102.6 million, one third of the nation’s population.

    What’s next? Look for the rise of now just somewhat smaller conurbations such as Houston, Dallas, Atlanta, Minneapolis, Seattle, Phoenix, and Denver. In terms of numbers and rates of growth Texas is a front runner, but its stars do not coalesce into a megalopolis, at least not yet. The belt of urban growth from Atlanta, through Greenville, SC, Charlotte to Raleigh-Durham is also a likely future conurbation candidate.

    Richard Morrill is Professor Emeritus of Geography and Environmental Studies, University of Washington. His research interests include: political geography (voting behavior, redistricting, local governance), population/demography/settlement/migration, urban geography and planning, urban transportation (i.e., old fashioned generalist).

  • The Great Reordering of the Urban Hierarchy

    A delegation from Chicago is in Brussels this week to sell the city as a tourist destination in advance of the forthcoming NATO Summit. A Phil Rosenthal column explains that the city has a long way to go:

    "I don’t think most people in the U.K.have any idea where Chicago is," said Rowan Bridge, a BBC Radio producer who last year spent six months based in Washington D.C. "Most people in England think the United States consists of three cities — New York, Washington D.C., and Los Angeles — because they’re the ones that run the media, they’re the ones where the celebrities hang out, they’re the ones where the politicians are."

    Rosenthal notes that Chicago has long worried about its image, and it has never been a top global tourist destination, but a recent drop in international visitors highlights the challenge even a colossus like Chicago faces in getting its word out in a competitive global economy.

    Reading this, it once again strikes me that the old urban hierarchy is being reordered by globalization and the dramatic expansion of the US federal government, to the disadvantage of Chicago and other cities. This, I believe, helps account for its recent struggle.

    Joel Kotkin has tirelessly documented the remorseless rise of Washington, DC, rain or shine, in a manner defiant of business cycles. Washington, once a sort of commercial backwater, is now becoming much more a national capital of the type other countries have had.

    Meanwhile, back in the "spiky world," the peaks thrive while the valleys suffer. But it is the highest peaks that thrive most of all. Hence we’ve seen the emergence of a robust NYC post-9/11. It seems to have become if anything more the center of the universe, a huge financial center, media center, fashion center, cultural center, etc. – and adding to it new strength such as its emergence as America’s #2 tech startup location after Silicon Valley. New York is at an all time population high and even withing about 60,000 jobs of its all time peak employment.

    So we have New York entrenched as America’s first city, and Washington, DC increasingly its new "Second City." Los Angeles, which seems to have never quite recovered from the early 90s defense draw down, and Chicago with its 2000s malaise, seem to be the victims of DC’s rise. Another loser is Boston, which has seen its status as a financial hub decline and whose Route 128 corridor of tech, having first lost out to Silicon Valley, now appears to be losing out to NYC.

    Second tier cities in developed countries may indeed suffer as globalization proceeds. Zipf’s Law has historically governed the hierarchy of urban population (and thus proxied for overall urban importance) within particular geographies. Richard Florida and his colleagues showed that Zipf’s Law does not apply on a global basis, possibly because of the difficulty of migration between countries.

    But many other migration type barriers have declined over time, and it’s easy to conceptualize that many types of activities that once operated largely in purely domestic hierarchies now complete in global ones. If true, this would suggest that some cities, like LA, Chicago, and Boston, which ranked high in a national hierarchy might be pretty far down the list in a global one. Those cities with the greatest advantages of talent, high end specializations, and the greatest global connections would be best positioned to succeed in making the transition. We can also note the rise of new cities of importance in the BRIC counties, the Middle East, and other parts of the "developing world" that would bring new competition to traditional developed world power players, particularly for those that were already secondary centers in their own country.

    To see this playing out, contrast the differing life histories of Chicago and Hong Kong, which were effectively founded at the same time.

    I would describe this as a mix of observation and hypothesis at this point, but would love to see more formal analysis. And of course we’ll see how the trends play out. Even if true, we may not be at the end of this Great Reordering. With Washington continuing to soar, we are seeing shifts in the balance of power even with New York, such as the increasing importance of Washington as a media center. Though the inexorable mathematical logic of the budget may crimp Washington at some point, it’s certainly not impossible that some time in the future it may take its place as a London-like truly dominant national capital.

    Aaron M. Renn is an independent writer on urban affairs based in the Midwest. His writings appear at The Urbanophile.

    Photo by Doug Siefken

  • The Sorry State of American Transport

    We constantly read about the infrastructure crisis in America. I’ll have more to say on this at a future date, but it is pretty clear that we need to spend more money in a whole lot of areas: airports, roads and bridges, public transportation, and more.

    Yet it’s very easy to see that so much of what ails transport has nothing to do with a lack of funds and everything to do with a lack of will. I took a train ride on the Northeast corridor last week that really drove it home to me.

    Start with the sorry state of Penn Station in New York City, America’s busiest train station. (In fact, it’s the busiest transportation facility of any type in the United States, if Wikipedia can be believed). Yes, the place is a depressing underground dump. Yes, there used to be a glorious train station there that was demolished in the 1960s. Yes, we probably need to invest many billions in upgrades.

    Yet is it a lack of funds that make the three agencies that call it home – Amtrak, New Jersey Transit, and the Long Island Railroad – act as though the others don’t exist? The three railroads have completely separate ticketing areas, signage systems, etc. This is hardly the only case in America. For some reason, Amtrak seems to despise sharing ticket agents with other carriers. There are separate windows for Amtrak and commuter lines everywhere I’ve been. Given that many journeys include both commuter and inter-city segments, this seems crazy. If you can’t have integrated ticketing (and actually, I don’t see why you can’t), at least you should be able to have a single agent help you.

    The worst example of this I know is in Providence, where Amtrak monopolizes the four ticket windows. If you want to buy an MBTA T ticket, you have to go to a cafe next door. This tiny little coffee shop found a way to sell both pastries and train tickets (albeit from separate registers), so why can’t Amtrak figure out how to sell two kinds of tickets?

    Also, as near as I can tell, there’s no way to actually get your Amtrak ticket online. You can book a reservation, but then you need to get a physical ticket printed at the station, either from a kiosk or an agent. (If there’s a way to avoid this, please let me know).

    I decided to get my ticket at the window. The line was very short and I was early in any case. When I got there, some guy with his kids was at the window screaming at the agent about a problem with their tickets. I chalked this up to one of those cases where the frustrations of travel just cause somebody to snap. But then as I walked up to the window, the person next to me was also having a similar problem with their ticket and was having an animated discussion with an agent who didn’t seem to care. Fortunately, I had no such issues, but the agent I had to talk to was extremely surly and kept asking me to repeat myself over and over. Who would want to put themselves through such an experience? Customer service is clearly something that should also be within Amtrak’s control.

    Amtrak markets themselves as having wi-fi. But on the train itself, as anyone who has ridden the NEC knows, the wi-fi is basically unusable. How much capital investment would it take to get working wi-fi?

    In short, though the facilities can somewhat be excused as resulting from insufficient capital funding and bad decisions decades ago, there’s so much that could be done right now to upgrade the passenger experience it’s not even funny.

    It’s the same with airports. While a few American cities like Indianapolis and Detroit have upgraded their terminals, too many key gateways remain depressingly dreary and non-functional. While some overseas places like Heathrow certainly would give any American airport a run for its money in the Hall of Shame, the general experience of flying to someplace like Madrid, Singapore, or Tokyo is like night and day versus the US.

    Key among the worst offenders again is New York City, especially LaGuardia. Matt Chaban at the New York Observer recently wrote a piece that is a good overview of the depressing state: “Terminal Condition – How New York’s Airports Crashed and Burned.”

    This is certainly not news to anyone who has flown to New York. But again, the vast billions it would take to replace these decrepit facilities is only part of the problem. Nobody forces America to put its passengers through the “TSA experience.” Last time I flew I was delayed at security while agents patted down some guy that looked like he was around 85 years old who apparently hadn’t stripped down quite far enough to go through the full body scanner. Somehow other advanced nations manage to run safe air travel systems without resorting to this.

    While we are waiting around for funding issues to be resolved, wouldn’t it be nice if our governments and various travel companies actually focused on fixing some of these straightforward problems with coordination, ticketing, and customer service? It’s hard to take their capital requests seriously if they aren’t going to do what they can now.

    Aaron M. Renn is an independent writer on urban affairs based in the Midwest. His writings appear at The Urbanophile.

    Photo By Kyle Gradinger, Amtrak Keystone Snowstorm I. Amtrak AEM-7 locomotive 904 leads a Keystone Corridor train through the snow in Rebel Hill, King of Prussia, PA.

  • Commuting in New York City, 2000-2010

    New York City is infamous for congestion and long commutes. At 34.6 minutes, it has the longest average commute time in the United State. The region is also America’s top user of public transportation, with 30.7% of all metro area commutes made by transit. Nearly 40% of all transit commuters in the United States are in the metro New York. As transit commutes generally take longer than driving, one might be tempted to link these facts. But commute times also seem to correlate with city size, and bedevil big cities with limited public transit too.

    New York’s commutes improved a bit over the 2000s, however. The average commute time declined in every borough, in the city as a whole, and in the region. Overall US commute times fell as well, but less than New York’s:


    Source: Census 2000, American Community Survey 2010 1-yr

    In addition to showing the decline, this chart also highlights disparity in commute times between the subareas of New York. Manhattanites have far shorter commutes than those who live in the outer boroughs. In fact, the outer boroughs actually have longer commutes than far-flung outer suburban areas. The areas just outside the urban core of New York are some of the most disadvantaged for regional commuting

    The commute time decline is particularly noticeable when looking at ultra-long commutes, those that are 90 minutes are longer:


    Source: Census 2000, American Community Survey 2010 1-yr

    Here again we see both a decline in long commutes and a higher concentration in the outer boroughs.

    New York also managed to finish out the decade with no increase in traffic congestion. According to the Texas Transportation Institute, the region ended the decade with the same Travel Time Index it had when it started, 1.28:


    Source: Texas Transportation Institute, Urban Mobility Report 2011

    What has caused this?  Firstly, given that the data is collected in surveys with a margin of error, one shouldn’t read too much into any given year’s value. However, the decline was fairly consistently reflected in the later decade surveys and doesn’t appear to be an anomaly of just 2010.

    Assuming some legitimate improvement, one obvious potential explanation is the economy. Metro New York did lose 99,000 jobs in the 2000s. This was only a decline of 1.2% however, which actually bettered the US as a whole. But given the extreme congestion in the region, it clearly could have played a role. Also not to be dismissed are toll increases in the regions, and even potentially changes resulting from 9/11.

    Given the focus of the Bloomberg administration on non-auto forms of transportation, it is also worth looking at changes there.  Public transit usage grew strongly in New York over the decade, with regional trips increasing by 23%.


    Source: Texas Transportation Institute Urban Mobility Report 2011

    This increase is also reflected  an increase in public transportation commuting mode share over the past decade.


    Source: Census 2000, American Community Survey 2010 1-yr

    So should increased public transit ridership get the credit for commute time reductions? To some extent perhaps. But remember that New York has both the nation’s longest commutes and highest public transit ridership. Also keep in mind that public transit commutes are longer than driving commutes. The average commute time in metro New York for those driving alone is 30 minutes. For those riding public transportation it is 51.2 minutes. But transit riders affect drivers too. Public transit saves drivers in the New York area nearly $8 billion per year in congestion costs.  So while public transit can’t be necessarily given the credit for commute time improvements, it’s certainly possible it contributed to them .

    The same is not true, however, for other alternative transport modes. Here is the change in bicycle commuting over the decade:


    Source: Census 2000, American Community Survey 2010 1-yr

    Bicycling gets a lot of press in New York, and while the increases look impressive on a chart like the one above, the reality is that this is a trend that enjoys only a bit more than half a percentage point gain in mode share. Bicycling may be on an upswing, and may be of great help recreationally and for non-commute trips, but it is not yet a major force in commuting.

    Walking is actually far more prevalent than bicycling for commuting in New York. But the mode share for walking actually declined over the decade:


    Source: Census 2000, American Community Survey 2010 1-yr

    While walking is generally seen as a good thing in urbanist circles, some people can end up walking to work simply because they have no other alternatives. People who obtain access to a car, or who are able to use transit to get a job outside of their neighborhood, may in fact be improving their economic prospects. Some people who previously walked may be riding transit or biking to work today. Also, some walkers may have switched to driving. Interestingly, the number of households without a vehicle declined in metro New York, though some boroughs saw increases. The changes are very small, however.


    Source: Census 2000, American Community Survey 2010 1-yr

    Lastly, as you might expect with transit going up, the percentage of commuters driving alone declined nearly across the board in New York, though it increased nationally:


    Source: Census 2000, American Community Survey 2010 1-yr

    In short, New York retains America’s longest commutes and highest public transport usage. But in the last decade there have been increases in public transport commuting and declines in people driving alone, while overall commute times have improved, fewer people with ultra-long commutes, and road congestion has stayed flat. The 2000s were perhaps an unusual decade in America and New York. And the changes are fairly small so far.  The future will tell whether this is the start of a long term trend or merely a short term reversal.

    Aaron M. Renn is an independent writer on urban affairs based in the Midwest. His writings appear at The Urbanophile. Telestrian was used to analyze data and to create maps for this piece.

  • Citibank, Citizen Wriston, And The Age of Greed

    Robert Sarnoff , the CEO of RCA before it was absorbed by GE, once said, “Finance is the passing of money from hand to hand until it disappears.” That process is very clearly defined in The Age of Greed by Jeffrey Madrick. It recounts, in concise terms, how a few dozen individuals—some in the private sector, some in government–brought us to our current economic pass, in which finance seems to have been completely detached from life. Names from the past come back, and their crimes are explained. Ivan Boesky, Michael Milken, and Dennis Levine look guiltier in the retelling than they did in the newspapers at the time. And in this telling, the philosopher king of the new finance was Walter Wriston, CEO of Citicorp.

    I wrote for Wriston and other senior managers of Citibank from 1980 through his retirement in 1984, and for his successors through 1991. My colleagues and I were charged with helping Wriston make the case that the financial regulatory regime that was put in place during the Depression was obsolete. Let me make it clear: I was a footnote, although I occasionally run into old acquaintances who still shake their fingers at me.

    Madrick’s Wriston is by far the book’s most compelling character. As with all the other subjects, there’s a smattering of armchair Freud, although most of the political figures who make appearances here escape their two minutes on the shrink’s couch. Wriston’s psyche was more interesting than the insecurities of Ivan Boesky and Sandy Weill, to name just two; his university-president father Henry Wriston despised the New Deal as it was happening, and imparted that attitude to the son. Henry then remarried too quickly after Walter’s mother died for the son’s taste, and they became estranged.

    But there’s more to Wriston than you read in Madrick. He was a restless intellect, impatient with field of diplomacy he had studied for before World War II, and after taking a job in banking, which he once wrote seemed like, “the embodiment of everything dull,” found a vehicle for exerting his imagination, and then for fulfilling his ambitions. The First National City Bank, later to become Citibank and Citicorp, and then Citibank again, had inspired imperial dreams before. Through a series of mergers it became the biggest bank in the biggest city in the country. When trade followed the flag around the world, Citibank’s precursors were right there with it. During the Roaring Twenties, Charles Mitchell dreamed of a “bank for all”, the forerunner of Wriston’s vision of one-stop banking, although Mitchell’s stewardship ended with a trial (and an acquittal) after the stock market crash and the Pecora hearings in the early ‘30s. While the bank had social register threads running through its history—when Wriston started the president was James Stillman Rockefeller, descended both from the Stillmans and the Rockefellers, married to a Carnegie—the patrician elements always had hungry outsiders around to push the envelop of banking practice. When Rockefeller was chairman, he had a president named George Moore, and Wriston was his protégé. However, Moore was too frisky for Rockefeller, and when a successor was chosen, it was Wriston.

    Wriston hung a portrait of Friederich Hayek on the wall of his office. He was a reader. When Adam Smith became the Holy Ghost of the Church of Deregulation, Wriston’s top writer (and later my boss) was the man who actually edited The Wealth of Nations for the Great Books. When I was new there, I asked one of the bigshot corporate bankers which great thinkers he liked to quote in his speeches. He answered, “The only person who can get away with that is Walt Wriston, and I’m not sure he can.” Wriston’s ambition may have been shaped by philosophy, but he achieved it with tactics and strategy that sprang from a contrary nature as much as by the force of his ideas, and Madrick recounts that. He wanted his bank to be valued like a growth stock, and promised analysts 15% a year return on equity—not a recipe for safety and soundness.

    Whether it was inventing financial instruments to get around interest rate restrictions, making outsize bets on railroad bonds and New York City bonds, creating the Eurodollar market, blitzing the country with credit cards, or wholesale lending to developing countries to recycle petrodollars, Wriston had a knack for making money when the economy was right and then challenging the government to deregulate in time to accommodate his losses. Personally, I think that before the bank was too big to fail, it was too big to succeed.

    Looked at now, there’s something quaint about these investments. At least they had to do with real things, like trains, oil, municipal governance, and the ostensible aspirations of people in emerging markets, although they were mostly oligarchs and autocrats. In Madrick’s account, Wriston was dismissive of the government’s capacity to efficiently recycle petro-dollars, among many other things, and contended that his loan officers knew more about their corporate customers than anyone else did, which would enable them to safely make riskier loans than capital standards would permit. We all know how that turned out.

    Wriston was a real visionary. To underscore his then-revolutionary idea that information about money was as important as money itself, he bought a transponder on a satellite to carry the bank’s data stream, and then put a satellite on the cover of the annual report. Theoretically, all that proprietary information made it hard to hide bad news about a company’s finances or a country’s; executives and prime ministers beware of poor management! He was undoubtedly the first bank CEO to anticipate what Moore’s Law—quantifying the exponential growth of computing power—would mean to business and society. Unfortunately, that power is exactly what enables the hollow finance we have today.

    Reading Madrick’s book was like watching my life pass before my eyes, including the parts I slept through, and it certainly brought me up to date on events that happened long after my eyes glazed over.

    It reminded me that when Wriston ran it, Citibank was fun to work for, as jobs in tall buildings went. My closest colleagues were well-educated and witty refugees from college faculties. The bank’s historian worked closely with us, and we learned the secrets that never made it into the deadly official history, such as the fact that one of Wriston’s predecessors kept a house in Paris, where he was known among the haute couturiers as le bonbon, or that when the Titanic went down, some hard-money banker had written to customers that there was good news—the loss of all the paper currency aboard would strengthen the dollar. Wriston set the tone: History counted, an attitude that wouldn’t survive the cost-cutting that came later. Wriston was renown for his sharp needle, but when I found myself in his office with the portrait of Hayek staring down, he seemed to enjoy the relief from the routine pressures of his job. I always had some kind of bleeding heart question based on current events, and he always had a sharp, witty retort.

    He was also a citizen. When the City of New York had its own financial collapse in 1975 (“Ford to City: Drop Dead”), Wriston represented the commercial banks on the committee charged with rescuing the city’s finances. One of the bank’s economists assigned to work with him saw the beating Wriston took every day at the hands of the municipal unions and asked why he carried on. He answered, “Because I live here.” I wish some of the new financiers who have benefited from the work Wriston did would exhibit some evidence that they felt that way about the city. About the country. About the world.

    Photo: Bigstockphotos.com; the old Citibank and newer Citicorp buildings.

    Henry Ehrlich no longer writes for bankers, although he still likes money. He is editor of
    www.asthmaallergieschildren.com, and co-author of Asthma Allergies Children: a parent’s guide.

  • The Shifting Landscape of Diversity in Metro America

    Census 2010 gave the detail behind what we’ve known for some time: America is becoming an increasingly diverse place.  Not only has the number of minorities simply grown nationally, but the distribution of them among America’s cities has changed. Not all of the growth was evenly spread or did it occur only in traditional ethnic hubs or large, historically diverse cities.

    To illustrate this, I created maps of U.S. metro areas showing their change in location quotient. Location quotient (LQ) measures the concentration of something in a local area relative to its concentration nationally. This is commonly used for identifying economic clusters, such as by comparing the percentage of employment in a particular industry locally vs. its overall national percentage. In a location quotient, a value of 1.0 indicates a concentration exactly equal to the US average, a value greater than 1.0 indicates a concentration greater than the US average, and a value less than 1.0 indicates a concentration less than the US average.

    While commonly used for economic analysis, the math works for many other things. It can be useful to measure how the concentration of particular values changes over time relative to the national average.  In this case, we will examine the change in LQ for various ethnic groups between the 2000 and 2010 censuses for metro areas. Those metro areas with a positive change in LQ grew more concentrated in that ethnic group compared to the US average over the last decade. Those with a negative change in LQ grew less concentrated compared to the nation as a whole, even if they grew total population in that ethnic group.

    To increase concentration level requires growing at a faster percentage than the US as a whole. This is obviously easier for places that start from a low base than those with a high base. In this light, places that have traditionally been ethnic hubs – such as west coast metros for Asians – can grow less concentrated relative to the nation as a whole even if they continue to add a particular ethnic group. Asian population, for example, can grow strongly in California, but at a slower rate than the rest of the country. This is indeed the case as groups like Hispanics and Asians have been de-concentrating from the west coast, and now are showing up in material numbers even in the Heartland.

    Black Population


    Black Only Population, Change in Location Quotient 2000-2010

    The change in Black concentration is particularly revealing. Much has been written about the so-called reversing of the Great Migration. But contrary to media reports, there is no clear monolithic move from North to South. Instead, we see that the outflow has been disproportionately from America’s large tier one metros like New York, Chicago, and Los Angeles. In contrast, Northern cities like Indianapolis, Columbus, and even Minneapolis-St. Paul (home to a large African immigrant community) grew Black population strongly, and actually increased their Black concentrations. Similarly, there were clearly preferred metro destinations in South for Blacks, like Atlanta and Charlotte. Many other Southern metros , particularly those along the Atlantic coast of Georgia and the Carolinas continued to lose their appeal to Blacks, relatively speaking.

    Hispanic Population


    Hispanic Population (of any race), Change in Location Quotient 2000-2010

    Here we see de-concentration clearly in action. The Mexican border regions retained high Hispanic population counts, but they are no longer as dominant as in the past. Places like Nashville, Oklahoma City, and Charlotte particularly stand out for increasing Hispanic population percentage. Again, large traditionally diverse tier one cities like New York and Chicago show declines on this measure as smaller cities are now more in on the diversity game.

    Asian Population


    Asian Only Population, Change in Location Quotient 2000-2010

    Again, we see here that America’s Asian population spread well beyond traditional west coast bastions. There were big increases in Asian population counts, with resulting LQ changes, in places like Atlanta, Indianapolis, Philadelphia, and Boston. Even New York (which now has over one million Asian residents within the city limits alone) and Chicago showed gains among Asians.

    Children (Population Under Age 18)

    As a bonus, here is a look at LQ change for metro areas for people under the age of 18.


    Children (Population Under Age 18), Change in Location Quotient 2000-2010

    Here we see that metros along America’s northern tier now have relatively fewer children than a decade ago, while metros like Denver, Dallas, and Nashville had more. Clearly, some places are increasingly seen as better – and perhaps also more affordable – locations for child rearing than others.  Perhaps unsurprisingly many of the out of favor locales are either expensive, have poor economic prospects, and/or are excessively cold. Not surprisingly, for example, Atlanta, Houston and Florida’s west coast have gained in this demographic while much of the Northeast, particularly upstate New York, have lost out.

    The overall key is while there are certain broad themes that emerge from the recent Census, such as America’s increasing diversity or signs of a reversing of the Great Migration, we need to take a more fine grained view to see which places are in fact benefitting and being hurt by these trends.  What we see here is that traditional large urban bastions of black population and ethnic diversity are no longer the only game in town. Smaller places in the interior and the South are now emerging as diversity magnets in their own right, as well as magnets for families with children. This is the collection of places to watch to look for the next set of great American cities to emerge.

    Aaron M. Renn is an independent writer on urban affairs based in the Midwest. His writings appear at The Urbanophile. Telestrian was used to analyze data and to create maps for this piece.

    Note: The original version of this piece included incorrect charts for the Asian, Hispanic, and child measures.

  • An Obituary for the Occupation in New York

    I came to report on the occupation of Zuccotti Park expecting it would pass in a matter of days, like the stillborn movements before it.

    In spite of its self-celebrated cosmopolitanism, New York after 9/11 has become an arid environment for protest under Mayor Michael Bloomberg and Police Commissioner Ray Kelly. The press and the public yawned through the massive anti–Iraq War march in 2003 and the excessive police response to the 2004 RNC protesters (the city is still dealing with those lawsuits). Even after the Wall Street meltdown, an eerie silence prevailed.

    Zuccotti was something else: a physical presence, symbolically charged by its location a stone’s throw from both Ground Zero and Wall Street, with no end date to wait out and no demand to be placated.

    While the act of occupation had little to do with the broader complaint—at the core, unhealthy economic distribution perpetuated by increasingly unresponsive elected “representatives”—it proved a dramatic setting for airing them, and for bringing participants together. For one season the park took on a life of its own, before reverting to a place for “passive recreation.”

    In the course of that season, though, the scene aged badly. With a big push from the Bloomberg administration and tabloid coverage fixated on civic order, Zuccotti Park descended from a new public commons to a fever dream.

    I surveyed the scene for the first time about a week after it started. In that first of what became many such visits, I stayed from early afternoon through the next morning, listening to professors, students, union members, veterans, homeless women, eccentrics, lunatics, librarians, old colleagues from other newspapers, members of various working groups and even a neighbor from Brooklyn there to take it in.

    Occupy Wall Street had yet to draw the high-profile NYPD abuses and errors—the pepper spraying and Brooklyn Bridge arrests—that would give them a shape and purpose they couldn’t sustain themselves. But amid the drum circles and music festival “model society” absurdity of the park, people who’d been at a loss until now about how to express an array of concerns sensed an opening.

    I was less interested in the protest itself than in the creation within Zuccotti of the sort of freewheeling commons New York City has lost under this mayor, even as the Internet and mobile devices eroded what was left of a shared café culture.

    That shift is epitomized by the increasing commercialization of public spaces like the generator-powered gift market at Union Square. But it left a hole that the occupiers briefly filled.

    The handmade cardboard signs, the conversations with engaging strangers, the library, even the General Assembly all seemed like flashes of the participant city that’s hunkered down to wait out an unpopular mayor. Bloomberg has built an ever-expanding safe space for the very well-off at the expense of the rest of us, using his private fortune to encourage New Yorkers to simply leave the city’s civic life in his hands.

    Problems in Zucotti stemmed in no small part from the massively disproportionate police response, intended in part to limit the size and scope of the protests by warning the economically marginal, the physically frail, and the meek about the bad things that might happen to those who participated.

    That tactic backfired. As the occupation grew, the would-be political participants found themselves starved for space, overwhelmed by their own tents and by an excess of hangers-on, panhandlers and carnival-goers unsober in all senses. They were ringed by barricades and police officers, blinded by spotlights aimed into the park at all hours, and eyed at all times by dozens of NYPD cameras carried by officers and atop a 20-foot pole on an unmarked police truck.

    “Just because you’re paranoid,” one Occupier said, sweeping her arm across the park, “doesn’t mean they’re not out to get you.”

    The NYPD response was a far more significant disruption to the life of the city than the protesters themselves—for the first time since 9/11 penning off streets to those without IDs to prove they “belonged” there, erecting barricades that starved businesses of customers, sending so many officers to “protect” the demonstrably nonviolent marches that crime rates went up elsewhere.

    In turn, the occupiers became fixated on the police department. At each march, rumors would swirl about brutality, arrests and reports that “they’re taking the park.” Crowds would at times work themselves into mobs, facing off with the NYPD as though they were in Oakland or Egypt. Yet they failed to notice—let alone respond to—the tactics used to manage them, like complicated penning schemes that broke bigger groups into smaller ones or tricked protesters into separating themselves from the rest of the city instead of showing they were just like everyone else.

    After I reported that the police were exacerbating a split between participants and nonparticipants in Zuccotti by encouraging drunks and rowdies to head down there, the NYPD’s main mouthpiece issued a tepid denial. “Not true,” he said, without specifying what exactly wasn’t true, adding that those types would of course find their way there.

    Explaining his decision to finally clear the park, Bloomberg pointed to the EMT who broke his leg on the sidewalk just outside the park (but inside the barriers separating the police from the protesters) a week earlier, in the middle of the night.

    I was the only reporter on the scene when that happened. My colleagues had dispersed around the park to track a spate of seemingly contagious violent incidents on an especially ugly night.

    Two very large OWS “community watch” members were patiently working to calm down and eject from the park a crazed 20-year-old, Joshua Ehrenberg, who I was told had punched his girlfriend in the face earlier that night. Just outside the barriers separating the sidewalk from the street, officers watched the crowd swelling around the scene.

    The police ignored requests to move on as Ehrenberg kept playing to them, spitting out slogans of the occupation: “The process is being disrespected” since “the community hasn’t consented to this,” trying to get friends to form a human chain with him. As ever, the gawkers accused each other of being infiltrators and police agents.

    As that scene played out, two huge men in still another fight emerged behind us, inside the park, throwing ineffective haymakers at each other, nearly toppling tents. One of the OWS security members left to try to handle that, while his partner finally asked the police, watching from outside the barriers, to come in and remove Ehrenberg.

    Despite the invitation, the crowd swarmed around the entering officers, yelling “Pig!” and the like as the police carried the struggling, still slogan-shouting would-be Occupier out by his arms and legs.

    An EMT there to take him for a psychiatric evaluation, walking backward just ahead of the swollen group of police, protesters and park campers, put his foot through the rungs of a ladder that for some reason was leaning against the sidewalk.

    As he wailed in agony, the crowd gave no space—even as the police calmly asked them to give him room, pushing those who wouldn’t listen back with measured force.

    In press reports about the incident, a city spokesperson incorrectly claimed that the EMT was shoved or assaulted, while Occupation sources peddled the line that this was just one of those things, an unavoidable accident unrelated to the occupation.

    Did he fall or was he pushed? Yes.

    Would the Occupation movement—really, a moment—have collapsed under its own weight without the city’s heavy-handed help? Thanks to that help, we’ll never know.

    This piece first appeared at City and State New York.

  • The Best Cities For Technology Jobs

    During tough economic times, technology is often seen as the one bright spot. In the U.S. this past year technology jobs outpaced the overall rate of new employment nearly four times. But if you’re looking for a tech job, you may want to consider searching outside of Silicon Valley. Though the Valley may still be the big enchilada in terms of venture capital and innovation, it hasn’t consistently generated new tech employment.

    Take, for example, Seattle. Out of the 51 largest metro areas in the U.S., the Valley’s longtime tech rival has emerged as our No. 1 region for high-tech growth, based on long- and short-term job numbers. Built on a base of such tech powerhouses as Microsoft, Amazon and Boeing, Seattle has enjoyed the steadiest and most sustained tech growth over the past decade. It is followed by Baltimore (No. 2), Columbus, Ohio (No. 3), Raleigh, N.C. (No. 4) and Salt Lake City, Utah (No. 5).

    To determine the best cities for high-tech jobs, we looked at the latest high-tech employment data collected by EMSI, an economic modeling firm. The Praxis Strategy Group‘s Mark Schill charted those areas that have gained the most high-tech manufacturing, software and services jobs over the past 10 years, equally weighting the last five years and the last two. We also included measures of concentration of tech employment in order to make sure we were not giving too much credence to relatively insignificant tech regions. Our definition of high tech industries is based on the one used by TechAmerica, the industry’s largest trade association.

    Despite the Valley’s remarkable concentration of tech jobs — roughly six times the national average — it ranked a modest No. 17 in our survey. This relatively low ranking reflects the little known fact that, even with the recent last dot-com craze sparking over 5% growth over the past two years, the Valley remains the “biggest loser” among the nation’s tech regions, surrendering roughly one quarter of its high -tech jobs — about 80,000 — in the past decade. Only New York City (No. 44) lost more tech jobs during that time.

    In contrast to this pattern of volatility, our top performers have managed to gain jobs steadily in the past decade — and have continued to add new ones in the last two years. In addition to our top five, the only other regions to claim overall tech gains in the last 10 years are Jacksonville, Fla. (No. 6), Washington, D.C. (No. 7), San Bernardino-Riverside, Calif. (No. 9), San Diego, Calif. (No. 9), Indianapolis (No. 11) and Orlando, Fla. (No. 24).

    So what accounts for high-tech success, and where will jobs most likely grow in the next decade? Certainly being home to a major research university makes a big difference. Seattle, Columbus, Raleigh and Salt Lake City all boast major educational and research assets.

    But it’s one thing to produce scientists and engineers; it’s another to generate employment for them over the long term. Clearly for the San Jose metropolitan region (which is home to Stanford) and the much-hyped No. 29 San Francisco area (home to the University of California Medical Center) academic excellence has not translated into steady growth in tech jobs. Over the past decade the Bay Area has given up 40,000 jobs, or 19% of its tech workforce, including a loss of nearly 6,000 in software publishing.

    Or look at the Boston region (ranked No. 22), which arguably boasts the most impressive concentration of research universities in the country. The region did add jobs in research and computer programming, but these were not enough to counter huge losses in telecommunications and electronic component manufacturing. Over the past decade, greater Beantown has given up 18% of its tech jobs, or more than 45,000 positions.

    One possible explanation may lie in costs, including very high housing prices, onerous taxes and a draconian regulatory environment. In tech, company headquarters may remain in the Valley, close to other headquarters and venture firms, but new jobs are often sent either out of the country or to more business friendly regions.

    Just look at the flow of jobs from Bay Area-based companies to places like the Salt Lake area. In the past two years Valley companies such as Twitter, Adobe, eBay, Electronic Arts and Oracle have all expanded into Utah. This region has many appealing assets for Bay Area companies and workers. Salt Lake City is easily accessible by air from California, possesses a well- educated workforce, has reasonable housing costs and offers world-class skiing and other outdoor activities.

    Another huge advantage appears to be closeness to the federal government, which expends hundreds of billions on tech products both hardware and software. This explains why Baltimore, primarily its suburbs, and the D.C. metro area have enjoyed steady tech growth and, under most foreseeable scenarios, likely will continue to do so in the coming years. Both regions have seen large gains in technology services industries, particularly programming, systems design, research, and engineering.

    Yet even business climate, while important, may not be enough to drive tech job growth. Texas ranks highly in most business surveys, including our own, but it did not fare so well in this one. Indeed No. 32 Austin, often thought as the most likely candidate for the next Silicon Valley, lost over 19% of its high-tech jobs over the past decade, including more than 17,000 jobs in semiconductor, computer and circuit board manufacturing. No. 18 Houston did far better, although it has also lost 6% of its tech jobs over the same period due to the cutbacks in the engineering service, a big sector there. Even more shocking: No. 46 Dallas, generally a job-creating dynamo, has seen roughly a quarter of its high-tech jobs go away, due primarily to losses in telecommunications carriers and in manufacturing of communications equipment and electronics.

    How about other potential up and comers for the coming decade? Two potentially big and somewhat surprising winners. The first: Detroit. Though the Motor City area lost 20% of its tech jobs in the past decade (ranking 40th on our list), it still boasts one of the nation’s largest concentrations of tech workers, nearly 50% above the national average. In the past two years, the region has experienced a solid 7.7% increase in technology jobs, the second highest rate of any metro area.

    The Motor City region seems to have some real high-tech mojo. According to the website Dice.com, Detroit has led the nation with the fastest growth in technology job offerings since February — at 101%. This can be traced to the rejuvenated auto industry, which is increasingly dependent on high-tech skills. Manufacturing is increasingly prodigious driver of tech jobs; games and dot-coms are not the only path to technical employment growth. This could mean good news for other Rust Belt cities, such as No. 28 Cincinatti or No. 38 Cleveland, as well as our Midwest standout, Columbus, which could benefit from growth sparked by the local natural gas boom.

    Another potential standout is No. 8 New Orleans, whose tech base remains relatively small but has expanded its tech workforce nearly 10% since 2009 — the highest rate of any of the regions studied. With low costs, a friendly business climate and world-class urban amenities, the Crescent City could emerge as a real player, aided by the growing prominence of research and development around Tulane University. There has also been a recent growing presence of the video game industry in the city.

    Looking forward, however, it makes sense to be cautious about where tech is heading. By its nature, this is a protean industry; the mix of jobs and favored locales tend to change. If the current boom in social media continues, for example, the Bay Area could recover more of its lost jobs and further extend its primacy. Similarly a surge in manufacturing and energy-related technology could be a boon to tech in Houston, Dallas as well as New Orleans. But based on both historic and recent trends, the surest best for future growth still stands with our top five winners, led by the rain-drenched, but prospering Seattle region.

    Best Places for High Tech Growth
    Ranking of 2, 5, and 10 year growth, industry concentration, and 5 and 10 year growth momentum
    Rank Metropolitan Area Rank Score
    1 Seattle  82.2
    2 Baltimore 75.7
    3 Columbus 67.9
    4 Raleigh 63.2
    5 Salt Lake City 60.0
    6 Jacksonville 59.2
    7 Washington, DC 58.9
    8 New Orleans 58.8
    9 Riverside-San Bernardino 58.2
    10 San Diego 56.1
    11 Indianapolis 55.9
    12 Buffalo 55.8
    13 San Antonio 54.0
    14 Charlotte 53.5
    15 St. Louis 51.6
    16 Pittsburgh 50.8
    17 San Jose 50.5
    18 Houston 50.2
    19 Hartford 50.0
    20 Nashville 49.6
    21 Providence 49.2
    22 Boston 48.3
    23 Minneapolis-St. Paul 48.3
    24 Orlando 48.1
    25 Portland 48.1
    26 Philadelphia 47.4
    27 Louisville 47.2
    28 Cincinnati 46.6
    29 San Francisco 46.6
    30 Denver 46.4
    31 Richmond 45.6
    32 Austin 45.1
    33 Atlanta 44.6
    34 Virginia Beach-Norfolk-Newport News 42.4
    35 Memphis 42.2
    36 Milwaukee 41.5
    37 Rochester 41.2
    38 Cleveland 40.9
    39 Phoenix 38.5
    40 Detroit 37.7
    41 Tampa 37.5
    42 Miami 33.2
    43 Sacramento 32.1
    44 New York 31.4
    45 Las Vegas 31.2
    46 Dallas-Fort Worth 31.0
    47 Chicago 30.2
    48 Los Angeles 29.5
    49 Oklahoma City 26.7
    50 Birmingham 23.5
    51 Kansas City 21.6
    Rankings measure employment in 45 high technology manufacturing, services, and software industry sectors.

    This piece first appeared at Forbes.com.

    Joel Kotkin is executive editor of NewGeography.com and is a distinguished presidential fellow in urban futures at Chapman University, and an adjunct fellow of the Legatum Institute in London. He is author of The City: A Global History. His newest book is The Next Hundred Million: America in 2050, released in February, 2010.

    Mark Schill of Praxis Strategy Group perfomed the economic analysis for this piece.

    Seattle photo courtesy of BigStockPhoto.com.