Tag: Paris

  • The French housing Bubble also has Roots in Excessive Land Use Regulations

    Despite the claim to uniqueness that is quintessentially French, the housing bubble shares the same root as we see in the Anglo-Saxon world. To be sure, some analysts blame it only on low interest rates: they made the households more solvent, and thus drove home prices up. This rise in purchasing power might have been enhanced by some specific subsidies to new rental units. Some also y point to normative constraints on new buildings have added to production costs.

    These facts are undisputed, but a demand-only driven bubble can’t happen in a really free market where price signals provide incentives to supply more units, moderating price escalation, and eventually revert the price curve. After all, there hasn’t been anything like a “car price bubble”. So there has to be a supply side factor constraining the building of new homes. And since building itself doesn’t require scarce skills, the constraint has to come from land. These analysts observe that in middle America booming cities like Texas’ Houston and Dallas, or others in Kansas, Georgia, Oklahoma, and elsewhere didn’t experience such a price bubble despite identical credit conditions, despite in some cases, as in Texas, an even greater surge in demand.

    Numbers

    Let’s take a look at official French statistics.

    Professor Joseph Comby (From Institut d’Urbanisme de Paris) summarizes essential data in an exhaustive article (not available online) published in the very specialized peer reviewed "Revue Foncière" (n°3, January 2015), dedicated to land and housing issues. His graphs can be accessed from data provided by our national institute of statistics (INSEE).

    The first graph shows that home prices surged between 1997 and 2007, and that the prices didn’t really slump then, despite worldwide economic crisis. Average home price rose by a whopping 150% in 11 years, and rose 86% faster than households’ disposable income.


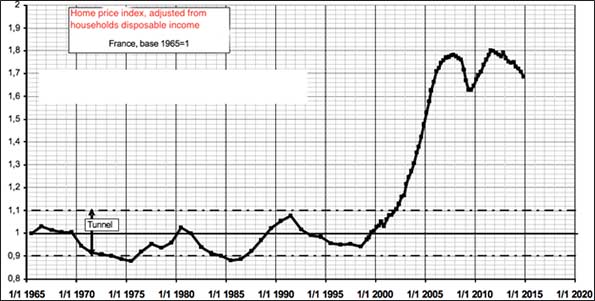
    Fig 1. Home price Index, adjusted from households’ disposable income – Base 1, 1965.
    Source: French Ministry of Sustainable Development (
    doc format)

    In this period, the median multiple in France (Average Home price / Average Household disposable income) rose from a stunningly low 2.25 to 4.21, and these average figures hide numerous regional discrepancies.

    Home prices can be truncated between land costs and building costs, including the home and the infrastructure costs (road access, sewage, water and energy adduction, and so on). Had this price hike uniquely "credit and demand" driven, we should have seen a relatively parallel evolution between land and building components in home prices.

    Our national statistics institute conducts regular wealth inquiries on the total wealth of French households. These studies show that the  share of aggregate land value in  homes value rose from 15% in 1996, to 50% in 2007, and slowly decreased then to 45% in 2013.


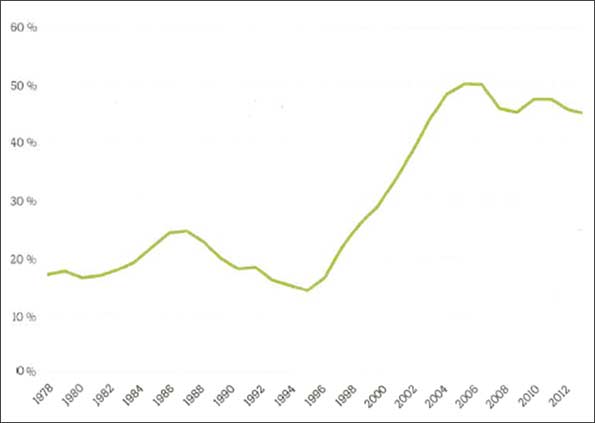
    Fig 2. France – Share of land in aggregate real estate value
    Source: J. Comby, computed from
    INSEE Annual wealth surveys

    So, from these data, let’s compute how the prices of land and building components evolved between the 1996 low and 2007 peak, relatively to households revenue. The following table summarizes it all:


     1996

    2007

    Price Increase

    Existing homes, average price – (current prices, €) (INSEE)

    77 100

    192 800

    +150%

    Average disposable income per household (current values, €)

    34 149

    45 800

    • 33%

    Ratio Home price / disposable income

    2.25

    4.21

    +86 %

    Land, % of home value

    15

    50


    Land, average value in existing homes (€)

    11 565
    (15% of 77100)

    96 400
    (50% of 192800)

    + 733 %

    Land price appreciation, adjusted from household disposable income appreciation

    + 520 %

    Building, average value in existing homes (€)


    65 535

    96 400

    + 47 %

    As has been seen in the Anglo-Saxon regulated markets, land appreciation overwhelms construction costs appreciation. Figures show clearly that the 1996-2007 real estate bubble is driven by land prices appreciation.

    As a confirmation pattern, INSEE figures from its annual wealth studies show that the total value of built land plots went from 67% of GDP in 1998 (no figures for 1996) to 308% in 2007. So owning developable land in the end of the 90s provided returns that no other asset class could offer, despite creating absolutely no new added value for society. On the contrary, high home prices have been harmful to modest households, with 6% of people experiencing very bad housing conditions (obsolete and/or overcrowded units), 9% other having tough times financing their housing needs (1).  And according to INSEE, there were 112 000 homeless people in 2012, a 44% increase from 2001 (2).

    Since there is no physical shortage of land in France (most of the country is rather flat, and only 7% of land is developed), this suggests loudly to look at our land use regulations to understand how they fed the monster.

    Our regulation of land belongs to the “prescriptive” family, according to Wendell Cox and Hugh Pavletich classification (3). It means that land is, by default, limited for natural or agricultural usage, and turning it into developable land must endure a long and politically complex zoning process. Worst of all, not only each city is zoned, but every local zoning has to comply, since the new millennium, with “territorial coherence schemes” which tend to cap the maximal amount of land available for development through years. Prescriptive regulations can be opposed to “responsive” ones, which can be seen in central parts of America and Canada. In a responsive regulatory frame, default status of land is let to the free choice of the owner, and only limitations for some collective purpose have to pass through a political process, and open a right   for owners to be compensated for the loss of land value resulting of limitations. As Cox and Pavletich as well as the Brookings institution showed, places with prescriptive regulations experienced a much tougher bubble than responsive ones during the years of wild credit expansion. France is not different and the same phenomenon happened.

    The idea of a bubble driven by strong regulatory constraints put on land meets a lot of resistance among several groups familiar in other countries: Local politicians, who get power from a population prone to NIMBY attitudes, and feeling richer through home value appreciation, are the first of them; most farmers, 70% of whom are renters, have an interest in preserving legal interdiction to turn  plots at the fringe of cities into housing developments; and there are about 40,000 employees in public and private jobs who make a living from elaborating and implementing these regulations. 

    So we can see that in France, like other countries, the role of artificial restriction of land supply for new development can’t be dismissed. The costs and benefits of these regulations should be publicly questioned. Can their advocates still deny that that this price bubble is largely an unintended outcome of regulations. Nor can they acknowledge that this  results in increasing levels of “housing poverty” and drives so much resources from more productive investments. Is this  more desirable than “sprawl containment”, “farmland preservation” and other pretenses which provided justifications for these regulations in first place ?

    Vincent Benard is senior economic analyst for the Turgot Insitute (www.turgot.org), a french classical liberal think tank. His principal interests are housing, land use and infrastructure policies, and the study of the unintended consequences of regulations.  Since 2006, he authored one book and many articles about the French housing crisis. " 

    (FYI: The book : https://www.scribd.com/mobile/doc/80163334 – Free, PDF, in French) 

    ———

    Notes: (1) Figures from the annual report of the “Abbe Pierre” Foundation, dedicated to homelessness and poverty assistance  www.fondation-abbe-pierre.fr/
    (2) Source: “L’express”, November 2014 – http://www.lexpress.fr/actualite/societe/le-nombre-de-sdf-en-france-a-explose-en-dix-ans_1623371.html
    (3) See Annual Housing affordability report, by Cox and Pavletich, www.demographia.com

    Photo by Benh LIEU SONG (Own work) [GFDL or CC BY-SA 4.0-3.0-2.5-2.0-1.0], via Wikimedia Commons

  • 125 Years of Skyscrapers

    Skyscrapers have always intrigued me. Perhaps it began with selling almanacs to subscribers on my Oregon Journalpaper route in Corvallis. I have continued to purchase almanacs each year and until recently, the first thing I would do is look in the index for "Buildings, tall” in the old Pulitzer The World Almanac, the best source until the Internet.

    My 1940 edition is the first in which “Buildings, tall” appears. The world of skyscrapers has changed radically through the years. This article provides a historical perspective on the world’s tallest buildings, using information from almanacs and the Internet (See Table Below). Extensive hyperlinking is also used, principally to articles on particular buildings.

    The Rise of Commercial and Residential Buildings

    Throughout most of history, the tallest habitable buildings have been religious edifices, or mausoleums, such as the great pyramids of Egypt. But in the middle to late 19th century, taller commercial and residential buildings were erected in the United States. For four years, from 1890 to 1894, the New York World Building, itself was the tallest in the world, at 309 feet (95 meters) and 20 floors. But it was not until the turn of the 20th century that a commercial or residential building exceeded the tallest religious building, Ulm Cathedral in Germany. This was Philadelphia’s City Hall. In its wisdom, however, Philadelphia outlawed any building higher than William Penn’s head at the top of City Hall. It was not until the late 1980s that a taller building appeared in Philadelphia (One Liberty Place).

    Tallest Buildings in 1940

    Despite Chicago’s claim as birthplace of the skyscraper, by 1940, nine of the 10 tallest buildings in the world were in New York. Manhattan was so dominant that the World Almanac listed the city at the top of the list, out of alphabetical order. The five tallest buildings, the Empire State Building, the Chrysler Building, 60 Wall Tower (now 70 Pine), 40 Wall Tower (now the Trump Building) and the RCA Building (now the GE Building) all  opened in the 1930s and represent Art Deco at its zenith. The sixth tallest, the Woolworth Building, had been the world’s tallest from 1913 to 1930 and is neo-Gothic.

    Cleveland’s Terminal Tower was 7th tallest, and the tallest building in the world outside New York. Cleveland’s Union Terminal was in the building and served the legendary New York Central Railroad’spremier New York to Chicago 20th Century Limited.

    Tallest Buildings in 1962

    Things changed little by 1962. The five Art Deco skyscrapers that where the tallest in 1940 remained so in 1962. There were two newcomers to the top 10 list, both modernist monoliths, the Chase Manhattan Bank Building in lower Manhattan and the Pan Am Building (later the Met-Life Building). The Pan Am Building is despised by many New Yorkers as Parisians despise the Tour Montparnasse. This led to banning similar behemoths in the ville de Paris (most of the skyscrapers in the Paris urban area are in La Defense, a nearby suburban “edge city”). But all of the 10 tallest buildings in the world were in the United States.

    Tallest Buildings in 1981

    Just two decades later, New York’s dominance eroded. By now, The World Almanac listed New York in alphabetical order, between New Orleans and Oakland. For the first time since before 1908 when the Singer Building opened, New York was not the home of the world’s tallest building. That title had gone to Chicago’s, Sears Tower (later Willis Tower), which opened in 1974. Chicago gained even more respect with two other buildings appearing in the top 10, the Standard Oil Building (nowAon Center) and the John Hancock Center, which was the tallest mixed use (residential and commercial) building in the world. The twin towers of the former New York World Trade Center were tied for second tallest in the world.

    For the first time, a non-American skyscraper was in the top 10. Toronto’s First Canadian Place was the eighth tallest in the world. Only three of the former five New York Art Deco buildings remained in the top 10, with 40 Wall Tower and the RCA Building no longer on the list.

    Tallest Building in 2000

    By 2000,   Kuala Lumpur, which is not among the largest cities in the world, emerged with both of the tallest buildings, in the Petronas Towers. The Petronas Towers ended America’s long history of having the tallest building. These distinctive postmodern towers were just two of six Asian entries in the top 10, including another postmodern structure, the Jin Mao Tower in Shanghai’s Pudong, which is probably the world’s largest edge city.

    I recall my surprise at exiting the Guangzhou East Railway station in 1999 to see the CITIC Tower, the 7th tallest building in the world. There could have been no better indication of that nation’s modernization. The Pearl River Delta had two other of the tallest buildings, one in Shenzhen (Shun Hing Square), the special economic zone that became the economic model for the rest of China, and the second in Hong Kong (Central Plaza).

    Tallest Building in 2013

    By 2013, the world of skyscrapers had nearly completely overturned. Dubai, with a population little more than Minneapolis-St. Paul, is now home to the world’s tallest building, the Burj Khalifa. The Burj Khalifa is not just another building. Never in history has a new tallest building exceeded the height of the previous tallest building by so much. Even the long dominant Empire State Building had exceeded the Chrysler building by only 200 feet (64 meters). The Burj Khalifa was nearly 1050 feet higher (320 meters) than the then tallest building, Taipei 101, and reaches to more than 1/2 mile (0.8 kilometers) into the sky. The world’s second tallest building (the Mecca Royal Hotel Clock Tower) is also on the Arabian Peninsula.

    The Shanghai World Financial Center is now the fourth tallest in the world, and when it opened had the highest habitable floor and the highest observation deck in the world. Its unusual design has earned it the nickname "bottle opener" among residents (Photo 1). Hong Kong has a new entry in the list, the International Commerce Center, across the harbor in Kowloon. Nanjing’s Greenland Financial Complex (Photo 2) ranks 8th, and Shenzhen’s Kinkey 100 ranks 10th.


    Nine of the 10 tallest buildings in the world are now in Asia. The last American entry is the Sears Tower (Willis Tower), in Chicago, which ranks 9th. Skyscraperpage.com maintains a graphic of the world’s tallest buildings (Note 1).

    Under Construction: A number of super-tall buildings (Note 2) will soon open. Earlier this month, the Shanghai Tower was “topped out.” This structure is across the street from the Jin Mao Tower and the Shanghai World Financial Center, forming by far the greatest concentration of super-tall skyscrapers in the world (Photo 1). The Ping An Finance Center in Shenzhen and the Wuhan Greenland Center in Wuhan are also under construction, and will rank, at least temporarily, second and third tallest in the world when completed. The Goldin Finance Building in Tianjin and the Lotte World Tower in Seoul will be somewhat shorter. One World Trade Center in New York will be completed before most of these, which will allow it brief entry into the top ten.

    Another entry, Sky City in Changsha (Hunan) could be on the list, slightly taller than the Burj Khalifa. This building is to be constructed in 210 days, following site preparation and work began last month. It was, however, halted by municipal officials and there are conflicting reports as to the building’s status.

    Skyscraperpage.com also maintains a graphic of the world’s tallest under-construction buildings.

    Tallest Buildings in 2020?

    None of the tallest buildings in the world are predicted to be in the United States by 2020, according to a graphic of current plans posted on the Council on Tall Buildings and Urban Habitat website. The Burj Khalifa is expected to be replaced as tallest by another Arabian Peninsula entry, the Kingdom Tower in Jeddah, which will be 0.6 miles high (3.3 kilometers). The torch has been passed to Asia.

    WORLD’S TALLEST COMPLETED BUILDINGS: 1940-2013
    1940 Building City Feet Meters Stories
    1 Empire State New York 1,250 381 102
    2 Chrysler New York 1,046 319 77
    3 60 Wall Tower (70 Pine Street) New York 950 290 66
    4 40 Wall Tower (Trump) New York 927 283 90
    5 RCA New York 850 259 70
    6 Woolworth New York 792 241 60
    7 Terminal Tower Cleveland 708 216 52
    8 Metropolitan Life New York 700 213 50
    9 500 5th Avenue New York 697 212 60
    10 20 Exchange Place New York 685 209 54
    1962 Building City Feet Meters Stories
    1 Empire State New York 1,250 381 102
    2 Chrysler New York 1,046 319 77
    3 60 Wall Tower (70 Pine Street) New York 950 290 66
    4 40 Wall Tower (Trump) New York 927 283 71
    5 RCA New York 850 259 70
    6 Pan Am (Met-Life) New York 830 253 59
    7 Chase Manhattan New York 813 248 60
    8 Woolworth New York 792 241 60
    9 20 Exchange Place New York 741 226 57
    10 Terminal Tower Cleveland 708 216 52
    1981 Building City Feet Meters Stories
    1 Sears Tower (Willis Tower) Chicago 1,454 443 110
    2 World Trade Center-North Tower New York 1,350 411 110
    2 World Trade Center-South Tower New York 1,350 411 110
    4 Empire State New York 1,250 381 102
    5 Standard Oil (Amoco) Chicago 1,136 346 80
    6 John Hancock Center Chicago 1,127 344 100
    7 Chrysler New York 1,046 319 77
    8 Texas Commerce Tower Houston 1,002 305 75
    9 First Canadian Place Toronto 952 290 72
    10 60 Wall Tower (70 Pine Street) New York 950 290 66
    2000 Building City Feet Meters Stories
    1 Petronas Tower 1 Kuala Lumpur 1,483 452 88
    1 Petronas Tower 2 Kuala Lumpur 1,483 452 88
    3 Sears Tower (Willis Tower) Chicago 1,454 443 110
    4 Jin Mao Tower Shanghai 1,381 421 88
    5 World Trade Center-North Tower New York 1,350 411 110
    5 World Trade Center-South Tower New York 1,350 411 110
    7 Citic Plaza Guangzhou 1,283 391 80
    8 Shun Hing Center Shenzhen 1,260 384 69
    9 Empire State New York 1,250 381 102
    10 Central Plaza Hong Kong 1,227 374 78
    2013 Building City Feet Meters Stories
    1 Burj Khalifa Dubai 2,717 828 163
    1 Mecca Royal Hotel Clock Tower Mecca 1,971 601 120
    3 Taipei Taipei 101 1,670 508 101
    4 Shanghai World Financial Center Shanghai 1,614 592 101
    5 International Commerce Center Hong Kong 1,588 484 118
    6 Petronas Tower 1 Kuala Lumpur 1,483 452 88
    6 Petronas Tower 2 Kuala Lumpur 1,483 452 88
    8 Greenland Financial Complex Nanjing 1,476 450 89
    9 Sears Tower (Willis Tower) Chicago 1,454 443 110
    10 Kinkey 100 Shenzhen 1,450 442 100
      Outside United States
      United States, Outside New York
      New York


    Wendell Cox is a Visiting Professor, Conservatoire National des Arts et Metiers, Paris and the author of “War on the Dream: How Anti-Sprawl Policy Threatens the Quality of Life.

    ———————

    Note 1: There are a number of sources for information on tall buildings, such as the Council on Tall Buildings and Urban Habitat, Skyscraperpage.com, Emporis.comand Wikipedia.com. Of course, my favorite will always be The World Almanac, even if the Internet provides faster access. Wikipedia also has fascinating articles on individual buildings (Wikipedia’sutility is limited to recreational research for identifying original sources, and should never be used in serious research, or God forbid, used in a footnote).

    Note 2: The Council on Tall Buildings and Urban Habitats defines a super-tall building as being over 980 feet (300 meters) high.

    ——————————

    Photo 1: Jin Mao Tower (left) and Shanghai World Financial Center (right), Shanghai. Construction began later on the recently topped out Shanghai Tower to the right of the Shanghai World Financial Center.

    Photo 2: Greenland Financial Center, Nanjing

    —————————-

    Photograph: The New York World Building (1890-1955).

  • The Next Boom Towns In The U.S.

    What cities are best positioned to grow and prosper in the coming decade?

    To determine the next boom towns in the U.S., with the help of Mark Schill at the Praxis Strategy Group, we took the 52 largest metro areas in the country (those with populations exceeding 1 million) and ranked them based on various data indicating past, present and future vitality.

    We started with job growth, not only looking at performance over the past decade but also focusing on growth in the past two years, to account for the possible long-term effects of the Great Recession. That accounted for roughly one-third of the score.  The other two-thirds were made up of a a broad range of demographic factors, all weighted equally. These included rates of family formation (percentage growth in children 5-17), growth in educated migration, population growth and, finally, a broad measurement of attractiveness to immigrants — as places to settle, make money and start businesses.

    We focused on these demographic factors because college-educated migrants (who also tend to be under 30), new families and immigrants will be critical in shaping the future.  Areas that are rapidly losing young families and low rates of migration among educated migrants are the American equivalents of rapidly aging countries like Japan; those with more sprightly demographics are akin to up and coming countries such as Vietnam.

    Many of our top performers are not surprising. No. 1 Austin, Texas, and No. 2 Raleigh, N.C., have it all demographically: high rates of immigration and migration of educated workers and healthy increases in population and number of children. They are also economic superstars, with job-creation records among the best in the nation.

    Perhaps less expected is the No. 3 ranking for Nashville, Tenn. The country music capital, with its low housing prices and pro-business environment, has experienced rapid growth in educated migrants, where it ranks an impressive fourth in terms of percentage growth. New ethnic groups, such as Latinos and Asians, have doubled in size over the past decade.

    Two advantages Nashville and other rising Southern cities like No. 8 Charlotte, N.C., possess are a mild climate and smaller scale. Even with population growth, they do not suffer the persistent transportation bottlenecks that strangle the older growth hubs. At the same time, these cities are building the infrastructure — roads, cultural institutions and airports — critical to future growth. Charlotte’s bustling airport may never be as big as Atlanta’s Hartsfield, but it serves both major national and international routes.

    Of course, Texas metropolitan areas feature prominently on our list of future boom towns, including No. 4 San Antonio, No. 5 Houston and No. 7 Dallas, which over the past years boasted the biggest jump in new jobs, over 83,000. Aided by relatively low housing prices and buoyant economies, these Lone Star cities have become major hubs for jobs and families.

    And there’s more growth to come. With its strategically located airport, Dallas is emerging as the ideal place for corporate relocations. And Houston, with its burgeoning port and dominance of the world energy business, seems destined to become ever more influential in the coming decade. Both cities have emerged as major immigrant hubs, attracting on newcomers at a rate far higher than old immigrant hubs like Chicago, Boston and Seattle.

    The three other regions in our top 10 represent radically different kinds of places. The Washington, D.C., area (No. 6) sprawls from the District of Columbia through parts of Virginia, Maryland and West Virginia. Its great competitive advantage lies in proximity to the federal government, which has helped it enjoy an almost shockingly   ”good recession,” with continuing job growth, including in high-wage science- and technology-related fields, and an improving real estate market.

    Our other two top ten, No. 9 Phoenix, Ariz., and No. 10 Orlando, Fla., have not done well in the recession, but both still have more jobs now than in 2000. Their demographics remain surprisingly robust. Despite some anti-immigrant agitation by local politicians, immigrants still seem to be flocking to both of these states. Known better s as retirement havens, their ranks of children and families have surged over the past decade. Warm weather, pro-business environments and, most critically, a large supply of affordable housing should allow these regions to grow, if not in the overheated fashion of the past, at rates both steadier and more sustainable.

    Sadly, several of the nation’s premier economic regions sit toward the bottom of the list, notably former boom town Los Angeles (No. 47). Los Angeles’ once huge and vibrant industrial sector has shrunk rapidly, in large part the consequence of ever-tightening regulatory burdens. Its once magnetic appeal to educated migrants faded and families are fleeing from persistently high housing prices, poor educational choices and weak employment opportunities. Los Angeles lost over 180,000 children 5 to 17, the largest such drop in the nation.

    Many of L.A.’s traditional rivals — such as Chicago (with which is tied at No. 47), New York City (No. 35) and San Francisco (No. 42) — also did poorly on our prospective list.  To be sure,  they will continue to reap the benefits of existing resources — financial institutions, universities and the presence of leading companies — but their future prospects will be limited by their generally sluggish job creation and aging demographics.

    Of course, even the most exhaustive research cannot fully predict the future. A significant downsizing of the federal government, for example, would slow the D.C. region’s growth. A big fall in energy prices, or tough restrictions of carbon emissions, could hit the Texas cities, particularly Houston, hard. If housing prices stabilize in the Northeast or West Coast, less people will flock to places like Phoenix, Orlando or even Indianapolis (No.11) , Salt Lake City (No. 12) and Columbus (No. 13). One or more of our now lower ranked locales, like Los Angeles, San Francisco and New York, might also decide to reform in order to become more attractive to small businesses and middle class families.

    What is clear is that well-established patterns of job creation and vital demographics will drive future regional growth, not only in the next year, but over the coming decade.  People create economies and they tend to vote with their feet when they choose to locate their families as well as their businesses.  This will prove   more decisive in shaping future growth   than the hip imagery and big city-oriented PR flackery that dominate media coverage of America’s changing regions.

    Cities of the Future Rankings
    Rank Metropolitan Area
    1 Austin, TX
    2 Raleigh, NC
    3 Nashville, TN
    4 San Antonio, TX
    5 Houston, TX
    6 Washington, DC-VA-MD-WV
    7 Dallas-Fort Worth, TX
    8 Charlotte, NC-SC
    8 Phoenix, AZ
    10 Orlando, FL
    11 Indianapolis, IN
    12 Salt Lake City, UT
    13 Columbus, OH
    14 Jacksonville, FL
    15 Atlanta, GA
    16 Las Vegas, NV
    16 Riverside, CA
    18 Portland, OR-WA
    19 Denver, CO
    20 Oklahoma City, OK
    21 Baltimore, MD
    22 Louisville, KY-IN
    22 Richmond, VA
    24 Seattle, WA
    25 Kansas City, MO-KS
    26 San Diego, CA
    27 Miami, FL
    28 Tampa, FL
    29 Sacramento, CA
    30 Birmingham, AL
    31 New Orleans, LA
    32 Philadelphia, PA-NJ-DE-MD
    33 Minneapolis, MN-WI
    34 St. Louis, MO-IL
    35 Cincinnati, OH-KY-IN
    35 New York, NY-NJ-PA
    37 Boston, MA-NH
    38 Memphis, TN-MS-AR
    39 Pittsburgh, PA
    40 Virginia Beach, VA-NC
    41 Rochester, NY
    42 Buffalo, NY
    42 San Francisco, CA
    44 Hartford, CT
    45 Milwaukee, WI
    45 San Jose, CA
    47 Chicago, IL-IN-WI
    47 Los Angeles, CA
    49 Providence, RI-MA
    50 Detroit, MI
    51 Cleveland, OH

    This piece originally appeared at Forbes.com.

    Joel Kotkin is executive editor of NewGeography.com and is a distinguished presidential fellow in urban futures at Chapman University, and an adjunct fellow of the Legatum Institute in London. He is author of The City: A Global History. His newest book is The Next Hundred Million: America in 2050, released in February, 2010.

    Photo by Exothermic Photography

  • Special from Sydney: Misunderstanding Paris

    Reporters, columnists and even consultants often misunderstand urban areas and urban terms. The result can be absurd statements that compare the area in which the writer lives to somewhere else where the grass is inevitably greener, bringing to mind an expensive competitiveness report that suggested St. Louis should look to Cleveland as a model. Sometimes this is the result of just not understanding and other times it results from listening to itinerant missionaries from idealized areas who have no sense of the reality.

    A most recent example is from the Sydney Morning Herald, one of Australia’s largest and most respected newspapers.

    Columnist Elizabeth Farrelly told her readers that Paris covers one-quarter the land area (urban footprint) of Sydney and has a population of 5.5 million. In fact, the urban footprint of Paris is at least five times larger and the population nearly double.

    According to the Institut national de la statistique et des études économiques (INSEE), the statistics bureau of France, the urban footprint of Paris was 2,723 square kilometers in 1999 and the population in that area was 10,143,000 in 2006 (both figures are the latest data available).

    In contrast, according to the Australian Bureau of Statistics (ABS), the statistics bureau of Australia, the urban footprint of Sydney was 1,788 square kilometers in 2006. However, even the 50 percent larger urban footprint of Paris may actually understate the difference, because ABS uses a lower population density threshold than INSEE for urban versus rural classification. The difference between the two urban footprints is shown in the figure below.

    Ms. Farrelly also decried the continuing sprawl that she perceives in Sydney, despite the fact that no urban area in the new world, except perhaps Vancouver, has shut down home construction on its fringe to a greater degree (nor even has Paris). The effect of Sydney’s development Berlin Wall is housing affordability so bad that it is second only behind Vancouver out of nearly 275 metropolitan areas in the 6 nations we cover in the Demographia International Housing Affordability Survey.

  • Who’s Racist Now? Europe’s Increasing Intolerance

    With the rising tide of terrorist threats across Europe, one can somewhat understandably expect a   surge in Islamophobia across the West. Yet in a contest to see which can be more racist, one would be safer to bet on Europe than on the traditional bogeyman, the United States.

    One clear indicator of how flummoxed Europeans have become about diversity were the remarks last week by German Chancellor Angela Merkel saying that multi-culturalism has “totally failed” in her country, the richest and theoretically  most capable of absorbing immigrants. “We feel tied to Christian values,” the Chancellor said. “Those who don’t accept them don’t have a place here.”

    One can appreciate Merkel’s candor but it does say something the limitations about the continent’s ability, and even willingness, to absorb immigrants. It’s quite a change from the generations-old tendency among Europeans, particularly on the left, to denigrate America as a kind of hot bed for racism.  Yet even before the latest report of potential terrorist attacks in several western European cities, the center of Islamophobia – and related ethnic hatreds – has been shifting inexorably to the European continent.

    Of course, America has always had its bigots, and still does. And of course, Islamists who threaten or commit violence need to be arrested and thrown behind bars. But, to date, neither major political party has been able to make openly white-supremacist politics a successful leading platform. After all, what was the last time anyone took Pat Buchanan , who has made comments similar to those of Merkel, seriously? Despite the brouhaha over the Arizona anti-illegal alien law, only 5% of Americans consider immigration the nation’s most pressing issue, according to a September Gallup poll.

    The situation in Europe is quite different. Openly racist, anti-immigrant and Islamophobic groupings are on the rise, and they are wreaking havoc on once subdued European politics. Traditional mainstream parties are declining, and the new racist parties can be seen in broad daylight in Austria, Switzerland, Denmark, Sweden and the Netherlands, where populist firebrand Geert Wilders has suggested banning the Koran. In Italy the anti-immigrant Northern League is already hugely powerful.

    It is true that as many Europeans as Americans–about half–think immigration is bad for their countries.  The big difference is what Europeans are willing to do about it. Just consider French President Nicholas Sarkozy’s farcical effort this fall to expel the hapless Roma.

    Yet for most Europeans the big issue is not purse-snatching gypsies but fear and loathing toward the expanding presence of Muslims–who are at least three times as numerous in the E.U. as in the U.S.  Over half of Spaniards and Germans, according to Pew, hold negative views of Muslims. So do roughly 40% of the French. In contrast, only 23% of Americans share this sentiment.

    More disturbing, Europe is actually putting these ethnic hostilities into law. An early sign came this winter, when the usually phlegmatic  Swiss voted to prohibit the building of new minarets. More recently a ban on burqas – the admittedly unattractive female body suits favored by some orthodox Muslims – passed in France, home to Europe’s largest Muslim community. The same measure is now being considered in Spain.

    These actions reflect a broad, and deepening, stream of European public opinion. A recent Pew survey found that over 80% of the French support banning the burqa, as do over 70% of Germans and a large majority of Spaniards and British.

    In contrast, nearly two-thirds of Americans find the burqa ban distasteful. Burqas don’t exactly stir admiring glances in the shopping mall, but few Amercians think we need to ban them. The basic ideal of “don’t tread on me” means “don’t tread on them” as well – at least until they start blowing themselves up at Wal-mart.

    This nuance escapes some of our own knee-jerk racial obsessives, like the Atlanta Journal Constitution’s Cynthia Tucker, who equates opposition to a mosque at Ground Zero as proof of a “new McCarthyism”  aimed against Muslims. But you don’t have to be a bigot to have second thoughts about erecting a mosque at the very spot where innocents were slaughtered by radical Islamists.

    Critical here are profound differences between the U.S. and Europe  in  the role played by ethnicity, race and religion. On the continent national culture is precisely that — the product of a long history of a particular ethnic group. Small minorities, such as Jews in Holland or Armenians in France, are tolerated but expected to submerge their ethnic identities. France has many artists and writers who may be Jewish, but you don’t see many French Woody Allens or Larry Davids who exploit their otherness to help define the national culture.

    Muslim attitudes in Europe are not exactly helpful either.  European Muslims often seem more interested in breaking the national mold than adding to its contours.  More than 80% of British Muslims, for example, identify themselves as Muslims first before being British. This is true of nearly 70% of Muslims in Spain or Germany. Similarly, up to 40% of Britain’s Islamic population believe that terrorist attacks on both Americans and their fellow Britons are justified.

    This alienation also reflects an appalling social and economic reality. In European countries immigrants can receive welfare more easily than join the workforce, and their job prospects are confined by education levels that lag those of immigrants in the United States, Canada and Australia. In France unemployment among immigrants–particularly those from Muslim countries–is often at least twice that of the native born; in Britain Muslims are far more likely to be out of the workforce than either Christians or Hindus.

    Partly due to a less generous welfare state, American immigrant workers with lower educations have, for the most part, been more economically active than their nonimmigrant counterparts.  The contrast is even more telling among Muslim immigrants. In America most Muslims are comfortably middle class, with income and education levels above the national average. They are more likely to be satisfied with the state of the country, their own community and their prospects for success than are other Americans—even in the face of the reaction to 9-ll.

    More important still, more than half of Muslims identify themselves as Americans first, a far higher percentage than in the various countries of Western Europe.   More than four in five are registered to vote, a sure sign of civic involvement. Almost three-quarters, according to a Pew study, say they have never been discriminated against–something that is definitely not the case in Europe where a majority, according to Pew, complain of discrimination.

    Over time, these differences between Europe and America may become even more pronounced. America is becoming increasingly diverse, but it is also growing demographically, and Muslims make up a very small part of that. There’s little fear in Anerica of the kind  of  Muslim envelopment that appears to threaten a  rapidly aging, and soon to be depopulating, Europe.

    Of course the U.S. still has its bigoted Islamophobes, just as it has its own small cadre of vicious Islamists. One law of history appears to be that morons will be morons.   But America’s culture seems strong enough to resist the anti-immigrant hysteria emerging throughout Europe. This is one case where  la difference between America and Europe may prove  a very good thing indeed.

    This article originally appeared at Forbes.com.

    Joel Kotkin is executive editor of NewGeography.com and is a distinguished presidential fellow in urban futures at Chapman University. He is author of The City: A Global History. His newest book is The Next Hundred Million: America in 2050, released in February, 2010.

    Photo by World Economic Forum

  • Why The ‘Livable Cities’ Rankings Are Wrong

    Few topics stir more controversy between urbanists and civic boosters than city rankings. What truly makes a city “great,” or even “livable”? The answers, and how these surveys determine them, are often subjective, narrow or even misguided. What makes a “great” city on one list can serve as a detriment on another.

    Recent rankings of the “best” cities around the world by the Economist Intelligence Unit, Monocle magazine and the Mercer quality of life surveys settled on a remarkably similar list. For the most part, the top ranks are dominated by well-manicured older European cities such as Zurich, Geneva, Vienna, Copenhagen, Helsinki and Munich, as well as New World metropolises like Vancouver and Toronto; Auckland, New Zealand; and Perth and Melbourne in Australia.

    Only Monocle put a truly cosmopolitan world city – Tokyo – near the top of its list. The Economist rankings largely snubbed American cities – only Pittsburgh made it anywhere near the top, at No. 29 out of 140. The best we can say is most American cities did better than Harare, Zimbabwe, which ran at the bottom. Honolulu got a decent No. 11 on the Monocle list and broke into the top 30 on Mercer’s, as did No. 29 San Francisco. But regarding American urban boosters, that’s all, folks.

    To understand these rather head-scratching results, one must look at the criteria these surveys used. Cultural institutions, public safety, mass transit, “green” policies and other measures of what is called “livability” were weighted heavily, so results skewed heavily toward compact cities in fairly prosperous regions. Most of these regions suffer only a limited underclass and support a relatively small population of children. In fact, most of the cities are in countries with low birthrates – Switzerland’s median fertility rate, for example, is about 1.4, one of the lowest on the planet and a full 50% below that of the U.S.

    These places make ideal locales for groups like traveling corporate executives, academics and researchers targeted by such surveys. With their often lovely facades, ample parks and good infrastructure, they constitute, for the most part, a list of what Wharton’s Joe Gyourko calls “productive resorts,” a sort of business-oriented version of an Aspen or Vail in Colorado or Palm Beach, Fla. Honolulu is an exception, more a vacation destination than a bustling business hub.

    Yet are those the best standards for judging a city? It seems to me what makes for great cities in history are not measurements of safety, sanitation or homogeneity but economic growth, cultural diversity and social dynamism. A great city, as Rene Descartes wrote of 17th century Amsterdam, should be “an inventory of the possible,” a place of imagination that attracts ambitious migrants, families and entrepreneurs.

    Such places are aspirational – they draw people not for a restful visit or elegant repast but to achieve some sort of upward mobility. By nature these places are chaotic and often difficult to navigate. Ambitious people tend to be pushy and competitive. Just think about the great cities of history – ancient Rome, Islamic Baghdad, 19th century London, 20th century New York – or contemporary Los Angeles, Houston, Shanghai and Mumbai.

    These represent a far different urbanism than what one finds in well-organized and groomed Zurich, Vienna and Copenhagen. You would not call these cities and their ilk with metropolitan populations generally less than 2 million, “bustling.” Perhaps a more fitting words would be “staid” and “controlled.”

    Peace and quiet is very nice, but it doesn’t really encourage global culture or commerce. Growth and change come about when newcomers jostle with locals not just as tourists, or orbiting executives, but as migrants. Great cities in their peaks are all about this kind of yeasty confrontation.

    Alas, comfort takes precedence over dynamism in these new cities. Take the immigration issue: Unlike Amsterdam in its heyday or London or New York today, most northern European countries have turned hostile to immigration and many have powerful nativist parties. These are directed not against elite corporate executives or academics, but newcomers from developing countries. In some cases, resentment is stoked by immigrants taking advantage of well-developed welfare systems that worked far better in a homogeneous country with shared attitudes of social rights and obligations.

    Of course, these cities aren’t total deadweights. After all, Switzerland has its banks, Helsinki boasts Nokia and Denmark remains a key center of advanced and green manufacturing technology. For its part, Vancouver gets Americans to shoot cheap movie and TV shows with massive tax breaks and will host the Winter Olympics. But none can be considered major shapers of the modern world economy.

    The one American city favored by The Economist, Pittsburgh, represents a pale – and less attractive – version of these top-ranked European, Canadian or Australian cities. Its formerly impressive array of headquarters has shrunk to a handful. Once the capital of steel, it now pretty much depends on nonprofits, hospitals and universities.

    You will be hearing a lot more about Pittsburgh – the city has a prodigious PR machine funded largely by nonprofit foundations and universities – as it gets ready to host the G-20 meeting next month. Fans claim that the former steel town has developed a stable – if hardly dynamic – economy. Its torpidity is being sold a strength; boom-resistant in the best of times, it’s also proved relatively recession-proof as well.

    In this sense, Pittsburgh represents the American model of the slow-growth European city. This may appeal to those doing quality-of-life rankings, but not to those who have been fleeing the Steel City for other places for generations. Immigrants are hardly coming in droves either – Pittsburgh ranks near last among major metropolitan areas in percentage of foreign-born residents. As longtime local columnist and resident Bill Steigerwald notes, since 1990 more Pittsburghers have been dying than being born. If this represents America’s urban future, perhaps it’s one that takes its inspiration from Alan Weisman’s “A world without us.”

    Yet the future of urbanism, here and abroad, will not be Pittsburgh. Based on current preferences, something like 20 million – or more – people will have moved to U.S. cities by 2050. Most will likely settle in more dynamic places like New York, Los Angeles, Houston, Phoenix, Dallas, Chicago and Miami. These cities have become magnets for restless populations, both domestic and foreign-born. They also contain all the clutter, constant change, discomfort and even grime that characterize great cities through history.

    But it’s economics that drives migrants to these dirtier, busier metropolitan centers. Many of the cities at the top of the livability lists, by contrast, are also among the world’s most expensive. They generally also have high taxes and relatively stagnant job markets.

    Many U.S. cities, however, offer far more materially to their average residents than their elite European counterparts do. American cities, when assessed by purchasing-power parity, notes demographer Wendell Cox, do very well indeed. Viewed this way, the U.S. boasts eight of the top 10 – and 37 of the top 50 – metropolitan regions in terms of per capita income.

    The top city on Cox’s list, San Jose, Calif., epitomizes both the strengths and weaknesses of the American city. The heartland of Silicon Valley, the San Jose region has generated one of the world’s most innovative – and well-paid – economies. On the other hand, its mass transit usage is minuscule, its cultural attributes measly and its downtown hardly a tourist destination.

    Meanwhile, pricey and scenic Zurich, No. 2 on the Mercer list and No. 10 on The Economist rankings, comes in 74th when considering adjusted per capita income. Economist favorite Vancouver, one of the most expensive second-tier cities on the planet, ranks 71st. For the average person seeking to make money and improve his or her economic status, it usually pays not to settle in one of the world’s “most livable” cities.

    This is not to say that rambunctious urban centers like Los Angeles, New York or London couldn’t learn from their more “livable” counterparts. Anyone who has braved the maddening crowds in Venice Beach, Times Square or London’s Piccadily knows a city can have too much of a good thing. Los Angeles could use a more efficient bus system. Better-maintained subways and commuter trains in New York would be welcome by millions as they would in Greater London.

    Ultimately great cities remain, almost by necessity, raw (and at times unpleasant) places. They are filled with the sights and smells of diverse cultures, elbowing streetwise entrepreneurs and the inevitable mafiosi. They all suffer the social tensions that come with rapid change and massive migration. New York, Los Angeles, London, Shanghai, Mumbai or Dubai may not shoot to the top of more elite, refined rankings, but they contain the most likely blueprint of our urban future.

    This article originally appeared at Forbes.

    Joel Kotkin is executive editor of NewGeography.com and is a presidential fellow in urban futures at Chapman University. He is author of The City: A Global History. His next book, The Next Hundred Million: America in 2050, will be published by Penguin early next year.

  • Move to Suburbs Continues in Western Europe

    Despite the assertions of some planners and urban boosters, urban core population loss has been the rule since mid-century throughout the metropolitan areas of Western Europe (see note below). For example, the ville de Paris lost a quarter of its population from 1954 to 1999, Copenhagen shrank 39 percent from 1950 to 1991, inner London (This includes the 13 inner boroughs and the “city” of London, which are roughly the former London County Council area) declined by a third from 1951 to 1991 while Milan‘s population declined by a quarter from 1971 to 2001.

    At the same time, widely ignored by many American observers, Western Europe has been suburbanizing strongly. Since 1965, virtually all major metropolitan area growth has been in the suburbs. Indeed the share of the metropolitan area population gains in the suburbs has been greater in Western Europe than in the United States.

    It is true, however, that there has been a generally modest turnaround in core population trends, with strong turnarounds in the “ancient” losers of Vienna (which peaked in 1911) and inner London (which peaked in 1901). It might be tempting to suggest – as is often done in the United States – that these reversals indicate that Europeans are moving back to the cities from the suburbs.

    To answer this question, we examined all of the available “components of population change” reported by the census authorities of Western European nations. Seven of the 17 (the European Union-15 plus Norway and Switzerland) produce such data at a geographical level that makes metropolitan analysis possible. A review of this data suggests that the new residents are largely international migrants and that the core cities generally continue to lose domestic migrants, while the suburban areas continue to perform better with respect to attracting domestic migrants. This parallels the experience in the United States.

    Vienna: Vienna illustrates the trend. The city of Vienna increased its population from 1,550,000 to 1,656,000 between 2002 and 2007. This 7.3 percent gain is impressive but over the same period, a net 11,000 residents left the city. Virtually all of the population increase was the result of international migration, which accounted for 113,000 new residents. On the other hand, the suburbs of Vienna added 32,000 new domestic migrants and also added 23,000 international migrants. Vienna’s population turnaround can be fully attributed to immigration.

    Inner London and England: Like Vienna, inner London’s gains have not been the result of people moving from the suburbs to the city. Between 2001 and 2007, a net 326,000 people moved from inner London to other parts of England and Wales. The domestic migration losses were even larger than the gain of 282,000 from international migration. The inner suburbs (the outer boroughs added to the city in the 1960s) also lost domestic migrants, but at a rate half that of inner London. The exurbs (the two rings of counties outside the Green Belt) added 126,000 domestic migrants and a somewhat larger number of international migrants.

    Overall, the London metropolitan region experienced a net domestic migration loss of more than 383,000 between 2001 and 2007. However, there were strong international migration gains, in every sector of the metropolitan area.

    Thus, the data indicates that the recent inner London population growth is not the result of suburbanites moving to the city. Inner London’s population growth is being driven by international migration and the natural increase in population (births minus deaths).

    As with inner London, the cores of Birmingham, Manchester, Liverpool, Newcastle and Leeds-Bradford all lost domestic migrants from 2001 to 2007. Thus, despite the improved population performance of the largest metropolitan areas in the United Kingdom, people continue to move out of the cores, while people are generally moving to suburban areas.

    Milan and Italy: The city of Milan, the core of Italy’s largest metropolitan area, has experienced one of Western Europe’s most significant population losses since the early 1970s. Yet, in the early years of the decade, Milan has experienced a turnaround, as the population has begun to grow. The pattern was much the same as seen in London, with a net 40,000 residents leaving Milan province to move to other parts of Italy. At the same time, there was a strong net international migration gain of 168,000. Suburban areas, on the other hand, attracted a net 119,000 domestic migrants as well as a strong component of international migration.

    A shorter data series is available for cities (communes) and shows net domestic migration losses in the central cities of Milan, Rome, Naples, Turin, Genoa, Palermo, Florence and Bologna. The suburbs, however, gained domestic migrants, with the exception of Naples. However, the Naples suburban losses were at a far lower rate than that of the city.

    It is thus evident that the core areas of the largest Italian metropolitan areas are not receiving net migration from their suburbs.

    Stockholm and Sweden: Similarly, the city of Stockholm’s recent gains have not been the result of migration from the suburbs. Between 2001 and 2007, the city lost a net 8,000 domestic migrants. This loss was more than made up by the international net migration of 29,000. At the same time, the suburbs and exurbs gained 15,000 domestic migrants.

    Sweden’s second largest metropolitan area, Gothenburg, was one of only two of the 19 cases in which there was net domestic migration to the core (which had been enlarged in the 1990s to include many suburban areas). The city gained 500 domestic migrants and 15,000 international migrants. However, the suburbs gained approximately 13 times as many domestic migrants than the city, again indicating no trend of movement from the suburbs to the city.

    Helsinki: Finland’s capital mirrors the general trend. The city of Helsinki lost 6,500 domestic migrants between 2002 and 2007, which was more than compensated for by an 11,800 net international migration gain. As in nearly all of the other cases, the suburbs and exurbs gained domestic migration, illustrating that there is not a movement from the suburbs to the city in Helsinki.

    Oslo: Norway’s capital was, with Gothenburg, the only core experiencing net domestic migration. Oslo County gained 5,400 domestic migrants. However, the suburbs and exurbs gained domestic migrants at a greater rate, adding 16,000. Thus, despite the core domestic migration gains, there is no evidence of a “return” from the suburbs and exurbs to the city in Oslo.

    Conclusion: The available data from national census authorities provides no evidence to suggest any sort of general movement of the population from suburban and exurban areas to the central cities of Western Europe. This mirrors the situation in the United States, where interests that hold the suburbs in contempt continue to declare their death, while the latest data continues to show the opposite – strong domestic migration losses in core areas and gains in the suburbs.

    There is one other key factor in the European case: the enlargement of the European Union in 2004, which increased the national membership from 15 to 25 (and subsequently to 27) and allowed for the mass migration of people from the east to the wealthier west. Whether the international financial crisis may reverse this trend, with many Eastern European residents moving back to their native countries, remains an open question.


    Note on European metropolitan areas: There is no European standard for determining metropolitan areas (which are labor markets). The European Audit’s “Larger Urban Zones” (LUZ) are the closest approximation, but are not consistently defined throughout the European Union. For example, the Naples LUZ includes only the core and inner suburbs, an area far smaller than the functional metropolitan area. Many other larger urban zones include suburban and exurban areas, consistent with the concept of a metropolitan area.

    Wendell Cox is a Visiting Professor, Conservatoire National des Arts et Metiers, Paris. He was born in Los Angeles and was appointed to three terms on the Los Angeles County Transportation Commission by Mayor Tom Bradley. He is the author of “War on the Dream: How Anti-Sprawl Policy Threatens the Quality of Life.

  • PARIS: Urban Museum Amidst a Suburban Sea

    I arrived in Paris on March 1 for my annual visiting professor assignment at the Conservatoire National des Arts et Metiers. Again, I have taken a flat (apartment) in the 1st arrondissement (district) in the heart of the ville de Paris, one of the world’s great pedestrian expanses. It is also one of the great virtual experiences – a place oddly disembodied from its setting.

    The flat is just a couple of doors to the right on the first perpendicular street in the picture below, which was taken at the entrance of the Chatalet-Les Halles Metro-RER station, less than 200 yards away.

    It is 300 yards to the Pompideau Museum, a structure whose hideousness is compensated for only by the fact that because of its dense surroundings it cannot be seen from anywhere more than a block away. The Louvre and the Hotel de Ville (city hall) are each one-half mile away and Notre Dame is less than three-quarters of a mile away. This is probably the ultimate in urbanization outside of Hong Kong.

    Sundays are very relaxing in Paris. There are people on the streets. The atmosphere is informal. Crowds are out examining the art works, books, maps and posters of the vendors that line both banks of the River Seine. I always like to attend Vepres (Vespers) at Notre Dame at 5:45 on Sunday evening. This is bit ecumenical for an Anglican, although not much of an ecumenical stretch to Roman Catholicism. I understand nothing, but the singing and the organ are inspirational nonetheless.

    There are many advantages to living in central Paris. Nearly the entire ville de Paris is an outdoor museum of architecture. There is the dense, irregular urbanization of the ancient Marais, a relic of the pre-Hausmann city, as well as walks along the well planned Champs d’Elysee toward Etoile and the Arc de Triomphe on the newer 19th Century boulevards created by the master-planner.

    Everything is so close that there is no need for either car or transit. The classroom is a 15 minute walk. This small section of Paris is a model for walkability. Yet this does not, however, necessarily translate into the social connections advocates of walkability suggest. I took a survey in Montorgueil, another busy pedestrian quarter, for a few days. Out of more than 5,000 people who had stopped to talk to someone or were on cell phones, 80 percent were on the phone. This illustrates how technology has made it possible for us to interact more with those we have common interest, wherever they are, instead of being limited to those who just happen to be in geographical proximity.

    We also have to understand the ephemeral nature of the Parisian core. It is now more museum and place of “experience” than a thriving residential neighborhood. The center of the area – the 1st arrondissement (there are 20) – is a shadow of its former self in population. Today, the 1st arrondissement has 18,000 people, 80 percent below its 1861 figure of 90,000, and probably lower than the 1836 Paris core peak. The overall city has lost population as well, dropping from 2.95 million in 1921 to less than 2.2 million today, a decline on the order of some US central cities (such as Chicago).

    One reason: living in central Paris has its disadvantages. One of them is shopping. Perhaps no city has more grocery markets per capita than Paris. But they are so small that probably no city has less grocery square footage than Paris. It is quite an adventure. Not all stores carry the same products, which makes it necessary to go to more than one grocery store to fill the larder. Not surprisingly, such small stores prices have much higher prices than the supercenters – Carrefour, Auchan and other Wal-Mart lookalikes (though often larger) – that have located just outside the Boulevard Peripherique, the six to eight lane freeway that surrounds the city.

    Some of the Metro lines extend beyond the Boulevard Peripherique, allowing urban Parisians to take advantage of lower suburban supercenter prices. Suburbanites can also shop at supercenters on the second ring freeway (the A-86) and the third ring freeway (the “Franciliene”). It may not be as famous as Le Metro, but Paris possesses the best freeway system in Europe outside of the Dusseldorf-Essen (Rhine-Ruhr) area. But the stores are not permitted, by law, to be open on Sunday, which makes parking lots and adjacent streets so crowded on Saturdays that both employees and police are used to direct the traffic.

    The biggest surprise to many Americans would be the extent of the Paris suburbs. Many, especially in the urban planning community, have long deluded themselves and others into believing that Europe, unlike America, has no suburbs. The core of Paris is very small, with most of the monuments and museums that are of interest being within a less than five square mile area. The ville de Paris itself covers approximately 40 square miles. The suburbs extend outward for more than another 1,000 square miles, 25 times the area of the ville de Paris.

    So, yes Paris has suburbs, as does every big city in Europe. In fact, virtually all European urban growth in the last 40 years has occurred in the suburbs, while virtually all of the cores have either experience slow growth or lost population, much like the United States. The European suburbs continue to attract residents from the cities, and whatever gains are achieved by some core cities are the result of international migration, not domestic migration from suburbs to the cities.

    Overall more than 80 percent of Parisians live in the suburbs and exurbs. The ville de Paris has less than 2.2 million people, while the rest of the urban area has nearly 8 million people, according to the French national statistical agency (INSEE). Another 2 million people are included in the rural and exurban portions of the metropolitan area (the “aire urbaine”) which are the French equivalent of exurbs.

    There is also a perception – oft reported in the New York Times and other urban-centric media – that the suburbs of Paris are made up of poor people. Certainly, like many American cities, Paris has poor suburbs, particularly in the department of Seine-St. Denis, to the north of the city. This area has high rise public housing blocks that look every bit as decrepit as the mercifully demolished Robert Taylor Homes on the south side of Chicago. But most Paris suburbs are predominately middle class housing, just like in America. There are also some very wealthy areas, as we find in the periphery of our own metropolitan regions.

    For two months, the ville de Paris is an absolutely delightful place to live. But once my Parisian sojourn is over, I, for one, will be very happy to return home to the suburbs of St. Louis which may be duller, less colorful and historic than Paris, but far more comfortable and affordable for the experience of everyday living.

    For additional information, see the Paris Rental Car Tour at http://www.rentalcartours.net/rac-paris.pdf.

    Wendell Cox is a Visiting Professor, Conservatoire National des Arts et Metiers, Paris. He was born in Los Angeles and was appointed to three terms on the Los Angeles County Transportation Commission by Mayor Tom Bradley. He is the author of “War on the Dream: How Anti-Sprawl Policy Threatens the Quality of Life.