Tag: Philadelphia

  • Megalopolis and its Rivals

    Jean Gottman in 1961 coined the term megalopolis (Megalopolis, the Urbanized Northeastern Seaboard of the Unites States) to describe the massive concentration of population extending from the core of New York north beyond Boston and south encompassing Washington DC. It has been widely studied and mapped, including by me. (Morrill, 2006, Classic Map Revisited, Professional Geographer).  The concept has also been extended to describe and compare many other large conurbations around the world.

    Maybe it’s time to see how the original has fared?   And what has happened to other metropolitan complexes in the US, most notably Los Angeles, San Francisco, Chicago and should we say Florida?


    Table 1 summarizes the population of Megalopolis from 1950 to 2010 and Table 2 compares Megalopolis with other US mega-urban complexes.  Megalopolis grew fastest in the 1950s and 1960s, with growth rates of 20 and 18.5 percent. The  northeast has since been outpaced by the growth in other regions, but growth was still substantial in the last decade. Megalopolis added almost 3 million people, by 6.8 %, to reach an amazing 45.2 million.

    Table 1: Growth of Megalopolis 1950-2010
    Year Population Change % Change
    2010 45,357 2,983 7
    2000 42,374 5,794 15.8
    1990 36,580 2,215 6.4
    1980 34,365 360 1.2
    1970 34,005 5,436 18.5
    1960 29,441 4,910 20
    1950 24,534

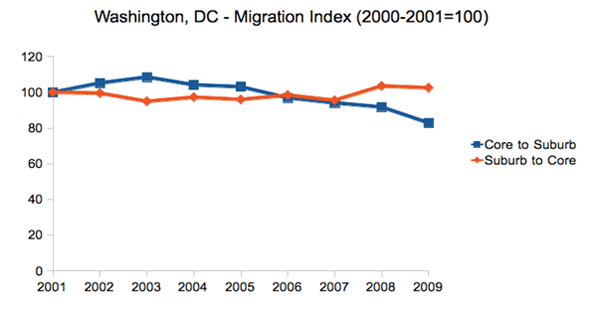
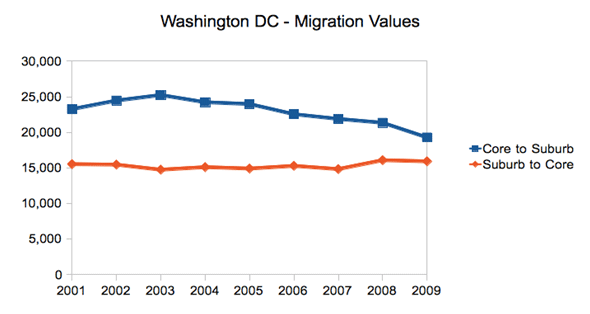
    From Table 2 I note four major subregions of Megalopolis: Boston, New York, Philadelphia and Washington, DC. New York is still the biggest player, but the locus of growth over time has shifted South. This reflects the increasing world importance of Washington, DC. New York’s almost 20 million may not surprise, but the fact that greater Boston has grown to almost 9.5 million may be more surprising.  The Washington-Baltimore area grew by far the fastest at almost 15 percent (not much sign of shrinkage of government!). In contrast New York, Boston and Philadelphia’s growth was relatively paltry.

    Table 2: Megalopolis and Its Rivals
    Place
    2010 Pop
    2000 Pop
    Change
    % change
    Megalopolis
      New York 19,923 19,209 717 3.7
      Boston   9,445 8,967 478 5.3
      Philadelphia 8,415 76,781 773 9.5
      Baltimore-Washingt 7,403 7,681 960 14.9
    All 45,181 42,302 2,888 6.8
    Chicago 10,817 10,305 512 5
    Los Angeles 12,151 11,789 362 3.1
      Central 903 857 46 5.4
      North 928 634 294 46
      East 2,884 2,105 475 37
      South 3,543 3,210 337 10.4
    All Los Angeles 20,404 18,599 1,810 9.8
    San Francisco-Sacramento
      San Francisco 7,330 6,946 384 5.5
      Sacramento 3,171 2,604 572 22
    All San Francisco-Sacramento 10,501 9,550 951 10
    Florida
      Miami 6,027 5,311 716 13.5
      Tampa 4,818 3,894 974 25.3
      Orlando 2,915 2,193 722 33
      Jacksonville 1,483 1,191 2,242 24.5
    All Florida 15,243 12,544 2,699 21.5

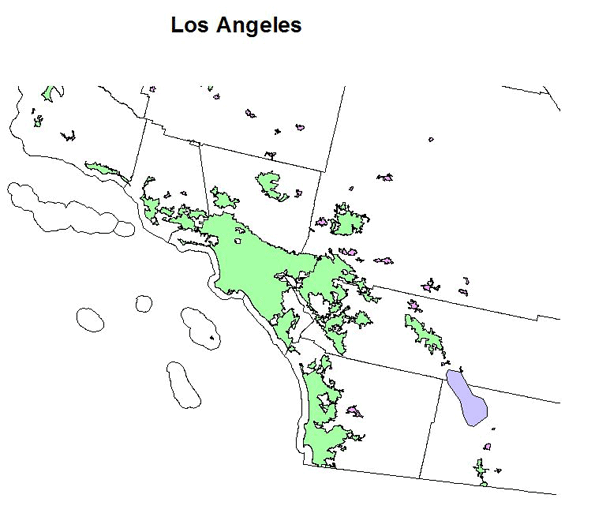
    Greater Los Angeles is the second largest conurbation, with some 20.4 million, growing by 1.8 million, and 10 percent from 2000. In the table I distinguish between the core Los Angeles urbanized area and the satellite urbanized areas west, north, south and east. The core LA area grew by only 3 percent, while the spillover areas to the north and east had astonishing growth, at 46 and 37 percent over the decade.  These include several places with a fairly long history, such as Riverside and San Bernardino, San Diego and Santa Barbara, but many are rapidly growing large suburbs and exurbs, a spillover of growth from the Los Angeles core. Much of the fastest growth has been in  Mission Viejo, Murietta-Temecula, Indio, Lancaster, Santa Clarita and Thousand Oaks.

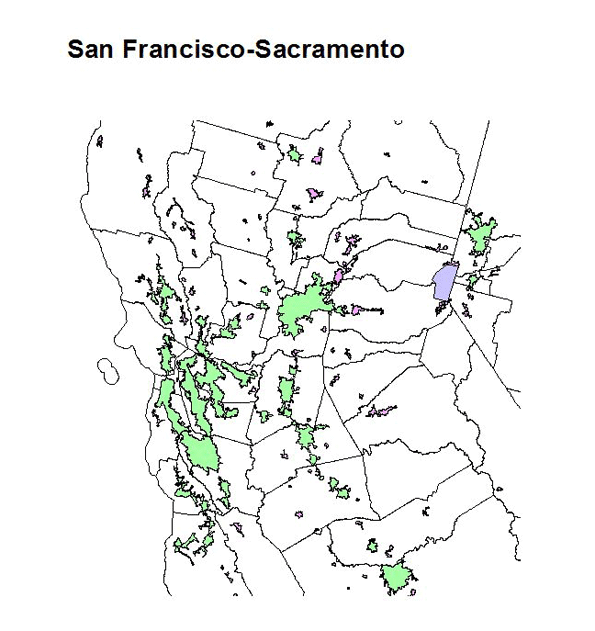
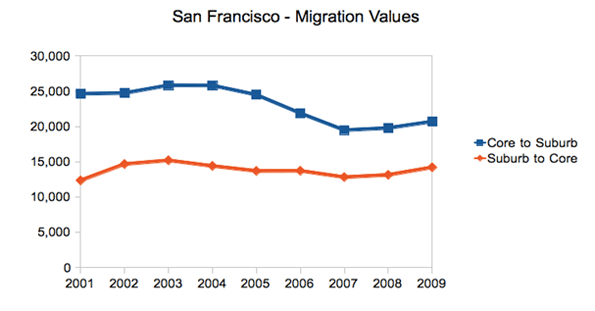
    For greater San Francisco, I distinguish two subregions, the Bay area of San Francisco-San Jose (west) and Sacramento (central valley).  Some might consider these totally distinct, but they have become one in a conurbation sense, as evidenced by commuting patterns. Many people live in the less costly Central Valley area but commute to the expensive Bay Area cities. Together, the conurbation is now 10.5 million, up 10 percent from 2000. The central valley (Sacramento) portion grew far more rapidly than San Francisco-San Jose (22 percent compared to 5.5 percent).  

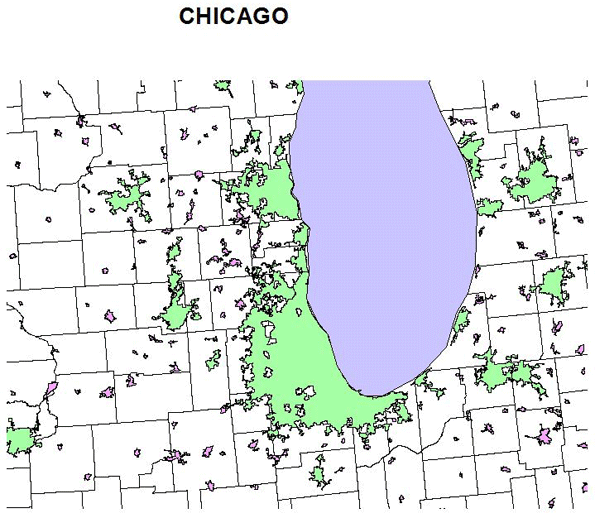
    Compared to its rivals the Chicago conurbation has grown less rapidly but is still large, with a population of 10.8 million in 2010 , growing 512,000 (5 percent) since 2000.  Chicago and Milwaukee are the well-known core cities, but there are also less well known components with far faster growth such as Round Lake-McHenry and West Bend, WI.   
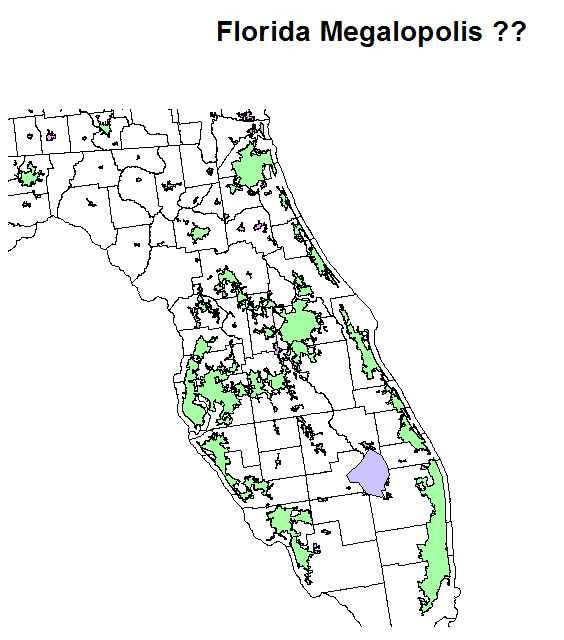
    Florida

    The more interesting and difficult conurbation to try to define is what might be called the Florida archipelago. Greater Miami has long been recognized as a conurbation, but I contend that virtually all the urbanized areas of the state are in effect a complex web of urban settlement, with little clear demarcation. This is in part a reflection of   rapid and expansive  growth.  Nevertheless it makes sense to recognize four sub-regions, centered on Miami, Tampa-St. Petersburg, Orlando and Jacksonville. 

    Together these areas have reached an astonishing 15.2 million, up 2.7 million or 21.5 percent in one decade.  Because settlement is spread across the state in such a web-like fashion with no single dominant center, they constitute a newish form of urban concentration. Besides the well-known centers such as   Miami, Tampa-St. Petersburg ), Orlando and Jacksonville,  there are many satellite cities, often quite large. These include North Port, Cape Coral  encompassing older Ft. Meyers, Bonita Springs, Kissimmee, Palm Bay-Melbourne, Palm Coast-Daytona, and Port St. Lucie.  An interesting but hard to answer question is how much of Florida’s phenomenal growth is a result of transfer of people and accumulated wealth from the North (and especially from the original Megalopolis).

    The United States is a large and diverse country, with many other giant cities and a vast countryside. But it is important to realize the importance of these megalopolitan areas, with an aggregate population of 102.6 million, one third of the nation’s population.

    What’s next? Look for the rise of now just somewhat smaller conurbations such as Houston, Dallas, Atlanta, Minneapolis, Seattle, Phoenix, and Denver. In terms of numbers and rates of growth Texas is a front runner, but its stars do not coalesce into a megalopolis, at least not yet. The belt of urban growth from Atlanta, through Greenville, SC, Charlotte to Raleigh-Durham is also a likely future conurbation candidate.

    Richard Morrill is Professor Emeritus of Geography and Environmental Studies, University of Washington. His research interests include: political geography (voting behavior, redistricting, local governance), population/demography/settlement/migration, urban geography and planning, urban transportation (i.e., old fashioned generalist).

  • Back to the City?

    The 2010 Census results were mostly bleak for cities, especially for those who believed the inflated hype about the resurgence of the city at the expense of the suburbs.  Despite claims of an urban renaissance, the 2000s actually turned out to be worse than the 1990s for central cities.  The one bright spot was downtowns, which showed strong gains, albeit from a low base.  The resurgence of the city story seemed largely fueled by intra-census estimates by the government that proved to be wildly inflated when the actual 2010 count was performed.

    But beyond the headline numbers, there is intriguing evidence of a shift in intra-regional population dynamics in the migration numbers. The Internal Revenue Service uses tax return data to track movements of people around the country on a county-to-county and state-to-state basis. These can be used to look at movements of people within a metro area.

    Because this data is at the county level, it does not map directly to what we might think of as the “urban core” as most counties that are home to central cities contain large suburban areas as well. There are also areas inside many central cities themselves that are suburban in their built form.

    However, there are a limited number of cities that have combined city-county definitions that approximate the urban core. Looking at a few of these – New York, Philadelphia, San Francisco, and Washington, DC – we see that over the 2000s out-migration from the core to the suburban counties was relatively flat or even declined late in the decade as general mobility declined in the Great Recession. In contrast, migration from the suburban counties to the core stayed flat or actually increased, even late in the decade when again overall migration declined nationally.

    It should be stressed that the overall trend is still that of net out-migration from the core to the suburbs. But in searching for any potential inflection point, changes in the dynamics are clearly of interest.

    New York City

    First let us look at New York City. The city proper consists of five boroughs, each of which is a separate county. Treating the city as a whole as the core reveals these migration trends during the 2000s:


    Note: Core defined as the five boroughs of New York City

    This chart renders migration as an index, to show changes in in- and out-migration on the same scale. This should not be confused with the total number of people moving, which still shows overall net out-migration, though the trend lines show the same dynamic as above:


    Note: Core defined as the five boroughs of New York City

    Philadelphia

    Perhaps the most dramatic shift in these four cities was in Philadelphia, where the central city actually gained population for the first time since 1950.

    Here are the raw migration numbers, which again show net out-migration, but a distinct shift over the decade.

    San Francisco

    The Bay Area has been divided into two metro areas by the government, San Francisco and San Jose. Therefore, an intra-regional migration analysis looking at San Francisco alone will miss certain migration within the broader Bay Area. With that caveat in mind, we see again the same trend, albeit somewhat less pronounced:

    And here are the total migrants:

    Washington, DC

    Due to its very nature as a government town, Washington’s migration patterns differ from the many other cities. However, it has still experienced the same suburbanization phenomenon as the rest of America, and the same changes in intra-regional migration dynamics as the other cities highlighted here, though we see the shift beginning only in mid-decade:

    And the raw values:

    Conclusion

    Given the overblown triumphalist rhetoric about the urban core that ultimately hasn’t been backed up by the data, we should be cautious about reading too much into this. Again, net migration remains outward towards the suburbs and away from denser cities to smaller, generally less dense ones (from Chicago to Indianapolis or New York to Raleigh). Overall city population figures were disappointing. And the housing crash and the Great Recession have clearly wreaked havoc with migration patterns on a national level.

    Still, these are clearly figures that should inspire some at least small-scale optimism in urban advocates.  There has clearly been a shift affecting the net migration in these cities. And the same pattern is visible, though less easily attributable to just the urban core, in a large number of other metros around the country.  In particular, the fact the in-migration from the suburbs to the core held steady or even increased is a sign of some urban health.

    Back to the city as a mass movement?  Not yet.  But it’s certainly an improvement. These intra-regional migration statistics are key figures to keep an eye on as we look for any sign of a true inflection point in the overall population trends for America’s urban centers. The whole pattern could also shift again — in one direction or the other — as the economy, albeit slowly, comes back to life and people once again get back into the housing market.

    Aaron M. Renn is an independent writer on urban affairs based in the Midwest. His writings appear at The Urbanophile, where this piece originally appeared. Telestrian was used to analyze data and to create charts for this piece.

    Chicago photo by Storm Crypt / Flickr

  • More Americans Move to Detached Houses

    In defiance of the conventional wisdom in the national media and among most planning professionals, Americans continue not only to prefer, but to move into single family detached houses. Data from the 2010 American Community Survey indicates that such housing attracted 79.2% of the new households in the 51 major metropolitan areas (over 1,000,000 population) over the past decade.

    In contrast households in multi-unit buildings (apartments and condominiums) represented 11.8% of the new housing, while two-unit attached housing represented 11.3% of the increase. There was a 2.3% decline in the "other" category of new housing, which includes mobile homes and boats. A total of 4 million net new occupied detached houses were added in the largest metropolitan areas, while there were 590,000 additional apartments and condominiums and 570,000 attached houses (Figure 1).

    Detached Vacancy Rate Rises Less than Multi-Unit: Another conventional assumption is that single family homes have been disproportionately abandoned by their occupants, particularly since the collapse of the housing bubble. This is also not true. In 2010 detached housing enjoyed a 92.4% occupancy rate in 2010 which is higher than the 89.4% occupancy rate in attached housing and 84.2% occupancy rate in multi-unit buildings. Because a more of the multi-unit housing is rental, it is to be expected that the vacancies would be the highest in this category. However, at the national level, overall vacancy rates rose the most in multi-unit housing, with an increase of 61%, from 10.7% in 2000 to 17.1% in 2010. The vacancy rate in detached housing rose at a slower rate, from 7.3% in 2000 to 10.7% in 2010, an increase of 48%. Attached housing – such as townshouses – have the slowest rise in vacancy rate, from 8.4% in 2000 to 11.0% in 2010, an increase of 32% (Figure 2).

    Detached and Attached Up in Most Markets, Apartments and Condominiums Down in Most: The move to detached housing was pervasive at the major metropolitan area level. Among the 51 largest metropolitan areas, the share of detached housing rose in 44 and declined in seven. The share of attached housing rose in 32 of the metropolitan areas, while declining in 19. Multi-unit housing experienced an increase in its market share in only three markets, while declining in 48.

    Largest Metropolitan Areas: Detached housing also increased more than attached housing and multi-unit housing in each of the nation’s five largest metropolitan areas.

    • In the largest metropolitan area, New York, 51.9% of the new housing was detached. This is considerably more than the 36.9% detached market share in 2000. Multi-unit housing accounted for 24.1% of the increase in the market. This is a far smaller share than the 55.7% that multi-unit housing represented in 2000. Attached housing was 19.9% of the increase, nearly 3 times its 2000 share of 6.7%. This movement of New Yorkers to less dense housing forms is particularly significant, in view of the fact that New York has historically had the lowest share of lower density housing (detached and attached) and the highest share of multi-unit houses.
    • In the second largest metropolitan area, Los Angeles, 96.0% of the new housing was detached. This is nearly double the 49.7% that detached housing represented of the market in 2000. The balance of the new housing was split between a share of 18.6% for multi-unit housing and a loss of 11.8% in the attached housing. The share of new units represented by multi-unit houses was less one-half than its percentage of the market in 2000 (39.0%).
    • In the third largest metropolitan area, Chicago, 95.9% of the new housing was detached, well above the 52.5% share in 2000. There was a huge loss in apartment and condominium share, at 31% of the market, while attached housing captured 40.4% of the market.
    • In the fourth largest metropolitan area, Dallas Fort Worth, 84.3% of the new housing was detached, well above the 62.0% share in 2000. Multi-unit housing accounted for 13.5% of the increase, approximately one-half the 2000 market share. Attached housing represented 3.2% of the increase.
    • In the fifth largest metropolitan area, Philadelphia, 77.6% of new housing was detached, well above the 45.3% market share for detached housing in 2000. Apartments and condominiums accounted for 27.7% of the increase between 2000 and 2010, slightly more than the 2000 market share 23.7%. Attached housing represented a minus 4.3% of the new housing.

    Despite being only the fourth largest metropolitan area, Dallas-Fort Worth accounted for 46% of the new housing in the five largest metropolitan areas (Figure 3).

    The three largest metropolitan markets where there was an increase in multi-unit housing share were San Jose, New Orleans and Denver. In San Jose, 55.5% of new housing was multi-unit, while only 10.3 percent was detached. New Orleans had a similar 10.5% detached new housing share, while 65.8% of the new housing was multi unit. In Denver, 31.3% of the new housing was multi-unit, while 60.2% was detached.

    The share of detached housing also declined between 2000 and 2010 in Boston, Kansas City, Minneapolis-St. Paul and Portland. In each of these metropolitan areas, the share of attached housing increased, while the share of multi-unit housing decreased. Nonetheless, detached housing continued to attract a majority of new housing in Kansas City (70.8 percent) and Portland (56.6 percent). Despite Portland’s strong planning emphasis on high density housing, its share of multi-unit housing, and 26.8% between 2000 and 2010 was less than its 2000 market share of 27.5%, with a strong 20.6 percent share in attached housing. Attached housing also accounted for a comparatively large share of new housing in Boston (45.7 percent), Minneapolis-St. Paul (39.7 percent) and Kansas City (25.8 percent). The stronger densification policies that existed in Minneapolis-St. Paul until the middle of the decade may have artificially raised the share of attached new housing.

    Share by housing type data is provided for the major metropolitan areas in Tables 1 and 2.

    Table 1
    Occupied Housing by Major Metropolitan Area: 2000
    Metropolitan Area Detached Attached Multi-Unit Other
    Atlanta, GA 66.6% 3.5% 25.5% 4.4%
    Austin, TX 57.7% 3.7% 32.1% 6.6%
    Baltimore, MD 46.0% 28.5% 24.2% 1.3%
    Birmingham, AL 68.3% 2.6% 17.9% 11.2%
    Boston, MA-NH 48.9% 4.4% 45.4% 1.3%
    Buffalo, NY 60.0% 2.8% 35.1% 2.1%
    Charlotte, NC-SC 67.5% 3.4% 21.8% 7.3%
    Chicago, IL-IN-WI 52.5% 6.3% 40.1% 1.1%
    Cincinnati, OH-KY-IN 64.7% 3.6% 27.8% 3.9%
    Cleveland, OH 65.7% 5.5% 27.7% 1.2%
    Columbus, OH 62.8% 5.5% 29.1% 2.6%
    Dallas-Fort Worth, TX 62.0% 3.1% 30.3% 4.6%
    Denver, CO 60.9% 7.8% 29.0% 2.3%
    Detroit,  MI 70.5% 5.5% 20.7% 3.3%
    Hartford, CT 60.0% 5.2% 34.1% 0.8%
    Houston, TX 61.4% 3.6% 29.1% 6.0%
    Indianapolis. IN 68.4% 5.2% 23.2% 3.3%
    Jacksonville, FL 63.5% 3.9% 22.3% 10.3%
    Kansas City, MO-KS 71.3% 4.6% 21.4% 2.6%
    Las Vegas, NV 53.4% 6.0% 34.7% 5.9%
    Los Angeles, CA 49.7% 8.6% 39.6% 2.0%
    Louisville, KY-IN 70.7% 2.1% 22.2% 5.0%
    Memphis, TN-MS-AR 69.1% 3.8% 22.8% 4.2%
    Miami, FL 45.4% 9.9% 42.1% 2.6%
    Milwaukee,WI 55.7% 5.3% 38.3% 0.7%
    Minneapolis-St. Paul, MN-WI 62.8% 7.7% 27.4% 2.0%
    Nashville, TN 64.9% 4.4% 24.4% 6.2%
    New Orleans. LA 59.9% 7.7% 28.5% 3.9%
    New York, NY-NJ-PA 36.9% 6.5% 56.3% 0.4%
    Oklahoma City, OK 71.6% 3.1% 19.2% 6.0%
    Orlando, FL 61.5% 4.5% 25.1% 8.9%
    Philadelphia, PA-NJ-DE-MD 45.3% 29.8% 23.5% 1.4%
    Phoenix, AZ 61.6% 6.1% 24.9% 7.4%
    Pittsburgh, PA 68.8% 6.5% 20.4% 4.4%
    Portland, OR-WA 63.8% 3.3% 27.5% 5.5%
    Providence, RI-MA 54.3% 2.9% 41.6% 1.2%
    Raleigh, NC 63.6% 5.2% 21.5% 9.8%
    Richmond, VA 71.3% 4.9% 20.4% 3.4%
    Riverside-San Bernardino, CA 67.0% 5.1% 18.6% 9.3%
    Rochester, NY 65.7% 4.3% 26.5% 3.5%
    Sacramento, CA 66.1% 6.0% 24.0% 3.9%
    Salt Lake City, UT 67.0% 4.8% 25.4% 2.8%
    San Antonio, TX 67.4% 2.9% 22.2% 7.5%
    San Diego, CA 51.7% 9.4% 34.5% 4.4%
    San Francisco-Oakland, CA 50.3% 9.3% 39.1% 1.3%
    San Jose, CA 57.0% 9.1% 30.5% 3.4%
    Seattle, WA 60.2% 3.5% 31.6% 4.8%
    St. Louis,, MO-IL 70.2% 3.1% 21.9% 4.8%
    Tampa-St. Petersburg, FL 58.4% 4.6% 25.7% 11.4%
    Virginia Beach-Norfolk, VA-NC 61.4% 10.4% 25.2% 3.0%
    Washington, DC-VA-MD-WV 47.6% 19.4% 32.1% 0.8%
    Average (Weighted) 55.9% 7.5% 33.3% 3.3%
    Data from 2000 Census
    Metropolitan areas over 1,000,000 population as defined in 2010


    Table 2
    Occupied Housing by Major Metropolitan Area: 2010
    Metropolitan Area Detached Attached Multi-Unit Other
    Atlanta, GA 69.2% 5.3% 22.7% 2.7%
    Austin, TX 60.4% 2.6% 31.8% 5.1%
    Baltimore, MD 47.4% 27.3% 24.2% 1.1%
    Birmingham, AL 70.8% 2.4% 16.8% 10.0%
    Boston, MA-NH 48.7% 5.9% 44.2% 1.2%
    Buffalo, NY 62.3% 2.9% 33.0% 1.8%
    Charlotte, NC-SC 68.9% 5.1% 20.4% 5.6%
    Chicago, IL-IN-WI 54.2% 7.6% 37.1% 1.1%
    Cincinnati, OH-KY-IN 68.9% 4.8% 23.2% 3.1%
    Cleveland, OH 68.7% 5.1% 25.1% 1.1%
    Columbus, OH 64.1% 7.3% 26.6% 2.1%
    Dallas-Fort Worth, TX 65.9% 3.1% 27.4% 3.6%
    Denver, CO 60.8% 7.9% 29.4% 1.9%
    Detroit,  MI 71.6% 6.3% 19.1% 2.9%
    Hartford, CT 60.9% 5.3% 33.1% 0.7%
    Houston, TX 65.1% 3.5% 26.0% 5.3%
    Indianapolis. IN 71.3% 5.0% 21.1% 2.6%
    Jacksonville, FL 66.3% 4.8% 21.3% 7.6%
    Kansas City, MO-KS 71.3% 6.4% 20.1% 2.2%
    Las Vegas, NV 60.9% 5.4% 29.9% 3.8%
    Los Angeles, CA 51.0% 8.0% 39.0% 1.9%
    Louisville, KY-IN 71.6% 3.6% 20.9% 4.0%
    Memphis, TN-MS-AR 72.5% 3.3% 20.4% 3.7%
    Miami, FL 47.0% 10.8% 40.0% 2.1%
    Milwaukee,WI 56.2% 6.5% 36.5% 0.8%
    Minneapolis-St. Paul, MN-WI 61.5% 11.0% 25.9% 1.6%
    Nashville, TN 67.2% 5.6% 22.3% 4.9%
    New Orleans. LA 65.1% 6.1% 24.6% 4.2%
    New York, NY-NJ-PA 37.2% 6.7% 55.7% 0.4%
    Oklahoma City, OK 74.3% 3.0% 17.1% 5.6%
    Orlando, FL 64.1% 5.5% 23.4% 6.9%
    Philadelphia, PA-NJ-DE-MD 46.6% 28.5% 23.7% 1.3%
    Phoenix, AZ 67.2% 4.8% 22.2% 5.8%
    Pittsburgh, PA 69.4% 7.5% 19.1% 4.0%
    Portland, OR-WA 62.8% 5.5% 27.4% 4.3%
    Providence, RI-MA 55.7% 3.7% 39.6% 1.0%
    Raleigh, NC 65.4% 8.0% 20.5% 6.2%
    Richmond, VA 73.2% 4.9% 19.0% 3.0%
    Riverside-San Bernardino, CA 70.7% 4.3% 17.1% 7.9%
    Rochester, NY 66.9% 4.8% 25.3% 2.9%
    Sacramento, CA 68.8% 5.6% 22.6% 3.0%
    Salt Lake City, UT 67.8% 6.1% 23.9% 2.2%
    San Antonio, TX 70.8% 2.2% 21.1% 5.9%
    San Diego, CA 53.0% 9.0% 34.5% 3.5%
    San Francisco-Oakland, CA 50.7% 9.4% 38.8% 1.1%
    San Jose, CA 54.3% 10.7% 32.0% 3.0%
    Seattle, WA 60.5% 4.2% 31.5% 3.8%
    St. Louis,, MO-IL 70.8% 4.2% 21.1% 3.9%
    Tampa-St. Petersburg, FL 59.6% 5.6% 24.7% 10.1%
    Virginia Beach-Norfolk, VA-NC 62.5% 11.1% 24.0% 2.5%
    Washington, DC-VA-MD-WV 48.1% 19.6% 31.7% 0.7%
    Average (Weighted) 57.8% 7.9% 31.5% 2.8%
    Data from 2010 American Community Survey
    Metropolitan areas over 1,000,000 population as defined in 2010


    In Housing, Preference Trumps Policy: The trend of the last decade is evidence of a continued preference of American households for detached housing. The results are remarkable for at least two reasons:

    • The first is that there have been unprecedented policy initiatives to discourage, if not to prohibit the building of new detached houses. It seems likely that the miniscule new detached housing share in San Jose, for example, is a direct result of that metropolitan area’s virtual prohibition of new detached housing, rather than any evidence that households have begun to prefer higher density housing. A small detached housing share in the face of a strong public policy bias toward higher density housing says nothing about preferences.
    • Second; the media and wishful advocates of denser settlement patterns have continuously referred to detached housing as having been severely overbuilt during the housing bubble, while suggesting an imperative for households to move into multiunit, often rented housing. The new data, with the larger increase in multi-unit vacancy rates, indicates that there was at least as much overbuilding in more dense housing types as there was in detached housing.

    Despite the expressed preferences of planners, academics and even many builders, American households continue to make their own decisions about housing.

    Wendell Cox is a Visiting Professor, Conservatoire National des Arts et Metiers, Paris and the author of “War on the Dream: How Anti-Sprawl Policy Threatens the Quality of Life

    Lead photo: Houses in Los Angeles. Photograph by author.

  • The Shifting Geography of Black America

    Black population changes in various cities have been one of the few pieces of the latest Census to receive significant media coverage.  The New York Times, for example, noted that many blacks have returned to the South nationally and particularly from New York City.  The overall narrative has been one of a “reverse Great Migration.”  But while many northern cities did see anemic growth or even losses in black population, and many southern cities saw their black population surge, the real story actually extends well beyond the notion of a monolithic return to the South.

    The map below, showing total growth in Black Only population from 2000 to 2010, indeed shows that northern and west coast cities had low or even negative growth while various southern cities boomed.


    Here is a list of the top ten metro areas (among those with more than a million total people) for black population growth:


    And here are the bottom ten (among those with more than one million people):


    Of course, looking at total population numbers can mislead. Some cities grew slowly or lost people as a whole while others boomed. With Houston, Dallas, and Atlanta all adding over a million people each, it’s no surprise these regions added lots of blacks. Working and middle class African-Americans likely shared many of the same motivations to move to these cities – such as lower housing prices – as Americans of other ethnicities. In that light, a look at change in black population share (the percentage of the population that is black) provides additional perspective:


    Here we see not a single-minded return to the South, but a complex mixture of shrinking and growing regions in various parts of the country.  This includes some surprising places, like Minneapolis-St. Paul, which was one of the top ten metros in the country for total black population growth, and also saw its black population share grow strongly.  Now the Twin Cities, along with Columbus, Ohio, another strong performer, are two of the top destination for African immigrants from Somalia and elsewhere, which doubtless accounts for part of that strong growth. But anecdotal reports indicate that they are also benefitting from Chicago’s expanding black diaspora, along with places like Indianapolis and various Downstate metros.

    Atlanta, well known as America’s premier metro area for blacks, continued to dominate the charts. Not only far and away the leader in adding raw numbers of blacks, the African-American share also grew share strongly too. Charlotte is also clearly emerging as another key black population hub, ranking #6 in America for total black population growth, which is impressive for a smaller city, and adding nearly two percentage points in black population share.  It grew its black population much faster than other fast growing small cities like Raleigh or Nashville, and added share at more than three times as fast.

    By contrast, Houston, which grew total black population significantly, had a much lower share gain. Austin, one of America’s fastest growing metros, added only 28,000 blacks and actually lost black population share. And Washington, DC, despite being a traditional black population and cultural hub, also lost black population share regionally as gentrification in the District resulted in its loss of its black majority for the first time in decades, according to the Brookings Institution. 

    So even among rapidly growing metro areas in the South, the appeal to black population is selective, favoring places like Atlanta, Charlotte, Florida cities, and even slower growing cities along the length of the Mississippi River like Memphis.  Even some cities in the North are retaining their allure to blacks as well. Less favored or even out of favor are metros like DC, Dallas, and Houston as well as cities such as Charleston and Savannah along the southeast coast.

    Slow or negative black population growth is particularly concentrated in traditional tier one “global cities”, as well as those facing economic or other hardship like Detroit, Cleveland, and immediate post-Katrina New Orleans.

    The latter may be understandable – whites have been leaving these regions as well – but the former is quite troubling.  The global city model, focused on high end and creative services, is supposedly the bright and shining savior of American urbanism. Indeed, it’s hard to find a city that doesn’t have some aspect of that as a core plank in its civic strategy. Yet the cities that have been most focused at promoting this notion – such as New York, San Francisco, and Chicago – are generally those  disproportionately driving blacks away. The reasons for this aren’t clear, but the high and increasing cost of living in those places seems like one logical explanation.

    Here’s a more detailed look at the percentage growth in Black Only population in some tier one global type metros:


    New York barely broke even on black population, while Chicago, LA, and the Bay Area all actually lost black residents, a stunning reversal from their past as black magnets. However, Boston, not a traditional black population hub, grew its black population strongly on a percentage basis, as did Miami and DC, though as noted before, the share change in DC was negative.  Here is that metric for the same metros:


    With the notable exceptions of Boston and Miami – and Philadelphia, seldom ranked highly as a global city but still a traditional large northern metropolis – most global city regions appear to be increasingly inhospitable to Blacks.  Thus their model of success, whatever its appeal to some, at a basic level simply lacks inclusiveness. This shows its clear limits as an overall model for America’s urban centers as a whole.

    Aaron M. Renn is an independent writer on urban affairs based in the Midwest. His writings appear at The Urbanophile. Data analysis, maps, and charts in this piece were prepared with Telestrian.

  • City of Philadelphia Gains, Dispersion Continues

    For the first time since the 1950 census, the city of Philadelphia has registered a gain in population. In 2010, the city had 1,526,000 residents, up 8,000 from the 1,518,000 in 2000. The city had reached its population peak of 2,071,000 in 1950 and even with the increase since 2000 remains below its population as recorded in the 1910 census. The city (the historical core municipality) accounted for three percent of the metropolitan area growth.

    Overall, the Philadelphia (Pennsylvania, New Jersey, Delaware and Maryland) metropolitan area grew 4.9 percent, from 5,687,000 t o 5,946,000 residents. While this is modest growth relative to the national rate of 10 percent, the Philadelphia metropolitan area grew faster than the Los Angeles metropolitan area (3.7 percent), which had outgrown Philadelphia in every census period during the 20th century.

    The suburbs added 6.5 percent to their population and captured 97 percent of the population growth. Outer suburban Cecil County, Maryland grew the fastest, at 18 percent, while outer suburban Chester County added the most new residents (65,000) and grew 15 percent. Gloucester County, New Jersey also grew quickly, at 13 percent.

  • New Jersey: Still Suburbanizing

    The state of New Jersey virtually defines suburbanization in the United States.  New Jersey is not home to the core of any major metropolitan area but, major portions of the nation’s largest metropolitan area (New York) and the fifth largest metropolitan area (Philadelphia) are in the state (See map). These two metropolitan areas comprise 17 of the state’s 21 counties. Another county (Warren) is in the Allentown, Pennsylvania metropolitan area, while Atlantic (Atlantic City), Cumberland and Cape May are single-county metropolitan areas. No one, however, should make the mistake of imagining that New Jersey is wall to wall suburbanization. In the 2000 census, more than 60 percent of the state’s land area was rural, with urban areas (areas of continuous urban development) making up less than 40 percent of the state’s land area, while 94 percent of the 2000 population was urban (which includes suburban).

    Map courtesy of Passaic Public Library

    The recently released 2010 census data indicates that the dispersion of New Jersey population, which was underway by 1900 and continued apace in the last decade.

    New Jersey’s Larger Municipalities: This is not to suggest that it was a bad decade for the larger municipalities in the state. However, the 20th century was not kind to New Jersey’s largest municipalities. At some point during the century, six municipalities reached a population of 100,000 or more. Four of these municipalities were near the city of New York and were eventually engulfed by its suburbanization (Newark, Jersey City, Paterson and Elizabeth). Another, Camden, was engulfed by Philadelphia’s expansion and the last, the state capital Trenton, is midway between the cores of the two metropolitan areas and has more recently become a part of the New York metropolitan area.

    The new decade started out better for these municipalities. Newark, Jersey City, Elizabeth and Camden gained population between 2000 and 2010. However, even after the population gains, Newark’s population remains 165,000 (37 percent) below its 1930 peak. Jersey City remains 70,000 (22 percent) below its 1930 peak, despite the growth of a new financial district just across the Hudson River from lower Manhattan. Camden remains approximately 35,000 (37 percent) below its 1950 peak. Of the four municipalities gaining population, Camden did the best, adding 6.9 percent to its population, a full 50 percent above the statewide increase of 4.5 percent.

    Paterson and Trenton posted small population losses. Trenton remains nearly 45,000 (33 percent) below its 1950 peak (Table 1).

    Table 1
    New Jersey Municipalities Achieving 100,000 Population
    Census Population Peak
    Municipality 2000 2010 Change % Change Population Year
    Newark      273,946    277,140       3,194 1.2%     442,337 1930
    Jersey City      240,055    247,597       7,542 3.1%     316,715 1930
    Paterson      149,222    146,199      (3,023) -2.0%     149,227 2000
    Elizabeth      120,568    124,969       4,401 3.7%     124,969 2010
    Trenton        85,403      84,913         (490) -0.6%     128,009 1950
    Camden        78,672      84,136       5,464 6.9%     124,555 1950
    Total      947,866    964,954     17,088 1.8%   1,285,812
    Balance of State   7,466,484  7,826,940    360,456 4.8%
    New Jersey   8,414,350  8,791,894    377,544 4.5%   8,791,894 2010


    Elizabeth and Paterson however have been far more successful in retaining their population than other older municipalities, both in New Jersey and around the nation. Both Elizabeth and Paterson have become majority Hispanic and have a sizeable African American community. They also have a large immigrant community.  In Elizabeth, 45 percent of the population is foreign born, almost four times the national rate. Paterson has an immigrant population of 25 percent.  

    The Older Suburban Counties: Nonetheless, even with the modest population reversals in four of the five municipalities in the Philadelphia and New York metropolitan areas, their corresponding older suburban counties grew slower than the rest of the state in the 2000s. Combined, Camden, Essex, Hudson, Passaic and Union counties – fast growing suburbs of the early 1900s – grew at a rate of 1.6 percent, compared to the statewide growth rate of 4.5 percent, capturing 12 percent of the statewide growth.  (Table 2).

    Table 2
    New Jersey County Population Growth by Area
    Area 2000 2010 Change % Change Share of Growth
    5 Older Suburban Counties  2,923,130  2,969,617    46,487 1.6% 12.3%
    Balance of NY & Phila Metropolitan Counties  4,887,467  5,184,873  297,406 6.1% 78.8%
    Outside NY & Phila Metropolitan Area     603,753     637,404    33,651 5.6% 8.9%
    Total  8,414,350  8,791,894  377,544 4.5% 100.0%
    Note: 5 Older Suburban Counties Include Camden, Essex, Hudson, Passaic and Union


    The Newer Suburban Counties: The bulk of New Jersey’s growth has taken place, as in the rest of the country, in more newly suburbanizing counties of the Philadelphia and New York metropolitan areas (Note 1). The growth rate in these counties was 6.0 percent, well above the statewide growth rate of 4.5 percent. Overall, the outer suburban counties accounted for 73 percent of the state’s population growth during the 2000s. The strongest growth was in Ocean County, which is at the furthest distance (fifty to one hundred miles) from New York City.  Ocean County grew 13 percent, adding 66,000 people to its population, nearly one-fifth of the state population gain. Gloucester County, in the Philadelphia area also grew 13 percent, adding 33,000 to its population. Ocean and Gloucester accounted for more than one-quarter of New Jersey’s population growth. Only one other county added more than 50,000 people, Middlesex, which is adjacent to the New York City borough of Staten Island in New York, much of which is made up of postwar suburbanization.

    Counties Outside the Large Metropolitan Areas: The counties outside the New York and Philadelphia metropolitan area, Atlantic, Cape May, Cumberland and Warren added 5.6 percent to their population and nine percent of the state’s population gain. The largest growth was in Atlantic County (8.7 percent) and Cumberland County (6.1 percent), both adjacent to counties of the Philadelphia metropolitan area. Cape May County had the largest population loss in the state, at 4.9 percent (Essex County, where Newark is located, lost 1.2 percent, the only other county to lose population).

    Small Area Analysis: The dispersion of the population is also illustrated by "place" data, which includes incorporated municipalities (Note 2) and "census designated places."

    Generally, newer housing reflects the distance of suburbs from the urban core. Gaining a larger share of population growth, this demonstrates a primarily  suburban, rather than urban core oriented, expansion.  An analysis of the more than 500 places (municipalities and "census designated places") indicates that the greatest share of New Jersey’s growth is in new suburban areas.

    Among places in which housing has a median construction date of 1945 or earlier, there was a 0.8 percent reduction in population. The growth rate then rises with each 10 year increment, reaching 4.0 percent in places with a median construction date of 1976 to 1985 and 11.1 percent for places with a median construction date of later (though this is the smallest category).

    However, the growth in these places accounts for only 18.5 percent of the state’s population gain. The other 81.5 percent was outside the incorporated municipalities and the census designated places. This population is generally in the state’s townships, some of which are older (such as North Bergen or Woodbridge), but most of which are much newer.  However, much of the growth in the townships was in newer areas, with 84 percent in areas with median construction dates of 1966 or later (Note 3)

    Thus, all-metropolitan New Jersey is becoming more suburban, while older, major municipalities such as Newark, Jersey City and Camden are enjoying a welcome respite from their generally steep declines.

    Note 1: These counties include Bergen, Burlington, Cumberland, Hunterdon, Mercer, Middlesex, Monmouth, Morris, Ocean, Salem, Somerset and Sussex.

    Note 2: New Jersey township officials have been engaged with the Census Bureau in a dispute over whether New Jersey townships should be considered incorporated. This analysis uses the "non-incorporated" status as defined by the Census Bureau, without taking a position on the nature of the disagreement.

    Note 3: The Census Bureau routinely makes changes to "census designated places" between censuses. As a result it is not possible to reconcile the township and place totals to the state total. There is a discrepancy of approximately 1.5 percent. This discrepancy is small enough to make the township figures generally reflective of the median construction dates.

    Wendell Cox is a Visiting Professor, Conservatoire National des Arts et Metiers, Paris and the author of “War on the Dream: How Anti-Sprawl Policy Threatens the Quality of Life

  • America’s Biggest Brain Magnets

    For a decade now U.S. city planners have obsessively pursued college graduates, adopting policies to make their cities more like dense hot spots such as New York, to which the “brains” allegedly flock.

    But in the past 10 years “hip and cool” places like New York have suffered high levels of domestic outmigration. Some boosters rationalize this by saying the U.S. is undergoing a “bipolar migration”–an argument recently laid out by Derek Thompson in The Atlantic. On the one hand the smart “brains” head for cool, coastal cities like New York and Boston, while “families” and “feet”–a term that seems to apply to the less cognitively gifted–trudge to the the nation’s southern tier–a.k.a. the Sun Belt–for cheap prices and warm weather. “College graduates with bachelor’s degrees or higher,” Thompson notes, “have been moving to the coasts, like salmon swimming against the southwesterly current.”

    However, this analysis–no matter how widely accepted in the media–is grossly oversimplified, perhaps even misleading. Indeed, college graduates, for the most part, are heading not to the big cities on the coasts, but to smaller, less dense and quite often Sun Belt cities.

    To come up with our list of the country’s biggest brain magnets, we took the 52 largest metropolitan areas (all those over 1 million population) and ranked them by gains in people with college educations compared to the population over 25 years of age between 2007 and 2009, using the latest data from the American Community Survey provided by demographer Wendell Cox. It turns out that none of the top 10 gainers were large Northeastern cities, but largely Southern or Midwestern. New Orleans; Raleigh, N.C.; Austin, Texas; Nashville; Birmingham, Ala.; Kansas City, Mo.-Kan.; and Columbus, Ohio, all scored high marks. Only one California city, San Diego, made the top 10. Perennial “brain gainers” Denver, Colo., and Seattle round out the top 10.

    Among those metropolitan statistical areas with populations over 5 million, the best ranking went to the Philadelphia region (No. 12 overall), arguably the least glitzy and most affordable of the large northeast cities. The San Francisco metropolitan area, long a leader in its percentage of college-educated adults, held the next spot at No. 13. On the other hand, supposed “brain” magnets Boston and Chicago managed middling rankings, right behind Charlotte, N.C., and just ahead of San Antonio, Texas. Both fell well behind such overlooked “brain gain” areas as Jacksonville, Fla.; St. Louis, Mo.-Ill.; and Indianapolis. New York, the nation’s intellectual capital, ranked a mediocre 29th and Los Angeles an even worse 37th. To put in perspective, Nashville’s rate of college educated migration growth was 3.7%, compared with 1.4% for New York and a measly 0.7% for Los Angeles.

    Rather than following a clear path to the world of the “hip and cool,” college graduates appear influenced by a more nuanced and complex series of factors in terms of their location. New Orleans’ No. 1 ranking, for example, is likely product of the continuing recovery of its shrunken population, where the central city appears to be somewhat more attractive to professionals than before Katrina while the suburban populations have recovered more quickly from the disaster. The strong showing of Birmingham may likely be traced not to changes in the core city itself, but to the rapid growth in its surrounding suburban counties and the rapid expansion of the region’s medical complex.

    This reflects something not often mentioned: the spreading out of intelligence. Conventional theory suggests that the new generation of college graduates will go to the largest, densest places, eschewing, as The Wall Street Journal put it snidely, their parent’s McMansions for small abodes in the inner city. Yet the ACS numbers indicate that, overall, college migrants tend to choose less dense places. In the two years we covered, the growth rate in urban areas with lower urban area densities (2,500 per square mile) boasted a 5% increase in college-educated residents, compared with roughly 3.5% for areas twice as dense.

    This can be seen in the pattern of migration toward relatively low-density metropolitan areas like Nashville, Columbus, Raleigh or Kansas City as opposed to more packed regions like New York, Los Angeles or San Francisco. And wherever these college graduates migrate, they are at least as likely to settle outside the urban core. Another overlooked fact: Most places with the highest percentages of college-educated people are in suburbs. Only two of the 20 most-educated counties in the country are located in the urban core: New York (Manhattan) and San Francisco. Virtually all the rest are suburban.

    Another somewhat surprising statistic revolves around affordability and job growth. The college-educated, particularly in this tepid economy, are not immune to reality. They may want to go one place–for example, ever-alluring New York or sunny Los Angeles–but may soon find they can find neither a good job there nor an affordable place to live in order to stay there. Overall our analysis shows that many end up in places with lower housing prices. Areas with the highest price housing experienced college-educated growth at a rate only 60% of those with more affordable real estate. This is one thing that makes an Austin or Raleigh, even a Columbus or Kansas City, more attractive than a Boston, New York or Los Angeles

    Finally we have to consider employment trends. For the most part college graduates, like most folks, preferred cities with lower unemployment and more job growth. Some top gainers, such as Raleigh, Columbus and Kansas City, all boast lower than average unemployment and appear to be recovering from the recession. But this is not always the case: Some relatively poor performers on the job front, like Portland, Ore., and San Diego, have managed to maintain their appeal–for now.

    As the economy recovers these patterns are likely to accelerate, although they could also shift a bit as regions gain or lose employment momentum. Meanwhile, the best strategy for attracting graduates lies in creating jobs, as well as in offering both affordable housing and a range of housing options, including both reasonably priced urban and lower-density living. Generally speaking an area that is economically vital as well as physically or culturally appealing will do best. In the next decade advantages will also fall to family-friendly regions, particularly as the current crop of millennial-generation graduates starts entering en masse their family-forming years. These factors, more than hipness or dense urbanity, may well be more influential in determining which regions do best in the ongoing war for talent.

    —-

    No. 1: New Orleans-Metairie-Kenner, La.

    Grad Gain: 36,666

    Gain as a Share of Total 25+ 2007 Population: 5.42%

    New Orleans’ No. 1 ranking is likely due to former exiles returning after Hurricane Katrina. A recent report from the Census Bureau estimates that area’s population in the past decade has shrunk 29%. Recovery in the urban core has remained patchy, but suburban populations have recovered more quickly from the disaster.

    No. 2: Raleigh-Cary, N.C.

    Grad gain: 28,748

    Gain as a Share of Total 25+ 2007 Population: 4.27%

    Even in hard times Raleigh-Durham–the fastest-growing metro area in the country–has repeatedly performed well on Forbes’ list of the best cities for jobs. The area is a magnet for technology companies fleeing the more expensive, congested and highly regulated northeast corridor. Affordable housing and short commute times are no doubt highly attractive to millennials seeking to start a family. Indeed, a 2010 Portfolio.com/bizjournals survey ranked the city the third-best for young adults.

    No. 3: Austin-Round Rock, Texas

    Grad gain: 42,117

    Gain as a Share of Total 25+ 2007 Population: 4.23%

    Brains are flocking to Austin for good reason. Forbes ranked it the best large urban area for jobs in 2010. Along with Raleigh-Durham, Austin is emerging as the next Silicon Valley, luring lots of brains who would have previously headed toward the West Coast. Austin owes much both to its public-sector institutions (the state government and the main campus of the University of Texas) and its expanding ranks of private companies–including foreign ones–swarming into the city’s surrounding suburban belt. Its vibrant cultural scene certainly helps in attracting college-educated millennials.

    No. 4: Nashville-Davidson-Murfreesboro-Franklin, Tenn.

    Grad gain: 36,975

    Gain as a Share of Total 25+ 2007 Population: 3.68%

    A high quality of life, a vibrant cultural and music scene and a diverse population make Nashville a desirable place to live. Low housing costs drive down the cost of living, which is even lower than in other affordable cities like Raleigh, Austin or Indianapolis. Nashville is also home to a growing health care industry: More than 250 health care companies have operations in Nashville, and 56 are headquartered there.

    No. 5: Kansas City, Mo./Kan.

    Grad gain: 38,398

    Gain as a Share of Total 25+ 2007 Population: 2.96%

    The two-state Kansas City region boasts strong population growth and net in-migration– and for good reason. The city has one of the lowest costs of living, one of the highest personal-income growth rates and one of the healthiest real estate markets in the country. Short commute times also add to the attractiveness of the city for families. The city is the second-largest rail hub in the U.S. and is actively growing its life science and technology sectors.

    No. 6: Birmingham-Hoover, Ala.

    Grad gain: 21,111

    Gain as a Share of Total 25+ 2007 Population: 2.86%

    Birmingham’s strong showing on this list is likely due to the rapid growth in its surrounding suburban counties. One big development sure to lure brains: the rapid expansion of the University of Alabama’s medical center and surrounding private medical industry.

    No. 7: San Diego-Carlsbad-San Marcos, Calif.

    Grad gain: 51,151

    Gain as a Share of Total 25+ 2007 Population: 2.71%

    The only MSA from the "hip and cool" state of California to make the top 10, despite high levels of out-migration and a relatively poor performance in the job front. For now, at least, the area’s beautiful beaches and idyllic weather manage to attract plenty of college graduates, but it will need to get out of its slump in order to retain them.

    No. 8: Denver-Aurora-Broomfield, Colo.

    Grad gain: 43,853

    Gain as a Share of Total 25+ 2007 Population: 2.69%

    A perennial magnet for college graduates, and one of the "hip and cool" cities to make the top of our list, Denver was one of the darlings of the information age, and its suburbs have long incubated tech companies. Its technology sector is still strong, but higher prices and greater regulation have driven companies to regions like Austin and Raleigh, which are more business-friendly and cheaper.

    No. 9: Columbus, Ohio

    Grad gain: 29,515

    Gain as a Share of Total 25+ 2007 Population: 2.6%

    While the recession has taken a huge toll on the rest of Ohio, Columbus has been thriving, thanks to being home of the state capital, a booming startup culture and the largest college campus in the country–Ohio State University, a major employer and information center. Forbes named the Columbus metropolitan area–home to 1.8 million residents– one of America’s best housing markets, as well as one of the best places for businesses and careers. The city enjoys below-average unemployment and a strong tech presence that includes Battelle Memorial Institute, which oversees laboratories for several federal agencies.

    No. 10: Seattle-Tacoma-Bellevue, Wash.

    Grad gain: 53,869

    Gain as a Share of Total 25+ 2007 Population: 2.39%

    Seattle has long been one of the big winners in the brain battle as well. It has some of the country’s most important cutting-edge firms–Microsoft, Costco, Amazon, Starbucks–one of the country’s best arrays of urban and suburban neighborhoods. Housing is no longer cheap, but remains far less expensive than its main rival, the San Francisco Bay Area.

    —-

    Photo by Jeanette Runyon

    This piece originally appeared in Forbes.

    Joel Kotkin is executive editor of NewGeography.com and is a distinguished presidential fellow in urban futures at Chapman University, and an adjunct fellow of the Legatum Institute in London. He is author of The City: A Global History. His newest book is The Next Hundred Million: America in 2050, released in February, 2010.

  • Personal Income in the 2000s: Top and Bottom Ten Metropolitan Areas

    The first decade of the new millennium was particularly hard on the US economy. First, there was the recession that followed the attacks of 9/11. That was followed by the housing bust and the resulting Great Financial Crisis, which was the most severe economic decline since the Great Depression.

    Per capita personal incomes in America’s major metropolitan areas vary widely. Moreover, the changes in per capita incomes from 2000 to 2009 have also varied. The differences are particularly obvious when average incomes are adjusted for metropolitan area Consumer Price Indexes. The US Bureau of Labor statistics produces a Consumer Price Index for nearly 30 metropolitan areas. Among these, 28 metropolitan areas are covered by these local Consumer Price Indexes.

    While overall national inflation was approximately 25 percent between 2000 and 2009, the metropolitan area inflation indexes ranged from 16 percent in Phoenix to more than 32 percent in San Diego. Five additional metropolitan areas had 2000 to 2009 inflation of more than 30 percent, including Los Angeles, Riverside-San Bernardino, Miami, Tampa-St. Petersburg and San Diego. Four metropolitan areas experienced inflation of less than 20 percent, including Atlanta, Detroit and Cleveland and Phoenix.

    Overall, the 28 metropolitan areas covered by metropolitan inflation indexes averaged a per capita income decrease of 0.1 percent, after adjustment for inflation. Increases were achieved in 18 metropolitan areas, while decreases occurred in 10. The overall average declines occurred because the steepest loss (19 percent in San Jose), was far outside the plus 10 percent to minus 8 percent range of the other 27 metropolitan areas (Table).

    Metropolitan Area: Per Capita Income
    Metropolitan Areas Covered by Metropolitan Consumer Price Indexes
    Inflation Adjusted
    Rank Metropolitan Area
    2000 in 2009$
    2009
    Change
    1 Baltimore
    $    43,729
    $    47,962
    9.7%
    2 Pittsburgh
    $    39,024
    $    42,216
    8.2%
    3 Washington
    $    53,753
    $    56,442
    5.0%
    4 Philadelphia
    $    43,572
    $    45,565
    4.6%
    5 St. Louis
    $    38,636
    $    40,342
    4.4%
    6 Milwaukee
    $    40,028
    $    41,696
    4.2%
    7 Los Angeles
    $    41,382
    $    42,818
    3.5%
    8 Houston
    $    42,232
    $    43,568
    3.2%
    9 Cleveland
    $    38,396
    $    39,348
    2.5%
    10 Chicago
    $    42,761
    $    43,727
    2.3%
    11 Phoenix
    $    33,594
    $    34,282
    2.0%
    12 San Diego
    $    44,812
    $    45,630
    1.8%
    13 Kansas City
    $    39,020
    $    39,619
    1.5%
    14 New York
    $    51,638
    $    52,375
    1.4%
    15 Cincinnati
    $    37,852
    $    38,168
    0.8%
    16 Seattle
    $    48,651
    $    48,976
    0.7%
    17 Boston
    $    53,396
    $    53,713
    0.6%
    18 Minneapolis-St. Paul
    $    45,690
    $    45,750
    0.1%
    19 Denver
    $    46,205
    $    45,982
    -0.5%
    20 Miami-West Pallm Beach
    $    41,937
    $    41,352
    -1.4%
    21 Riverside-San Bernardino
    $    30,600
    $    29,930
    -2.2%
    22 Portland
    $    39,703
    $    38,728
    -2.5%
    23 Tampa-St. Petersburg
    $    38,048
    $    36,780
    -3.3%
    24 San Francico
    $    61,831
    $    59,696
    -3.5%
    25 Dallas-Fort Worth
    $    41,575
    $    39,514
    -5.0%
    26 Detroit
    $    40,412
    $    37,541
    -7.1%
    27 Atlanta
    $    39,775
    $    36,482
    -8.3%
    28 San Jose
    $    68,185
    $    55,404
    -18.7%
    Unweighted Average
    $    43,801
    $    43,700
    -0.2%

    The Top Ten: The strongest per capita personal income growth between 2000 and 2009 was in Baltimore, which had an inflation adjusted increase of 9.7 percent. This strong performance is not surprising due to Baltimore’s proximity to Washington and the federal government’s high paying jobs. It also receives spillover lucrative employment from federal contracts to health, defense and security companies. In fact, Baltimore did better than Washington. Washington, which extends from the District of Columbia and into Maryland, Virginia and West Virginia. Not that DC did badly; it boasted the third highest income growth, and 5.0 percent.

    However, perhaps the biggest surprise is the metropolitan area that slipped into the number two position between Baltimore and Washington. The Pittsburgh metropolitan area, which may have faced the most severe economic challenges of any major metropolitan area over the past 40 years, achieved per capita personal income growth of 8.2 percent. The Pittsburgh gain is all the more significant in view of the local financing difficulties which placed the city of Pittsburgh in the near equivalent of bankruptcy under Pennsylvania’s Act 47. However, as is the case in on number of metropolitan areas, the central city has become much less dominant and no longer seals the fate of the larger metropolitan area. Today, the city of Pittsburgh accounts for only 15 percent of the metropolitan area population.

    Philadelphia, the other long troubled region across the state, constitutes another surprise. Philadelphia placed fourth in per capita income growth at 4.6 percent only slightly behind Washington. The Philadelphia metropolitan area borders on that of Baltimore, stretching from Pennsylvania into New Jersey, Delaware and Maryland. Together with Washington and Baltimore, Philadelphia anchors the northern end of a corridor of comparative prosperity.

    Four of the next six positions are occupied by Midwest metropolitan areas. This may be unexpected because of the significant job losses sustained in this area since 2000. St. Louis, which stretches from Missouri into Illinois, ranked fifth in per capita income growth, at 4.4 percent. Milwaukee ranked sixth in its per capita income growth at 4.2 percent. Cleveland ranked ninth with per capita income growth of 2.5 percent, while Chicago placed 10th, with a gain of 2.3 percent in per capita personal income.

    Los Angeles was the only metropolitan area in the West to place in the top 10 in per capita income growth. Los Angeles ranked seventh growth of 3.5 percent. Houston replaced eighth with personal income growth of 3.2 percent.

    Overall, the East and Midwest captured six of the top ten income positions, while the South and West occupied four of the top ten positions.

    The Bottom 10: If the top 10 contained surprises, the bottom 10 could be even more surprising. Last place (28th) was occupied by San Jose, which experienced a stunning 18.7 percent decline in per capita inflation adjusted income between 2000 and 2009. This income loss is more than double that of the second-worst performing metropolitan area and more than triples that of all but two other metropolitan areas.

    The second worst position (27th) also contained a surprise, in Atlanta, which has enjoyed decades of unbridled growth. Yet, Atlanta experienced a per capita income loss of 8.3 percent. There was no surprise in the third to the last ranking (26th) of Detroit, with its automobile industry employment losses and the physical deterioration of its central city, which may be unprecedented in modern peace-time. Per capita incomes declined 7.1 percent in Detroit.

    Dallas-Fort Worth, which has also experienced strong growth in the past, posted a surprising fourth worst, with a per capita income decline of 5.0 percent. San Francisco, which has now replaced San Jose as the metropolitan area with the highest per capita income, ranked fifth worst and experienced a decline of 3.5 percent.

    All of the remaining bottom 10 positions were occupied by metropolitan areas that have developed a reputation for strong growth. Tampa St. Petersburg ranked 6th worst, with a per capita income loss of 3.3 percent. Portland (Oregon) ranked 7th worst with a personal income loss of 2.5 percent. Riverside San Bernardino, with the lowest per capita income ranking out of the 28 metropolitan areas, ranked 8th worst with a per capita income drop of 2.2 percent.

    The Miami (to West Palm Beach) metropolitan area ranked 9th in personal income growth with a loss of 1.4 percent from 2000 to 2009, while Denver topped out the bottom 10, ranking, with a per capita income loss of 0.5 percent

    Overall, the South and the West captured nine of the bottom ten positions, while only one Midwestern metropolitan area, Detroit, broke into the bottom ten.

    Of course, the 2000s certainly were an unusual time. But it does suggest that the dogma about the geography of regional prosperity needs to be challenged and perhaps thoroughly revised.

    Photo: Pittsburgh: Second Fastest Growing Income per Capita 2000-2009 (photo by author)

    Wendell Cox is a Visiting Professor, Conservatoire National des Arts et Metiers, Paris and the author of “War on the Dream: How Anti-Sprawl Policy Threatens the Quality of Life

  • Is Pennsylvania History?

    On a recent whirlwind through Pennsylvania, I thought of James Carville, who popularized the notion that “It’s Philadelphia on one side, Pittsburgh on the other, and Alabama in the middle.” It’s a clever line, but between the Ohio and Delaware rivers he is missing a great American tapestry: the wreck of the Penn-Central, United flight 93’s final frantic moments, the social history of the Johnstown flood, and whether a state of steel and coal is past or present.

    Pennsylvania also reflects some broad truths about the nation, in particular, that stimulus plans can take forty years, the Amish have it right, the Civil War remains a personal wound, and Amtrak will never be the agent of high-speed rail.

    My first stop was Harrisburg, and I got there on a train that crossed through Amish country. I would imagine that as a community the Amish have the lowest debt-to-equity ratio in the country. There is something timeless and inspiring about their red barns and silos that flickered across the train windows, and no one needs to exhort the Amish to “Go Green.”

    In Harrisburg, as if a character in a novel by Theodore Dreiser, I walked with my grip from the station to a restaurant in the shadow of the state capitol. Later that evening I went to a high school graduation in the Concert Forum Hall, an elegant rotunda that was finished in the depths of the Depression.

    Around the circular walls are huge maps and timelines of world history. I passed the slow moments of the ceremony following Hadrian on his way into the Syrian desert and Marco Polo to the court of the Great Khan.

    Will the current stimulus money produce any buildings of such greatness? Somehow I doubt it. When the train went through Philadelphia, I saw a cheerful sign in an empty rail yard, with wording to the effect that the hot government money would get Americans back to work. The boast sounded unconvincing, as if everyone knows that stimulus money will end up funding deficits, national security advisors, and weapons contractors.

    General Robert E. Lee thought so much of Harrisburg and its strategic rail bridges that twice he embarked on campaigns to cut the main line of the Pennsylvania Railroad, and twice he failed, first at Antietam and then Gettysburg. The bridges over the Susquehanna remain, and their stone arches echo Avignon. The downtown — which looks in need of some stimulus — recalls the urban loneliness of Edward Hopper.

    From Harrisburg I drove west to Chambersburg and Mercersburg, strategic hamlets in the Civil War, but now a long way from the information superhighway. In 1864 Lee’s general, John McCausland, burned Chambersburg to the ground when the citizens failed to post his demanded ransom, which was $100,000 in gold, or $500,000 in currency (even terrorists are leery of inflated money); later, Chambersburg was the only northern town razed during in the war.

    President James Buchanan grew up in Mercersburg, a sleepy town notable today for its distinguished prep school. The log cabin in which he was born is now on the campus of Mercersburg Academy, and a nearby plaque notes that Buchanan served as U.S. Senator, ambassador to Russia and Great Britain, and Secretary of State before becoming the fifteenth president, impressive achievements for someone whose presidency is remembered as a failure, ruined by the Dred Scott decision and the drift to Civil War, which he did little to prevent.

    In a more recent conflict, United flight 93 crashed west of Mercersburg, near Shanksville, which echos the lonely farmland over which so much of the Civil War was fought. Conspiracy theories (a rare American growth industry) postulate that no plane crashed at Shanksville or that the one that did was destroyed by a missile, perhaps on orders from the trigger-happy Dick Cheney. (President Bush was finishing up My Pet Goat with the school kids.) Other theories claim that engine parts were found eight miles from the crash site and no plane debris larger than small fragments were located.

    A visit to the temporary Flight 93 memorial, however, puts to rest these and a number of other 9/11 conspiracy theories. About eighty percent of the plane was found at the site, although much of its was buried in the soft earth that had been strip mined; many local residents saw the plane hurtling intact toward the ground; the only debris found miles from the crash site was paper; and one of the engines flew several hundred yards — not miles — from the impact crater.

    The memorial to the victims of Flight 93 is budgeted to cost about $50 million, some of which has been privately raised. In design, it looks like the Vietnam Memorial in the middle of nowhere. No doubt it was a flush Congress that authorized the expenditure, even though the temporary memorial, a simple American flag at the crash site and a makeshift observation deck, looks like a better use of government resources. (Think of American tragedies remembered only with a statue in a traffic circle.)

    Forty Americans died at Shanksville. The death toll at Johnstown, just up the road, was more than two thousand when in 1889 a dam above the city broke and a wall of water washed over the gritty mill town. The tragedy is recalled in a series of memorials around the Little Conemaugh River Valley, and at a flood museum in Johnstown, which more recently has lost most of its steel production and its jobs.

    Not even the local filming of the 1977 movie Slap Shot with Paul Newman could save the economy of Johnstown, now laced with boarded storefronts, although it’s fun in the main square to imagine the presence of Coach Reggie Dunlop and the Hansons (“They brought their fuckin’ TOYS with ’em!”).

    A morality tale as well as a local disaster, blame for the Johnstown flood falls on The South Fork Fishing & Hunting Club, a mountain retreat of the super rich — Carnegie and Frick were members — that callously ignored warning signs that its South Fork Dam might give out. No wonder its so hard to win as a Republican in central Pennsylvania.

    I spent the night in Pittsburgh, no longer a steel city, but one given over to the service economy: in this case, sports stadiums, universities, finance, and hospitals. Old America made steel rails; new America entertains the masses.

    I left Pittsburgh on the The Pennsylvanian, Amtrak’s daily service to Philadelphia and New York, a remnant of the Pennsylvania Railroad, once the largest corporation on earth. After the Pennsylvania Railroad merged with the New York Central in 1968, the combined company failed less than three years later. The writer L.J. Davis said “it was more a death watch than a merger.” Penn-Central was the Enron of the 1970s. When it failed, it was the biggest bankruptcy in U.S. history.

    Here’s an overlooked cautionary tale about the delayed time reactions of government’s economic interventions: played out over thirty years, the Penn-Central merger was a big success. It took, however, the deregulation of the freight railroad business and the sale of the assets of Conrail (the successor to the bankruptcy) to the Norfolk Southern and CSX. When the dust settled, Penn-Central left the Northeast with two privately-owned railroads that are everything the shareholders had hoped for in 1968.

    On my return trip east, the train crossed the Allegheny Mountains on the Horseshoe Curve, ambled through Altoona and Lewistown, and then paused for almost forty-five minutes in Harrisburg and Philadelphia—an odd schedule for a railroad now talking up high-speed rail. Keep in mind that all the rail stimulus billions will bring is a return to the train speeds reached in the 1920s… the perfect metaphor for the illusions of government investment.

    What makes me hopeful about Pennsylvania’s future? I see optimism in the Amish red barns, the three rivers in Pittsburgh, the endurance of Johnstown, the four tracks of the main line, the federal-era houses in Harrisburg, the life of the Susquehanna, and the roadside markers like one in Chambersburg that reads: “On June 26, 1863, Gen. Robert E. Lee, and staff, entered this square.”

    What’s not to admire about a state that keeps its history so alive? I only wish it still had a steel industry and the Broadway Limited.

    Flickr Photo by Runner Jenny: 155th Pennsylvania Zouave Monument, Little Round Top, Gettysburg.

    Matthew Stevenson is the author of Remembering the Twentieth Century Limited, winner of Foreword’s bronze award for best travel essays at this year’s BEA. He is also editor of Rules of the Game: The Best Sports Writing from Harper’s Magazine. He lives in Switzerland.

  • SPECIAL REPORT: Metropolitan Area Migration Mirrors Housing Affordability

    On schedule, the annual ritual occurred last week in which the Census Bureau releases population and migration estimates and the press announces that people are no longer moving to the Sun Belt. The coverage by The Wall Street Journal was typical of the media bias, with a headline “Sun Belt Loses its Shine.” In fact, the story is more complicated – and more revealing about future trends.

    Domestic Migration Tracks Housing Affordability: There have been changes in domestic migration (people moving from one part of the country to another) trends in the last few years, but the principal association is with housing affordability.

    Severe and Not-Severe Bubble Markets: Overall, the major metropolitan markets with severe housing bubbles (a Median Multiple rising to at least 4.5, see note) lost nearly 3.2 million domestic migrants (all of these markets have restrictive land use regulation, such as smart growth or growth management) from 2000 to 2009. However, not all markets with severe housing bubbles lost domestic migrants. “Safety valve” bubble markets drew migration from the extreme bubble markets of coastal California, Miami and the Northeast. These “safety valve” markets (including Phoenix, Las Vegas, Portland, Seattle, Riverside-San Bernardino, Orlando, Tucson and Tampa-St. Petersburg), gained a net 2.2 million from 2000 to 2009, while the other bubble markets lost 5.3 million domestic migrants from 2000 to 2009 (See Table below, metropolitan area details in Demographia US Metropolitan Areas Table 8). At the same time, the markets that did not experience a severe housing bubble (those in which the Median Multiple did not reach 4.5) gained a net 1.5 million domestic migrants.

    The burst of the housing bubble explains the changes in domestic migration trends. Housing affordability has improved markedly in the extreme bubble markets, so that there was less incentive to move. Then there was the housing bust-induced Great Recession, which also slowed migration since people had more trouble selling their homes or finding anew job. As a result, the migration to the “safety valve” markets and to the smaller markets dropped substantially.

    • During 2009, the “safety valve” markets gained only 51,000 net domestic migrants, one-fifth of the annual average from 2000 to 2008.
    • At the same time, the other severe housing bubble markets lost 236,000 domestic migrants in 2009, compared to the average loss of 638,000 from 2000 to 2008.
    • Areas outside the major metropolitan areas also experienced a significant drop in domestic migration, dropping from an annual average of 203,000 between 2000 and 2008 to 23,000 in 2009.
    • The major metropolitan markets that did not experience a severe housing bubble gained 161,000 domestic migrants in 2009, little changed from the 169,000 average from 2000 to 2008. These markets are concentrated in the South and Midwest. Indianapolis, Kansas City, Nashville, Louisville and Columbus as well as the Texas metropolitan areas continued their positive migration trends.
    Domestic Migration by Severity of the Housing Bubble
    Metropolitan Areas over 1,000,000 Population
    2000-2008
    Metropolitan Areas 2000-2009 2009 2000-2008 Average
    Withouth Severe Housing Bubbles     1,509,870         160,514      168,670
    With Severe Housing Bubbles    (3,161,514)        (184,486)     (372,129)
       Not "Safety Valve" Markets    (5,347,211)        (235,838)     (638,922)
       "Safety Valve" Markets     2,185,697           51,352      266,793
    Outside Largest Metropolitan Areas     1,651,644           23,972      203,459
    Severe housing bubbles: Housing costs rose to a Median Multiple of 4.5 or more (50% above the historic norm of 3.0). 
    Median Multiple: Median House Price/Median Household Income
    "Safety Valve" refers to markets with severe housing bubbles that received substantial migration from more expensive markets (coastal California, Miami and the Northeast). These markets include Las Vegas, Phoenix, Riverside-San Bernardino, Sacramento, Portland, Seattle, Orlando, Tucson and Tampa-St. Petersburg.

    Moreover, the Census Bureau revised its previous domestic migration figures for 2000 to 2008 to add more than 110,000 from the markets without severe housing bubbles, while taking away more than 150,000 domestic migrants from the markets with severe housing bubbles. This adjustment alone rivals the 2009 domestic migration loss of 183,000 in these markets

    Population Growth: The Top 10 Metropolitan Areas: Sun Belt metropolitan areas continued to experience the greatest population growth. Between 2000 and 2009, the fastest growing metropolitan areas were Atlanta, Dallas-Fort Worth and Houston, In 2009, Washington, DC was added to the list (Details in Demographia US Metropolitan Areas, Table 2).

    New York: The New York metropolitan area remains the nation’s largest, now reaching a population of over 19 million. More than 700,000 new residents have been added since 2000. However, New York’s population growth has been the second slowest of the 10 largest metropolitan areas since 2000 (Figure 1). Moreover, New York’s net domestic out-migration has been huge. New York has lost 1,960,000 domestic migrants, which is more people than live in the boroughs of The Bronx and Richmond combined. Overall, 10.7% of the New York metropolitan area’s 2000 population left the metropolitan area between 2000 and 2009. More than 1,200,000 of this domestic migration was from the city of New York. Between 2008 and 2009, New York’s net domestic out-migration slowed from the minus 1.32% 2000-2008 annual rate to minus 0.58%., reflecting the smaller migration figures that have been typical of the Great Recession.

    Los Angeles: For decades, Los Angeles has been one of the world’s fastest growing metropolitan areas. Growth had ebbed somewhat by the 1990s, when Los Angeles added 1.1 million people. The California Department of Finance had projected that Los Angeles would add another 1.35 million people between 2000 and 2010. Yet, the Los Angeles growth rate fell drastically. From 2000 to 2009, Los Angeles added barely one-third the projected amount (476,000) and grew only 3.8%. Unbelievably, fast growing Los Angeles became the slowest growing metropolitan area among the 10 largest. In 2009, Los Angeles had 12.9 million people. Los Angeles lost 1.365 million domestic migrants, which is of 11.0% of its 2000 population, and the most severe outmigration among the top 10 metropolitan areas (Figure 2).

    Chicago: Chicago continues to be the nation’s third largest metropolitan area, at 9.6 million population, a position it has held since being displaced by Los Angeles in 1960. Chicago has experienced decades of slow growth and continues to grow less than the national average, at 5.1% between 2000 and 2009 (the national average was 8.8%). Yet, Chicago grew faster than both New York and Los Angeles. Chicago also lost a large number of domestic migrants (561,000), though at a much lower rate than New York and Chicago (6.2%). Even so, Chicago is growing fast enough that it could exceed 10 million population in little more than a decade, by the 2020 census.

    Dallas-Fort Worth: Dallas-Fort Worth has emerged as the nation’s fourth largest metropolitan area, at 6.4 million, having added 1,250,000 since 2000. In 2000, Dallas-Fort Worth ranked fifth, with 500,000 fewer people than Philadelphia, which it now leads by nearly 500,000. Dallas-Fort Worth added more population than any metropolitan area in the nation between 2008 and 2009 and has been the fastest growing of the 10 top metropolitan areas since 2006. As a result, Dallas-Fort Worth has replaced Atlanta as the high-income world’s fastest growing metropolitan area with more than 5,000,000 population. Dallas-Fort Worth added a net 317,000 domestic migrants between 2000 and 2009.

    Philadelphia: Philadelphia is the nation’s fifth largest metropolitan area, at just below 6,000,000 population. Like Chicago, Philadelphia has had decades of slow growth, yet has grown faster in this decade than both New York and Los Angeles (4.8%). Philadelphia has lost a net 115,000 domestic migrants since 2000, for a loss rate of 2.2%, well below that of New York, Los Angeles and Chicago.

    Houston: Houston ranks sixth, with 5.9 million people and is giving Dallas-Fort Worth a “run for its money.” Like Dallas-Fort Worth, Houston has added more than 1,000,000 people since 2000. Over the same period, Houston has passed Miami and Washington (DC) in population. Houston has added a net 244,000 domestic migrants since 2000, and added 50,000 in 2008-2009, the largest number in the country. Like Dallas-Fort Worth, Houston accelerated its annual domestic migration growth rate in 2008-2009. At the current growth rate, Houston seems likely to pass Philadelphia in population shortly after the 2010 census.

    Miami: Miami (stretching from Miami through Fort Lauderdale to West Palm Beach) is the seventh largest metropolitan area, with 5.6 million people. Miami has added more than 500,000 people, for a growth rate of 10.4%. However, Miami has suffered substantial domestic migration losses, at 287,000, a loss rate of, 5.7% relative to its 2000 population.

    Washington (DC): Washington recaptured 8th place, moving ahead of Atlanta, which had temporarily replaced it. Washington’s population is 5.5 million and added 655,000 between 2000 and 2009, for a growth rate of 13.6%. However, Washington lost a net 110,000 domestic migrants, 2.2% of its 2000 population. That trend was reversed in 2008-2009, when a net 18,000 domestic migrants moved to Washington, perhaps reflecting the increased concentration of economic power in the nation’s capital.

    Atlanta: Atlanta is the real surprise this year. For more than 30 years, Atlanta has had strong growth, however, this year it slowed. Atlanta is the 9th largest metropolitan area in the nation, at 5.5 million. Since 2000, Atlanta has added 1.2 million people, though added only 90,000 last year. Atlanta has added a net 429,000 domestic migrants since 2000, though the rate slowed to only 17,000 in 2008-2009.

    Boston: Boston is the nation’s 10th largest metropolitan area, with 4.6 million people. During the 2000s, Boston has added nearly 200,000, growing by 4.2%. Yet, Boston has also experienced a net domestic migration loss of 236,000, or 5.4% of its 2000 population. In 2008-2009, Boston, like Washington, reversed its domestic migration losses, adding 7,000.

    Trends by Size of Metropolitan Area: As throughout the decade, the slowest growing areas of the nation have been metropolitan areas over 10,000,000 population (New York and Los Angeles), which grew 3.9% and non-metropolitan areas, which grew 2.6% during the decade Metropolitan areas that had between 2.5 and 5.0 million population in 2000 boasted the biggest jump (these include fast growing Houston and Atlanta, which are now more than 5 million), at 13.4% for the decade. All of the other size classifications grew between 8.9% and 11.3% over the decade (see Demographia US Metropolitan Areas, Table 1). Metropolitan areas that began the decade with between 5,000,000 and 10,000,000 population gained 10.0%. Those with 250,000 to 500,000 grew 10.4%, those with 500,000 to 1,000,000 grew 10.2% and the smallest metropolitan areas, those from 50,000 to 250,000 grew 8.9%

    Metropolitan areas over 1,000,000 population lost 2.19 million domestic migrants during the decade, but smaller metropolitan areas added 2.24 million domestic migrants. Non-metropolitan areas lost 50,000 domestic migrants. In 2009, the smaller metropolitan areas gained 125,000 domestic migrants, while the larger metropolitan areas lost 30,000. Non-metropolitan areas lost more than 90,000 domestic migrants. As noted above, these smaller figures for 2009 reflect the more stable housing market and the extent to which the Great Recession has reduced geographic mobility (See Demographia US Metropolitan Areas, Tables 1 and 3).


    Note: The Median Multiple is the median house price divided by the median household income. The historic standard has been 3.0.

    Photograph: Dallas

    Wendell Cox is a Visiting Professor, Conservatoire National des Arts et Metiers, Paris. He was born in Los Angeles and was appointed to three terms on the Los Angeles County Transportation Commission by Mayor Tom Bradley. He is the author of “War on the Dream: How Anti-Sprawl Policy Threatens the Quality of Life.