Tag: Phoenix

  • The Housing Bubble: The Economists Should Have Known

    Paul Krugman got it right. But it should not have taken a Nobel Laureate to note that the emperor’s nakedness with respect to the connection between the housing bubble and more restrictive land use regulation.

    A just published piece by the Federal Reserve Bank of Boston, however, shows that much of the economics fraternity still does not “get it.” In Reasonable People Did Disagree: Optimism and Pessimism About the U.S. Housing Market Before the Crash, Kristopher S. Gerardi, Christopher L. Foote and Paul S. Willen conclude that it was reasonable for economists to have missed the bubble.

    Misconstruing Las Vegas and Phoenix: They fault Krugman for making the bubble/land regulation connection by noting that the “places in the United States where the housing market most resembled a bubble were Phoenix and Las Vegas,” noting that both urban areas have “an abundance of surrounding land on which to accommodate new construction” (Note 1).

    An abundance of land is of little use when it cannot be built upon. This is illustrated by Portland, Oregon, which is surrounded by such an “abundance of land.” Yet over a decade planning authorities have been content to preside over a 60 percent increase in house prices relative to incomes, while severely limiting the land that could have been used to maintain housing affordability. The impact is clearly illustrated by the 90 percent drop in unimproved land value that occurs virtually across the street at Portland’s urban growth boundary.

    Building is largely impossible on the “abundance of land” surrounding Las Vegas and Phoenix. Las Vegas and Phoenix have virtual urban growth boundaries, formed by encircling federal and state lands. These are fairly tight boundaries, especially in view of the huge growth these areas have experienced. There are programs to auction off some of this land to developers and the price escalation during the bubble in the two metropolitan areas shows how a scarcity of land from government ownership produces the same higher prices as an urban growth boundary

    Like Paul Krugman, banker Doug French got it right. In a late 2002 article for the Nevada Policy Research Institute, French noted the huge increases auction prices, characterized the federal government as hording its land and suggested that median house prices could reach $280,000 by the end of the decade. Actually, they reached $320,000 well before that (and then collapsed).

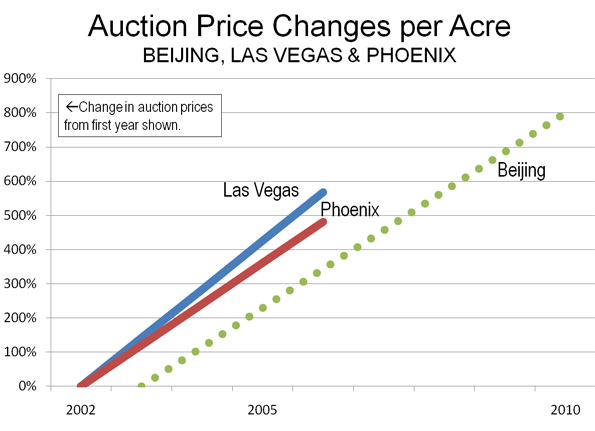
    In Las Vegas, house prices escalated approximately 85% relative to incomes between 2002 and 2006. Coincidentally, over the same period, federal government land auctions prices for urban fringe land rose from a modest $50,000 per acre in 2001-2, to $229,000 in 2003-4 and $284,000 at the peak of the housing bubble (2005-6). Similarly, Phoenix house prices rose nearly as much as Las Vegas, while the rate of increase per acre in Phoenix land auctions rose nearly as much as in Las Vegas.

    In both cases, prices per acre rose at approximately the same annual rate as in Beijing, which some consider to have the world’s largest housing bubble. According to Joseph Gyourko of Wharton, along with Jing Wu and Yongheng Deng Beijing prices rose 800 percent from 2003 to 2008 (Figure). This is true even thought we are not experiencing the epochal shift to big urban areas now going on in China.

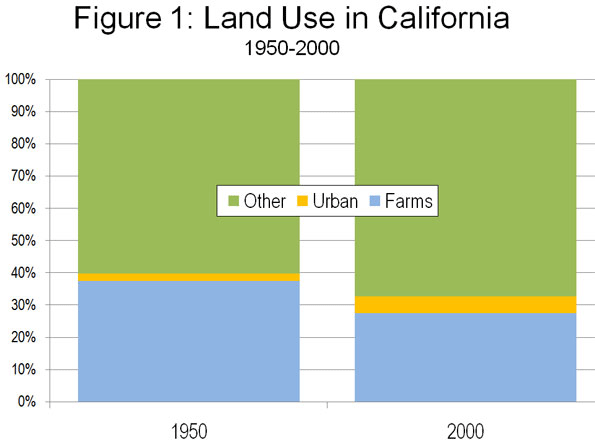
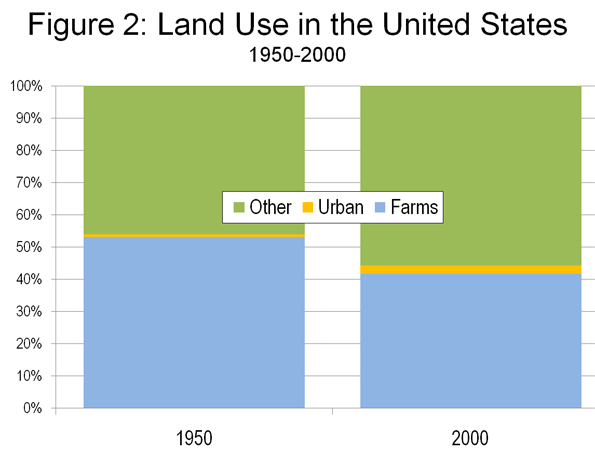
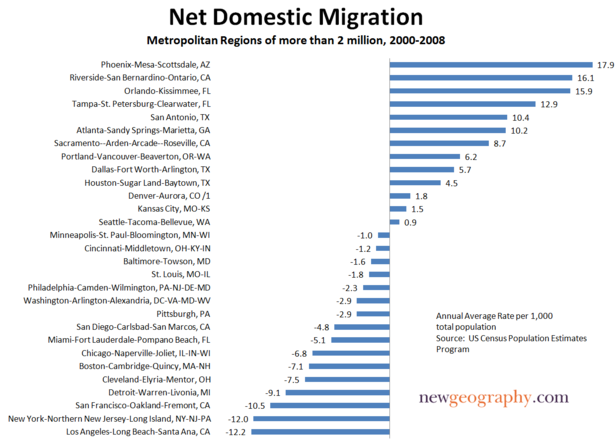
    The Issue is Land Supply: The escalation of new house prices during the bubble occurred virtually all in non-construction costs such as the costs of land and any additional regulatory costs. It is not sufficient to look at a large supply of new housing (as the Boston Fed researchers do) and conclude that regulation has not taken its toll. The principal damage done by more restrictive land regulation comes from limiting the supply of land, which drives its price up and thereby the price of houses. In some places where there was substantial building, restrictive land use regulations also skewed the market strongly in favor of sellers. This dampening of supply in the face of demand drove land prices up hugely, even before the speculators descended to drive the prices even higher. Florida and interior California metropolitan areas (such as Sacramento and Riverside-San Bernardino) are examples of this.

    Missing Obvious Signs: There are at least two reasons why much of the economics profession missed the bubble.

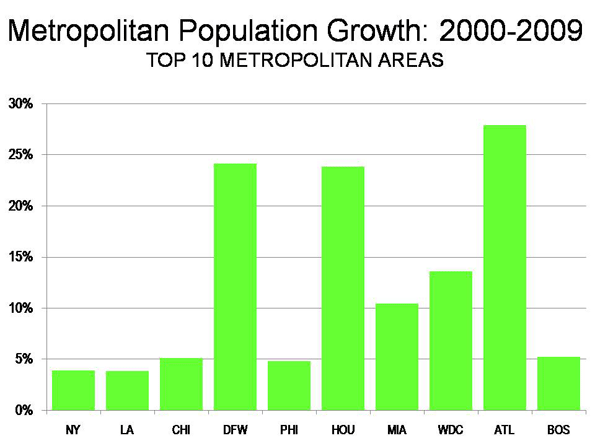
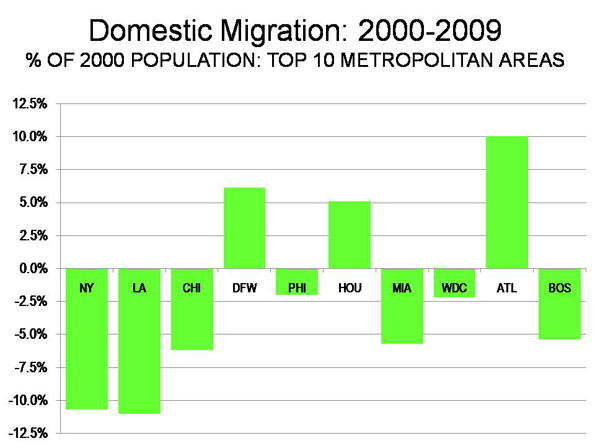
    (1) Unlike Paul Krugman, many economists failed to look below the national data. As Krugman showed, there were huge variations in house price trends between the nation’s metropolitan areas. National averages mean little unless there is little variation. Yet most of the economists couldn’t be bothered to look below the national averages.

    (2) Most economists failed to note the huge structural imbalances that had occurred in the distorted housing markets relative to historic norms. Since World War II, the Median Multiple, the median house price divided by the median household income, has been 3.0 or less in most US metropolitan markets. Between 1950 and 2000, the Median Multiple reached as high as 6.1 in a single metropolitan area among today’s 50 largest, in a single year (San Jose in 1990, see Note 2). In 2001, however, two metropolitan areas reached that level, a figure that rose to 9 in 2006 and 2007. The Median Multiple reached unprecedented and stratospheric levels in of 10 or more in Los Angeles, San Francisco, San Diego and San Jose- all of which have very restrictive land use and have had relatively little building. This historical anomaly should have been a very large red flag.

    In contrast, the Median Multiple remained at or below 3.0 in a number of high growth markets, such as Atlanta, Dallas-Fort Worth and Houston and other markets throughout the bubble.. Even with strong housing growth, prices remained affordable where there was less restrictive land use regulation.

    Seeing the Signs: Krugman, for his part, takes a well deserved victory lap in a New York Times blog entitled “Wrong to be Right,” deferring to Yves Smith at nakedcapitalism.com who had this to say about the Federal Reserve Bank of Boston research:

    It is truly astonishing to watch how determined the economics orthodoxy is to defend its inexcusable, economy-wrecking performance in the run up to the financial crisis. Most people who preside over disasters, say from a boating accident or the failure of a venture, spend considerable amounts of time in review of what happened and self-recrimination. Yet policy-making economists have not only seemed constitutionally unable to recognize that their programs resulted in widespread damage, but to add insult to injury, they insist that they really didn’t do anything wrong.

    Maybe we should have known better: beware economists bearing the moment’s conventional wisdom.

    ——

    Note 1: The authors cite work by Albert Saiz of Wharton to suggest an association between geographical constraints and house price increases in metropolitan areas. The Saiz constraint, however, looks at a potential development area 50 kilometers from the metropolitan center (7,850 square kilometers). This seems to be a far too large area to have a material price impact in most metropolitan areas. For example, in Portland, the strongly enforced urban growth boundary (which would have a similar theoretical impact on prices) was associated with virtually no increase in house prices until the developable land inside the boundary fell to less than 100 square kilometers (early 1990s). A far more remote geographical barrier, such as the foothills of Mount Hood, can have no meaningful impact in this environment.

    Note 2: William Fischel of Dartmouth has shown how the implementation of land use controls in California metropolitan areas coincided with the rise of house prices beyond historic national levels. As late as 1970, house prices in California were little different than in the rest of the nation.

    Wendell Cox is a Visiting Professor, Conservatoire National des Arts et Metiers, Paris and the author of “War on the Dream: How Anti-Sprawl Policy Threatens the Quality of Life

    Photograph: $575,000 house in Los Angeles (2006), Photograph by author

  • The Declining Human Footprint

    There are few more bankrupt arguments against suburbanization than the claim that it consumes too much agricultural land. The data is so compelling that even the United States Department of Agriculture says that “our Nation’s ability to produce food and fiber is not threatened” by urbanization. There is no doubt that agricultural production takes up less of the country’s land than it did before. But urban “sprawl” is not the primary cause. The real reason lies in the growing productivity of American farms.

    Since 1950, an area the size of Texas plus Oklahoma (or an area almost as large as France plus Great Britain) has been taken out of agricultural production in the United States, not including any agricultural land taken by new urbanization (Note 1). That is enough land to house all of the world’s urban population at the urban density level of the United Kingdom.

    America’s Spectacular Agricultural Productivity

    Even with less land, agriculture’s performance has been stunning. According to US Department of Agriculture data, US farm output rose 160% between 1950 and 2008. Productivity per acre rose 260%. In particular , California’s farms – often cited as victims of sprawl – have done quite well. Between 1960 and 2004 (Note 2), the state’s agricultural productivity rose 2.3% annually and 3.0% per acre. By comparison national agricultural productivity rose less over the same period at 1.7% overall and 2.2% per acre.

    According to the United States Department of Agriculture, from 1990 to 2004 (latest data), California’s agricultural production rose 32% and on less farm land.

    Of course, there has been substantial reduction of farmland close to some metropolitan areas, but overall the impact of urbanization nationally has not been substantial. For example, since 1950:

    In addition, the nation’s agriculture is subsidized to the tune of more than $15 billion annually, which is strong evidence that more land is being farmed than is required. Subsidies increase the supply of virtually anything beyond its underlying demand. This can be illustrated by imagining how much less transit service there would be if it were not 80% subsidized. Suffice it to say, America is not threatened by “disappearing farmland.”

    America has less farmland because it has not needed as much as before to serve its customers. Thus, considerable farmland has been returned to a more natural state. Generally, this has got to be good for the environment. Land that is left to nature does not require fertilization, for example. The same interests that have frequently claimed that farmland has been disappearing also decry the loss of open space. In fact, the withdrawal of redundant farmland has produced considerable open space – call it open space sprawl.

    Repeat it Often Enough….

    None of this has kept “disappearing farmland” from being a rallying cry among those who would construct Berlin Walls around the nation’s urban areas. Yet the extent to which Bonnie Erbe of Politics Daily and National Public Radio embraced the fiction was surprising. Her “Vanishing Farmland: How It’s Destabilizing America’s Food Supply,” was accompanied by “meant to indict” photograph of farm equipment next to new suburban housing.

    Ms. Erbe’s principal source was a web page from the American Farmland Trust, which seeks to conserve farm land. In its California Agricultural Land Loss & Conservation: The Basic Facts, the American Farmland Trust argues for more “efficient” (i.e. denser) urbanization and claims that, “One-sixth…” (17%) “… of the land urbanized since the Gold Rush … has been developed since 1990.” That might be an impressive figure, if it were not that the state has added 7 million urban residents since 1990, which is one-fourth (25%) of all the urban population added since the Gold Rush and equal to the 1990 population of New York City.

    It is worth noting that California has agricultural preservation measures already in place for farm owners and, finally, that no one can compel an unwilling farm owner to sell their land to a developer or anyone else (except perhaps a government agency through eminent domain).

    In California, as elsewhere in the nation, urbanization has not been the principal cause of farm land reduction. According to the US Census of Agriculture, farmland declined in California from 2002 to 2007 by 2.2 million acres. That 5 year reduction in farmland is approximately equal to the expansion of all California urban areas over the 50 years between 1950 and 2000.

    Most Development is Not Urban

    In the same document, the American Farmland Trust indicates support for the radical urban land regulations. Policies such as in Sacramento’s Blueprint that raise significantly inflate the price of land, make housing less affordable. The agricultural, property and urban planning interests who would ration land for people and their houses have missed a larger targets such as ultra-low density “ranchettes” favored by a small wealthy minority who live in the country, but are not farmers.
    According to the US Department of Agriculture, rural, large lot residential development (non-agricultural) covered 40% more land than all of the nation’s urbanization in 2000. These parcels represent “scattered single houses on large parcels, often 10 or more acres in size.” Further, since 1980, the increase in this rural residential development has been one-third greater than the land area occupied by all of the urban areas in the nation with more than 1,000,000 population.

    Finally, if there is a serious threat to agriculture, it is from over-zealous regulation that has put farmers at risk. Water reductions in the San Joaquin Valley – mostly the result of environmental demands – likely have taken more land out of production than any sprawl-happy developer.

    Declining Human Footprint: An International Phenomenon

    The human footprint, as measured by the total urban and agricultural land has been declining for decades, both in the nation and California, where the greatest growth has occurred (Figure 1 & 2). The same is also true of Europe (EU-15), Canada and Australia, where all of the urbanization since the beginning of time does not equal the agricultural land recently taken out of production. Even in Japan, the human footprint has been reduced. It may be surprising, but human habitation and food production has returned considerable amounts of land to a more natural state in recent decades, while America’s urban areas were welcoming 99% of all growth since 1950.


    Note 1: This assumption represents the worst case, since not all land on which new urbanization was developed had previously been farmed.

    Note 2: State data is available only between 1960 and 2004.

    Photograph: Metropolitan Chicago, 2007 (Grundy County)

    Wendell Cox is a Visiting Professor, Conservatoire National des Arts et Metiers, Paris. He was born in Los Angeles and was appointed to three terms on the Los Angeles County Transportation Commission by Mayor Tom Bradley. He is the author of “War on the Dream: How Anti-Sprawl Policy Threatens the Quality of Life.

  • Arizona’s Short-Sighted Immigration Bill

    Arizona’s recent passage of what is widely perceived as a harsh anti-immigrant bill reflects a growing tendency–in both political parties–to focus on the here and now, as opposed to the future. The effort to largely target Latino illegal aliens during a sharp recession may well gain votes among an angry, alienated majority population, but it could have unforeseen negative consequences over time.

    In terms of the Arizona law, this is not simply a case of one wacko state. The most recent Gallup survey shows that more Americans favor the law than oppose it, with independents and Republicans showing strong support. Despite the negative coverage in the media, the Arizona gambit could somewhat pay off in November. A weak economy tends to exacerbate nativist sentiments, something that has been constant throughout much of American history.

    But there is a distinct danger for the GOP here, not only in Arizona but in the rest of the country as well. As Bill Frey of the Brookings Institute points out, there is a growing gap between the electorate, which is still largely white and older, and the much younger, far more rapidly growing Latino population. In Arizona Frey says the “cultural generation gap” between the ethnicity of seniors and children is some 40%, meaning that while 83% of senior are white, only 43% of children are. Nationwide, Frey estimates the gap in the ethnic composition of seniors and youths stands at a still sizable 25 points.

    Arizona’s large disequilibrium in the ethnicity of its generations is a product, in part, of the state’s historic pull to white retirees. Yet its formerly booming economy, based largely around construction and tourism, required a massive importation of largely Latino, low-wage labor, much of it illegal. As a result over the past two decades, Arizona’s Latino population has grown by 180%, turning what had been a 72% Anglo state to one that is merely 58% white.

    You don’t have to go very far–in fact just across the California border–to see what awaits Arizona’s nativist Republicans. The Grand Canyon state’s future has already emerged there. In the 1970s and 1980s California’s generally robust economy made it a primary destination for immigrants from both Asia and Latin America. Comfortable in their Anglo-ness, papers like the Arizona Republic were dismissing California as a “third world state,” particularly in the wake of the 1992 LA riots.

    Like their Arizona counterparts today, many white Californians then were sickened by pictures of mass Latino participation in looting during the riots. Many were also concerned with soaring costs of providing social services to a largely poor immigrant population. Sensing an opportunity, in 1994 Gov. Pete Wilson–locked in tough re-election battle amid a deep recession–endorsed Proposition 187, a measure designed to prevent illegal aliens from accessing public services. The measure passed easily, with support from both whites and African-Americans. The strong backing among Independents and even some Democrats helped Wilson win re-election with surprising ease.

    But the long-term consequences of 187 reveal the longer-term consequences for the GOP. During the Reagan era and even the first Wilson term, Latino voters split their votes fairly evenly between the parties. But after 1994 there was a distinct turn toward the Democrats, with the GOP share at the gubernatorial level falling from nearly half in 1990 to less than a third in subsequent election. In some cases, right-wing Republicans garnered even smaller portions of Latino voters.

    This is a classic case of the past waging war on the future. Since 1990 Latino and immigrant population has continued to grow. Overall, the percentage of foreign-born residents, according to USC demographer Dowell Myers, has grown from roughly 22% to 27%. One-third of Californians in 2000 were Latino; Myers projects Latinos will constitute almost 47% of the state’s population in 2030.

    The political consequences will only get worse for Republicans. Latino population voting power already has doubled from roughly 10% of the total in 1990 to 20% in 2006.

    This Latino population will become increasingly active and engaged. It is, for one thing, ever more English-fluent, and increasingly dominated by the second and third generations. This group could become permanently estranged, like African-Americans, from the GOP. If that happens, notes longtime Sacramento columnist Dan Weintraub, Republicans could “all but become a permanent minority party in California.”

    And the rest of the country will feel these trends; between 2000 and 2050, the vast majority of America ‘s net population growth will come from racial minorities, particularly Asians and Hispanics. Already one out of every five American children–tomorrow’s voters–is Hispanic.

    Of course, as Latinos integrate and intermarry, they may become less particular in their world view and share more in common with other middle-class Americans. Yet memories of slights against a particular group can overcome even economic self-interest. Blood often proves thicker than bank accounts. The tendency of Jews, a largely affluent and entrepreneurial tribe, to back often harshly anti-business Democrats has its roots in old world scars left from the pogroms in czarist Russia as well as the right-wing genocide in Nazi Germany. Some older voters recall the rabid anti-Semites once prominent in the American far-right as well as the more genteel exclusionism practiced by more refined upper-class Republicans.

    In the future, today’s images of shrill, anti-immigrant right-wing activists could resound for coming generations of Latinos as well as Asians and other newcomer groups. It could essentially deprive the Republican Party of voters who might otherwise consider the GOP option, handing the Democrats a permanently expanded base, not only in southwest but in much of the country.

    None of this is necessary or good for the country. Political competition for ethnic groups is a healthy thing for national interests and for the individual groups. Lock-step support by African-Americans may make them powerful within the Democratic Party, but it also means they can also be taken for granted when push comes to shove. And, of course, when they are in power, Republicans have little real political stake in confronting the serious issues facing black America.

    All this is particularly disturbing since competition for Latino voters should be intense. Heavily employed in construction and manufacturing industries, they have been badly hurt in the recession and their interests were not particularly addressed in the Obama stimulus plan. Many are also socially conservative, supporting, for example, California’s Proposition 8 ban on gay marriage.

    In coming months other proposed steps by the administration and its congressional allies, such as the proposed cap-and-trade legislation, could prove very tough on industries that tend to employ Latinos. Climate change-inspired moves against single-family homes–already in place in California–conflict directly with the aspirations of many Latinos as well as other immigrants who, unlike the usually affluent, homeowning white population, are still seeking the chance to buy their own home.

    But instead of fighting for their economic interests, the Arizona law has handed the Democrats a golden opportunity for to engage their own demagogy on race issues. Instead of having to defend their plans to restart the economy and reorient them to middle and working class needs, Democrats now can play to narrow racial concerns among Latinos while further bolstering the self-righteousness of their affluent, white, left-wing base.

    The reversion to racial politics prompted by the Arizona law ultimately does no good for anyone except “base-oriented” partisan campaign consultants, nativists and ethnic warlords. With all the long-term economic and social challenges that face this growing country, Phoenix’s folly marks an unfortunate step backward to our more shameful past and away from a potentially promising future.

    This article originally appeared in Forbes.com.

    Joel Kotkin is executive editor of NewGeography.com and is a distinguished presidential fellow in urban futures at Chapman University. He is author of The City: A Global History. His newest book is The Next Hundred Million: America in 2050, released in Febuary, 2010.

    Photo by Caleb Alvarado

  • Las Vegas: The World’s Convening City?

    Conventional wisdom, and in many cases wishful thinking, among many urbanists holds that America’s sunbelt cities are done. Yet in reality, as they rise from the current deep recession, their re-ascendance will shock some, but will testify to the remarkable resiliency of this emerging urban form.

    Origins: Bright Light City

    The epicenter of the sunbelt rebound will be Las Vegas. The desert city has taken a unique road to a world city status. Most places get there by being financial, trade or manufacturing hubs, or can have a concentration of all three in the case of the biggest and most connected world cities. In contrast Las Vegas has achieved world city status via one key sector: entertainment.

    Just about no one saw Las Vegas coming as a world city. Even in the late 20th century few would predict that the region could ever get to 1 million residents, let alone reach two million. In 1970 Jerome Pickard, a demographer working at the ULI—the Urban Land Institute in Washington, DC, projected U.S. metropolitan area populations to the year 2000. These estimates were nearly perfect, but for one major exception—he missed Las Vegas.

    Las Vegas at the time seemed like, to make a bad pun, a one trick town. Its main industry, gambling (or “gaming” in local parlance), was pretty much unique to Nevada. Sure, the city already had landmark hotels and the famous “Strip” was by then iconic enough to influence American architectural theory, but the idea of an overgrown honky-tonk town as a true world city seemed a stretch.

    A generation later, what changed? To start, gambling began to spread throughout the U.S. and indeed the world. First, Atlantic City, NJ, allowed gaming in the late 1970s and soon the floodgates opened. Soon people could gamble on riverboats in the Mississippi and off the Gulf Coast. Then a Supreme Court ruling allowed Native Americans to build and operate casinos—and they did just about everywhere.

    Every time gaming expanded, analysts predicted the demise of Las Vegas. Yet history has shown that the widespread diffusion of gambling only induced a bigger appetite. In this socio-cultural-legal-lifestyle transition, Las Vegas became the epicenter of gaming. Many people who gambled in a nearby Indian reservation were really just warming up for Las Vegas.

    The gaming industry in Las Vegas also matured in two key ways, offering a host of complimentary activities to go along with gambling. The first was the Las Vegas tie into Hollywood and live entertainment. By the 1980s, Las Vegas became one of the world’s largest venues for entertainment, surpassing even Broadway in New York. The city then began to add function after function related to tourism—food, shopping, and perhaps most importantly of all: conventions.

    Las Vegas’s rise also was directly tied to infrastructure. Completed in the 1930s, Hoover dam provided Las Vegas with ample power and water. The other major improvement was a new highway to Los Angeles, which led to Vegas’s discovery by Hollywood figures.

    At the same time, a series of complimentary economic drivers transformed the city over several decades. The casino and entertainment complex constructed in Las Vegas by 1970 soon engendered a proliferation of airline connections and convention business. The city had enough business to warrant non-stop links to just about every other major city in the U.S. The scale of tourism worked to keep landing fees among the lowest of any major American city. In 2008, McCarran Airport ranked 15th in the world for passenger traffic, with 44,074,707 passengers passing through the terminal, and 6th in airplane “movements,” which includes take offs and landings.

    The other advantage Las Vegas possesses is lots of hotel rooms. In fact, nine of the top ten largest hotels in the world can be found on the Las Vegas Strip (which technically lies outside the city proper in unincorporated Clark County, NV). The presence of so many hotel rooms facilitated the emergence of the nation’s largest convention business.

    The city is also a leading center of producer services specific to gaming. Las Vegas is to gaming what Houston is to energy, the command and control center in a booming global business. Like Houston, whose initial energy business growth came from nearby oil wells, Las Vegas’s initial advantage derived from being home to the first large-scale gaming industry. Many overlook the fact that the U.S. is a service exporting powerhouse, with almost a half trillion dollars in overseas sales last year. In fact the U.S. captures over 14 percent of total world service trade, which performed much better in the current recession than did goods trade. Las Vegas is now grabbing a bigger share of these exports.

    As gaming spread, Las Vegas firms that specialize in building and managing mega-resort and entertainment complexes often built, designed, or consulted on new gambling centers from Atlantic City in New Jersey to Macau in China (which recently passed Las Vegas in total gambling revenue). In the current recession, as gaming revenue plummeted in Las Vegas, properties in much of the rest of the world kept performing, especially China. This geographic diversification strengthened the bottom line for such Las Vegas-based companies as MGM-Mirage and Wynn and sustained the local firms that export gaming services.

    To consolidate its gaming and entertainment gains, Southern Nevada must still diversify its industrial mix to reach a multi-dimensional world city status as say Los Angeles. Fortunately Las Vegas has the capacity to further leverage its core industry. At the same time some other key sectors look promising, especially data storage and transmission, and alternative energy technology such as solar and geothermal.

    Finally, Las Vegas is working to improve its transportation links to nearby Southern California and the Sun Corridor complex of Phoenix and Tucson. These regions are increasingly integrated with one another. Las Vegas’s inclusion in the larger Southwestern U.S megaregion should further connect it to the global economy and lift its status as a world city in full.

    The Convening City

    Ultimately, the Las Vegas case for world city status lies in its role as the globe’s leading convening space. There are more face-to-face exchanges in Las Vegas during a major convention than key financial exchanges in New York or London. Las Vegas, on any given week, may comprise the world’s most expert cluster in a particular industry.

    The convening role that Las Vegas plays in the world economy comprises perhaps the biggest opportunity for additional diversification, especially given the way business is evolving in sectors such as business services. These gatherings provide a means of overcoming coordination and incentive problems in uncertain environments. It becomes an environment to create a critical “buzz” around a company, product or industry.

    Most Las Vegas conventions are really about deal making. Conventions also are used for industry education, vendor networking, competitor insights, networking with prospects, hosting an exhibit, and seeing customers. Another dimension to building trust in Las Vegas lies in the fact that it is very much an adult place. It is a wide open, non-moralizing, libertarian place where grownups get to have fun. Las Vegas is a place where you can, and maybe even should, mix business with pleasure.

    To move forward, Las Vegas needs to tweak its branding in a way that signals its dual personalities as a play hard and work hard city. This shift is already under way. The Las Vegas Convention and Visitors Authority now use the tagline “Only Vegas” and an omnibus identity for the city. Their website has two links: one aimed at business community: VegasMeansBusiness.com with the tagline: “Close the deal and make new opportunities.” and one for tourists: VisitLasVegas.com which uses the tagline: “What happens in Vegas, Stays in Vegas.”

    So far Las Vegas has not leveraged its role as convening place to create something on par with the New York Stock Exchange or the Chicago Board of Trade. However, the convention business can be used as the basis of what may become a permanent trade show.

    A harbinger of this future potential for Las Vegas can be seen in its new giant furniture mart, the World Market Center. This grew out of the city’s role in hosting the largest furniture/home wear convention every year. Las Vegas has developed a year round trade show capacity in furnishing with big annual events. This city is now poised to be a leading design center. Architectural and industrial design firms will follow. In this way, Las Vegas could emerge as the Milan of the U.S., where design leads to industrial spin offs.

    Las Vegas can expand this model to host permanent trade shows in a multiple fields from home entertainment and biotechnology to alternative energy. Rather than become a new ghost town, as some urbanists imagine, the city in fact has a bright future, one that will continue to befuddle its many critics while enriching the opportunities of its citizens.

    Robert E. Lang, Ph.D. is one of America’s most respect urban analysts. He is director of both Brooking Mountain West and the Lincy Institute and is a professor of Sociology at the University of Nevada, Las Vegas.

    Photo: by Roadsidepictures

  • SPECIAL REPORT: Metropolitan Area Migration Mirrors Housing Affordability

    On schedule, the annual ritual occurred last week in which the Census Bureau releases population and migration estimates and the press announces that people are no longer moving to the Sun Belt. The coverage by The Wall Street Journal was typical of the media bias, with a headline “Sun Belt Loses its Shine.” In fact, the story is more complicated – and more revealing about future trends.

    Domestic Migration Tracks Housing Affordability: There have been changes in domestic migration (people moving from one part of the country to another) trends in the last few years, but the principal association is with housing affordability.

    Severe and Not-Severe Bubble Markets: Overall, the major metropolitan markets with severe housing bubbles (a Median Multiple rising to at least 4.5, see note) lost nearly 3.2 million domestic migrants (all of these markets have restrictive land use regulation, such as smart growth or growth management) from 2000 to 2009. However, not all markets with severe housing bubbles lost domestic migrants. “Safety valve” bubble markets drew migration from the extreme bubble markets of coastal California, Miami and the Northeast. These “safety valve” markets (including Phoenix, Las Vegas, Portland, Seattle, Riverside-San Bernardino, Orlando, Tucson and Tampa-St. Petersburg), gained a net 2.2 million from 2000 to 2009, while the other bubble markets lost 5.3 million domestic migrants from 2000 to 2009 (See Table below, metropolitan area details in Demographia US Metropolitan Areas Table 8). At the same time, the markets that did not experience a severe housing bubble (those in which the Median Multiple did not reach 4.5) gained a net 1.5 million domestic migrants.

    The burst of the housing bubble explains the changes in domestic migration trends. Housing affordability has improved markedly in the extreme bubble markets, so that there was less incentive to move. Then there was the housing bust-induced Great Recession, which also slowed migration since people had more trouble selling their homes or finding anew job. As a result, the migration to the “safety valve” markets and to the smaller markets dropped substantially.

    • During 2009, the “safety valve” markets gained only 51,000 net domestic migrants, one-fifth of the annual average from 2000 to 2008.
    • At the same time, the other severe housing bubble markets lost 236,000 domestic migrants in 2009, compared to the average loss of 638,000 from 2000 to 2008.
    • Areas outside the major metropolitan areas also experienced a significant drop in domestic migration, dropping from an annual average of 203,000 between 2000 and 2008 to 23,000 in 2009.
    • The major metropolitan markets that did not experience a severe housing bubble gained 161,000 domestic migrants in 2009, little changed from the 169,000 average from 2000 to 2008. These markets are concentrated in the South and Midwest. Indianapolis, Kansas City, Nashville, Louisville and Columbus as well as the Texas metropolitan areas continued their positive migration trends.
    Domestic Migration by Severity of the Housing Bubble
    Metropolitan Areas over 1,000,000 Population
    2000-2008
    Metropolitan Areas 2000-2009 2009 2000-2008 Average
    Withouth Severe Housing Bubbles     1,509,870         160,514      168,670
    With Severe Housing Bubbles    (3,161,514)        (184,486)     (372,129)
       Not "Safety Valve" Markets    (5,347,211)        (235,838)     (638,922)
       "Safety Valve" Markets     2,185,697           51,352      266,793
    Outside Largest Metropolitan Areas     1,651,644           23,972      203,459
    Severe housing bubbles: Housing costs rose to a Median Multiple of 4.5 or more (50% above the historic norm of 3.0). 
    Median Multiple: Median House Price/Median Household Income
    "Safety Valve" refers to markets with severe housing bubbles that received substantial migration from more expensive markets (coastal California, Miami and the Northeast). These markets include Las Vegas, Phoenix, Riverside-San Bernardino, Sacramento, Portland, Seattle, Orlando, Tucson and Tampa-St. Petersburg.

    Moreover, the Census Bureau revised its previous domestic migration figures for 2000 to 2008 to add more than 110,000 from the markets without severe housing bubbles, while taking away more than 150,000 domestic migrants from the markets with severe housing bubbles. This adjustment alone rivals the 2009 domestic migration loss of 183,000 in these markets

    Population Growth: The Top 10 Metropolitan Areas: Sun Belt metropolitan areas continued to experience the greatest population growth. Between 2000 and 2009, the fastest growing metropolitan areas were Atlanta, Dallas-Fort Worth and Houston, In 2009, Washington, DC was added to the list (Details in Demographia US Metropolitan Areas, Table 2).

    New York: The New York metropolitan area remains the nation’s largest, now reaching a population of over 19 million. More than 700,000 new residents have been added since 2000. However, New York’s population growth has been the second slowest of the 10 largest metropolitan areas since 2000 (Figure 1). Moreover, New York’s net domestic out-migration has been huge. New York has lost 1,960,000 domestic migrants, which is more people than live in the boroughs of The Bronx and Richmond combined. Overall, 10.7% of the New York metropolitan area’s 2000 population left the metropolitan area between 2000 and 2009. More than 1,200,000 of this domestic migration was from the city of New York. Between 2008 and 2009, New York’s net domestic out-migration slowed from the minus 1.32% 2000-2008 annual rate to minus 0.58%., reflecting the smaller migration figures that have been typical of the Great Recession.

    Los Angeles: For decades, Los Angeles has been one of the world’s fastest growing metropolitan areas. Growth had ebbed somewhat by the 1990s, when Los Angeles added 1.1 million people. The California Department of Finance had projected that Los Angeles would add another 1.35 million people between 2000 and 2010. Yet, the Los Angeles growth rate fell drastically. From 2000 to 2009, Los Angeles added barely one-third the projected amount (476,000) and grew only 3.8%. Unbelievably, fast growing Los Angeles became the slowest growing metropolitan area among the 10 largest. In 2009, Los Angeles had 12.9 million people. Los Angeles lost 1.365 million domestic migrants, which is of 11.0% of its 2000 population, and the most severe outmigration among the top 10 metropolitan areas (Figure 2).

    Chicago: Chicago continues to be the nation’s third largest metropolitan area, at 9.6 million population, a position it has held since being displaced by Los Angeles in 1960. Chicago has experienced decades of slow growth and continues to grow less than the national average, at 5.1% between 2000 and 2009 (the national average was 8.8%). Yet, Chicago grew faster than both New York and Los Angeles. Chicago also lost a large number of domestic migrants (561,000), though at a much lower rate than New York and Chicago (6.2%). Even so, Chicago is growing fast enough that it could exceed 10 million population in little more than a decade, by the 2020 census.

    Dallas-Fort Worth: Dallas-Fort Worth has emerged as the nation’s fourth largest metropolitan area, at 6.4 million, having added 1,250,000 since 2000. In 2000, Dallas-Fort Worth ranked fifth, with 500,000 fewer people than Philadelphia, which it now leads by nearly 500,000. Dallas-Fort Worth added more population than any metropolitan area in the nation between 2008 and 2009 and has been the fastest growing of the 10 top metropolitan areas since 2006. As a result, Dallas-Fort Worth has replaced Atlanta as the high-income world’s fastest growing metropolitan area with more than 5,000,000 population. Dallas-Fort Worth added a net 317,000 domestic migrants between 2000 and 2009.

    Philadelphia: Philadelphia is the nation’s fifth largest metropolitan area, at just below 6,000,000 population. Like Chicago, Philadelphia has had decades of slow growth, yet has grown faster in this decade than both New York and Los Angeles (4.8%). Philadelphia has lost a net 115,000 domestic migrants since 2000, for a loss rate of 2.2%, well below that of New York, Los Angeles and Chicago.

    Houston: Houston ranks sixth, with 5.9 million people and is giving Dallas-Fort Worth a “run for its money.” Like Dallas-Fort Worth, Houston has added more than 1,000,000 people since 2000. Over the same period, Houston has passed Miami and Washington (DC) in population. Houston has added a net 244,000 domestic migrants since 2000, and added 50,000 in 2008-2009, the largest number in the country. Like Dallas-Fort Worth, Houston accelerated its annual domestic migration growth rate in 2008-2009. At the current growth rate, Houston seems likely to pass Philadelphia in population shortly after the 2010 census.

    Miami: Miami (stretching from Miami through Fort Lauderdale to West Palm Beach) is the seventh largest metropolitan area, with 5.6 million people. Miami has added more than 500,000 people, for a growth rate of 10.4%. However, Miami has suffered substantial domestic migration losses, at 287,000, a loss rate of, 5.7% relative to its 2000 population.

    Washington (DC): Washington recaptured 8th place, moving ahead of Atlanta, which had temporarily replaced it. Washington’s population is 5.5 million and added 655,000 between 2000 and 2009, for a growth rate of 13.6%. However, Washington lost a net 110,000 domestic migrants, 2.2% of its 2000 population. That trend was reversed in 2008-2009, when a net 18,000 domestic migrants moved to Washington, perhaps reflecting the increased concentration of economic power in the nation’s capital.

    Atlanta: Atlanta is the real surprise this year. For more than 30 years, Atlanta has had strong growth, however, this year it slowed. Atlanta is the 9th largest metropolitan area in the nation, at 5.5 million. Since 2000, Atlanta has added 1.2 million people, though added only 90,000 last year. Atlanta has added a net 429,000 domestic migrants since 2000, though the rate slowed to only 17,000 in 2008-2009.

    Boston: Boston is the nation’s 10th largest metropolitan area, with 4.6 million people. During the 2000s, Boston has added nearly 200,000, growing by 4.2%. Yet, Boston has also experienced a net domestic migration loss of 236,000, or 5.4% of its 2000 population. In 2008-2009, Boston, like Washington, reversed its domestic migration losses, adding 7,000.

    Trends by Size of Metropolitan Area: As throughout the decade, the slowest growing areas of the nation have been metropolitan areas over 10,000,000 population (New York and Los Angeles), which grew 3.9% and non-metropolitan areas, which grew 2.6% during the decade Metropolitan areas that had between 2.5 and 5.0 million population in 2000 boasted the biggest jump (these include fast growing Houston and Atlanta, which are now more than 5 million), at 13.4% for the decade. All of the other size classifications grew between 8.9% and 11.3% over the decade (see Demographia US Metropolitan Areas, Table 1). Metropolitan areas that began the decade with between 5,000,000 and 10,000,000 population gained 10.0%. Those with 250,000 to 500,000 grew 10.4%, those with 500,000 to 1,000,000 grew 10.2% and the smallest metropolitan areas, those from 50,000 to 250,000 grew 8.9%

    Metropolitan areas over 1,000,000 population lost 2.19 million domestic migrants during the decade, but smaller metropolitan areas added 2.24 million domestic migrants. Non-metropolitan areas lost 50,000 domestic migrants. In 2009, the smaller metropolitan areas gained 125,000 domestic migrants, while the larger metropolitan areas lost 30,000. Non-metropolitan areas lost more than 90,000 domestic migrants. As noted above, these smaller figures for 2009 reflect the more stable housing market and the extent to which the Great Recession has reduced geographic mobility (See Demographia US Metropolitan Areas, Tables 1 and 3).


    Note: The Median Multiple is the median house price divided by the median household income. The historic standard has been 3.0.

    Photograph: Dallas

    Wendell Cox is a Visiting Professor, Conservatoire National des Arts et Metiers, Paris. He was born in Los Angeles and was appointed to three terms on the Los Angeles County Transportation Commission by Mayor Tom Bradley. He is the author of “War on the Dream: How Anti-Sprawl Policy Threatens the Quality of Life.

  • What is the Answer to the Suburban Question?

    We have recently assembled a special issue of the journal Cities with the title “The Suburban Question”, and we assume that many readers will assume the answer is “who cares”? The term ‘sub-urbs’ connotes a lesser form of urban life, and for decades it has been used dismissively to denote anything plastic, even hypocritical. Novelist Anthony Powell described one of his unsympathetic characters possessing a ‘‘face like Hampstead Garden Suburb”; the New York Times recently described architect Robert Stern as ‘‘a suede-loafered sultan of suburban retrotecture”. In the old days, record stores had ‘urban’ bins full of gangsta, but nothing marked ‘suburban’, although it is always easy to use the suburbs as a backdrop for duplicity, as in American Beauty, or the first series of Weeds (set in a gated community, a double score!).

    There has been some academic attention—Dick Walker, David Harvey, and of course Kenneth Jackson all wrote lasting pieces about the suburbs. But in these, they always appear as objects of inquiry, rather than subjects in their own right; and if academics live amongst the ‘little boxes of tickytacky’, they rarely write about them. This is more than unfortunate, for many reasons—the most obvious is that by most definitions, most of us are indeed suburbanites. But while there are endless dissertations on public housing, the decline of the inner city, and the much discussed revitalization of the inner city, there is precious little on their further-flung counterparts.

    It’s hardly the case, to answer the unspoken question, that there is nothing interesting to research ‘out there’. What about updating research on the ‘growth machine’? No one has really done any detailed work on the complexities of the home building industry, with its rigid design aspirations and complex financial connections. There is the gated community, which is still portrayed as ‘Fortress America’ even though there are significant proportions of Hispanic households living in gated communities, and many of these are rental properties and not the upscale compounds portrayed in textbooks. And there is the Home Owner Association. Despite the fact that millions of Americans live in them, relatively little research has been done on this important aspect of governance since the term ‘Privatopia’ was coined nearly two decades ago.

    A few authors have tried to push back against this indifference, arguing that suburbs appear to be ‘good places for most people’. Yet the reality that affordable homes-and-gardens are unquestionably popular does not seem to matter. In almost any manner imaginable, the suburban lifestyle has been savaged. Sprawl causes obesity; it destroys downtowns; it causes global warming. In Metroburbia, Paul Knox argues that the suburbs have turned us into monsters of capitalist consumerism, the sagging SUVs necessary to carry the wobbling masses from mall to McMansion.

    It is easy to argue that American suburbs are unsustainable, but to echo Peter Marcuse’s famous rhetorical question—‘sustainable for whom?’ Vibrant cities—New York, San Francisco, Boston—are expensive cities, and while that fabled creature, the Creative Worker (homo Floridian) is willing and, more importantly, able to pay large sums to live in very small spaces, most of us are not. Suburbs have attracted paying customers precisely because housing costs are low and conditions are attractive. Not many cool public spaces, but that’s less important to most people past their college years.

    This is the backdrop to the papers that we have collected in our special issue. Its aim is to present work that asks ‘what is happening in the suburbs, in terms of the built form, the economy and social relations’. They are not necessarily written ‘in defense of suburbs,’ but engage suburbs as if they matter. Nick Phelps leads off by emphasizing the contribution that suburbs make to our local and national economies. He reminds us of the transfers there of jobs and the growing importance of suburbs to the urban region and the economic health of our nations. He closes with an urgent reminder that the “economic centrality of suburbs within the contemporary economy should, perhaps more than anything else, signal the need for a re-balancing of urban studies to be more fully suburban in academic and policy focus.”

    A perfect example of this appears in a study of Phoenix by Carol Atkinson Palombo and Pat Gober. Their analysis of new housing construction in the prior two decades indicates trends that span different types of multi-family housing in suburban locations. They note, “densification no longer equates to urban infill but takes many forms and occurs all over the metropolitan region”. A complementary article by Roger Keil and Douglas Young focuses on their empirical work in Toronto, and especially what they have termed ‘the in-between city’. These places are “not quite traditional city and not quite traditional suburban”, forgotten geographies where many live and where their infrastructure reminds us that the placing of ‘urban versus suburban’ neglects the many shades of in-between urban places that require planning and policy attention.

    Toronto is the focus of another paper, in which Susan Moore explores the tenets of New Urbanism. In four case studies, she explores sub/urban forms, showing that the general edicts of the “densification-is-good” movement are contextualized in different settings, and reveals endless rounds of compromises between developers, planners, politicians and residents. In the end, this design imperative is unable to transcend the “urbanization of the suburbs or the suburbanization of the urban,” and once more we are challenged by the need to confront the assumed distinction between urban and suburban developments, or even cities and suburbs themselves.

    This theme is given additional attention in a further paper, by noted Turkish urbanist Feyzan Erkip, whose work explores, and contrasts, the new manifestations of Westernization in Ankara—malls and gated communities—with more traditional neighborhoods. She finds little difference between the views of the populations in the old and new, but the meanings that these new design features take on are very much conditioned by their context. For instance, the malls have a liberating veneer for Turkish women, who feel socially threatened in the streets but not in the private shopping districts. Conversely, gated communities adopt familiar design features but unlike their Western counterparts, these are essentially up-scale squatter settlements; this indeterminate legal status is attractive for some residents because it makes their homes less open to search by law enforcement or tax officials.

    We conclude our collection, and this piece, with a simple response: the answer to the suburban question is that they possess a rich history and a dynamic present and therefore demand more attention and a serious research agenda. We call for more academic attention to be given to places where a majority of Americans, many Europeans, and a growing number of Asians, Africans, and Latin Americans live. Urban studies should either become inclusive of all parts of the city—from edge to center—or the field of Suburban Studies, spearheaded by the New Suburbanism, is long overdue.

    Andrew Kirby is the editor of the interdisciplinary Elsevier journal “Cities.”This is his 20th year as a resident of Arizona. Ali Modarres is an urban geographer in Los Angeles and co-author of City and Environment.

    Photo: urbanfeel @ flickr

  • Phoenix, Put Aside Dreams of Gotham

    Now that Phoenix’s ascendancy has been at least momentarily suspended, its residents are no doubt wondering what comes next. One tendency is to say the city needs to grow up and become more like East Coast cities or Portland, Ore., with dense urban cores and well-developed rail transit. The other ready option is always inertia – a tendency to wait for things to come back the way they were.

    Neither approach will work in the long run. Over the coming decade, Phoenix has to recalibrate its economy into something based on more than being a second option for Californians and speculative real-estate investment. Instead, it needs to focus laserlike on economic diversity and creating good jobs.

    The model here for Phoenix is not New York or San Francisco. Phoenix can’t rival these cities for their 19th-century charm or early 20th-century infrastructure. As we would say back in New York (my hometown): fuggedaboutit.

    Instead of dreaming about Gotham, Phoenix should think more about Houston. Like the Texas megacity, Phoenix is the ultimate late 20th-century town, dependent on air-conditioning, ample freeway space and a wide-open business culture.

    A century away from becoming “quaint,” Phoenix needs to follow Houston’s example of relentless economic diversification: in Phoenix’s case, away from dependence on tourism and construction. Houston has done this by focusing beyond its core energy sector to fields like international trade, manufacturing and medical services.

    Phoenix’s opportunities may lie elsewhere but may include some of these same industries. The idea is that the region needs to heal its job problem. Only then can the real-estate market rebound on a solid basis.

    This employment focus must replace the current obsession with changing the city’s urban form. Despite the current problems, Phoenix has performed pretty well over the past decade, creating more new jobs than most Sun Belt cities, not to mention job losers like San Francisco, Chicago, Los Angeles and New York. Equally important, it still leads the nation over the past decade in net in-migration among the largest cities

    Unfortunately, some in Phoenix still suffer horribly from Manhattan envy. One prominent Phoenix consultant describes the downtown as “the glorious goose that’s laying the gilded egg” that will turn the city into a dynamic trend-setter of a new urban paradigm. Phoenix, he opined, “won’t be a place of renown till it has the Big It.” In other words, Phoenix will not be a true metropolis until it has its own Times Square, Eiffel Tower, Space Needle or other grand attraction.

    Yet in newer cities like Phoenix, the quest for the “Big It” is often delusional. In Phoenix, the vast majority of the population moved in decades after the original downtown lost its primacy. People have their own notion of what “it” is, and many times, “it” could be in a different center or in more than one center – think Scottsdale, Tempe, Mesa, the Camelback Corridor, or a host of other communities.

    The Valley’s $1.4 billion transit system carries barely 15,000 round trips daily – a microscopic proportion of the region’s trips – with the biggest traffic on weekends. Sounds more like Disneyland than New York.

    Nor does the high-end condo, art-museum, convention-center thing seem to be working so well. Too bad the extra $1.5 billion spent sprucing up the area could not have been spent more usefully for less critical things, like police and fire, or better roads and schools.

    Rather than focus on emulating the urban father figures from the past, Phoenix’s best bet lies with its best assets: being reasonably priced, professionally managed and, well, warm and lovely in December. Shedding its real-estate-obsessed cocoon, Phoenix should focus on creating jobs for both present and future residents. That’s how you can grow up and find your own way.

    This article first appeared at The Arizona Republic.

    Joel Kotkin is executive editor of NewGeography.com and is a distinguished presidential fellow in urban futures at Chapman University. He is author of The City: A Global History. His next book, The Next Hundred Million: America in 2050, will be published by Penguin Press February 4th.

    Photo: robotography

  • Numbers Don’t Support Migration Exodus to “Cool Cities”

    For the past decade a large coterie of pundits, prognosticators and their media camp followers have insisted that growth in America would be concentrated in places hip and cool, largely the bluish regions of the country.

    Since the onset of the recession, which has hit many once-thriving Sun Belt hot spots, this chorus has grown bolder. The Wall Street Journal, for example, recently identified the “Next Youth-Magnet Cities” as drawn from the old “hip and cool” collection of yore: Seattle, Portland, Washington, New York and Austin, Texas.

    It’s not just the young who will flock to the blue meccas, but money and business as well, according to the narrative. The future, the Atlantic assured its readers, did not belong to the rubes in the suburbs or Sun Belt, but to high-density, high-end places like New York, San Francisco and Boston.

    This narrative, which has not changed much over the past decade, is misleading and largely misstated. Net migration, both before and after the Great Recession, according to analysis by the Praxis Strategy Group, has continued to be strongest to the predominately red states of the South and Intermountain West.

    This seems true even for those seeking high-end jobs. Between 2006 and 2008, the metropolitan areas that enjoyed the fastest percentage shift toward educated and professional workers and industries included nominally “unhip” places like Indianapolis, Charlotte, N.C., Memphis, Tenn., Salt Lake City, Jacksonville, Fla., Tampa, Fla., and Kansas City, Mo.

    The overall migration numbers are even more revealing. As was the case for much of the past decade, the biggest gainers continue to include cities such as San Antonio, Dallas and Houston. Rather than being oases for migrants, some oft-cited magnets such as New York, Boston, Los Angeles and Chicago have all suffered considerable loss of population to other regions over the past year.

    Much the same pattern emerges when you look at longer-term state demographic patterns. A recent survey by the Empire Center for New York State Policy found that the biggest net losers in terms of per capita outmigration between 2000 and 2008 were, with the exception of Louisiana, all blue state bastions. New York residents lead in terms of rate of exodus, closely followed by the District of Columbia, Michigan, Pennsylvania, Massachusetts and California.

    An even greater shock to the sensibilities of the insular, Manhattan-centric media, the report found that most of the movement from the Empire State was not from the much-dissed suburbia, but from that hip and cool paragon, New York City. This can not be ascribed as a loss of the unwanted: According to the report, those leaving the city had 13% higher incomes than those coming in.

    How can this be, when everyone who’s smart and hip is headed to the Big Apple? This question was addressed in a report by the center-left, New York-based Center for an Urban Future. True, considerable numbers of young, educated people come to New York, but it turns out that many of them leave for the suburbs or other states as they reach their peak earning years.

    Indeed, it’s astonishing given the many clear improvements in New York that more residents left the five boroughs for other locales in 2006, the peak of the last boom, than in 1993, when the city was in demonstrably worse shape. In 2006, the city had a net loss of 153,828 residents through domestic out-migration, compared to a decline of 141,047 in 1993, with every borough except Brooklyn experiencing a higher number of out-migrants in 2006.

    Of course, blue state boosters can point out that the exodus has slowed with the recession, as opportunities have dried up elsewhere. True, the flood of migration has slowed across the nation. Yet it has only slowed, not dried up. When the economy revives, it’s likely to start flowing heavily again.

    More important, the key group leaving New York and other so-called “youth-magnets” comprises the middle class, particularly families, critical to any long-term urban revival. This year’s Census shows that the number of single households in New York has reached record levels; in Manhattan, more than half of all households are singles. And the Urban Future report’s analysis found that even well-heeled Manhattanites with children tend to leave once they reach the age of 5 or above.

    The key factor here may well be economic opportunity. Virtually all the supposedly top-ranked cities cited in this media narrative have suffered below-average job growth throughout the decade. Some, like Portland and New York, have added almost no new jobs; others like San Francisco, Boston and Chicago have actually lost positions over the past decade.

    In contrast, even after the current doldrums, San Antonio, Orlando, Houston, Dallas and Phoenix all boast at least 5% more jobs now than a decade ago. Among the large-narrative magnet regions only one–government-bloated greater Washington–has enjoyed strong employment growth.

    The impact of job growth on the middle class has been profound. New York City, for example, has the smallest share of middle-income families in the nation, according to a recent Brookings Institution study; its proportion of middle-income neighborhoods was smaller than that of any metropolitan area except Los Angeles.The same pattern has also emerged in what has become widely touted as America’s “model city”–President Obama’s adopted hometown of Chicago.

    The likely reasons behind these troubling trends are things rarely discussed in “the narrative”–concerns like high costs, taxes and regulations making it tough on industries that employ the middle class. One clear culprit: out of control state spending. State spending in New York is second per capita in the nation (anomalous Alaska is first); California stands fourth and New Jersey seventh. Illinois is down the list but coming up fast. Over the past decade, while its population grew by only 7%, Illinois’ spending grew by an inflation-adjusted 39%.

    The problem here is more than just too-large government; it lies in how states spend their money. Massive public spending increases over the past decade in California, New Jersey, Illinois and New York have gone overwhelmingly into the pockets and pensions of public employees. It certainly has not flowed into such basic infrastructure as roads, bridges and ports that are needed to keep key industries competitive.

    The American Association of State Highway Transportation, for example, ranked New York 43rd in the country and New Jersey dead last in terms of quality of roads. Some 46% of the Garden State’s roads were rated in poor condition, compared with the national average of 13%, even as the state’s spending reached new highs. The typical New Jersey driver spends almost $600 a year in auto repairs necessitated by the poor conditions of the roads.

    In contrast, states in the South and parts of the Plains tend to pour their public resources into productive uses. Cities like Mobile, Ala., Houston, Charleston, S.C., and Savannah, Ga., have been investing in port facilities to take advantage of the planned widening of the Panama Canal. The primary goal is to take business away from the increasingly expensive, overregulated and under-invested ports of the Northeast and West Coast. Similarly, places like Kansas City and the Dakotas are looking to boost their basic rail and road networks to support export-heavy industries.

    Even in the face of the Obama administration’s strongly urban-centric, blue state-oriented economic policy, these generally less than hip places appear poised to grow as the economy recovers. Virtually all the top 10 economies that have withstood the recession come from outside the “youth-magnet” field: San Antonio; Oklahoma City; Little Rock, Ark.; Dallas, Baton Rouge, La.; Tulsa, Okla., Omaha, Neb.; Houston and El Paso, Texas. The one exception to this rule, Austin, also benefits from being located in solvent, generally low-tax Texas.

    This continued erosion of jobs and the middle class from the blue states and cities is not inevitable. Many of these places enjoy enormous assets in terms of universities, strategic location, concentrations of talented workers and entrenched high-wage industries. But short of a massive and continuing bailout from Washington, the only way to reverse their decline will be a thorough reformation of their governmental structure and policies. No narrative, no matter how well spun, can make up for that reality.

    This article originally appeared at Forbes.com.

    Joel Kotkin is executive editor of NewGeography.com and is a distinguished presidential fellow in urban futures at Chapman University. He is author of The City: A Global History. His next book, The Next Hundred Million: America in 2050, will be published by Penguin Press early next year.

  • Tracking Business Services: Best And Worst Cities For High-Paying Jobs

    Media coverage of America’s best jobs usually focuses on blue-collar sectors, like manufacturing, or elite ones, such as finance or technology. But if you’re seeking high-wage employment, your best bet lies in the massive “business and professional services” sector.

    This unsung division of the economy is basically a mirror of any and all productive industry. It includes everything from human resources and administration to technical and scientific positions, as well as accounting, legal and architectural firms.

    Overall there are roughly 17 million professional and business services jobs, 4 million more than manufacturing. This makes it twice as big as the finance sector and five times the size of the much-ballyhooed tech sector. While its average salary – roughly $55,000 a year – is somewhat lower than in those other elite sectors, its wages are still higher than those in all the other large sectors, like health. The sector’s $1 trillion in total pay per year accounts for nearly 20% of all wages paid in the nation; finance and tech together only account for $812 billion.

    More than that, the business and professional services sector has encompassed the fastest-growing part of the high-wage economy. Employment in lower-wage sectors like education has also grown quickly. But employment in other sectors that pay their employees well, such as technology, has remained stagnant; jobs in some, such as manufacturing, have fallen sharply. Critically, the business services sector – particularly at the better-paying end – seems to have weathered the current recession better than these other high-wage sectors.

    The crucial question remains: In what regions is this critical economic cog booming? In a new analysis with my colleagues at the Praxis Strategy Group, we examined Bureau of Labor Statistics employment data for this sector, keeping an eye on trends over both the last year and the last decade. Some of the metropolitan areas that boasted short-term growth in this sector also maintained steady employment success over the long-term, which suggests that these particular cities have sturdy economies that aren’t as prone to intense boom-bust cycles.

    At the top of our list of best places is greater Washington, D.C., and its surrounding suburbs in Virginia and Maryland. Government jobs may drive that economy, but it is the lawyers, consultants and technical services firms who harvest the richest benefits. As New York University public policy professor Mitchell Moss observes, Washington has emerged as the “real winner” in the recession – not just for public-sector workers but private-sector ones too.

    Fastest Growing Professional and Business Services Sectors
    Area Name Jobs in Sector 2009
    (thousands)
    Sector Share of Jobs 2009
    (percent of total)
    Growth 2008 – 2009
    (percent growth)
    Cumulative Growth 2001 – 2009
    (percent growth)
    2001-2009 Job Change (thousands) 2008-2009 Job Change (thousands)
    Northern Virginia, VA 355.2 27.2% 1.5% 22.4% 65.0 5.2
    Washington-Arlington-Alexandria, DC-VA-MD-WV 558.7 23.0% 0.9% 22.8% 103.6 5.1
    Austin-Round Rock, TX 112.4 14.4% 3.3% 18.7% 17.7 3.6
    Houston-Sugar Land-Baytown, TX 382.3 14.7% 0.9% 19.2% 61.5 3.2
    Virginia Beach-Norfolk-Newport News, VA-NC 106.6 14.0% 2.8% 8.0% 7.9 2.9
    Bethesda-Frederick-Rockville, MD 125.7 21.9% 2.1% 9.0% 10.4 2.6
    Wichita, KS 31.5 10.1% 3.5% 16.4% 4.4 1.1
    Chattanooga, TN-GA 25.9 10.6% 4.3% 11.8% 2.7 1.1
    Peoria, IL 23.0 12.1% 4.5% 43.2% 6.9 1.0
    Rochester, NY 61.8 11.9% 1.5% 1.9% 1.1 0.9
    Augusta-Richmond County, GA-SC 31.0 14.5% 3.0% 7.5% 2.2 0.9
    Mansfield, OH 5.1 9.1% 19.4% 4.1% 0.2 0.8
    Kennewick-Pasco-Richland, WA 20.8 22.2% 4.2% 20.2% 3.5 0.8
    St. Louis, MO-IL 195.4 14.6% 0.4% 3.9% 7.4 0.8
    Fayetteville-Springdale-Rogers, AR-MO 33.5 16.2% 2.2% 34.2% 8.5 0.7
    Macon, GA 12.1 11.9% 5.5% 31.2% 2.9 0.6
    Pittsburgh, PA 158.9 13.9% 0.4% 14.5% 20.1 0.6
    Fresno, CA 30.7 10.3% 1.9% 23.3% 5.8 0.6
    Provo-Orem, UT 23.3 12.4% 2.5% 16.7% 3.3 0.6
    Charleston-North Charleston-Summerville, SC 42.2 14.3% 1.3% 31.1% 10.0 0.5

    Over the past year, parts of northern Virginia – ground zero for the so-called “beltway bandits” who work in industries the government depends on to do its job – have enjoyed the fastest growth in business and professional services, adding over 5,200 jobs despite the current downturn.

    Other areas around the nation’s capital have also seen strong growth. The Washington D.C.-Arlington-Alexandria area, for example, came in second on our list, gaining nearly 5,100 positions, while No. 6 the Bethesda-Frederick-Rockville, Md., metro area added 2,600. In addition, yet another Virginia area – No. 5-ranked Virginia Beach-Norfolk-Newport News, a center for military-related industries – gained nearly 2,900 jobs in this sector.

    It’s far too early to thank the free-spending ways of Barack Obama’s administration for all this growth. As anyone can tell you, the Bush White House and its Republican Congress were not exactly models of fiscal restraint. Plus, Washington and Northern Virginia have seen growth in their business services sectors over the last several years, in the period stretching from 2001 to 2009. Together those two metros added over 165,000 new jobs in this critical, high-wage sector.

    Of course, you don’t have to head to Washington to find a high-paying job – although you might not be able to escape unpleasant summer weather. The other major group of business-services hot spots includes Austin, Texas, at No. 3, and Houston, at No. 4. These Lone Star local economies have continued to thrive not only during the current recession but also over the last decade.

    The others winners include farther-afield locales in Kansas, Tennessee, Illinois and New York. These areas could be gaining both from companies seeking to lower costs and from the new capabilities for remote work due to the Internet. Even though they didn’t make our list, a host of smaller communities – like Mansfield, Ohio; Provo, Utah; and Charleston, S.C. – also enjoyed significant growth in the business services sector over the past year.

    So if these are the places where this segment of the economy is growing and high-paying jobs are easier to come by, where is the opposite true? The worst cities on our list span three archetypes: Rust Belt basket cases, Sunbelt flame-outs and expensive big cities. Perhaps the toughest losses were in Michigan: Detroit and the Warren-Troy metro area suffered big setbacks both in the last year and over the last decade.

    Fastest Declining Professional and Business Services Sectors
    Area Name Jobs in Sector 2009
    (thousands)
    Sector Share of Jobs 2009
    (percent of total)
    Growth 2008 – 2009
    (percent growth)
    Cumulative Growth 2001 – 2009
    (percent growth)
    2001-2009 Job Change (thousands) 2008-2009 Job Change (thousands)
    Phoenix-Mesa-Scottsdale, AZ 289.2 16.0% -10.8% 7.9% 21.2 -35.1
    Warren-Troy-Farmington Hills, MI 202.5 18.5% -12.0% -21.2% -54.4 -27.7
    Chicago-Naperville-Joliet, IL 633.6 16.8% -4.1% -2.9% -19.0 -27.0
    Los Angeles-Long Beach-Glendale, CA 574.7 14.3% -4.2% -3.4% -20.4 -25.2
    Atlanta-Sandy Springs-Marietta, GA 390.3 16.4% -5.9% -1.3% -5.1 -24.4
    Orlando-Kissimmee, FL 170.9 16.2% -8.5% 7.7% 12.3 -16.0
    Santa Ana-Anaheim-Irvine, CA 261.9 18.0% -4.7% 4.0% 10.2 -12.8
    Minneapolis-St. Paul-Bloomington, MN-WI 253.4 14.4% -4.6% -4.6% -12.2 -12.3
    Edison-New Brunswick, NJ 164.5 16.3% -6.7% -2.6% -4.4 -11.9
    Detroit-Livonia-Dearborn, MI 108.9 14.7% -9.5% -20.9% -28.8 -11.4
    Indianapolis-Carmel, IN 120.3 13.4% -8.3% 13.6% 14.4 -10.8
    Riverside-San Bernardino-Ontario, CA 133.7 11.2% -6.5% 36.0% 35.4 -9.2
    Tampa-St. Petersburg-Clearwater, FL 223.2 18.5% -3.7% 12.3% 24.5 -8.6
    New York City, NY 595.7 15.8% -1.4% -0.8% -5.1 -8.4
    Newark-Union, NJ-PA 163.5 16.0% -4.7% -0.5% -0.8 -8.0
    Bergen-Hudson-Passaic, NJ 130.6 14.6% -5.8% -9.1% -13.0 -8.0
    Milwaukee-Waukesha-West Allis, WI 107.6 12.9% -6.6% -1.7% -1.8 -7.6
    Miami-Miami Beach-Kendall, FL 139.1 13.4% -4.7% 2.2% 3.0 -6.8
    Oakland-Fremont-Hayward, CA 158.0 15.6% -4.0% -7.1% -12.2 -6.7
    Las Vegas-Paradise, NV 108.2 12.1% -5.8% 38.1% 29.9 -6.6
    Boston-Cambridge-Quincy, MA 308.8 18.2% -2.0% -6.8% -22.5 -6.4
    Sacramento–Arden-Arcade–Roseville, CA 106.1 12.3% -5.6% -1.8% -1.9 -6.3
    Cleveland-Elyria-Mentor, OH 137.8 13.3% -4.3% -5.2% -7.6 -6.1
    Denver-Aurora-Broomfield, CO 207.0 16.9% -2.9% 4.0% 8.0 -6.1

    Consistent job losses in business services in these areas – some 54,000 in the Troy area since 2001 – reveal the clear connection between employment in business services and in the region’s fundamental auto industry. It turns out that elite services often prove dependent on basic industry. When industrial plants shut down, it’s not just blue-collar workers and company executives that suffer; as a result, these firms will use fewer lawyers, accountants, architects and technical consultants.

    A similar picture emerges in cities like Phoenix, which lost about 35,000 business-services jobs in just one year. This loss stems from the collapse of the housing bubble, which powered the rest of the regional economy. The same meltdown caused smaller but still significant reversals in one-time boomtowns like Orlando, Fla., Atlanta and Southern California’s Santa Ana region, which encompasses Orange County, where business service employment dropped by double-digit rates over the past year.

    Yet these same areas should see some recovery, perhaps more so than the traditional auto manufacturing-focused towns. Phoenix, Orlando and other Sun Belt locations – including a host of other areas in Florida – all saw increasing employment in business services over the past decade. If the economy comes back, along with a stabilization of the residential real estate market, business-services job growth will likely begin to take off again. After all, the fundamental reasons for the success of these areas, such as warm weather, lower costs and the need to serve a growing population, have not fundamentally changed.

    Perhaps most perplexing is the fate of some of the other places on our worst cities list, particularly the biggest metropolitan areas. The professional and business services sector is widely considered ideal for large, cosmopolitan centers, since lots of industries require support. But Chicago experienced a huge chunk of job losses – almost 25% – in this sector during the last year. Other big cities, including Los Angeles, Minneapolis and New York, also suffered.

    This is not a new phenomenon. These and other big cities, like Boston and San Jose, San Francisco and Oakland in California, have been shedding these types of jobs since 2001. These losses, however, have been concentrated at the lower-wage end of the business service pyramid, in areas like human resources and administration. These are the positions that companies can fill more easily and cheaply using the Internet or by hiring in less expensive outposts.

    That’s why Washington and its environs, which has seen across-the-board business growth, remain the great exception. Many business-services jobs outside the beltway appear to be becoming more nomadic, based in places where firms face lower costs and where workers can afford to live well on middle-income salaries. Even the long-term resiliency of higher-wage employment like law and accounting in traditional business hubs like New York could be at risk over time, with some jobs shifting to less expensive locales or even overseas.

    The changing nature of business services presents a boon to some communities and a challenge to others as they seek to survive and thrive in spite of the current recession. How some cities manage to grow this segment of their economies may well presage which parts of the country will thrive best during the years of recovery – and beyond.

    This article originally appeared at Forbes.

    Joel Kotkin is executive editor of NewGeography.com and is a presidential fellow in urban futures at Chapman University. He is author of The City: A Global History. His next book, The Next Hundred Million: America in 2050, will be published by Penguin early next year.

  • How Phoenix Will Come Back

    I have heard Paul Krugman say that ‘the end is nigh’ so many times that it seemed like the only sensible way to think about the housing market. It was identified as a bubble, and that could only mean that it would eventually burst. A steady diet of NYT editorials and Economist charts leave you with one conclusion — this is not going to end well.

    This certainly seems to be true in Phoenix. Even though I’ve lectured for years about ‘the growth machine’, how the economy in a city like Phoenix depends on building more homes, I did not expect the whole thing to collapse quite so precipitately, and with so many repercussions. The number of passengers going through the airport here is down 10% from last year; numerous restaurants, stores and other services have gone out of business, the State is trying to stare down a $3 billion deficit, the universities have fired hundreds of people—so the cycle keeps spreading like a slow motion disaster.

    Also predictable is the response. Local politicians are planning to slash the State budget and get government off people’s backs, once and for all. If we used foreign phrases such as ‘chutzpah’ around here, that would have to qualify. After all, it takes balls to watch the market behave like a bunch of drunks kicking Humpty Dumpty about, and then blame government for trying to put him back together again.

    Yet, at least here in Phoenix, it turns out that Professor Krugman hadn’t really got it figured out after all. As a rational man, he was distracted by the irrational exuberance of the market, the unsupportable ramping up of property prices, the NINJA loans, and the cynical exploitation of those arriving late to the party, those doomed to buy at the top of the market and be left holding fake mortgages on homes with phony values. The solutions seem simple. More oversight from Big Brother and everything can be fixed. Or, if you prefer to listen to the bizarro-world script over on AM radio, the black helicopters are about to start landing on Wall Street as the UN takes over to install European-style socialism.

    Yet much of this commentary is laughably wrong. The housing market debacle was not just predictable but actually utterly unavoidable. Some of this is simply a matter of money circulating around, which as Niall Ferguson’s book The Ascent of Money makes clear, this is as old as capitalism itself. The difference now is that digital technologies have made the speed of trading and transfer shift. The same rules apply, except that everyone must work harder to keep that cash flowing.

    What I now realize is that the entire economic system is based upon finding more risk. Without more risk in which to invest, the economy can’t keep moving. In other words, this wasn’t a series of calamities or errors or criminal mistakes — it is the market at work, no more, no less. And that is not going to change.

    What I thought I knew is not really so. I thought a bigger banking sector was not just more mysterious but was somehow more efficient and therefore safer; after all, health insurance works best if the risks are spread across larger and larger groups. Yet in reality finance is more like a vast Ponzi scheme. We should, in fact, let Mr. Madoff out of jail, as he was doing nothing particularly wrong — his only crime was that he wasn’t being clever enough in hiding his scheme in sufficiently obscure mathematics.

    What happens to the cities, towns and suburbs left devasted by the financial schemers? As James Surowiecki recently observed in the New Yorker, “banking grew bigger and more profitable but all we got in exchange was acres of empty houses in Phoenix.” So? Isn’t that a small price to pay? Given a choice, what would we rather have: a buoyant capital market and a few distant suburbs and downtown condos without any residents, or what we have today in some cities — double digit unemployment?

    There are real policy issues at work here. We were taught years ago, by the Marxists no less, that the purpose of a capitalist economy is to reproduce itself and the purpose of governments is to make sure that happens. So we make credit available to people; first to buy Model Ts, then to live in Levittown, then to play golf in Cancun, and so forth. And for this to work there has to be more risk in which to invest, an endless supply of new things. Housing has served us well in this regard; people live in condos and McMansions, people sell them, people build them, people manufacture the fixtures and fittings. This is how the growth machine, particularly in places like Phoenix, works.

    An economy like Phoenix is like a shark – it can’t stop, it can’t even run slow. We have to find more buyers — or perhaps we just build the homes now and fill them in the future when the population increases. Or, in line with a previous posting, we should have solved the immigration problem, and the need to sell more homes, by legalizing the Latino population and making them creditworthy.

    In this sense, maybe all this focus on the Valley’s 65,000 foreclosures is a mistake. As I argued last year, perhaps they should just be turned over to rentals and let the market sort it all out; predictably, rents are now coming down in apartment complexes as more families find affordable homes to rent.

    What we need is not to stop the market from repairing itself but we need to do it in a more creative way. Some of those suburbs are looking a bit down at heel, and the homes weren’t that sturdy to begin with — so let’s bulldoze them and do some serious brownfield redevelopment. Perhaps build them right, more sustainably, and less dependent on distant employment centers

    We can all get back to work, we can all feel virtuous as no new desert is being bladed, the infrastructure is already paid for, the journey to work costs will be less, the density perhaps a little higher with more jobs, offices and retail located closer to the houses.

    This approach will let us build more homes and get some more risk back into that market. Let’s repurpose the land. Then we can go back to business as usual, and if I was a betting man, that’s exactly what we are going to do.

    Andrew Kirby is the editor of the interdisciplinary Elsevier journal “Cities.”This is his 20th year as a resident of Arizona.