Tag: Sacramento

  • Is California the New Detroit?

    Most Californians live within miles of its majestic coastline – for good reason. The California coastline is blessed with arguably the most desirable climate on Earth, magnificent beaches, a backdrop of snow-capped mountains, and natural harbors in San Diego and San Francisco. The Golden State was aptly named. Its Gold Rush of 1849 was followed a century later by massive post-war growth.

    There is no mystery why California’s population and economy boomed after the Second World War. Education in California became the envy of the world. California’s public school system led the nation in innovation with brand new schools and classrooms. The Community College system that fed its universities was free for its students. A college education at the UC and Cal State systems was inexpensive. UC-Berkeley, with its graduate schools, was arguably the greatest in the world while Stanford developed into the Harvard of the West. An efficient highway system moved California’s automobile driven commerce while fertile soil of the Central Valley became the fruit and vegetable basket of the world.

    The next wave hit in the 80s as former orchards south of San Francisco morphed into the Silicon Valley. Intel and other chip manufacturers led the computer and software revolution bringing high tech jobs and immense new wealth to the Golden State. The dot-com revolution of the 90s brought more gold to California. Innovators like Google and Apple cashed in by nurturing the Internet era. The next decade heralded the greatest housing and mortgage boom in the nation’s history. Developers from Orange County, south of Los Angeles, invented creative financing vehicles that drove home sales, and profits, to record heights by 2006.  
     
    This success has created a problem: Californians, due to their golden history, live unreflective lives. The Tea Party movement generated a political tsunami that swept more than 60 incumbents from political office in 2010, but the wave petered out at California’s state line as Democrats take every elected office in the state.

    The state budget, mandated to balance by law, has been billions in the red for ten straight years. Yet Californians re-elect the same politicians, year after year, who produce budgets with multi-billion dollar deficits. California voters rejected Meg Whitman, the billionaire founder of Ebay, in favor of Jerry Brown. California now has a $16 billion deficit which “assumes” that California voters will pass massive tax increases on themselves. If they do not, the 2013 deficit becomes a mind numbing $20 billion. Yet despite the red ink, Governor Brown signed into law a “high speed rail” bill that will spend $6 billion on a train between Fresno and Bakersfield – not LA and San Francisco as promised. Polls turned against the choo-choo, but there remain no outcry from California voters.

    California voters rejected Carly Fiorina, who ran Hewlett Packard, for Barbara Boxer in the 2010 Senate race. To protect the endangered Delta Smelt, a fish known better as bait, water has been diverted from Central Valley farms to the Pacific Ocean. Orchards in the Central Valley were allowed to wither and die resulting in unemployment in the Central Valley as high as 40%. Imagine Californians on food stamps, living in what was the fruit basket of American.  

    California’s business climate now ranks dead last according to 650 CEOs measured by Chief Executive Magazine. Apple will take 3,600 jobs to its new $280,000,000 facility in Austin Texas – jobs that California would have had in the past. Texas ranked first in the same survey. California’s unemployment rate is consistently higher than 10% of its work force, and there are few jobs for college students who graduate with as much as $100,000 in student loans. Despite overwhelming evidence that bad public policy is chasing away jobs, the same state politicians are sent back to Sacramento every two years.

    California’s public education system, once the envy of the world, now ranks 46th in the nation in per pupil spending and faces a $1.4 billion cut in the fall. In the last month, three California cities declared bankruptcy. More will follow. Take Poway for example. Its school board borrowed $100,000,000 (for 33,000 students) through a Capital Appreciation Bond. The politicians told the voters there would be no payments for 20 years. What they did not explain was the residents must pay back $1 billion dollars on their $100 million loan. Beginning in 2021, tiny Poway will be forced to pay $50 million per year in bond payments. Huge property tax assessments will be required if homes do not appreciate 400% by then, which is unlikely under foreseeable circumstances.   

    Rather than stare at themselves in the mirror, Californians should take a look at Michigan. In the 50s greater Detroit was the fourth-largest city in America with 2 million inhabitants and the world’s most dominant industry: the automobile.

    Most people had a good paying job. Its burgeoning middle class was the model of the world with excellent public schools and universities. Detroit in 2012 is a shadow of that once great metropolis. Its population has shrunk to 714,000. The average price of a home has fallen to $5,700. Unemployment stands at 28.9%. It has a $300,000,000 deficit. There are 200,000 abandoned buildings in the derelict city. Its public education system, in receivership, is a disgrace producing more inmates than graduates. In 2006, the teacher’s union forced the politicians to reject a $200,000,000 offer from a Detroit philanthropist to build 15 new charter schools. Jobs long ago abandoned Detroit for places like South Carolina and Alabama, with their “right to work” laws and low taxes.

    Now Detroit’s Mayor has proposed razing 40 square miles of the 138 square miles of this once great American city returning 70,000 abandoned homes to farmland. Even such a draconian plan may not be enough to save the city. If a hurricane had hit Detroit, more of us would know of this tragedy in our midst, but this fate was man-made and not wrought by nature. Detroit has had one party rule for more than fifty years. Louis C. Miriani served from September 12, 1957 to January 2, 1962 as Detroit’s last Republican mayor. Since that time the Democrats have ruled the Motor City.  John Dingell has served region since 1956. His father was the Congressman from 1930 to 1956. Despite the disastrous decline of their city, Detroit voters send him back to Congress twenty-two times.

    Like Detroit, California now has one party rule. The Democrats of California did not need a single Republican vote to pass their budget. Governor Brown’s plan is to address the nation’s largest deficit by raising taxes instead of cutting spending. If passed, the deficit would drop from $20 billion to a mere $16 billion. The budget does nothing to cure the systemic problems of a bloated bureaucracy. It does not eliminate one of California’s 519 state agencies.  

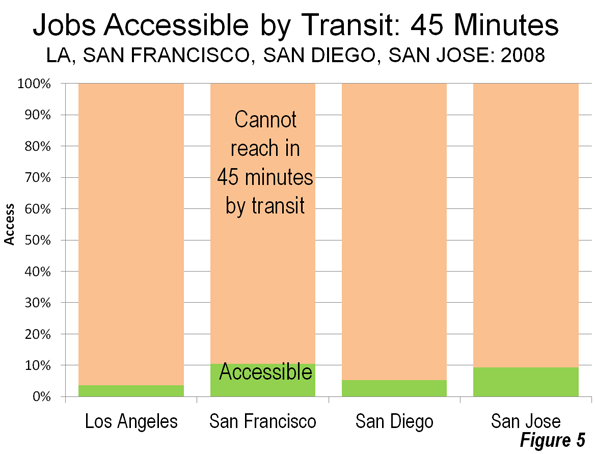
    Caltrans stopped building highways under Brown’s first term, but the people kept coming. Now 37 million Californians are locked in traffic jams each day. Brown was rewarded for such prescience with re-election as Governor. California’s egotistical politicians passed the Global Warming Solutions Act in 2006 (AB32) to “solve” climate change. Dan Sperling, an appointee to the California Air Resources Board (CARB) and a professor of engineering and environmental science at UC Davis, is the lead advocate on the board for a “low carbon fuel standard.” The powerful state agency charged with implementing AB 32 and other climate control measures, claims the low carbon fuel standard will “only” raise gasoline prices $.30 gallon in 2013. The California Political Review reported implementation of these the policies will raise prices by $1.00 per gallon.

    Detroit was once the most prosperous manufacturing city in the world, a title later secured by California.    Will California follow Detroit down a tragic path to ruin? In 1950, no one could imagine the Detroit of 2010. In 1970, when foreign imports started to make a foothold, the unions and their bought and paid for politicians resisted any change. In the 1990s as manufacturers fled to Alabama and South Carolina, the unions and their political minions held firm, even as good jobs slipped away. No one in Detroit envisioned their future.

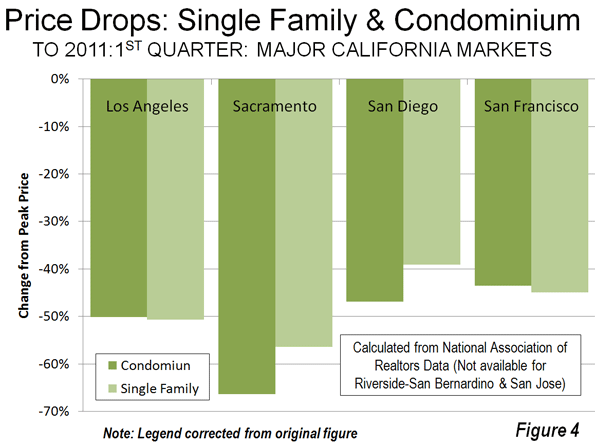
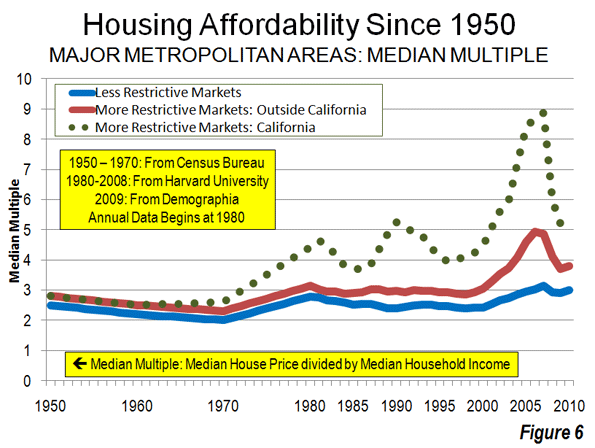
    Today, California is following Michigan’s path with exploding pension obligations, a declining tax base, and disastrous leadership. Housing prices have fallen 30 to 60% across the state, evaporating trillions of dollars of equity and wealth. Unemployment remains stubbornly high and under-employment is rife. Do our politicians need any more signs?

    Governor Brown’s budget will first slash money to schools and raise tuition on its students while leaving all 519 state agencies intact. He apparently will protect political patronage at all costs. Jobs, and job creators, are fleeing the state. Intel, Apple, and Google are expanding out of the state. The best and brightest minds are leaving for Texas and North Carolina. The signs are everywhere. Meanwhile, the voters send the same cast of misfits back to Sacramento each year – just as Detroit did before them.

    The beaches are still beautiful. The mountains are still snow capped and the climate is still the envy of the world. Detroit never had that. But will California’s physical attributes be enough? If the people of California want to glimpse their future, they need look no farther than once proud City of Detroit and the once wealthy state of Michigan.

    It can happen here.

    Robert J Cristiano PhD is the Real Estate Professional in Residence at Chapman University in Orange, CA, a Senior Fellow at the Pacific Research Institute in San Francisco, CA and President of the international investment firm, L88 Companies LLC in Denver – Newport Beach – Washington DC – Prague. He has been a successful real estate developer for more than thirty years.

  • High Speed Rail Advocates Discredit Their Cause – Again

    Is there any high speed rail boondoggle big enough to make rail transport advocates reject it?  Sadly, for all too many of them, the answer is No, as two recent developments make clear.

    The first is in California, where the state continues to press forward on a high speed rail plan for the state that could cost anywhere from $68 billion to $100 billion. Voters had previously approved $10 billion in bonds for the project, but as the state’s economy and finances have continued to sour – including multiple major cities going bankrupt – the polls have turned against it, and with good reason. The state faces the prospect of already enacted education cutbacks if Gov. Jerry Brown’s tax increase proposal in not approved in a vote this fall.  Other painful service cuts loom. Voters are rightly asking themselves if now is the time to be borrowing public money for very expensive, speculative infrastructure. 

    Equally, many of the much cited overseas examples of high-speed rail seem, well, to be off the tracks.    China’s rail system has serious safety problems, for example. And developing the most extensive high speed rail system in Europe hasn’t stopped Spain from seeing 50% youth unemployment, a 3 percentage point increase in the VAT tax, and a humiliating bailout from the rest of the EU.

    Nevertheless, the California assembly recently voted to go full speed head on its high speed rail plans. As part of an overall $8 billion rail spending package, the state is borrowing $2.6 billion to complement $3.2 billion in federal funds left over from the stimulus (shovel ready???) to build a starter segment of the line linking Bakersfield and Madera through the Central Valley. This is the easiest segment on which to build – though legal action is likely to delay construction – but doesn’t do anything to link the state’s huge population centers around LA and the Bay Area. With no more significant federal funds likely to be forthcoming, and the state’s finances a wreck, this segment risks becoming an embarrassing white elephant, or, as critics call it, “a train to nowhere”.

    After this vote it came to light that respected French high speed rail operator SNCF had approached California officials, private funding in hand, with a preliminary offer to build the LA-SF link themselves on a better and cheaper alignment along I-5 that would cost only $38 billion. But this was rejected by the state. The Times account suggests this rejection came about due to a combination of a political preference for the inefficient Central Valley segment and the clout of Parsons Brinckerhoff, the lead contractor.  Some commentators have referred to this revelation as a “bombshell.”

    Despite management misstep after management deception, rail advocates around the country cheered California’s decision to build the Central Valley segment. Jerry Brown, with not much to show for his reprise as Governor, is excited of course. Secretary of Transportation Ray LaHood called it a “big win.”  America 2050 (an offshoot of the Regional Plan Association of New York), “commended” the state for “taking a big step forward.”  Streetsblog called it a “major victory.”  While I respect what these organizations do in other contexts, this high speed rail vote is not a major victory, but a major defeat for common sense.

    But apparently not willing to let California take the prize in the rail boondoggle category without a fight, Amtrak shortly thereafter issued a “vision” for rail in the Northeast Corridor that would provide faster service between Boston and Washington, DC – at a cost of $151 billion. Strange as it sounds, some commentators actually lauded Amtrak for reducing costs since the previous plan was $169 billion.  The Brookings Institution was measured in its reaction to the plan, but managed to describe it as “more rational.”   With Republicans seemingly safely in charge of the House for now, and large federal deficits projected for the mid-term future, $151 billion for Amtrak seems purest fantasy.

    These developments are unfortunate because high speed rail could play an important role in US transportation, particularly in the Northeast. But that’s unlikely to happen because of the indiscriminate way establishment advocates have supported anything with the “high speed rail” label attached, ranging from $2 billion, 110 MPH peak speed Toonerville Trolleys in Illinois that barely beat Megabus in terms of journey time to the California rail boondoggle, regardless of merit. All they know that if it claims to be high speed rail, they are in favor of it.

    There are other people who take a more serious view. Unfortunately, they tend to be outsiders with little influence.  For example, Alon Levy suggested a set of near term, incremental Northeast Corridor improvements that might cost 90% less than Amtrak’s plan.

    $8 billion in stimulus dollars have gone to purchase us nothing of any real significance in terms of rail infrastructure. That money, invested wisely in high priority projects in the Northeast Corridor, could have made a big difference and started building a real demonstrated case for high speed rail investment in America. Unfortunately, the way high speed rail has been botched by its advocates, all the money we’ve spent on it has accomplished just the opposite. If California’s Central Valley segment is built and the complete line is never finished, it will likely discredit high speed rail in America for the long term.

    Aaron M. Renn is an independent writer on urban affairs and the founder of Telestrian, a data analysis and mapping tool.

    CA route map by Wikipedia user CountZ.

  • The Export Business in California (People and Jobs)

    California Senate President Pro-Tem Darrell Steinberg countered my Wall Street Journal commentary California Declares War on Suburbia in a letter to the editor (A Bold Plan for Sustainable California Communities) that could be interpreted as suggesting that all is well in the Golden State. The letter suggests that business are not being driven away to other states and that the state is "good at producing high-wage jobs," while pointing to the state’s 10 percent growth over the last decade. Senate President Steinberg further notes that the urban planning law he authored (Senate Bill 375) is leading greater housing choices and greater access to transit.

    This may be a description of the California past, but not present.

    Exporting People

    Yes, California continues to grow. California is growing only because there are more births than deaths and the state had a net large influx of international immigration over the past decade. At the same time, the state has been hemorrhaging residents (Figure 1).

    Californians are leaving. Between 2000 and 2009 (Note), a net 1.5 million Californians left for other states. Only New York lost more of its residents (1.6 million). California’s loss was greater than the population of its second largest municipality, San Diego. More Californians moved away than lived in 12 states at the beginning of the decade. Among the net 6.3 million interstate domestic migrants in the nation, nearly one-quarter fled California for somewhere else.

    The bulk of the exodus was from the premier coastal metropolitan areas. Since World War II, Los Angeles, San Francisco, San Diego and San Jose have been among the fastest growing metropolitan areas in the United States and the high-income world. Over the last decade, this growth has slowed substantially, as residents have moved to places that, all things being considered, have become their preferences.

    More than a net 1.35 million residents left the Los Angeles metropolitan area, or approximately 11 percent of the 2000 population. The San Jose metropolitan area lost 240,000 residents, nearly 14 percent of its 2000 population. These two metropolitan areas ranked among the bottom two of the 51largest metropolitan areas (over 1,000,000 population) in the percentage of lost domestic migrants during the period. The San Francisco metropolitan area lost 340,000 residents, more than 8 percent of its 2000 population and ranked 47th worst in domestic migration (New York placed worse than San Francisco but better than Los Angeles). Each of these three metropolitan areas lost domestic migrants at a rate faster than that of Rust Belt basket cases Detroit, Cleveland and Buffalo.

    San Diego lost the fewest of the large coastal metropolitan areas (125,000). Even this was double the rate of Rust Belt Pittsburgh.

    Exporting Jobs

    California is no longer an incubator of high-wage jobs. The state lost 370,000 jobs paying 25 percent or more of the average wage between 2000 and 2008. This compares to a 770,000 increase in the previous 8 years. California is trailing Texas badly and the nation overall in creating criticial STEM jobs and middle skills jobs (Figures 2 & 3) Only two states have higher unemployment rates than California (Nevada and Rhode Island) . California has the second highest underemployment rate (20.8 percent), which includes the number of unemployed, plus those who have given up looking for work ("discouraged" workers) and those who are working only part time because they cannot find full time work. Only Nevada, with its economy that is overly-dependent on California, has a higher underemployment rate.


    Business relocation coach Joseph Vranich conducts an annual census of companies moving jobs out of California and found a quickening pace in 2012. Often these are the very kinds of companies capable of creating the high-wage jobs that used to be California’s forte. Vranich says that the actual number may be five times as high, which is not surprising, not least because there is no reliable compilation of off-shoring of jobs to places like Bangalore, Manila or Cordoba (Argentina).

    To make matters worse, California is becoming less educated. California’s share of younger people with college degrees is now about in the middle of the states, while older, now retiring Californians are among the most educated in the nation (Figure 4).

    Denying Housing Choice

    It is fantasy to believe, as Steinberg claims, that there are enough single family (detached) houses in the state to meet the demand for years to come. More than 80 percent of the new households in the state chose detached housing over the last decade. People’s actual choices define the market, not the theories or preferences of planners often contemptuous of the dominant suburban lifestyle.

    In contrast, however, the regional plans adopted or under consideration in the Bay Area, Los Angeles and San Diego would require nearly all new housing be multi-family, at five to 10 times normal California densities (20 or more units to the acre are being called for). New detached housing on the urban fringe would be virtually outlawed by these plans. And, when Sacramento does not find the regional plans dense enough, state officials (such as the last two state Attorneys General) are quick to sue. If the "enough detached housing" fantasy held any water, state officials and planners would not be seeking its legal prohibition. To call outlawing the revealed choice of the 80 percent (detached housing) would justify the equivalent of a Nobel Prize in Doublespeak.

    At the same time by limiting the amount of land on which the state preferred high density housing must be built, land and house prices can be expected to rise even further from their already elevated levels (already largely the result of California’s pre-SB 375 regulatory restrictions).

    Transit Rhetoric and Reality

    Transit is important in some markets. About one-half of commuters to downtown San Francisco use transit. The assumptions of SB 375 might make sense if all of California looked like downtown San Francisco. It doesn’t, nor does even most of the San Francisco metropolitan area. Only about 15 percent of employment is downtown, while the 85 percent (and nearly all jobs in the rest of the state) simply cannot be reached by transit in a time that competes with the car. Even in the wealthy San Jose area (Silicon Valley), with its light rail lines and commuter rail line, having a transit stop nearby provides 45 minute transit access to less than 10 percent of jobs in the metropolitan area.

    A recent Brookings Institution report showed that the average commuter in the four large coastal metropolitan areas can reach only 6.5 percent of the jobs in a 45 minute transit commute. This is despite the fact that more than 90 percent of residents can walk to transit stops. Even when transit is close, you can’t get there from here in most cases in any practical sense (Figure 5).

    SB 375 did little to change this. For example, San Diego plans to spend more than 50 percent of its transportation money on transit over the next 40 years. This is 25 times transit’s share of travel (which is less than 2 percent). Yet, planners forecast that all of this spending will still leave 7 out of 8 work and higher education trips inaccessible by transit in 30 minutes in 2050. Already 60 to 80 percent of work trips in California are completed by car in 45 minutes and the average travel time is about 25 minutes.

    For years, planners have embraced the ideal of balancing jobs and housing, so that people would live near where they work, while minimizing travel distances. This philosophy strongly drives the new SB 375 regional plans. What these plans miss is that people choose where to work from the great array of opportunities available throughout the metropolitan area. These varied employment opportunities that are the very reason that large metropolitan areas exist, according to former World Bank principal planner Alain Bertaud.

    People change jobs far more frequently than before and multiple earners in households are likely to work far apart. Similar intentions led to the development up to four decades ago of centers like Tensta in Stockholm, which ended up as concentrated low income areas (Photo). It California, such a concentration would do little to improve transit ridership, even low-income citizens are four to 10 times as likely use cars to get to work than to use transit.


    Tensta Transit Oriented Development: Stockholm

    All of this means more traffic congestion and more intense local air pollution, because higher population densities are associated with greater traffic congestion. Residents of the new denser housing would face negative health effects because there is more intense air pollution, especially along congested traffic corridors.

    Self-Inflicted Wounds

    Worst of all, California’s radical housing and transportation strategies are unnecessary. The unbalanced and one-dimensional pursuit of an idealized sustainability damages both quality of life and the economy. This is exacerbated by other issues, especially the state’s dysfunctional economic and tax policies. It is no wonder California is exporting so many people and jobs. California’s urban planning regime under SB 375 is poised to make it worse.

    Wendell Cox is a Visiting Professor, Conservatoire National des Arts et Metiers, Paris and the author of “War on the Dream: How Anti-Sprawl Policy Threatens the Quality of Life”.

    Net Domestic Migration: 2000-2009
    Rank Metropolitan Area Net Domestic Migration Compared to 2000 Population
    1 Raleigh, NC         194,361 24.2%
    2 Las Vegas, NV         311,463 22.4%
    3 Charlotte, NC-SC         248,379 18.5%
    4 Austin, TX         234,239 18.5%
    5 Phoenix, AZ         543,409 16.6%
    6 Riverside-San Bernardino, CA         469,093 14.3%
    7 Orlando, FL         225,259 13.6%
    8 Jacksonville, FL         126,766 11.3%
    9 Tampa-St. Petersburg, FL         260,333 10.8%
    10 San Antonio, TX         177,447 10.3%
    11 Atlanta, GA         428,620 10.0%
    12 Nashville, TN         123,199 9.4%
    13 Sacramento, CA         141,117 7.8%
    14 Richmond, VA           75,886 6.9%
    15 Portland, OR-WA         121,957 6.3%
    16 Dallas-Fort Worth, TX         317,062 6.1%
    17 Houston, TX         243,567 5.1%
    18 Indianapolis. IN           72,517 4.7%
    19 Oklahoma City, OK           41,082 3.7%
    20 Denver, CO           66,269 3.0%
    21 Louisville, KY-IN           34,381 3.0%
    22 Birmingham, AL           26,934 2.6%
    23 Columbus, OH           34,204 2.1%
    24 Kansas City, MO-KS           31,747 1.7%
    25 Seattle, WA           40,741 1.3%
    26 Minneapolis-St. Paul, MN-WI          (19,731) -0.7%
    27 Memphis, TN-MS-AR            (8,583) -0.7%
    28 Hartford, CT            (9,349) -0.8%
    29 Cincinnati, OH-KY-IN          (17,648) -0.9%
    30 Virginia Beach-Norfolk, VA-NC          (20,005) -1.3%
    31 Baltimore, MD          (36,407) -1.4%
    32 St. Louis, MO-IL          (43,750) -1.6%
    33 Philadelphia, PA-NJ-DE-MD        (115,890) -2.0%
    34 Pittsburgh, PA          (52,028) -2.1%
    35 Washington, DC-VA-MD-WV        (107,305) -2.2%
    36 Providence, RI-MA          (49,168) -3.1%
    37 Salt Lake City, UT          (34,428) -3.5%
    38 Rochester, NY          (40,219) -3.9%
    39 San Diego, CA        (126,860) -4.5%
    40 Buffalo, NY          (55,162) -4.7%
    41 Milwaukee,WI          (74,453) -5.0%
    42 Boston, MA-NH        (235,915) -5.4%
    43 Miami, FL        (287,135) -5.7%
    44 Chicago, IL-IN-WI        (561,670) -6.2%
    45 Cleveland, OH        (136,943) -6.4%
    46 Detroit,  MI        (366,790) -8.2%
    47 San Francisco-Oakland, CA        (347,375) -8.4%
    48 New York, NY-NJ-PA     (1,962,055) -10.7%
    49 Los Angeles, CA     (1,365,120) -11.0%
    50 San Jose, CA        (240,012) -13.8%
    51 New Orleans, LA        (301,731) -22.9%
    Data from US Census Bureau


    —–

    Note:  2000 to 2010 data not available

    Lead photo: Largely illegal to build housing under California Senate Bill 375 planning

  • Megalopolis and its Rivals

    Jean Gottman in 1961 coined the term megalopolis (Megalopolis, the Urbanized Northeastern Seaboard of the Unites States) to describe the massive concentration of population extending from the core of New York north beyond Boston and south encompassing Washington DC. It has been widely studied and mapped, including by me. (Morrill, 2006, Classic Map Revisited, Professional Geographer).  The concept has also been extended to describe and compare many other large conurbations around the world.

    Maybe it’s time to see how the original has fared?   And what has happened to other metropolitan complexes in the US, most notably Los Angeles, San Francisco, Chicago and should we say Florida?


    Table 1 summarizes the population of Megalopolis from 1950 to 2010 and Table 2 compares Megalopolis with other US mega-urban complexes.  Megalopolis grew fastest in the 1950s and 1960s, with growth rates of 20 and 18.5 percent. The  northeast has since been outpaced by the growth in other regions, but growth was still substantial in the last decade. Megalopolis added almost 3 million people, by 6.8 %, to reach an amazing 45.2 million.

    Table 1: Growth of Megalopolis 1950-2010
    Year Population Change % Change
    2010 45,357 2,983 7
    2000 42,374 5,794 15.8
    1990 36,580 2,215 6.4
    1980 34,365 360 1.2
    1970 34,005 5,436 18.5
    1960 29,441 4,910 20
    1950 24,534

    From Table 2 I note four major subregions of Megalopolis: Boston, New York, Philadelphia and Washington, DC. New York is still the biggest player, but the locus of growth over time has shifted South. This reflects the increasing world importance of Washington, DC. New York’s almost 20 million may not surprise, but the fact that greater Boston has grown to almost 9.5 million may be more surprising.  The Washington-Baltimore area grew by far the fastest at almost 15 percent (not much sign of shrinkage of government!). In contrast New York, Boston and Philadelphia’s growth was relatively paltry.

    Table 2: Megalopolis and Its Rivals
    Place
    2010 Pop
    2000 Pop
    Change
    % change
    Megalopolis
      New York 19,923 19,209 717 3.7
      Boston   9,445 8,967 478 5.3
      Philadelphia 8,415 76,781 773 9.5
      Baltimore-Washingt 7,403 7,681 960 14.9
    All 45,181 42,302 2,888 6.8
    Chicago 10,817 10,305 512 5
    Los Angeles 12,151 11,789 362 3.1
      Central 903 857 46 5.4
      North 928 634 294 46
      East 2,884 2,105 475 37
      South 3,543 3,210 337 10.4
    All Los Angeles 20,404 18,599 1,810 9.8
    San Francisco-Sacramento
      San Francisco 7,330 6,946 384 5.5
      Sacramento 3,171 2,604 572 22
    All San Francisco-Sacramento 10,501 9,550 951 10
    Florida
      Miami 6,027 5,311 716 13.5
      Tampa 4,818 3,894 974 25.3
      Orlando 2,915 2,193 722 33
      Jacksonville 1,483 1,191 2,242 24.5
    All Florida 15,243 12,544 2,699 21.5

    Greater Los Angeles is the second largest conurbation, with some 20.4 million, growing by 1.8 million, and 10 percent from 2000. In the table I distinguish between the core Los Angeles urbanized area and the satellite urbanized areas west, north, south and east. The core LA area grew by only 3 percent, while the spillover areas to the north and east had astonishing growth, at 46 and 37 percent over the decade.  These include several places with a fairly long history, such as Riverside and San Bernardino, San Diego and Santa Barbara, but many are rapidly growing large suburbs and exurbs, a spillover of growth from the Los Angeles core. Much of the fastest growth has been in  Mission Viejo, Murietta-Temecula, Indio, Lancaster, Santa Clarita and Thousand Oaks.

    For greater San Francisco, I distinguish two subregions, the Bay area of San Francisco-San Jose (west) and Sacramento (central valley).  Some might consider these totally distinct, but they have become one in a conurbation sense, as evidenced by commuting patterns. Many people live in the less costly Central Valley area but commute to the expensive Bay Area cities. Together, the conurbation is now 10.5 million, up 10 percent from 2000. The central valley (Sacramento) portion grew far more rapidly than San Francisco-San Jose (22 percent compared to 5.5 percent).  

    Compared to its rivals the Chicago conurbation has grown less rapidly but is still large, with a population of 10.8 million in 2010 , growing 512,000 (5 percent) since 2000.  Chicago and Milwaukee are the well-known core cities, but there are also less well known components with far faster growth such as Round Lake-McHenry and West Bend, WI.   

    Florida

    The more interesting and difficult conurbation to try to define is what might be called the Florida archipelago. Greater Miami has long been recognized as a conurbation, but I contend that virtually all the urbanized areas of the state are in effect a complex web of urban settlement, with little clear demarcation. This is in part a reflection of   rapid and expansive  growth.  Nevertheless it makes sense to recognize four sub-regions, centered on Miami, Tampa-St. Petersburg, Orlando and Jacksonville. 

    Together these areas have reached an astonishing 15.2 million, up 2.7 million or 21.5 percent in one decade.  Because settlement is spread across the state in such a web-like fashion with no single dominant center, they constitute a newish form of urban concentration. Besides the well-known centers such as   Miami, Tampa-St. Petersburg ), Orlando and Jacksonville,  there are many satellite cities, often quite large. These include North Port, Cape Coral  encompassing older Ft. Meyers, Bonita Springs, Kissimmee, Palm Bay-Melbourne, Palm Coast-Daytona, and Port St. Lucie.  An interesting but hard to answer question is how much of Florida’s phenomenal growth is a result of transfer of people and accumulated wealth from the North (and especially from the original Megalopolis).

    The United States is a large and diverse country, with many other giant cities and a vast countryside. But it is important to realize the importance of these megalopolitan areas, with an aggregate population of 102.6 million, one third of the nation’s population.

    What’s next? Look for the rise of now just somewhat smaller conurbations such as Houston, Dallas, Atlanta, Minneapolis, Seattle, Phoenix, and Denver. In terms of numbers and rates of growth Texas is a front runner, but its stars do not coalesce into a megalopolis, at least not yet. The belt of urban growth from Atlanta, through Greenville, SC, Charlotte to Raleigh-Durham is also a likely future conurbation candidate.

    Richard Morrill is Professor Emeritus of Geography and Environmental Studies, University of Washington. His research interests include: political geography (voting behavior, redistricting, local governance), population/demography/settlement/migration, urban geography and planning, urban transportation (i.e., old fashioned generalist).

  • Public Pensions: Reform, Repair, Reboot

    Ill-informed chatter continues to dominate the airwaves when it comes to California public pensions. It’s a big, complex and critical issue for government at all levels in the Golden State. What makes debate so distorted is that public pensions actually differ from agency to agency — and advocates on the issue often talk past each other. Pension critics often point to outrageous abuses as if they were typical. On the other hand, pension defenders often cite current averages that understate long-term costs. All this fuels the typical partisan gridlock that Californians lament yet seem powerless to change in our state.

    Credit Governor Jerry Brown for trying to overcome the polarization. That’s what most California voters want him to do, according to a new Field Poll, one of the leading opinion research firms in California. His 12-point pension package (unveiled in October) is successfully framing the debate — and enjoys encouraging support from voters. I agree with them. While Brown’s plan is far from perfect (as he acknowledged in presenting it as a way to build consensus) it sensibly tackles some of the most challenging areas where reform is needed. Among the key reforms he’s proposed:

    • Increasing the retirement age from 55 to 67 (with a lower age to be spelled out for public safety workers).
    • Replacing the current “defined benefit” pensions with a hybrid program that includes a defined benefit component, but also a 401(k)-like defined contribution component
    • Prohibiting retroactive pension increases.
    • Requiring all employees to contribute at least 50 percent of the cost of their pensions

    These generally follow the surprisingly strong stand taken by the League of California Cities, which was based on recommendations from a committee of City Managers that I served on. Our work was grounded in four core principles:

    1. Public retirement systems are useful in attracting and retaining high-performing public employees to design and deliver vital public services to local communities;
    2. Sustainable and dependable employer-provided defined benefits plans for career employees, supplemented with other retirement options including personal savings, have proven successful over many decades in California;
    3. Public pension costs should be shared by employees and employers (taxpayers) alike; and
    4. Such programs should be portable across all public agencies to sustain a competent cadre of California public servants.

    Our goal was to ensure the public pension system is reformed, instead of destroyed. Our reform package mirrors Brown’s calls for a hybrid system, raising retirement ages and increasing the portion of pension costs borne by employees. We also backed his bid to base retirements on the top three highest years of pay, curbing the abuses that often artificially raise final year salaries to “spike” pension pay-outs.

    Typical of California’s other challenges, the issue faces long odds in the Legislature and uncertain fate at the ballot box. Partisan Democrats are leery of crossing unions by embracing Brown’s package. Partisan Republicans are demanding more far-reaching changes. Brown hopes to bridge the differences to win majority support by drawing on moderates in both parties. “He hasn’t riled up one side or the other,” noted Field Poll director Mark DiCamillo. “He’s managed to strike the middle ground on a very polarizing issue.” Unfortunately, moderates are hard to find in Sacramento.

    That leaves the roll of the dice that comes with ballot initiatives. Since it takes millions to bankroll a successful ballot measure, few sensible measures get far without support from well-heeled interests.

    In the eternal game of chicken that goes on in Sacramento, the Legislature keeps one eye on those special interests. About the only hope for reform is if a majority is worried that failure to act might spur an expensive ballot box war and an even worse outcome.

    This issue might be the exception, however. Public outrage is real. So is the need for reform. In Ventura, we took an early lead on this issue, first with our Compensation Policies Task Force, then union contracts that established a lower benefit and later retirement age for new hires and increased contributions from all employees of at least 4.5% of their pay. But real reform to level the playing field can only come at the State level.

    Before this issue devolves into another ballot box catastrophe that radically oversimplifies the issues to a “yes” or “no” choice on an initiative bankrolled by special interests, legislators in both parties need to come together on sensible reform. The Governor has put such a program on their desks. Reasonable people can differ on the details. But only unreasonable people want all-or-nothing victories. This is an issue that both sides should be willing to compromise on. The only way that will happen is if voters push both parties toward sensible compromise in the year ahead!

    Photo by Randy Bayne

    Rick Cole is city manager of Ventura, California, and recipient of the Municipal Management Association of Southern California’s Excellence in Government Award. He can be reached at RCole@ci.ventura.ca.us

  • California’s Jobs Engine Broke Down Well Before the Financial Crisis

    Everybody knows that California’s economy has struggled mightily since the 2008 financial crisis and subsequent recession. The state’s current unemployment rate, 12.1 percent, is a full 3 percentage points above the national rate. Liberal pundits and politicians tend to blame this dismal performance entirely on the Great Recession; as Jerry Brown put it while campaigning (successfully) for governor last year, “I’ve seen recessions. They come, they go. California always comes back.”

    But a study commissioned by City Journal using the National Establishment Time Series database, which has tracked job creation and migration from 1992 through 2008 (so far) in a way that government statistics can’t, reveals the disturbing truth. California’s economy during the second half of that period—2000 through 2008—was far less vibrant and diverse than it had been during the first. Well before the crisis struck, then, the Golden State was setting itself up for a big fall.

    One of the starkest signs of California’s malaise during the first decade of the twenty-first century was its changing job dynamics. Even before the downturn, California had stopped attracting new business investment, whether from within the state or from without.

    Economists usually see business start-ups as the most important long-term source of job growth, and California has long had a reputation for nurturing new companies—most famously, in Silicon Valley. As Chart 1 shows, however, this dynamism utterly vanished in the 2000s. From 1992 to 2000, California saw a net gain of 776,500 jobs from start-ups and closures; that is, the state added that many more jobs from start-ups than it lost to closures. But during the first eight years of the new millennium, California had a net loss of 262,200 jobs from start-ups and closures. The difference between the two periods is an astounding 1 million net jobs.

    Between 2000 and 2008, California also suffered net job losses of 79,600 to the migration of businesses among states—worse than the net 73,800 jobs that it lost from 1992 through 2000. The leading destination was Texas, with Oregon and North Carolina running second and third (see Chart 2). California managed to add jobs only through the expansion of existing businesses, and even that was at a considerably lower rate than before.

    Graph by Alberto Mena

    Graph by Alberto Mena

    Another dark sign, largely unnoticed at the time: California’s major cities became invalids in the 2000s. Los Angeles and the San Francisco Bay Area had been the engines of California’s economic growth for at least a century. Since World War II, the L.A. metropolitan area, which includes Orange County, has added more people than all but two states (apart from California): Florida and Texas. The Bay Area, which includes the San Francisco and the San Jose metro areas, has been the core of American job growth in information technology and financial services, with San Jose’s Silicon Valley serving as the world’s incubator of information-age technology. During the 1992–2000 period, the L.A. and San Francisco Bay areas added more than 1.1 million new jobs—about half the entire state total. But between 2000 and 2008, as Chart 3 indicates, California’s two big metro areas produced fewer than 70,000 new jobs—a nearly 95 percent drop and a mere 6 percent of job creation in the state. This was a collapse of historic proportions.

    Graph by Alberto Mena

    Not only did California in the 2000s suffer anemic job growth; the new jobs paid substantially less than before. Chart 4 reveals the sad reversal. From 2000 to 2008, California had a net job loss of more than 270,000 in industries with an average wage higher than the private-sector state average. That marked a turnaround of nearly 1.2 million net jobs from the 1992–2000 period, when 908,900 net jobs were created in above-average-wage industries. Further, during the earlier period, more than 707,000 net jobs were created in the very highest-wage industries—those paying over 150 percent of the private-sector average.

    Chart 5, which indicates job growth or decline in selected industries, again suggests that a lopsided amount of California’s economic growth in the 2000s was in below-average-wage fields. It included nearly 590,000 net jobs in “administration and support”—clerical and janitorial jobs, for example, as well as positions in temporary-help services, travel agencies, telemarketing and telephone call centers, and so on. The largest losses in the state during the 2000s were in manufacturing, which traditionally provided above-average wages. After adding a net 64,900 manufacturing jobs from 1992 to 2000, California hemorrhaged a net 403,800 from 2000 to 2008. But information jobs also went into negative territory, while professional, scientific, and technical-services employment experienced far lower growth than in the previous decade.

    The chart also shows that California’s growth in the 2000s, such as it was, took place disproportionately in sectors that rode the housing bubble. In fact, 35 percent of the net new jobs in the state were created in construction and real estate. All those jobs have vaporized since 2008, according to Bureau of Labor Statistics data. They are unlikely to come back any time soon.

    These are troubling numbers. Fewer jobs and lower wages do not a robust economy make. A continuation of this trend, even if California’s recession-battered condition improves, would result in a far more unequal economy, shrunken tax revenues, and a likely increase in state public assistance—all at a time when officials are struggling with massive deficits.

    Graph by Alberto Mena

    Graph by Alberto Mena

    A final indicator of California’s growing economic weakness during the 2000–2008 period is that the average size of firms headquartered in the state shrank dramatically. As Chart 6 shows, California had a huge increase over the 1992–2000 period in the number of jobs added by companies employing just a single person or between two and nine people, even as larger firms cut hundreds of thousands of jobs. Many of the single-employee companies may simply be struggling consultancies: if they were doing better, they’d likely have to start hiring at least a few people. While start-ups are indeed crucial to economic growth, small companies are especially vulnerable to economic downturns and often feel the brunt of taxes and regulations more acutely than larger firms do. The awful job numbers for the bigger companies—including a net loss of nearly 450,000 positions for firms with 500 or more employees—suggest the toxicity of California’s business climate. After all, bigger firms have the resources to settle and expand in other locales; in the 2000s, they clearly wanted nothing to do with the Golden State.

    Graph by Alberto Mena

    What is behind California’s shocking decline—its snuffed-out start-ups, unproductive big cities, poorer jobs, and tinier, weaker, or fleeing companies—during the 2000–2008 period? Steven Malanga’s “Cali to Business: Get Out!” identifies the major villains: suffocating regulations, inflated business taxes and fees, a lawsuit-friendly legal environment, and a political class uninterested in business concerns, if not downright hostile to them. One could add to this list the state’s extraordinarily high cost of living, with housing prices particularly onerous, having skyrocketed in the major metropolitan areas before the downturn—thanks, the research suggests, to overzealous land-use regulation.

    One thing is for sure: California will never regain its previous prosperity if it leaves these problems unaddressed. Its profound economic woes aren’t just the result of the Great Recession.

    This piece originally appeared in City Journal. City Journal thanks the Hertog/Simon Fund for Policy Analysis for its generous support of this issue’s California jobs package.

    Wendell Cox is a Visiting Professor, Conservatoire National des Arts et Metiers, Paris and the author of “War on the Dream: How Anti-Sprawl Policy Threatens the Quality of Life

    Photo by Altus via Flickr

  • The Golden State Is Crumbling

    The recent announcement that California’s unemployment again nudged up to 12 percent—second worst in the nation behind its evil twin, Nevada—should have come as a surprise but frankly did not. From the beginning of the recession, the Golden State has been stuck bringing up a humbled nation’s rear and seems mired in that less-than-illustrious position.

    What has happened to my adopted home state of over last decade is a tragedy, both for Californians and for America. For most of the past century, California has been “golden” not only in name but in every kind of superlative—a global leader in agriculture, energy, entertainment, technology, and most important of all, human aspiration.

    In its modern origins California was paean to progress in the best sense of the word. In 1872, the second president of the University of California, Daniel Coit Gilman, said science was “the mother of California.” Today, California may worship at the altar of science, but increasingly in the most regressive, hysterical, and reactionary way.

    California’s dominant ruling class—consisting of public-employee unions, green jihadis, and Democratic machine politicians—has no real use for science as Gilman saw it: as a way to create prosperity for its citizens. Instead, the prevailing credo of the state has been how to do everything possible to return to its pre-settlement condition, with little regard for what that means to the average Californian.

    Nowhere was California’s old technological ethos more pronounced than in agriculture, where great Californians such as William Mulholland, creator of the Los Angeles Aqueduct, and Pat Brown, who forged the state water project, created the greatest water-delivery system since the Roman Empire. Their effort brought water from the ice-bound Sierra Nevada mountains down to the state’s dry but fertile valleys and to the great desert metropolis of Southern California. Now, largely at the behest of greens, California agriculture is being systematically cut down by regulation. In an attempt to protect a small fish called the Delta smelt, upward of 200,000 acres of prime farmland have been idled, according to the state’s Department of Conservation. Even in the current “wet” cycle, California’s agricultural industry, which exports roughly $14 billion annually, is slowly being decimated. Unemployment in some Central Valley towns tops 30 percent, and in cases even 40 percent.

    And now, notes my friend, Salinas Mayor Dennis Donohue, green regulators are imposing new groundwater regulations that may force the shutdown of production even in areas like his that have their own ample water supplies.

    Salinas was the home town of John Steinbeck, author of The Grapes of Wrath and great chronicler of Depression-era California. Today for many in hardscrabble, majority-Latino Salinas, home to 150,000 people, The Grapes of Wrath is less lyrical than real. “California,” notes Donohue, a lifelong Democrat, “remains intent on job destruction and continued hyper-regulation.”

    California’s pain is not restricted to farming towns. The state’s regulatory vigilantes have erected a labyrinth of rules that increasingly makes doing almost anything that might contribute to increased carbon emissions—manufacturing, conventional energy, home construction—extraordinarily onerous. Not surprisingly, the state has not gained middle-skilled jobs (those requiring two years of college or more) for a decade, while the nation boosted them by 5 percent and archrival Texas by a stunning 16 percent over the same time period.

    There is little chance that the jobs lost in these fields will ever be recovered under the current regime. As decent blue-collar and midlevel jobs disappear, California has gone from a rate of inequality about the national average in 1970, to among the most unequal in terms of income. The supposed solution to this—Gov. Jerry Brown’s promise of 500,000 “green jobs”—is being shown for what it really is, the kind of fantasy you tell young children so they will go to sleep.

    Many Californians who aren’t slumbering are moving out of the state—and not only the pathetic remains of the old Reaganite majority. According to the most recent census, those leaving the state include old boomers, middle-aged families, and increasingly, many Latinos as well. Outmigration rates from places like Los Angeles and the Bay Area now rival those of such cities as Detroit. In the last decade, California’s population grew only 10 percent, about the national average, largely due to immigrants and their offspring. Population increases in the Bay Area were less than half that rate, while the City of Los Angeles gained fewer new residents—less than 100,000—than in any decade since the turn of the last century!

    Increasingly, California no longer beckons ambitious newcomers, except for a handful of the most affluent, best educated, and well connected. Through the 1980s and even through the late ’90s, the aspirational classes came to California. Now they head to other, more opportunity-friendly places like Austin, Houston, Dallas, Raleigh-Durham, even former “dust bowl” burghs like Des Moines, Omaha, and Oklahoma City. Meanwhile, Golden California, particularly its expensive, ultragreen coast, gets older and older. Marin County, the onetime home of the Grateful Dead and countless former hippies, is now one of the grayest urban counties in the country, with a median age of 44.

    Of course, the self-described “progressive” mafia that runs California will point to Silicon Valley and its impressive array of startups. But for the most part, firms like Google, Twitter, and Facebook employ only a small cadre of highly educated workers. Overall, during the past decade the state’s high-tech employment fell by almost 4 percent, while Texas’s science-based employment grew by a healthy 11 percent. The sad reality is that turning T-shirt-wearing kids like Mark Zuckerberg into multibillionaires doesn’t do much to reduce unemployment, which even in San Jose—the largely blue-collar “capital” of Silicon Valley—now hovers around 10 percent.

    Magazine cover stories and movies cannot obscure the fact that entrepreneurial growth—the state’s most critical economic asset—has now stalled. In fact, according to a study by Economic Modeling Specialists Inc., last year the Golden State ranked 50th among the states in creating new businesses.

    California remains rich in promise, home to spectacular scenery; a great Pacific location; leading firms like Apple and Disney; and a still-impressive residue of talented, diverse, entrepreneurial, and ingenious people. But the state will never return until the success of the current crop of puerile billionaires can be extended to enrich the wider citizenry. Until the current regime is toppled, California’s decline—in moral as well as economic terms—will continue, to the consternation of those of us who embraced it as our home for so many years.

    This piece originally appeared at The Daily Beast.

    Joel Kotkin is executive editor of NewGeography.com and is a distinguished presidential fellow in urban futures at Chapman University, and an adjunct fellow of the Legatum Institute in London. He is author of The City: A Global History. His newest book is The Next Hundred Million: America in 2050, released in February, 2010.

    Photo by wstera2.

  • California Wages War On Single-Family Homes

    In recent years, homeowners have been made to feel a bit like villains rather than the victims of hard times, Wall Street shenanigans and inept regulators. Instead of being praised for braving the elements, suburban homeowners have been made to feel responsible for everything from the Great Recession to obesity to global warming.

    In California, the assault on the house has gained official sanction. Once the heartland of the American dream, the Golden State has begun implementing new planning laws designed to combat global warming. These draconian measures could lead to a ban on the construction of private residences, particularly on the suburban fringe. The new legislation’s goal is to cram future generations of Californians into multi-family apartment buildings, turning them from car-driving suburbanites into strap-hanging urbanistas.

    That’s not what Californians want: Some 71% of adults in the state cite a preference for single-family houses. Furthermore, the vast majority of growth over the past decade has taken place not in high-density urban centers but in lower-density peripheral areas such as Riverside-San Bernardino. Yet popular preferences mean little in a state where environmental zealotry increasingly dictates how people should live their lives.

    Some advocates do cite market forces to justify their policies. Economists on the left and right have cited the recent housing bust as proof that homes are not great investments, suggesting people would be better off leaving their money to the tender mercies of Wall Street speculators. Some demographers also suggest that young people will choose to live in high-density regions throughout their lives and that as boomers age they too will opt out of suburbs for urban apartment living.

    These “facts” may be more grounded in academic mythology than reality. Some widely quoted experts, like the Anderson Forecast at UCLA, cite Census information to say that demographics are shifting demand from single-family homes to condos and apartments, although the Census asked no such question. These experts also fail to address why condo prices have dropped even more in the major California markets than single-family home prices; the percentage of starts that come from single-family houses shifts from year to year, but last year’s number tracks around the same level as seen in the 1980s.

    Perhaps the biggest weakness in the analysis lies with long-term demographic factors. As I wrote last week, many of the “young and restless” folks whom city planners try to court tend to move into suburbs and affordable low-density regions as they grow older and begin starting families. Similarly, the vast majority of boomers, according to AARP, want to remain in their old homes as long as possible. Most of those homes are located in suburban, low- to medium-density neighborhoods.

    But who needs facts when you have religion? Take the Association of Bay Area Governments (ABAG) and Metropolitan Transit Commission’s (MTC) new “sustainable communities strategy,” a document designed to meet the requirements of the state’s draconian anti-greenhouse gas legislation.

    This “strategy” seeks to all but reduce growth in the region’s lower-density outer fringe – eastern Contra Costa County as well as the Napa, Vallejo and Santa Rosa metropolitan areas — which grew more than twice as fast as the core and inner suburbs. Instead the ABAG-MTC projects a soaring increase in demand for high-density housing and its latest “vision” report calls for 97% of all the region’s future housing be built in urban areas, virtually all of it multi-family apartments, to accommodate an estimated 2 million residents

    The projections underpinning ABAG’s strategy are absurd. Over the past decade the population of the region’s historic core cites San Francisco and Oakland — where much of the dense growth would be expected to take place — increased by 1.7%, compared with 6.5% for the suburbs. Overall regional growth stood at a modest 5.1%, roughly half that of the previous decade and just about half of the national and state averages.

    Given this record, a more reasonable assumption would be population growth at something closer to 1 million, half the projected amount. Assumptions about the economy to support even this growth are also dubious. The ABAG report, for example, fantasizes that by 2030 the Bay Area will increase its employment by 900,000 — a neat trick for an area that overall lost 300,000 positions over the past decade.

    So, why wage war on the house? Some greens seem to regard the single-family house as an assault on eco-consciousness. Yet in many cases, these objections are overstated. Research supporting higher-density housing , for example, has routinely excluded the greater emissions from construction material extraction and production, building construction itself and& greenhouse gas emissions from common areas like parking levels, entrances and elevators.

    Further, higher densities are associated with greater congestion, which retards fuel efficiency and increases greenhouse gas emissions, a factor not sufficiently considered. Given that less than 10% of Bay Area residents take transit — and barely 3% in its economic engine Silicon Valley — higher density likely would create greater, not fewer, emissions.

    The ABAG report also studiously avoids mentioning the potential greenhouse gas reductions to be had by expanding telecommuting, which is growing six times faster than the fervently pushed transit commuting in the region. The Silicon Valley already has 25% more telecommuters than transit users. Clearly, by pushing telecommuting, you could get big reductions in GHG without a “cramming” agenda.

    Ultimately the density agenda reflects less a credible strategy to reduce GHG than a push among planners to “force” Californians, as one explained to me, out of their homes and into apartments. In pursuit of their “cramming” agenda planners have also enlisted powerful allies – or perhaps better understood as ”useful idiots” — developers and speculators who see profit in the eradication of the single family by forcibly boosting the value of urban core properties.

    In the end, however, substituting religion for markets and people’s preferences is counterproductive. For one thing, people “forced” to live densely will find other places to live the way they like — even if it means leaving California. This is already happening to middle class families in places like San Francisco and may soon be true of California’s traditionally middle-class-friendly interior as well.

    In the end, two markets are likely to grow in the Bay Area. One is low-end rental housing for students and an expanding servant class — after all Google millionaires need people to walk their dogs and paint their toenails. The other is luxury retirement facilities for the region’s growing population of aging affluents. Once a self-consciously “cool” youth magnet, Marin County, for example, is now one of the country’s oldest urban counties, with a median age of 44.5; San Francisco is headed in the same direction.

    Developers can drool over the prospects of building high-end assisted living joints for all those aging hippies who made their bundle during the state’s glory days and settled into places like Mill Valley. After all, unlike young families, these affluent oldsters will be able to afford indulging in the state’s mild climate, natural food restaurants and brilliant scenery. And with easily accessible medical marijuana and a good sound system for playing Grateful Dead recordings, the gray-ponytail set could be in for a hell of a good time, at least as long as it lasts.

    This piece originally appeared at Forbes.com.

    Joel Kotkin is executive editor of NewGeography.com and is a distinguished presidential fellow in urban futures at Chapman University, and an adjunct fellow of the Legatum Institute in London. He is author of The City: A Global History. His newest book is The Next Hundred Million: America in 2050, released in February, 2010.

    Photo by Mike Behnken

  • The New State of Coastal California?

    In 2009, former California legislator Bill Maze proposed dividing his state, hiving off thirteen counties as Coastal (or Western) California (see map). Maze, a conservative from the agricultural Central Valley, objects to the domination of state politics by the left-leaning Los Angeles and San Francisco metropolitan areas. The initial impetus for his proposal was the passage by state voters in 2008 of Proposition 2, requiring larger pens and cages for farm animals. Agricultural interests denounced the measure, arguing that it would increase their costs and threaten their livelihoods. Meanwhile, the state’s on-going water crisis, which largely pits farmers against environmentalists, widens the divide. Unforgiving invective marks both sides of the debate. A post in Politics Daily characterized secessionist farmers as dolts fighting against “liberal Hollywood types [who] don’t understand the importance of torturing animals.” The Downsize California website, on the other side, fulminates against coastal “radicals” who are “infatuated with nature over mankind and are sympathetic to illegals and criminals.”

    The desire to divide unwieldy California may be quixotic but it is nothing new; at least 27 divisional schemes have been proposed since statehood in 1850. Most have sought to split the state along north-south lines. In the mid 1800s, southern California secessionists felt marginalized and ill-served by a state government based in the distant Sacramento. By the mid 1900s, the tables had been turned, as northern Californians came to resent the demographically and economically dominant greater Los Angeles (LA) area. The California State Water Project, with its vast pipes snaking over the Tehachapi Mountains, was a particular irritant. As a child growing up in northern California’s Bay Area in the 1960s, I almost never heard positive statements about LA, which was widely condemned as a vast suburban wasteland inhabited by shallow people scheming to “steal our water.” Such naked regional bigotry was spouted by people who would have been ashamed to say anything remotely smacking of racial or religious prejudice.

    Economic and political evolution, coupled with substantial immigration and emigration, gradually reduced the tensions between the Los Angeles and San Francisco metropolitan areas while accentuating the division between urban coastal and interior agricultural regions. But as the 2004 “voter index map” reproduced above shows, the state’s actual political divide is far more complex than that. Close inspection reveals a Democratic voting zone essentially split between coastal northern California and the Los Angeles area, with a few interior outliers in college towns, urban cores, Hispanic rural areas, and mountainous recreation sites. Contrasting to this area is a spatially larger and more contiguous but demographically smaller Republican-voting block covering the rest of the state.

    Maze’s scheme places several relatively conservative countries (Ventura, San Luis Obispo) in liberal Coastal California, doing so largely for reasons of geographical contiguity. Less explicable is his exclusion of the left-voting northern coastal countries of Sonoma, Mendocino, and Humboldt. These may be relatively rural counties, but where the main crops are wine grapes and marijuana one should not expect conservative voting patterns. Note that certainly highly rural and relatively remote regions have solidly left electoral records, an unusual pattern. These include the Big Sur coast in Monterrey County, with its artistic heritage, and the counter-cultural “hippy” centers of Mendocino and southern Humboldt counties, such as Willits and Garberville.

    Martin W. Lewis has taught college-level geography for 20 years, and is currently a senior lecturer at Stanford University. He is a co-author on two leading textbooks in world geography, Diversity Amid Globalization and Globalization and Diversity. He is also the author of Green Delusions: An Environmentalist Critique of Radical Environmentalism, and Wagering the Land: Ritual, Capital, and Environmental Degradation in the Cordillera of Northern Luzon, and is co-author of The Myth of Continents.

  • Outlawing New Houses in California

    UCLA’s most recent Anderson Forecast indicates that there has been a significant shift in demand in California toward condominiums and apartments. The Anderson Forecast concludes that this will cause problems, such as slower growth in construction employment because building multi-unit dwellings creates less employment than building the detached houses that predominate throughout California and most of the nation. The Anderson Forecast says that this will hurt inland areas (such as the Riverside-San Bernardino area and the San Joaquin Valley) because their economies are more dependent on construction than coastal areas, such as Los Angeles, the San Francisco Bay Area and San Diego.

    Detached Housing Permits Remain Strong in the Historic Context: The Anderson Forecast reports that multi-unit building permits have recovered more quickly than building permits for detached housing. However, any such shift is likely to be highly volatile. Since the peak of the bubble, the distribution of building permits between detached and multi-unit in California has been on a roller coaster. Indeed the Anderson Forecast characterizes the "2010 US Census" as "showing a significant shift in demand toward condominiums and apartments." Actually, the 2010 US Census asked no question from which such a conclusion about housing types or any question from which such a conclusion could be drawn.

    The trends in the building permit data are not completely clear. In 2005, the year before prices started to collapse, 75 percent of building permits in California were for detached housing. This trended downward, reaching a low of 52 percent in 2008. In 2009, the detached housing recovered to account for 73 percent of all housing building permits. Then the figure fell back to 59 percent in 2010.

    With these erratic trends, it is tricky to forecast longer term market trends and consumer demand.  Economic projections in 1934 would have suffered from a similar problem, as the Great Depression was continuing and no one could really tell when it would end. Today’s continuing housing depression may be similar.

    Moreover, as the Anderson Forecast notes, detached housing construction declined in the early 1980s, dropping to 42 percent in 1985. In fact, over the 25 years between 1960 and 1985, detached houses accounted for an average of only 54 percent of new housing construction in California, well below the 2010 figure of 59 percent (Figure 1).

    Equally important, the condominium market remains in a deep depression. In 2010, less than four percent of houses built for sale in the United States were multi-unit buildings, including condominiums (Figure 2), as an increasing majority of multi-unit buildings have been built as rentals (Figure 3). Comparable California data is not available, but from the peak of the bubble (2006/7) to 2009, there was a loss of more than 3,000 owner occupied  multi-unit dwellings with 10 or more units, while owner occupied detached houses increased by nearly 100,000 (Note 1).

    If there is an intrinsic pent-up preference for condominium living, it is not evident in the poor performance of high-density developments even in such theoretically desirable places as Santa Monica, San Francisco, Oakland, San Jose and North Hollywood. Condominium prices, for example, have fallen 52 percent in the major California metropolitan areas, compared to 48 percent for single-family houses (Figure 4). Naïve developers, relying too much on the much promoted notion that suburban empty-nesters were chomping at the bit to move to new housing in the core area, often watched their empty units liquidated at $0.50 or less on the dollar or turned into rentals.  Further, if people are moving to apartments, it’s not for love of density but more likely due weakening economic circumstances.

    Inland California Continues to Grow Faster: The Anderson Forecast also suggests that growth in interior California will suffer because "workers are less likely to move inland into an apartment and commute toward the coast." This assumption of slower inland growth reflects the conventional wisdom that areas outside the large coastal metropolitan areas have stopped growing since the burst of the housing bubble as people flock towards the coastal urban core (Note 2). The reality is different, as interior California and the peripheral metropolitan areas of the larger metropolitan regions (Note 3) continue to grow more strongly even in bad economic times. After the burst of the bubble, from 2008 to 2010 (Figure 5):

    • In the Los Angeles area, the adjacent Riverside-San Bernardino ("Inland Empire") and Oxnard metropolitan areas, combined, have grown at seven times the rate of the core Los Angeles metropolitan area.
    • In the San Francisco Bay area, the adjacent Napa, Santa Cruz, Santa Rosa and Vallejo metropolitan areas, combined, have grown nearly twice as quickly as the core San Francisco and San Jose metropolitan areas.
    • California’s deep interior, the San Joaquin Valley has grown even faster than the exurban areas of Los Angeles and San Francisco.

    One key reason: most people who move to interior areas do not commute toward the core.  For example, less than 10 percent of workers in the Riverside-San Bernardino metropolitan area commute into Los Angeles County, a market share that declined 15 percent between 2000 and 2007. Many also simply cannot afford the higher cost of living in the coastal metropolitan areas, which likely will continue to retard growth in the core metropolitan areas.

    The Policy Threat to New Houses : A survey by the Public Policy Institute of California suggests a vast preference (70%) for detached housing among the state’s consumers.  This continuing preference is demonstrated by detached housing prices that are generally two times historic norms relative to incomes in the coastal metropolitan areas (Los Angeles, San Francisco, San Diego and San Jose).

    Yet now, this choice is under a concerted assault by both the state and many local governments, cheered on by most media and the academic community.  For years, planning regulations have driven land prices so high that house prices have risen to well above the rest of the nation (Figure 5) under regulations referred to by terms such as "smart growth" and "urban containment." The regulations and the inevitably resulting speculation propelled a disproportionate rise (nearly $2 trillion) in California house prices compared to national norm. If California house prices had risen at the same rate relative to incomes as in more liberally regulated areas, the loss to financial markets could have been hundreds of billions of dollars less when the bubble burst (Figure 6).

    Planning for Crowding and Density: California’s assault on detached housing is taking on a distinctly religious fervor.  The state’s global warming law (Assembly Bill 32) and urban planning law (Senate Bill 375) is providing a new basis to impose draconian limits on the construction of detached housing. For example, in the San Francisco Bay area, it has been proposed that 97 percent of new housing be built within the existing urban footprint. That would mean an emphasis on multi-unit housing and little or no new housing on the urban fringe. The option of a single family home will be all but non-existent for   even solidly middle income Californians.

    Planning authorities in the Bay Area seem oblivious to the fact that destroying affordability also destroys growth, already evident by the state’s poor economic performance and ebbing demographic vigor.    Planners rosily project 2 million more people between 2010 and 2035 in the San Francisco Bay area. The growth rate over the past 10 years suggests a number less than half that (Figure 7) and given the rapid aging of the area, even this estimate may be too high. The planners also project more than 1.2 million   new jobs, something difficult to believe given the more than 300,000 job loss (Note 4) that occurred in the Bay Area between 2000 and 2010 (Figure 8).

    The Environmental "Fig Leaf:" The environmental justification for these policies is fragile . Research supporting higher density housing has routinely excluded the greater emissions from construction material extraction and production, building construction itself and common greenhouse gas emissions from energy consumption that does not appear on consumer bills. Further, higher densities are associated slower and more erratic speeds, which retards fuel efficiency and increases greenhouse gas emissions, a factor not sufficiently considered.

    The report seems to ignore any other options besides rapid densification, which as McKinsey Global Institute has pointed out is not at all necessary to reduce GHG emission reductions. They point to other factors as more fuel efficient cars.   

    Oddly, the San Francisco Bay Area proposal does not even mention working at home (much of it telecommuting), the most environmentally friendly way of accessing employment. Working at home has grown six times the rate of transit since 2000 in the Bay Area.

    Outlawing New Houses Detached housing remains the overwhelming choice of Californians. There is no indication that this preference is about to be replaced by a preference for high-density housing.  Current and future middle class Californians could be corralled into more crowded conditions, because questionable planning doctrines mandate that detached housing should be outlawed.

    —-

    Notes:

    1. Calculated from 2006, 2007 and 2009 American Community Survey data. The over ten unit category is used because is more generally reflective of the dense condominium development generally favored by densification advocates (Latest data available).

    2.  Another questionable tenet of conventional wisdom is that the price declines in the outer suburbs were greater than in the cores. When the price declines reached their nadir, core California markets were generally at least as depressed from their peak prices as suburban markets.

    3. Metropolitan region refers to combined statistical areas, which have a core metropolitan area, such as the Los Angeles MSA and include surrounding metropolitan areas, such as the Riverside-San Bernardino MSA and the Oxnard MSA.

    4. Annual, 2000 to 2010, calculated from California Economic Development Department data.

    Lead photo: Houses in Los Angeles. Photograph by author.

    Wendell Cox is a Visiting Professor, Conservatoire National des Arts et Metiers, Paris and the author of “War on the Dream: How Anti-Sprawl Policy Threatens the Quality of Life