Tag: San Francisco

  • San Francisco’s Abundant Developable Land Supply

    The San Francisco Bay Area (home of the San Francisco and San Jose metropolitan areas), which has often been cited as a place where natural barriers have left little land for development. This is an impression easily obtained observing the fairly narrow strips of urbanization on both sides of San Francisco Bay, hemmed in by hills.

    However the Bay Area’s urbanization long ago leapt over the most important water bodies and then the Berkeley Hills to the east. Not only is the San Francisco Bay Area CSA high density, but it is also spatially small. In 2016, the San Francisco built-up urban area was only the 23rd largest in land area in the world. New York, the world’s largest built-up urban area in geographical expanse is more than four times as large.

    There is plenty of developable land in the San Francisco Bay Area. Data in a 1997 state analysis indicated that another 1,500 to 4,300 square miles (3,900 to 11,000 square kilometers) could be developed in the Bay Area CSA. The lower bound assumed no farmland conversion and stringent environmental regulation. The report also found that in recent years, residential development had become marginally denser, yet not incompatible with the detached housing remains the preference in California (Figure). The state has more than enough developable land for future housing needs.

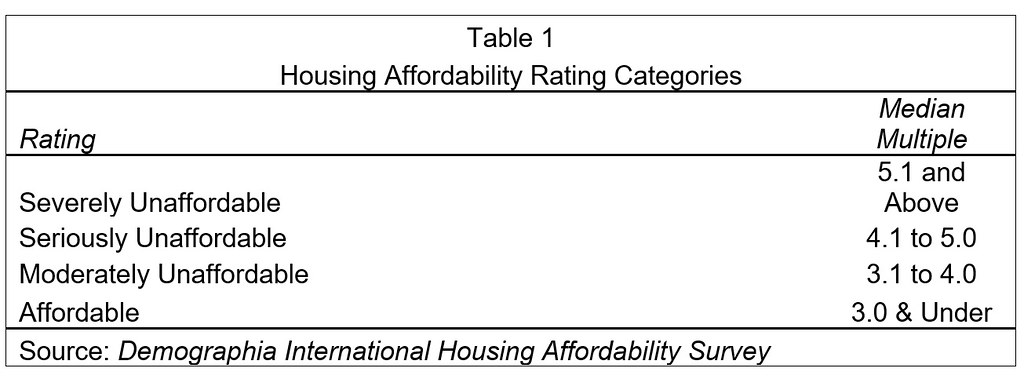
    Demographia International Housing Affordability Survey with a median multiple of 9.6 (median house price divided by median household income) and the San Francisco metropolitan area is 7th worst, with a median multiple of 9.2. Before the evolution toward urban containment policies began, the median multiples in these metropolitan areas (and virtually all in the United States) were around 3.0 or less.

    The decades old Bay Area housing affordability crisis, and that of other urban containment metropolitan areas that are now seriously unaffordable (median multiples over 5.0) seeking to force higher densities, is more the result of policy than nature.

    Note on Method: Some of the CSA urban population is not in the continuous urbanization of San Francisco-San Jose built-up urban area, such as in the Santa Rosa, Stockton and Santa Cruz urban areas. This analysis is based on data from the California Department of Housing and Community Development and the U.S. Census Bureau. It is based on an estimate of additional development occurring from 1996 to 2010 and the land remaining after deduction of recently developed land. The population capacity assumes the “marginally higher” densities used by the California Department of Housing and Community Development, which it notes would not require substantial changes in the “current form of housing development” (1997).

  • Progressive Cities: Home of the Worst Housing Inequality

    America’s most highly regulated housing markets are also reliably the most progressive in their political attitudes. Yet in terms of gaining an opportunity to own a house, the price impacts of the tough regulation mean profound inequality for the most disadvantaged large ethnicities, African-Americans and Hispanics.

    Based on the housing affordability categories used in the Demographia International Housing Affordability Survey for 2016 (Table 1), housing inequality by ethnicity is the worst among the metropolitan areas rated “severely unaffordable.” In these 11 major metropolitan area markets, the most highly regulated, median multiples (median house price divided by median household income) exceed 5.0. For African-Americans, the median priced house is 10.2 times median incomes. This is 3.7 more years of additional income than the overall average in these severely unaffordable markets, where median house prices are 6.5 times median household incomes. It is only marginally better for Hispanics, with the median price house at 8.9 times median household incomes, 2.4 years more than the average in these markets (Figure 1).

    The comparisons with the 13 affordable markets (median multiples of 3.0 and less) is even more stark. For African-American households things are much better than in the more progressive and most expensive metropolitan areas. The median house prices is equal to 4.6 years of median income, 5.5 years less than in the severely affordable markets. Moreover, for African-Americans, housing affordability is only marginally worse than the national average in the affordable market.

    Things are even better for Hispanics, who would find the median house price 3.8 times median incomes, 5.1 years less than in the severely affordable markets. This is better than the national average housing affordability.

    Among the four markets rated “seriously unaffordable,” (median multiple from 4.1 to 5.0) the inequality is slightly less, with African-Americans finding median house prices equal to 2.2 years of additional income compared to average. The disadvantage for Hispanics is 1.5 years.

    In contrast, inequality is significantly reduced in the less costly “moderately unaffordable” markets (median multiple of 3.1 to 4.0) and the “affordable” markets (median multiple of 3.0 and less).

    The discussion below describes the 10 largest and smallest housing affordability gaps for African-American and Hispanic households relative to the average household, within the particular metropolitan markets. The gaps within ethnicities compared to the affordable markets would be even more. The four charts all have the same scale (a top housing affordability gap of 10 years) for easy comparison.

    able 2 illustrates housing affordability gaps by major metropolitan areas. There are also housing affordability ranking gap tables by African-American households (Table 3) and Hispanic households (Table 4).

    Largest Housing Affordability Gaps: African American

    African-Americans have the largest housing affordability inequality gap. And these gaps are most evident in some of the nation’s most progressive cities. The largest gap is in San Francisco, where the median income African-American household faces median house prices that are 9.3 years of income more than the average. In nearby San Jose ranks the second worst, where the gap is 6.2 years. Overall, the San Francisco Bay Area suffers by far the area of least housing affordability for African-Americans compared to the average household.

    Portland, long the darling of the international urban planning community, ranks third worst, where the median income African-American household to purchase the median priced house. Milwaukee and Minneapolis – St. Paul ranked fourth and fifth worst followed by Boston, Seattle, Los Angeles, Sacramento and Chicago (Figure 2).

    Largest Housing Affordability Gaps: Hispanics

    Two of the three worst positions are occupied by the two metropolitan areas in the San Francisco Bay Area. The worst housing affordability gap for Hispanics is in San Jose, a more than one-quarter Hispanic metropolitan area where the median income Hispanic household would require 5.0 years of additional income to pay for the median priced house compared to the average. Boston ranks second worst at 3.9. San Francisco third worst at 3.3 years. Providence and New York rank fourth and fifth worst. The second five worst housing inequality for Hispanics is in San Diego, Hartford, Rochester, Philadelphia and Raleigh (Figure 3).

    The San Francisco Bay Area: “Inequality City”

    Perhaps no part of the country is more renowned for its progressive politics and politicians than the San Francisco Bay Area. Yet, in housing equality, the Bay Area is anything but progressive. If the African-American and Hispanic housing inequality measures are averaged, disadvantaged minorities face house prices that average approximately 6.25 years more years of median income in San Francisco and 5.60 more years of median income in San Jose.

    Moreover, no one should imagine that recent state law authorizing a $4 billion “affordable housing” bond election will have any significant impact. According to the Sacramento Bee, voter approval would lead to 70,000 new housing units annually, when the need for low and very low income households is 1.5 million. The bond issue would do virtually nothing for the many middle-income households who are struggling to pay the insanely high housing costs California’s regulatory nightmare has developed.

    Smallest Housing Affordability Gaps: African-American

    Tucson has the smallest housing affordability gap for African-Americans. In Tucson, the median income African-American household would pay approximately 0.4 years (four months) more in income for the median priced house than the average household. In San Antonio, Atlanta and Tampa – St. Petersburg, the housing affordability gaps are under 1.0. Houston, Riverside – San Bernardino, Virginia Beach – Norfolk, Memphis, Dallas – Fort Worth and Birmingham round out the second five. It may be surprising that eight of the metropolitan areas with the smallest housing affordability gaps for African-Americans are in the South and perhaps most surprisingly of all that one of the best, at number 10, is Birmingham. (Figure 4).

    Smallest Housing Affordability Gaps: Hispanic

    Among Hispanic households, the smallest housing affordability gap is in Pittsburgh, where the median priced house would require less than 10 days more in median income for a Hispanic household compared the overall average. In Jacksonville the housing affordability gap for Hispanics would be less than two months. In Baltimore, Birmingham, St. Louis and Cincinnati, the median house price is the equivalent of less than six months of median income for an Hispanic household. Detroit, Memphis, Virginia Beach – Norfolk and Cleveland round out the ten smallest housing affordability gaps for Hispanics (Figure 5).

    Housing Affordability is the Best for Asians

    Recent American Community Survey data indicated that Asians have median household incomes a quarter above those of White Non-– Hispanics. This advantage is also illustrated in the housing affordability data. Asians have better housing affordability than White Non-– Hispanics in 37 of the 53 major metropolitan areas (over 1 million population).

    The Importance of Housing Opportunity

    Housing opportunity is important. African-Americans and Hispanics already face challenges given their generally lower incomes. However, by no serious political philosophy, progressive or otherwise, should any ethnicity find themselves even further disadvantaged by political barriers, such as have been created by over-zealous land and housing regulators.

    Wendell Cox is principal of Demographia, an international public policy and demographics firm. He is a Senior Fellow of the Center for Opportunity Urbanism (US), Senior Fellow for Housing Affordability and Municipal Policy for the Frontier Centre for Public Policy (Canada), and a member of the Board of Advisors of the Center for Demographics and Policy at Chapman University (California). He is co-author of the “Demographia International Housing Affordability Survey” and author of “Demographia World Urban Areas” and “War on the Dream: How Anti-Sprawl Policy Threatens the Quality of Life.” He was appointed to three terms on the Los Angeles County Transportation Commission, where he served with the leading city and county leadership as the only non-elected member. He served as a visiting professor at the Conservatoire National des Arts et Metiers, a national university in Paris.

    Table 2
    Housing Affordability Gap by Ethnicity: 2016
    53 Major Metropolitan Areas (Over 1,000,000 Population)
    Median Multiple (Median house price divided by median household income)
    MSA Median Multiple: All Households Median Multiple: African-American African American Housing Affordability Gap in Years Ranked Most to Least Equal: African-American Median Multiple:
    Hispanic
    Hispanic Housing Affordability Gap in Years Ranked Most to Least Equal: Hispanic Exhibit: Median Multiple: Asian Exhibit: Median Multiple: White Non-Hispanic
       
     Atlanta, GA       2.95          3.83           0.88              3        3.65          0.70           13       2.30            2.45
     Austin, TX       4.00          5.69           1.69            19        5.04          1.04           24       3.23            3.52
     Baltimore, MD       3.29          4.75           1.46            12        3.64          0.34             3       2.60            2.83
     Birmingham, AL       3.57          4.99           1.42            10        3.96          0.39             4       2.95            3.02
     Boston, MA-NH       5.11          8.69           3.58            47        9.02          3.90           52       4.67            4.62
     Buffalo, NY       2.48          4.79           2.32            38        4.58          2.10           43       2.90            2.20
     Charlotte, NC-SC       3.47          4.95           1.47            13        4.77          1.30           32       2.31            3.08
     Chicago, IL-IN-WI       3.56          6.30           2.75            43        4.45          0.90           20       2.69            2.94
     Cincinnati, OH-KY-IN       2.53          4.70           2.17            35        2.99          0.46             6       1.75            2.33
     Cleveland, OH       2.54          4.50           1.96            27        3.17          0.63           10       1.49            2.16
     Columbus, OH       2.91          4.78           1.87            24        4.10          1.19           30       2.50            2.68
     Dallas-Fort Worth, TX       3.56          4.98           1.42              9        4.70          1.14           26       2.55            2.87
     Denver, CO       5.34          7.64           2.29            37        7.40          2.05           42       5.33            4.76
     Detroit,  MI       4.01          6.71           2.70            41        4.53          0.52             7       2.56            3.48
     Grand Rapids, MI       2.68          4.66           1.98            28        3.85          1.16           28       2.95            2.53
     Hartford, CT       3.18          4.88           1.70            20        5.48          2.29           47       2.78            2.82
     Houston, TX       3.52          4.57           1.05              5        4.68          1.15           27       2.54            2.65
     Indianapolis. IN       2.82          4.89           2.07            31        4.45          1.63           38       2.48            2.50
     Jacksonville, FL       3.71          5.15           1.43            11        3.88          0.16             2       3.32            3.38
     Kansas City, MO-KS       2.95          4.96           2.00            30        3.97          1.02           23       2.64            2.68
     Las Vegas, NV       4.37          6.36           1.98            29        5.19          0.82           16       3.63            3.85
     Los Angeles, CA       7.69        11.15           3.46            45        9.74          2.05           41       6.68            6.03
     Louisville, KY-IN       2.99          4.90           1.91            25        3.92          0.93           21       2.48            2.71
     Memphis, TN-MS-AR       3.12          4.37           1.25              8        3.68          0.56             8       2.13            2.29
     Miami, FL       5.94          7.58           1.64            17        6.64          0.70           12       4.39            4.68
     Milwaukee,WI       3.93          7.88           3.95            49        5.79          1.86           40       2.78            3.33
     Minneapolis-St. Paul, MN-WI       3.24          6.83           3.59            48        4.64          1.40           34       3.25            3.01
     Nashville, TN       3.74          5.43           1.69            18        5.04          1.30           33       3.12            3.43
     New Orleans. LA       3.85          6.42           2.57            40        5.02          1.17           29       4.01            2.93
     New York, NY-NJ-PA       5.40          7.85           2.45            39        8.22          2.82           49       4.68            4.25
     Oklahoma City, OK       2.74          4.81           2.07            32        3.62          0.88           19       2.52            2.45
     Orlando, FL       4.28          6.00           1.72            22        5.21          0.94           22       2.93            3.60
     Philadelphia, PA-NJ-DE-MD       3.42          5.69           2.28            36        5.59          2.17           45       3.02            2.82
     Phoenix, AZ       4.01          5.54           1.53            14        5.07          1.06           25       3.17            3.62
     Pittsburgh, PA       2.68          4.61           1.93            26        2.70          0.02             1       1.97            2.54
     Portland, OR-WA       5.11          9.38           4.26            50        6.69          1.57           37       4.44            4.89
     Providence, RI-MA       4.26          6.38           2.12            34        7.21          2.95           50       3.09            3.95
     Raleigh, NC       3.46          5.01           1.56            15        5.59          2.13           44       2.47            3.12
     Richmond, VA       3.74          5.44           1.70            21        4.61          0.87           18       2.75            3.14
     Riverside-San Bernardino, CA       5.38          6.55           1.16              6        6.04          0.66           11       4.04            4.85
     Rochester, NY       2.42          4.52           2.10            33        4.67          2.25           46       2.26            2.21
     Sacramento, CA       5.00          7.81           2.81            44        6.21          1.21           31       4.63            4.46
     St. Louis,, MO-IL       2.74          4.46           1.72            23        3.15          0.41             5       2.41            2.45
     Salt Lake City, UT       4.00  No data           5.49          1.49           36       3.70            3.77
     San Antonio, TX       3.69          4.43           0.74              2        4.41          0.72           15       2.89            2.86
     San Diego, CA       7.98        10.72           2.74            42      10.65          2.67           48       6.88            6.94
     San Francisco-Oakland, CA       8.67        18.01           9.33            52      11.93          3.26           51       7.96            7.29
     San Jose, CA       9.09        15.28           6.19            51      14.08          5.00           53       7.80            8.24
     Seattle, WA       5.27          8.77           3.50            46        7.02          1.74           39       4.55            5.00
     Tampa-St. Petersburg, FL       3.87          4.86           0.98              4        4.74          0.87           17       2.85            3.65
     Tucson, AZ       4.00          4.41           0.41              1        4.71          0.71           14       4.17            3.54
     Virginia Beach-Norfolk, VA-NC       3.48          4.65           1.17              7        4.11          0.63             9       2.94            3.00
     Washington, DC-VA-MD-WV       4.08          5.64           1.57            16        5.54          1.46           35       3.76            3.38
     Overall median multiple from Demographia International Housing Affordability Survey: Updated with revised income data from 2016 ACS. 
     Median multiple: Median house price divided by median household income 
    Table 3
    African-American Housing Affordability Gap Ranked: Most to Least Equal 
    53 Major Metropolitan Areas (Over 1,000,000 Population)
    Median Multiple (Median house price divided by median household income)
    MSA Median Multiple: All Households Median Multiple: African-American African American Housing Affordability Gap in Years Ranked Most to Least Equal: African-American Median Multiple:
    Hispanic
    Hispanic Housing Affordability Gap in Years Ranked Most to Least Equal: Hispanic Exhibit: Median Multiple: Asian Exhibit: Median Multiple: White Non-Hispanic
     
     Tucson, AZ       4.00          4.41           0.41              1        4.71          0.71           14       4.17            3.54
     San Antonio, TX       3.69          4.43           0.74              2        4.41          0.72           15       2.89            2.86
     Atlanta, GA       2.95          3.83           0.88              3        3.65          0.70           13       2.30            2.45
     Tampa-St. Petersburg, FL       3.87          4.86           0.98              4        4.74          0.87           17       2.85            3.65
     Houston, TX       3.52          4.57           1.05              5        4.68          1.15           27       2.54            2.65
     Riverside-San Bernardino, CA       5.38          6.55           1.16              6        6.04          0.66           11       4.04            4.85
     Virginia Beach-Norfolk, VA-NC       3.48          4.65           1.17              7        4.11          0.63             9       2.94            3.00
     Memphis, TN-MS-AR       3.12          4.37           1.25              8        3.68          0.56             8       2.13            2.29
     Dallas-Fort Worth, TX       3.56          4.98           1.42              9        4.70          1.14           26       2.55            2.87
     Birmingham, AL       3.57          4.99           1.42            10        3.96          0.39             4       2.95            3.02
     Jacksonville, FL       3.71          5.15           1.43            11        3.88          0.16             2       3.32            3.38
     Baltimore, MD       3.29          4.75           1.46            12        3.64          0.34             3       2.60            2.83
     Charlotte, NC-SC       3.47          4.95           1.47            13        4.77          1.30           32       2.31            3.08
     Phoenix, AZ       4.01          5.54           1.53            14        5.07          1.06           25       3.17            3.62
     Raleigh, NC       3.46          5.01           1.56            15        5.59          2.13           44       2.47            3.12
     Washington, DC-VA-MD-WV       4.08          5.64           1.57            16        5.54          1.46           35       3.76            3.38
     Miami, FL       5.94          7.58           1.64            17        6.64          0.70           12       4.39            4.68
     Nashville, TN       3.74          5.43           1.69            18        5.04          1.30           33       3.12            3.43
     Austin, TX       4.00          5.69           1.69            19        5.04          1.04           24       3.23            3.52
     Hartford, CT       3.18          4.88           1.70            20        5.48          2.29           47       2.78            2.82
     Richmond, VA       3.74          5.44           1.70            21        4.61          0.87           18       2.75            3.14
     Orlando, FL       4.28          6.00           1.72            22        5.21          0.94           22       2.93            3.60
     St. Louis,, MO-IL       2.74          4.46           1.72            23        3.15          0.41             5       2.41            2.45
     Columbus, OH       2.91          4.78           1.87            24        4.10          1.19           30       2.50            2.68
     Louisville, KY-IN       2.99          4.90           1.91            25        3.92          0.93           21       2.48            2.71
     Pittsburgh, PA       2.68          4.61           1.93            26        2.70          0.02             1       1.97            2.54
     Cleveland, OH       2.54          4.50           1.96            27        3.17          0.63           10       1.49            2.16
     Grand Rapids, MI       2.68          4.66           1.98            28        3.85          1.16           28       2.95            2.53
     Las Vegas, NV       4.37          6.36           1.98            29        5.19          0.82           16       3.63            3.85
     Kansas City, MO-KS       2.95          4.96           2.00            30        3.97          1.02           23       2.64            2.68
     Indianapolis. IN       2.82          4.89           2.07            31        4.45          1.63           38       2.48            2.50
     Oklahoma City, OK       2.74          4.81           2.07            32        3.62          0.88           19       2.52            2.45
     Rochester, NY       2.42          4.52           2.10            33        4.67          2.25           46       2.26            2.21
     Providence, RI-MA       4.26          6.38           2.12            34        7.21          2.95           50       3.09            3.95
     Cincinnati, OH-KY-IN       2.53          4.70           2.17            35        2.99          0.46             6       1.75            2.33
     Philadelphia, PA-NJ-DE-MD       3.42          5.69           2.28            36        5.59          2.17           45       3.02            2.82
     Denver, CO       5.34          7.64           2.29            37        7.40          2.05           42       5.33            4.76
     Buffalo, NY       2.48          4.79           2.32            38        4.58          2.10           43       2.90            2.20
     New York, NY-NJ-PA       5.40          7.85           2.45            39        8.22          2.82           49       4.68            4.25
     New Orleans. LA       3.85          6.42           2.57            40        5.02          1.17           29       4.01            2.93
     Detroit,  MI       4.01          6.71           2.70            41        4.53          0.52             7       2.56            3.48
     San Diego, CA       7.98        10.72           2.74            42      10.65          2.67           48       6.88            6.94
     Chicago, IL-IN-WI       3.56          6.30           2.75            43        4.45          0.90           20       2.69            2.94
     Sacramento, CA       5.00          7.81           2.81            44        6.21          1.21           31       4.63            4.46
     Los Angeles, CA       7.69        11.15           3.46            45        9.74          2.05           41       6.68            6.03
     Seattle, WA       5.27          8.77           3.50            46        7.02          1.74           39       4.55            5.00
     Boston, MA-NH       5.11          8.69           3.58            47        9.02          3.90           52       4.67            4.62
     Minneapolis-St. Paul, MN-WI       3.24          6.83           3.59            48        4.64          1.40           34       3.25            3.01
     Milwaukee,WI       3.93          7.88           3.95            49        5.79          1.86           40       2.78            3.33
     Portland, OR-WA       5.11          9.38           4.26            50        6.69          1.57           37       4.44            4.89
     San Jose, CA       9.09        15.28           6.19            51      14.08          5.00           53       7.80            8.24
     San Francisco-Oakland, CA       8.67        18.01           9.33            52      11.93          3.26           51       7.96            7.29
     Salt Lake City, UT       4.00  No data         5.49          1.49           36       3.70            3.77
     Overall median multiple from Demographia International Housing Affordability Survey: Updated with revised income data from 2016 ACS. 
     Median multiple: Median house price divided by median household income 
    Table 4
    Hispanic Housing Affordability Gap Ranked: Most to Least Equal 
    53 Major Metropolitan Areas (Over 1,000,000 Population)
    Median Multiple (Median house price divided by median household income)
    MSA Median Multiple: All Households Median Multiple: African-American African American Housing Affordability Gap in Years Ranked Most to Least Equal: African-American Median Multiple:
    Hispanic
    Hispanic Housing Affordability Gap in Years Ranked Most to Least Equal: Hispanic Exhibit: Median Multiple: Asian Exhibit: Median Multiple: White Non-Hispanic
       
     Pittsburgh, PA       2.68          4.61           1.93            26        2.70          0.02             1       1.97            2.54
     Jacksonville, FL       3.71          5.15           1.43            11        3.88          0.16             2       3.32            3.38
     Baltimore, MD       3.29          4.75           1.46            12        3.64          0.34             3       2.60            2.83
     Birmingham, AL       3.57          4.99           1.42            10        3.96          0.39             4       2.95            3.02
     St. Louis,, MO-IL       2.74          4.46           1.72            23        3.15          0.41             5       2.41            2.45
     Cincinnati, OH-KY-IN       2.53          4.70           2.17            35        2.99          0.46             6       1.75            2.33
     Detroit,  MI       4.01          6.71           2.70            41        4.53          0.52             7       2.56            3.48
     Memphis, TN-MS-AR       3.12          4.37           1.25              8        3.68          0.56             8       2.13            2.29
     Virginia Beach-Norfolk, VA-NC       3.48          4.65           1.17              7        4.11          0.63             9       2.94            3.00
     Cleveland, OH       2.54          4.50           1.96            27        3.17          0.63           10       1.49            2.16
     Riverside-San Bernardino, CA       5.38          6.55           1.16              6        6.04          0.66           11       4.04            4.85
     Miami, FL       5.94          7.58           1.64            17        6.64          0.70           12       4.39            4.68
     Atlanta, GA       2.95          3.83           0.88              3        3.65          0.70           13       2.30            2.45
     Tucson, AZ       4.00          4.41           0.41              1        4.71          0.71           14       4.17            3.54
     San Antonio, TX       3.69          4.43           0.74              2        4.41          0.72           15       2.89            2.86
     Las Vegas, NV       4.37          6.36           1.98            29        5.19          0.82           16       3.63            3.85
     Tampa-St. Petersburg, FL       3.87          4.86           0.98              4        4.74          0.87           17       2.85            3.65
     Richmond, VA       3.74          5.44           1.70            21        4.61          0.87           18       2.75            3.14
     Oklahoma City, OK       2.74          4.81           2.07            32        3.62          0.88           19       2.52            2.45
     Chicago, IL-IN-WI       3.56          6.30           2.75            43        4.45          0.90           20       2.69            2.94
     Louisville, KY-IN       2.99          4.90           1.91            25        3.92          0.93           21       2.48            2.71
     Orlando, FL       4.28          6.00           1.72            22        5.21          0.94           22       2.93            3.60
     Kansas City, MO-KS       2.95          4.96           2.00            30        3.97          1.02           23       2.64            2.68
     Austin, TX       4.00          5.69           1.69            19        5.04          1.04           24       3.23            3.52
     Phoenix, AZ       4.01          5.54           1.53            14        5.07          1.06           25       3.17            3.62
     Dallas-Fort Worth, TX       3.56          4.98           1.42              9        4.70          1.14           26       2.55            2.87
     Houston, TX       3.52          4.57           1.05              5        4.68          1.15           27       2.54            2.65
     Grand Rapids, MI       2.68          4.66           1.98            28        3.85          1.16           28       2.95            2.53
     New Orleans. LA       3.85          6.42           2.57            40        5.02          1.17           29       4.01            2.93
     Columbus, OH       2.91          4.78           1.87            24        4.10          1.19           30       2.50            2.68
     Sacramento, CA       5.00          7.81           2.81            44        6.21          1.21           31       4.63            4.46
     Charlotte, NC-SC       3.47          4.95           1.47            13        4.77          1.30           32       2.31            3.08
     Nashville, TN       3.74          5.43           1.69            18        5.04          1.30           33       3.12            3.43
     Minneapolis-St. Paul, MN-WI       3.24          6.83           3.59            48        4.64          1.40           34       3.25            3.01
     Washington, DC-VA-MD-WV       4.08          5.64           1.57            16        5.54          1.46           35       3.76            3.38
     Salt Lake City, UT       4.00  No data           5.49          1.49           36       3.70            3.77
     Portland, OR-WA       5.11          9.38           4.26            50        6.69          1.57           37       4.44            4.89
     Indianapolis. IN       2.82          4.89           2.07            31        4.45          1.63           38       2.48            2.50
     Seattle, WA       5.27          8.77           3.50            46        7.02          1.74           39       4.55            5.00
     Milwaukee,WI       3.93          7.88           3.95            49        5.79          1.86           40       2.78            3.33
     Los Angeles, CA       7.69        11.15           3.46            45        9.74          2.05           41       6.68            6.03
     Denver, CO       5.34          7.64           2.29            37        7.40          2.05           42       5.33            4.76
     Buffalo, NY       2.48          4.79           2.32            38        4.58          2.10           43       2.90            2.20
     Raleigh, NC       3.46          5.01           1.56            15        5.59          2.13           44       2.47            3.12
     Philadelphia, PA-NJ-DE-MD       3.42          5.69           2.28            36        5.59          2.17           45       3.02            2.82
     Rochester, NY       2.42          4.52           2.10            33        4.67          2.25           46       2.26            2.21
     Hartford, CT       3.18          4.88           1.70            20        5.48          2.29           47       2.78            2.82
     San Diego, CA       7.98        10.72           2.74            42      10.65          2.67           48       6.88            6.94
     New York, NY-NJ-PA       5.40          7.85           2.45            39        8.22          2.82           49       4.68            4.25
     Providence, RI-MA       4.26          6.38           2.12            34        7.21          2.95           50       3.09            3.95
     San Francisco-Oakland, CA       8.67        18.01           9.33            52      11.93          3.26           51       7.96            7.29
     Boston, MA-NH       5.11          8.69           3.58            47        9.02          3.90           52       4.67            4.62
     San Jose, CA       9.09        15.28           6.19            51      14.08          5.00           53       7.80            8.24
     
     Overall median multiple from Demographia International Housing Affordability Survey: Updated with revised income data from 2016 ACS. 
     Median multiple: Median house price divided by median household income 


    Photograph: San Francisco Bay Area: Where metropolitan housing opportunity is most unequal
    https://upload.wikimedia.org/wikipedia/commons/archive/d/dc/200609291846…

  • The Precariat Shoppe

    The precariat is a term coined to describe the segment of the population that lives without security or predictability. These days it often refers to the former American middle class that’s currently experiencing reduced circumstances. There’s always been a precariat, but it usually includes a minor subset of the population that no one really likes or cares about. Indentured Irish servants, black slaves, Jewish and Italian sweatshop workers, Mexican field hands, Puerto Rican cleaning ladies… It’s a long list. People are up in arms now because the “wrong people” have fallen in to the precariat that didn’t used to “belong” there. There’s been a sudden realization that sometimes the structure of the economy itself institutionalizes their personal decline. Shocking! I’m not a political animal so I’ll leave those discussions to others to hash out. Instead, I’m interested in how people adapt to the circumstances they find themselves in.

    We’re all familiar with the ice cream man whose truck rolls around with the happy music playing on hot summer days. This one is in Detroit – and it’s an ice cream lady. She bought an old delivery vehicle, did a bit of hand painting, fitted it with chest freezers, and opened for business. It’s a fast, low cost, and flexible way to get a business off the ground even in the most challenging economic environments.

    The ubiquitous food truck fills the gap between the cost, complexity, and risk of opening a brick and mortar restaurant vs. working for someone else. A well constructed food truck isn’t necessarily cheap, but it’s within the reach of many more people than anything in a building. This one is in Los Angeles.

    Here’s a twist on the mobile shop theme that’s a direct result of rising commercial rents. This woman ran a successful second hand clothing boutique for many years and was driven out when her shop rent hit $5,400 a month. You have to sell a lot of schmatta to make that nut. Now she follows various fairs and pubic gatherings with her merchandise in a repurposed school bus. She goes directly to where her customers are most likely to find her. As I’ve heard many times from shopkeepers around the world – it’s not how much money you earn, it’s how much you have left over after all the thieves are paid.

    Here’s a mobile veterinary clinic. Dogs, cats, horses… As the cost of a medical degree, insurance, and real estate have skyrocketed even doctors are taking a long hard look at the whole medical office building situation. The transition from a practice with a full team of professionals to a solo gig in a tricked out custom van can be described as a positive lifestyle change, but it’s almost certainly about money.

    I stumbled on this mobile grocery store complete with fresh produce, real bread, and dairy products. The offerings and prices were substantially better than what can be found at the alternative in this location – a classic food desert where people without access to a car have little choice but to buy low quality industrial food-like products at inflated prices at gas stations.

    Down the street I found a similar grocery truck. I chatted with the family that runs the business. There was a need in the community to bring in groceries as well as an opportunity to make money. The usual chain stores on the main arterial road don’t always work well for either customers or potential shopkeepers. The trucks do. They arrive exactly when and where they’re needed and stock what people want. I noticed health department certificates and Weights and Measures seals. Both trucks were Grade A.

    Here’s a mobile woodworker’s tool shop. These are specialty items not typically found in most hardware stores. This man has a relationship with various brick and mortar lumber yards who find his presence good for business. Social media alerts customers of his schedule. Mobile shops have the ability to specialize and cover a wider territory more economically than a stationary establishment burdened with overhead and a limited static customer base.

    The irony here is that all around the parking lots that host occasional mobile vendors are empty buildings that once housed chain pharmacies, banks, and such. Sometimes new buildings are constructed to house updated versions of the same stores in the same town. Sometimes there’s simply less need for physical operations as activity migrates to the interwebs. But repurposing the vacated spaces is hard. The size, configuration, and cost of these places is fundamentally at odds with the creation of new small scale mom and pop enterprises. The numbers don’t add up. I’ve had nearly everyone I talked to tell me some version of the same story. The combination of expenses, regulations, and the culture of distant corporate management is all agressively hostile to their efforts. And taking on a single employee is often the difference between making money and failing within the first year.

    Here’s one example of the challenges of opening a brick and mortar shop even if you have a generous budget. A prosperous California winery decided to open a tasting room in town to promote its products. The building had been a family paint store since the 1950s. The 2008 financial crash forced it to close. The new owners gave the old nondescript concrete block building a designer facelift. But it was a bumpy road. The climate controlled warehouse in the back was subject to a design review board that spent months rejecting the proposed color of the structure. White was preferred by the owner since it reflected heat most effectively. Evidently pure white was not in keeping with the character of the community. There was a back and forth with the oversight committee over various shades of off white, beige, and creme anglaise. Each time the committee rejected a color the process had to start all over again which delayed the opening of the shop by several weeks – which all costs money.

    The fire marshal insisted on the installation of this bit of plumbing that cost $65,000. I can’t think of anything more flammable than 1950s era paint – not even wine – yet somehow the building managed not to burn for sixty odd years. But no new business could open in this spot until this valve was installed. And then there was the requirement that each seat and stool in the tasting room have a corresponding parking spot on site while not interfering with the ability of a giant fire truck to completely encircle the entire property.

    Here’s the other end of the spectrum. A mother and daughter sell cold drinks at a busy bus stop from an ice chest. Totally ADA compliant!

    But the award for creative entrepreneurial capitalism goes to this mobile video game kiosk that regularly parks outside a San Francisco bar on weekend evenings. Comfortably liquified patrons settle in to folding chairs and play electronic games on the sidewalk. Free! (But please keep the tips coming.) It’s been in the same spot for so long the bar owners must not mind. This is how you work a side hustle when you’re part of the precariat.

    This piece first appeared on Granola Shotgun.

    John Sanphillippo lives in San Francisco and blogs about urbanism, adaptation, and resilience at granolashotgun.com. He’s a member of the Congress for New Urbanism, films videos for faircompanies.com, and is a regular contributor to Strongtowns.org. He earns his living by buying, renovating, and renting undervalued properties in places that have good long term prospects. He is a graduate of Rutgers University.

  • Meet Marble

    I’ve lived in this neighborhood for so long that I’ve grown used to tech start ups beta testing their schemes on my doorstep. I remember the first time I saw a car drive by with a huge furry pink mustache strapped to the front grill between the headlights. That was the start of Lyft. I have a clear memory from 2008 when a friend rented her apartment out on a new internet platform. That was Airbnb. Back in the late 1990s during the dot com bubble there was a start up that would deliver everything from milk to condoms via bicycle courier.

    Meet Marble. This little pushcart size machine is launching the next generation of tech based business models. It’s using fine grained real time lidar navigation so autonomous machines can learn to negotiate the city “on foot.”

    The initial concept is for robots to deliver Chinese food to your door. My guess is that Marble’s electronic pizza boy is just the first baby step to much larger and more lucrative contracts. The postal service, private package delivery systems, and utility meter readers will ultimately save billions on labor by switching to such machines. See also city parking enforcement. Meter maids will go the way of buggy whips. Humans and their endless need for salaries, medical insurance, pensions, and workers compensation will melt away.

    New jobs will be created around the production, maintenance, and management of these new systems of course. But there’s the tricky business of getting people who are qualified to deliver pastrami sandwiches or check VIN numbers to craft algorithms – especially when a lot of this work can be done remotely from anywhere on the planet. Don’t expect the people who clean and reload these machines to get paid enough to rent a studio apartment anywhere near the Bay Area. Oh, wait. There’s an automated system that will do that too…

    We don’t have a technology problem. We have a societal distribution problem. These trends are going to make an ever larger proportion of the population redundant. Wealth has not and will not “trickle down.” Instead it will continue to concentrate into specific hands in particular geographic locations. Focusing on the technology itself is a mistake. The challenge is to create a culture and a political framework where everyone has the opportunity to enjoy the benefits of these shifts. History tells us that existing institutions don’t self reform. They fail and are replaced by entirely new systems. From where I’m looking that process has already begun and it ain’t gonna be pretty.

    This piece first appeared on Granola Shotgun.

    John Sanphillippo lives in San Francisco and blogs about urbanism, adaptation, and resilience at granolashotgun.com. He’s a member of the Congress for New Urbanism, films videos for faircompanies.com, and is a regular contributor to Strongtowns.org. He earns his living by buying, renovating, and renting undervalued properties in places that have good long term prospects. He is a graduate of Rutgers University.

  • Can California Survive a Tech Bust?

    California’s economic revival has sparked widespread notions, shared by Jerry Brown and observers elsewhere, that its economy — and policy agenda — should be adopted by the rest of the country. And, to be sure, the Golden State has made a strong recovery in the last five years, but this may prove to be far more vulnerable than its boosters imagine.

    The driver of the latest California “comeback,” the Silicon Valley-San Francisco tech boom, is beginning to slow in terms of both job growth and startup activity. The most recent job numbers, notes Chapman University economist Jim Doti, show that employment growth in the information sector has slowed over the past year from almost 10 percent to under 2 percent. Particularly hard-hit is high-tech startup formation, which is down by almost half from just two years ago.

    This slowdown extends also to the professional business services sector, which has become increasingly intertwined with tech. In a recent survey of professional business service growth for Forbes magazine, economist Mike Shires and I found that last year Silicon Valley and San Francisco growth rates were considerably lower than those in boomtowns such as Nashville, Tenn.; Dallas, San Antonio and Austin, Texas; Orlando, Fla.; Salt Lake City and Charlotte, N.C. With the exception of Orange County, the rest of Southern California performed below the national average.

    The historical perspective

    Historically, California’s great strength was the diversity of its economy, stretching from high-tech and aerospace to finance, entertainment, energy, basic manufacturing and homebuilding. Yet, during the most recent boom, the growth of high-wage job growth largely took place in one region — the Bay Area — while other sectors generally stagnated or shrank.

    Silicon Valley and its urban annex, San Francisco, have brilliantly expanded the scope of the digital revolution. Google and Apple have become the world’s most valuable companies, and the Valley, along with Puget Sound in the state of Washington, account for four of the 10 wealthiest people on the planet, and virtually all of the self-made billionaires under 40.

    This success has masked greater problems in the rest of the state. Southern California, home to over half the state’s population, has seen only modest high-wage job growth, both in tech and business services, since 2000.

    Read the entire piece at The Orange County Register.

    Joel Kotkin is executive editor of NewGeography.com. He is the Roger Hobbs Distinguished Fellow in Urban Studies at Chapman University and executive director of the Houston-based Center for Opportunity Urbanism. His newest book is The Human City: Urbanism for the rest of us. He is also author of The New Class ConflictThe City: A Global History, and The Next Hundred Million: America in 2050. He lives in Orange County, CA.

    Photo by Coolcaesar at the English language Wikipedia [GFDL or CC-BY-SA-3.0], via Wikimedia Commons

  • Is California About to Clobber Local Control?

    The gradual decimation of local voice in planning has become accepted policy in Sacramento. The State Senate is now considering two dangerous bills, SB 35 and SB 167, that together severely curtail democratic control of housing.

    SB 35: Housing Accountability and Affordability Act (Wiener)

    SB 35, the brainchild of San Francisco State Senator Scott Wiener, would force cities that haven’t met all their state-mandated Regional Housing Need Allocations to give by-right approval to infill market-rate housing projects with as little as 10% officially affordable housing. 

    SB 35 is anti-free speech and civic engagement. No public hearings, no environmental review, no negotiation over community benefits. Just “ministerial,” i.e., over-the-counter- approval.

    SB 35 is pro-gentrification. As a statewide coalition of affordable housing advocacy organizations has written:

    Since almost no local jurisdiction in the State of California meets 100% of its market rate RHNA goal on a sustained basis, this bill essentially ensures by-right approval for market-rate projects simply by complying with a local inclusionary requirement [for affordable housing] or by building 10% affordable units.

    The practical result is that all market rate infill development in most every city in California will be eligible for by-right approval per this SB 35-proposed State law pre-emption.

    Berkeley Housing Commissioner Thomas Lord also has pointed out, the RHNA program itself is a pro-gentrification policy. It follows that passage of SB 35 would further inflate real estate values and worsen the displacement of economically vulnerable California residents.

    SB 35 is pro-traffic congestion. It would prohibit cities from requiring parking in a “streamlined development approved pursuant” to SB  35, located within a half-mile of public transit, in an architecturally and historically significant historic district, when on-street parking permits are required but not offered to the occupants of the project, and when there is a car share vehicle located within one block of the development. Other projects approved under the measure would be limited to one space per unit.

    Absent the provision of ample new public transit, the prohibition of parking in new development will worsen neighborhood traffic problems. SB 35 says nothing about new transit.

    The construction of on-site parking is expensive, up to $50,000 a space. A measure that exempts new development, as designated above, from including parking without requiring developers to transfer the savings to affordable housing is a giveaway to the real estate industry.

    Nor does SB 35 say anything about funding the amount of infrastructure and local services—fire and police, schools, parks—that would be required by the massive amount of development it mandates. Are local jurisdictions expected to foot the bill?

    The lineup of SB’s supporters and opponents reveals serious splits in the state’s environmental and affordable housing advocates. SB 35 has revealed serious splits among advocates for both environmental protection and affordable housing.

    Supporters include Bay Area Council, the lobby shop of the Bay Area’s biggest employers; BAC’s Silicon Valley counterpart, the Silicon Valley Leadership Group; the San Francisco and LA Chambers of Commerce; the Council of Infill Builders; several nonprofit housing organizations, including the Non-Profit Housing Association of Northern California and BRIDGE Housing; the Natural Resources Defense Council; the California League of Conservation Voters; and a panoply of YIMBY groups, including East Bay Forward and YIMBY Action.

    Opponents include the Sierra Club; the League of California Cities; the Council of Community Housing Organizations; the California Fire Chiefs Association; the Fire Districts Association of California; a handful of cities, including Hayward, Pasadena, and Santa Rosa; the Marin County Council of Mayors and Councilmembers; and many building trades organizations, including IBEW Locals 1245, 18, 465 and 551, and the Western States Council of Sheet Metal Workers.

    SB 167: Housing Accountability Act (Skinner)

    This bill, introduced by State Senator Nancy Skinner, who represents Berkeley and other East Bay cities, and sponsored by the Bay Area Renters Federation (BARF), is a companion to SB 35. It would prohibit cities from disapproving a housing project containing units affordable to very low-, low- or moderate-income renters, or conditioning the approval in a manner that renders the project financially infeasible, unless, among other things, the city has met or exceeded its share of regional housing needs for the relevant income category. (As of November 2016, HUD defined a moderate-income household of four people in Alameda County as one earning under $112,300 a year.)

    The bill defines a “feasible” project as one that is “capable of being accomplished in a successful manner within a reasonable period of time, taking into account economic environmental, social, and technological factors.” It does not define “successful” or “reasonable.”

    If a city does disapprove such a project, it is liable to a minimum fine of $1,000 per unit of the housing development project, plus punitive damages, if a court finds that the local jurisdiction acted in bad faith.

    SB 167 authorizes the project applicant, a person who would be eligible to apply for residency in the development or emergency shelter, or a housing organization, to sue the jurisdiction to enforce SB 167’s provisions. The bill defines a housing organization as

    a trade or industry group whose local members are primarily engaged in the construction or management of housing units or a nonprofit organization whose mission includes providing or advocating for increased access to housing for low-income households and have filed written or oral comments with the local agency prior to action on the housing development project [emphasis added].

    The highlighted passage was added to the existing Housing Accountability Act to encompass BARF’s legal arm, the California Renters Legal Advocacy and Education Fund (CaRLA), whose lawsuit of Lafayette recently failed. Last week CaRLA re-instituted its lawsuit of Berkeley over the city’s rejection of a project at 1310 Haskell.

    SB 167 further amends the existing Housing Accountability Act to entitle successful plaintiffs to “reasonable attorney’s fees and costs.”

    Predictably, the bill is supported by the Bay Area Council, the lobby shop for the region’s largest employers; the California Building Industry Association; the Terner Center at UC Berkeley; the San Francisco Housing Action Coalition; and YIMBY groups, including East Bay Forward, Abundant Housing LA, and of course CaRLA.

    Opponents include the California Association of Counties and the American Planning Association.

    If these bills—especially SB 35—become law, Californians will have lost a good deal of their right to a say the life and governance of the communities in which they live.

    This piece was first published in Berkeley Daily Planet and Marin Post.

    Zelda Bronstein, a journalist and a former chair of the Berkeley Planning Commission, writes about politics and culture in the Bay Area and beyond.

  • Bay Area Residents (Rightly) Expect Traffic to Get Worse

    In a just released poll by the Bay Area Council a majority of respondents indicated an expectation that traffic congestion in the Bay Area (the San Jose-San Francisco combined statistical area) is likely to get worse.

    It is already bad enough. The Bay Area includes two major urban areas (over 1,000,000 population), with San Francisco ranked second worst in traffic congestion in the United States, closely following Los Angeles. In San Francisco, the average travel time during peak travel hours was reported to be 41 percent worse due to traffic congestion, according to the 2015 Annual Mobility Report from the Texas A&M Transportation Institute. That means a trip that would normally take 30 minutes without congestion stretches to 42 minutes. Los Angeles is only slightly worse, where the travel time congestion penalty is 43 percent. In the adjacent and smaller San Jose urban area, congestion adds 38 percent to travel times, tying with Seattle as third worst in the nation.

    According to a Mercury News article by George Avalos, “The Bay Area’s traffic woes are so severe that more than two-thirds of the region’s residents surveyed in a new poll are demanding a major investment to fix the mess — even if that means stomaching higher taxes.” Residents perceive the problem as an “emergency that requires drastic solutions,” and 70 percent of those asked support a “major regional investment” to improve traffic.

    Those who expect traffic congestion to get worse are probably right. Public policies in California and the Bay Area virtually require it. For example, the state has proposed a “road diet” program that would place significant barriers in the way of highway capacity expansion. Without capacity expansion, traffic is likely to only get worse.

    The regional transportation plan (Plan Bay Area), adopted by the Association of Bay Area Governments and the Metropolitan Transportation Commission, seeks significant densification (called “pack and stack” by critics). Should the plan succeed, you can bank on traffic congestion getting even worse. It is no coincidence that Los Angeles, San Francisco and San Jose have the worst traffic congestion in the nation. They are also the nation’s three densest urban areas. Indeed, higher densities are associated with greater traffic congestion.

    There are, of course, things that can be done. But no one in the Bay Area should suspect that California, with its present policies, is up to the job.

    Take, for example, the newly announced plan by Governor Brown and legislative leaders to spend $52 billion over the next 10 years on transportation, much of it on roads. The program would require the largest increase in the state’s gasoline tax and vehicle fees in history. It will all go to repairs and maintenance, which are necessary, and to transit, walking and bike infrastructure. Yet, according to press reports, it contains nothing for the highway capacity expansions required for serious congestion relief.

    It is a sad commentary that the state has been deferring maintenance on the roads that carry more than 98 percent of the state’s surface (non-airline) travel, while continuing to pursue a mixed conventional-high- speed rail proposal that, at the moment, is set to cost $64 billion. If ever finished, it will probably cost much more and will be lucky to carry even one percent of California travel (See note).

    Some may romantically anticipate that transit can substitute for the automobile and reduce traffic congestion. This is fantasy, as the US experience with urban rail proves. For the most part, transit cannot get you from here to there in the modern metropolitan area. In the Bay Area, the average commuter using transit can reach only 3.5 percent of the jobs in 30 minutes in the San Francisco metropolitan area and 2.0 percent of the jobs in the San Jose metropolitan area (according to the University of Minnesota Accessibility Laboratory). Even with a 60-minute commute, the share of jobs accessible in both areas is only about 20 percent. Even where transit is most intense in the San Francisco Bay Area, the average commuter can reach 16 times as many jobs in 30 minutes and eight times as many in 60 minutes (Figures 1 and 2). That is not to minimize the value of transit, which carries 50 percent of commuters to the nation’s six largest downtown areas (New York, Chicago, Philadelphia, San Francisco, Boston and Washington). But in each of these metropolitan areas the overwhelming percentage of jobs are outside downtowns, where the overwhelming share of commuting is by car.

    The hope of some planners that traffic will get so bad people will switch to transit requires service that takes people where they want to go. They must still be wondering why people persist in driving their cars that take them where they need to go instead of switching to transit that takes them where planners would like them to go. Of course, the reality is that transit provides little mobility beyond the urban core and cannot be made to do so at any reasonable cost.

    The bottom line is that traffic congestion can get considerably worse. In Bangkok and Mexico City, traffic congestion is at least 70 percent worse than in the Bay Area, according to the Tom Tom Traffic Index. This is despite much lower automobile ownership rates.

    The survey indicated another alternative for those who really cannot stand the Bay Area’s unbearable and worsening traffic congestion. Move. The Bay Area Council found that 40 percent of respondents and 46 percent of Millennials are considering moving from the area in the next few years.

    Indeed, that is beginning to happen. After a five-year respite in the Bay Area’s substantial net domestic out-migration, 26,000 more people left than arrived in 2016. The big loser was Santa Clara County (a net loss of 21,000), while San Francisco County (city) lost 7,000. Between 2000 and 2009, the Bay Area had lost more than 500,000 net domestic migrants.

    For the millions who will remain in the Bay Area, however, moving is not a solution. Of course, a dawn of reason could occur among the leadership of California and the Bay Area, in which ideologically preferred solutions are replaced by practical strategies that work. Things will probably have to get much worse for the public to demand that.

    Note: See my co-authored reports with Joseph Vranich, The California High Speed Rail Proposal: A Due Diligence Report (2008), and California High Speed Rail: An Updated Due Diligence Report (2012).

    Wendell Cox is principal of Demographia, an international public policy and demographics firm. He is a Senior Fellow of the Center for Opportunity Urbanism (US), Senior Fellow for Housing Affordability and Municipal Policy for the Frontier Centre for Public Policy (Canada), and a member of the Board of Advisors of the Center for Demographics and Policy at Chapman University (California). He is co-author of the “Demographia International Housing Affordability Survey” and author of “Demographia World Urban Areas” and “War on the Dream: How Anti-Sprawl Policy Threatens the Quality of Life.” He was appointed to three terms on the Los Angeles County Transportation Commission, where he served with the leading city and county leadership as the only non-elected member. He served as a visiting professor at the Conservatoire National des Arts et Metiers, a national university in Paris.

    Photo: City of San Francisco (by author)

  • King Tide

    10,000 years ago San Francisco Bay was a dry grassy valley populated by elephants, zebras, and camels. The planet was significantly cooler and dryer back then. Sea level was lower since glaciers in the north pulled water out of the oceans. The bay isn’t that deep so a relatively small change in sea level pushed the coastline out by twelve miles from its present location. Further back in pre-history when the earth was warmer than today sea level was higher. The hills of San Francisco were small islands off the coast of ancient California.

    screen-shot-2017-01-15-at-5-10-06-am

    screen-shot-2017-01-15-at-5-10-51-am

    These cycles play out on a scale we humans can’t perceive in our daily lives. You can think of this process as a larger version of the tides that play out over thousands of years instead of twice a day. There’s absolutely no need to debate human induced climate change. The climate changes all the time with or without us. The real question is how we will adapt over time.

    screen-shot-2017-01-15-at-9-19-21-pm

    screen-shot-2017-01-15-at-9-20-26-pm

    screen-shot-2017-01-15-at-9-21-47-pm

    screen-shot-2017-01-15-at-9-22-13-pm

    In the last century the majority of what was once low lying wetlands around the bay were filled and built upon. Airports, shipping terminals, oil refineries, housing developments, and industrial parks are sitting on landfill just slightly above water.

    screen-shot-2017-01-15-at-2-27-45-am

    screen-shot-2017-01-15-at-2-26-35-am

    screen-shot-2017-01-15-at-2-26-48-am

    We just experienced a king tide. This is a naturally occurring cyclical event that happens whenever the earth, moon, and sun line up in a particular way to create a tide that’s about seven feet higher than usual. In this part of the world king tides tend to arrive a few times a year alongside heavy winter rains. The result is a submerged landscape that at a normal high tide in summer is actually dry land.

    screen-shot-2017-01-15-at-3-33-51-am

    screen-shot-2017-01-15-at-3-45-44-am

    A significant amount of territory would be underwater in a king tide if it weren’t for extensive levees, drainage ditches, canals, and pumping stations that actively manage the hydrology of the built environment.

    screen-shot-2017-01-15-at-4-11-10-am

    screen-shot-2017-01-15-at-4-00-17-am

    screen-shot-2017-01-15-at-4-38-15-am

    screen-shot-2017-01-15-at-4-38-33-am

    So far the engineered solutions are working to plan. But this stuff is expensive to build and maintain. If we skimp or take our eyes off the ball there’s a risk of a breach that would do serious damage to the affected areas. This is California’s version of New Orleans with the added feature of seismic activity to complicate matters.

    screen-shot-2017-01-14-at-7-31-19-pm

    screen-shot-2017-01-15-at-1-27-24-am

    screen-shot-2017-01-15-at-1-28-46-am

    screen-shot-2017-01-15-at-1-28-18-am

    screen-shot-2017-01-15-at-1-29-36-am

    Last summer I was exploring the semi industrial neighborhoods around the airport just south of the city and found myself having a conversation with a hotel manager.

    screen-shot-2017-01-14-at-5-56-28-pm

    screen-shot-2017-01-14-at-5-53-58-pm

    screen-shot-2017-01-14-at-5-48-19-pm

    screen-shot-2017-01-14-at-5-55-40-pm

    Even during ordinary high tides the water level of the canal is about the same as the parking lot. So whenever it rains the drainage system that normally pulls water away from the land works in reverse and canal water is pushed up onto the surface.

    screen-shot-2017-01-14-at-6-40-56-pm

    screen-shot-2017-01-14-at-5-53-32-pm

    screen-shot-2017-01-14-at-5-52-55-pm

    screen-shot-2017-01-14-at-5-53-10-pm

    What’s the difference between a hotel room that remains completely dry vs. a hotel room that has just one inch of standing water on the floor? That’s the difference between $100 a night and $0 per night.

    screen-shot-2017-01-15-at-1-06-27-pm

    screen-shot-2017-01-15-at-1-07-45-pm

    screen-shot-2017-01-15-at-1-07-01-pm

    The management has long responded to the situation by not renting ground floor rooms during the rainy season. That constitutes a seasonal operating loss since any hotel that falls below a 60% occupancy rate loses money. But there isn’t much that can be done. The rooms on the lower level are being renovated so that once the weather clears up the hard surfaces can be thoroughly cleaned and aired out and put back on the market without incident.

    screen-shot-2017-01-15-at-1-36-48-am

    screen-shot-2017-01-15-at-10-37-11-pm

    screen-shot-2017-01-15-at-10-37-39-pm

    Warehouses and industrial sheds in the area have a similar set of challenges. Who exactly wants to store or manufacture things in a facility that gets wet whenever it rains at high tide?

    screen-shot-2017-01-15-at-1-05-37-pm

    screen-shot-2017-01-14-at-7-29-52-pm

    screen-shot-2017-01-14-at-7-29-36-pm

    I was curious why such valuable waterfront land wasn’t redeveloped with new construction that was built with rising tides and earthquakes in mind. Wasn’t the canal a natural feature that could be capitalized upon as a major amenity? Wouldn’t people pay extra to stay at a fancy hotel or live along a landscaped promenade with cafes and shops? It could be really nice, and the real estate market would certainly be able to absorb the required price point. I was told the hotel owner had asked for permission to redevelop the site as a retirement village. Local regulators denied the applications. The city insists that the property remain as it is.

    Over the years I’ve had more than one mayor or city official in different parts of the country explain that each new resident costs the city money in services and infrastructure. What cities desperately need is tax revenue. That’s why we see a proliferation of casinos, premium outlet malls, entertainment complexes, and technology parks. A half assed soggy hotel is better for the city’s bottom line than anything that will burden the municipality with needy residents.

    screen-shot-2017-01-15-at-4-13-00-am

    screen-shot-2017-01-15-at-4-12-28-am

    screen-shot-2017-01-15-at-4-11-57-am

    screen-shot-2017-01-15-at-4-15-58-am

    screen-shot-2017-01-15-at-4-15-23-am

    In the short term there are all manner of temporary quick fixes that can keep this system going. But over the long haul there are only two possible trajectories for these places. One is for huge sums of public money to be spent defending private property. The other is that the structures that currently occupy vulnerable positions will lose value, be abandoned, and gradually slip under the tide. Downtown San Francisco is likely to find the funds to keep back the waves. Will taxpayers really be willing to fortify the old Taco Bell and aging suburban big box store? Toss in an earthquake or two and things could get really interesting very fast. Happenstance is the polite politically neutral term for this kind of triage.

    John Sanphillippo lives in San Francisco and blogs about urbanism, adaptation, and resilience at granolashotgun.com. He’s a member of the Congress for New Urbanism, films videos for faircompanies.com, and is a regular contributor to Strongtowns.org. He earns his living by buying, renovating, and renting undervalued properties in places that have good long term prospects. He is a graduate of Rutgers University.

    All photos by Johnny Sanphillippo

  • Kevin Starr, chronicler of the California dream

    “From the Beginning, California promised much. While yet barely a name on the map, it entered American awareness as a symbol of renewal. It was a final frontier: of geography and of expectation.”

    — Kevin Starr, “Americans and the California Dream, 1850-1915” (1973)

    In a way, now rare and almost archaic, Kevin Starr, who died last week at age 76, believed in the possibilities of California, not just as an economy or a center for innovation, but also as precursor of a new way of life. His life’s work focused on the broadest view of our state — not just the literary lions and industrial moguls but also the farmworkers, the plain “folks” from the Midwest, the grasping suburbanites who did so much to shape and define the state.

    His California was not just movie stars, tech moguls, radical academics, talentless celebrities and equally woeful party hacks who dominate the upper echelons. A native San Franciscan, who grew up in a contentious working-class Irish family and never forgot his roots, Kevin’s California was centered on providing, as he said in a recent interview with Boom California magazine, “a better life for ordinary people.” The diverging fortunes of our people — with many in semi-permanent poverty while others enjoy unprecedented bounty — disturbed him profoundly, and, in his last years, darkened his perspective on the state.

    Over recent years, Kevin was increasingly distraught by what he saw as “the growing divide between the very wealthy and the very poor, as well as the waning of the middle class” that now so characterizes the state. He saw San Francisco changing from the diverse city of his youth, made up of largely ethnic neighborhoods, to a hipster monoculture. With typical humor, he labeled his hometown as essentially “a Disneyland for restaurants,” a playground with little place for raising middle-class families. California has, indeed, changed over the decades, but not always in a good way.

    Kevin Starr’s California

    Kevin Starr represented another, more congenial California, one where people could still disagree on issues, but work for common goods. He was, as his wife Sheila told the New York Times, largely a man of the 1950s, a creature of consensus seekers. He served as state librarian under governors Pete Wilson, Gray Davis and Arnold Schwarzenegger. A conservative-leaning centrist Democrat, he did not fit comfortably in a state that has drifted from a vibrant two-party culture to a dominant progressive monoculture with little more than a Republican rump.

    In today’s hyperpartisan environment, the Golden State must either be a dystopia (the conservative view) or an emerging paradise on earth (the common progressive mantra). Starr, as a fair-minded historian, saw both realities — not only today but through time. In his multipart “California Dream” series, Starr both confronted reaction against ethnic change and celebrated the process of integration, whether for Latinos, Asians or Anglo Okies, whose unique presence, outside of their descendants, is all but lost in contemporary California.

    But what most separated Kevin’s view of California from many others were his humanity and empathy with the aspirations of the state’s middle- and working-class families. Many intellectuals denounce suburbs as racist and exclusionary, as well as environmentally and culturally damaging. Starr saw in them something else — what author D.J. Waldie has described as “Holy Land” — in places like Lakewood, the Bay Area suburbs and Orange County. To him, these were not only places of opportunity, but also landscapes of a reborn “more intimate America,” home to an expanding middle class.

    Read the entire piece at The Orange County Register.

    Joel Kotkin is executive editor of NewGeography.com. He is the Roger Hobbs Distinguished Fellow in Urban Studies at Chapman University and executive director of the Houston-based Center for Opportunity Urbanism. His newest book, The Human City: Urbanism for the rest of us, was published in April by Agate. He is also author of The New Class ConflictThe City: A Global History, and The Next Hundred Million: America in 2050. He lives in Orange County, CA.

    Photo: Institute of Museum and Libraries Service (IMLS website) [Public domain], via Wikimedia Commons

  • How Silicon Valley’s Oligarchs Are Learning to Stop Worrying and Love Trump

    The oligarchs’ ball at Trump Tower revealed one not-so-well-kept secret about the tech moguls: They are more like the new president than they are like you or me.

    In what devolved into something of a love fest, Trump embraced the tech elite for their “incredible innovation” and pledged to help them achieve their goals—one of which, of course, is to become even richer. And for all their proud talk about “disruption,” they also know that they will have to accommodate, to some extent, our newly elected disrupter in chief for at least the next four years.

    Few tech executives—Peter Thiel being the main exception—backed Trump’s White House bid. But now many who were adamantly against the real-estate mogul, such as Clinton fundraiser Elon Musk, who has built his company on subsidies from progressive politicians, have joined the president-elect’s Strategic and Policy Forum. Joining Musk will be Uber’s Travis Kalanick, who half-jokingly threatened to “move to China” if Trump was elected.

    These are companies, of course, with experience making huge promises, and then changing those promises to match new circumstances. Uber, for instance, touted itself as a better deal than a cab for both riders and drivers before it prepared to tout a better deal for riders by replacing its own soon-to-be obsolete drivers with self-driving cars.

    Silicon Valley and its leading mini-me, the Seattle area, did very well under Barack Obama, and expected the good times to continue under Hillary Clinton. Tech leaders were able to emerge as progressive icons even as they built vast fortunes, largely by adopting predictably politically correct issues such as gay rights and climate change, which doubled as a perfect opportunity to cash in on Obama’s renewable-energy subsidies. Increasingly tied to the ephemeral economy of software and media, they felt little impact from policies that might boost energy costs or force long environmental reviews for new projects.

    No wonder Silicon Valley gave heavily to Obama and then Clinton. In 2016, Google was the No. 1 private-sector source of donations to Clinton, while Stanford was fifth. Overall the electronics and communications sector gave Democrats more than $100 million in 2016, twice what they offered the GOP. In terms of the presidential race, they handed $23 million to Hillary, compared to barely $1 million to Trump.

    Yet, there is one issue on which the Valley has not been “left,” and that is, predictably, wealth. It may have liked Obama’s creased pants and intellectually poised manner, but it did not want to see the Democrats become, God forbid, a real populist party. That is one reason why virtually all the oligarchs favored Clinton over Sanders, who had little use for their precious “gig economy,” the H-1B high-tech indentured-servants program, or their vast and little-taxed wealth.

    Jeff Bezos, the Amazon founder with a net worth close to $70 billion, used his outlet, The Washington Post, to help bring down Bernie, before being unable, despite all efforts, to stop Trump. So now Bezos sits by Trump’s side, hoping perhaps that the president-elect’s threats to unleash antitrust actions against Amazon will be conveniently forgotten as an artful “deal” is struck.

    For these and other reasons, there’s little doubt that the tech elite would have been better off under Clinton, who likely would have, like Obama, disdained antitrust actions and let them keep hiding untaxed fortunes offshore. Now, they will have to share the head table with the energy executives they’d hoped to replace with their own climate-change-oriented activities.

    The tech oligarchs have long had a problem with what many would consider social justice. Although the tech economy itself has expanded in the current period, its overall impact on the economy has been less than stellar. For all of its revolutionary hype, it’s done little to create a wide range of employment gains or boost worker productivity.

    To be sure, there have been large surges of employment in the Bay Area, Seattle, and a handful of other places. California alone has more billionaires than any country in the world except China, and nearly half of America’s richest counties.

    But for much of the country, notably those areas that embraced Trump, the tech “disruption” has been anything but welcome news. This includes heavily Latino interior sections, home to many of America’s highest employment rates. Overall, the “booming” high-wage California economy celebrated by progressive ideologues like Robert Reich does not extend much beyond the Valley. In most of California, job gains have been concentrated in low-wage professions.

    Despite its vast wealth, California has the highest cost-adjusted poverty rate in the country, with a huge percentage of the state’s Latinos and African Americans barely able to make ends meet. California metropolitan areas, including the largest, Los Angeles, account for six of the 15 metro areas with the worst living standards, according to a recent report from demographer Wendell Cox. Meanwhile, the middle and working class, particularly young families, continue to leave, with more people exiting the state for other ones than arriving to it from the, in 22 of the past 25 years.

    Even in Silicon Valley itself the boom has done little for working-class people, or for Latinos and African Americans—who continue to be badly underrepresented at the top tech firms as many of those same firms aggressively promote diversity. A study out of the California Budget and Policy Center (PDF) concluded that with housing costs factored in, the poverty rate in Santa Clara County soars to 18 percent, covering nearly one in every five residents, and almost one-and-a half times the national poverty rate. Since 2007, amidst an enormous boon, adjusted incomes for Latinos and African Americans in the area actually dropped (PDF).

    Much of this has to do with change in the Valley’s industrial structure, which has shifted from manufacturing to software and media. The result has been a kind of tech alt-dystopia, with massive levels of homelessness, and housing costs that are prohibitive to all but a small sliver of the local population.

    With a president whose base is outside the Bay Area, and dependent on support in areas where jobs are the biggest issue, the tech moguls will need to find ways to fit into the new agenda. The old order of relentless globalization, offshoring, and keeping profits abroad may prove unsustainable under a Trump regime that has promised to reverse these trends. In some senses the Trump constituency is made up of people who are the target of Silicon Valley’s “war on stupid people.” Inside the Valley, such people are seen as an obstacle to progress, who should be shut up with income supports and subsidies.

    So can Silicon Valley make peace with Donald Trump, the self-appointed tribune of the “poorly educated”? There are two key areas where there could be a meeting of minds. One is around regulation. One of the great ironies of the tech revolution is that the very places that are home to many techies—notably blue cities such as San Francisco, Austin, and New York—also tend to be the very places most concerned with the economic impacts of the industry.

    Opposition to disruptive market makers in the so-called sharing economy like Uber, Lyft, and Airbnb is greatest in these dense, heavily Democratic cities. What’s left of the private-sector union movement and much of the progressive intelligentsia is ambivalent if not downright hostile to the “gig” economy. Ultimately, resistance to regulations relating to this tsunami of part-time employment could be something that Trump’s big business advisers might share in common with the techies.

    More important will be the issue of jobs. It may not work anymore for firms to lower tech wages by offshoring jobs or importing lots of foreign workers under the H-1B visa program, since Trump has denounced it. IBM’s Ginni Rometty, who had been busily replacing U.S. workers with ones in India, Brazil, and Costa Rica, has now agreed to create 25,000 domestic jobs. Other tech companies—including Apple—have also been making noises shifting employment to the United States from other countries. Trump may well feel what “worked” with Carrier can now be expanded to the most dynamic part of the U.S. economy.

    If the tech industry adjusts to the new reality, they may find the Trump regime, however crude, to be more to their liking than they might expect. Companies like Google may never again have the influence they had under Obama, but many techies may be able to adjust. As long as the new president “deals” them in, the techies may be able to stop worrying about Trump and begin to embrace, if not love, him.

    This article first appeared on The Daily Beast.

    Joel Kotkin is executive editor of NewGeography.com. He is the Roger Hobbs Distinguished Fellow in Urban Studies at Chapman University and executive director of the Houston-based Center for Opportunity Urbanism. His newest book, The Human City: Urbanism for the rest of us, was published in April by Agate. He is also author of The New Class ConflictThe City: A Global History, and The Next Hundred Million: America in 2050. He lives in Orange County, CA.

    Photo by Gage Skidmore from Peoria, AZ, United States of America (Donald Trump) [CC BY-SA 2.0], via Wikimedia Commons

    Photo: MCR World