Tag: San Francisco

  • California Wastes Its Public Space

    California’s favorable climate makes it a haven for outdoor activity. Enlightened and forward-looking planning has largely preserved the waterfronts for public access and set aside a lot of space for public use and activity. Yet despite this, there are few great urban gathering spaces. This is most obvious in the two largest population centers – Los Angeles and San Francisco.

    As a result, potentially great urban districts are dragged down by a dearth of desirable activity, something exacerbated by an already damaging real estate slump. Although all is not lost in these cities, some of the most high profile public spaces fail to attract large numbers of visitors on a daily basis, particularly when no special events are planned.

    Pershing Square, Los Angeles – Located in the heart of downtown, Pershing Square is poorly designed, both as its own project and in a contextual sense. In an already warm climate made even hotter by its CBD location, there is too much hardscape. Extensive softscape, whether flowers, grass, and/or trees, would provide a cooling effect. There are also too many symbolic structures serving no purpose. These are expensive to install and maintain; they provide very little benefit. Also, an already bad relationship to the street was made worse by restricting access points and hiding the interior space. Although some changes over the past several years have softened the space somewhat, it still lacks some basic creature comforts, such as adequate lighting and clean restrooms, to make it a daily destination for the scores of office workers within easy walking distance.

    County Mall, Los Angeles – County Mall, located west of Los Angeles City Hall between Broadway and Grand Avenue, is in the unenviable position of being relatively unknown. Poor graphics and signage do little to improve its profile. Although there was extensive softscape in the design, many of the original shrubs and flowers have eroded. Further, the large space is not properly organized to allow and encourage different types of activity. Adjacent uses alone are not enough to sustain the park. Unlike in Pershing Square, the design here is not the primary issue. Instead, more programming and better maintenance would make County Mall successful, and provide for a dramatic promenade connecting City Hall and the Los Angeles Music Center.

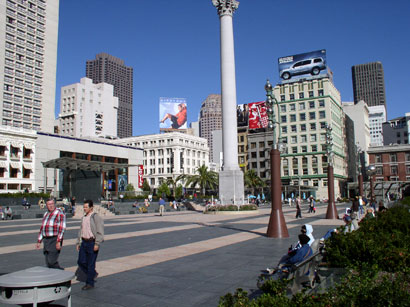
    Union Square, San Francisco – Despite an expensive redesign nearly five years ago, Union Square is still not the central urban gathering space for San Francisco. Although it does serve as an incidental focus of pedestrian activity within the immediate neighborhood, the primarily hardscaped design is too fussy and too formal to encourage casual passive use and extended stays, except, perhaps, within limited zones at the fringes. The little available seating is poorly designed, intended to prevent homeless use rather than to promote use by casual park visitors. Primarily a concrete space with grass at the corners, Union Square lacks the “warmth” that makes such spaces comfortable. Imagine a Union Square with a great lawn in the middle, rather than cold (and expensive) hardscape.

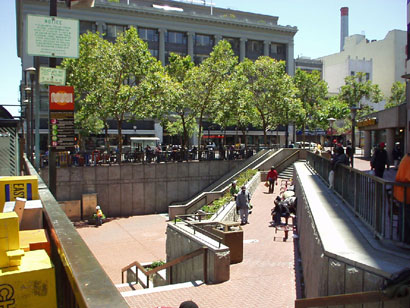
    Market Street, San Francisco – Punctuated by intermittent triangular plazas along most of its downtown stretches, portions of Market Street’s public space are more the domain of homeless panhandlers than workers, residents, strollers, and the like (it should be noted, however, that some parts of Market Street, such as in the Financial District, can be pleasant at times). The plazas, quality architecture, and mix of uses create potential. But the pedestrian environment discourages extended dwell times, except by the homeless, panhandlers and drug dealers, many of whom, the city has documented, commute daily to Market Street from elsewhere in the Bay Area. The design offers little in the way of seating options and softscape. Sanitation and maintenance need to be substantially upgraded and programming is needed.

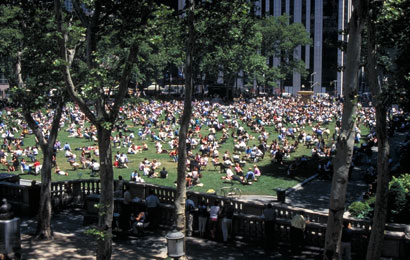
    Proper seating, adequate lighting, and extensive horticultural displays would serve to populate these public spaces. Proper management and maintenance would ensure long-term success. Places such as Bryant Park in Midtown Manhattan, itself the beneficiary of a remarkable turnaround masterminded by Daniel Biederman of the Bryant Park Restoration Corporation, have shown what visionary management can do to struggling urban public spaces. [Kozloff worked for BRV Corp., Biederman’s private consulting company that is independent of the Bryant Park Restoration Corporation, from 2001-2004.] Although once run on a city budget of $200,000, Bryant Park is now managed on a privately-funded budget. Biederman turned Bryant Park – once the domain of drug dealers and other such undesirables – into Manhattan’s premier address without using public coffers.

    Given the warm weather, long growing seasons, and urban renaissance occurring in adjacent portions of Los Angeles and San Francisco, even in the midst of our current downturn, there are opportunities to improve the public realm so that it serves its intended purpose, including boosting civic pride and, in turn, encouraging public stewardship. And, these improvements could be made without costly redesigns and extensive capital construction. Urban environments do not need places that drain public funds and then are shunned by the citizenry; there are enough other issues for urban mayors to deal with. Great cities need comfortable and inviting gathering places that both anchor and bolster civic pride, and simultaneously provide backdrops for special events and day-to-day activity.

    Howard Kozloff is Manager of Development Strategies and Director of Operations at Hart Howerton, an international strategy, planning and design firm based in New York, San Francisco and London. Kozloff is also a lecturer on Urban Real Estate Markets at the University of Pennsylvania.

  • Elected Official Domestic Migration from San Francisco?

    San Francisco, like every other core county in a metropolitan area of more than 1,000,000 (with the exception of New Orleans) continues to lose domestic migrants. Between 2000 and 2008, US Bureau of the Census data indicates that more than 10 percent of San Franciscans have left for other counties. But if one is a member of the San Francisco Board of Supervisors (board of county commissioners), it may be convenient for only part of the family to join the exodus.

    According to the San Francisco Chronicle Supervisor Chris Daly moved the wife and kids to exurban Fairfield, claiming that the environment was better there for the kids, since they would live closer to their grandparents. Doubtless the environment will be better there for the kids in a lot of ways – more places to play, a safer environment and probably better schools.

    What’s more, the Supervisor moved the family to a cul-de-sac, that urban form most despised by the most orthodox urbanites.

    It is understandable that Supervisor Daly himself did not move, announcing that he continues to “eat, sleep and bathe” in his San Francisco home. Don’t be surprised, however, if when Supervisor Daly’s term expires, he should find the shower and bathtub more to his liking in the exurbs.

  • Tracking Business Services: Best And Worst Cities For High-Paying Jobs

    Media coverage of America’s best jobs usually focuses on blue-collar sectors, like manufacturing, or elite ones, such as finance or technology. But if you’re seeking high-wage employment, your best bet lies in the massive “business and professional services” sector.

    This unsung division of the economy is basically a mirror of any and all productive industry. It includes everything from human resources and administration to technical and scientific positions, as well as accounting, legal and architectural firms.

    Overall there are roughly 17 million professional and business services jobs, 4 million more than manufacturing. This makes it twice as big as the finance sector and five times the size of the much-ballyhooed tech sector. While its average salary – roughly $55,000 a year – is somewhat lower than in those other elite sectors, its wages are still higher than those in all the other large sectors, like health. The sector’s $1 trillion in total pay per year accounts for nearly 20% of all wages paid in the nation; finance and tech together only account for $812 billion.

    More than that, the business and professional services sector has encompassed the fastest-growing part of the high-wage economy. Employment in lower-wage sectors like education has also grown quickly. But employment in other sectors that pay their employees well, such as technology, has remained stagnant; jobs in some, such as manufacturing, have fallen sharply. Critically, the business services sector – particularly at the better-paying end – seems to have weathered the current recession better than these other high-wage sectors.

    The crucial question remains: In what regions is this critical economic cog booming? In a new analysis with my colleagues at the Praxis Strategy Group, we examined Bureau of Labor Statistics employment data for this sector, keeping an eye on trends over both the last year and the last decade. Some of the metropolitan areas that boasted short-term growth in this sector also maintained steady employment success over the long-term, which suggests that these particular cities have sturdy economies that aren’t as prone to intense boom-bust cycles.

    At the top of our list of best places is greater Washington, D.C., and its surrounding suburbs in Virginia and Maryland. Government jobs may drive that economy, but it is the lawyers, consultants and technical services firms who harvest the richest benefits. As New York University public policy professor Mitchell Moss observes, Washington has emerged as the “real winner” in the recession – not just for public-sector workers but private-sector ones too.

    Fastest Growing Professional and Business Services Sectors
    Area Name Jobs in Sector 2009
    (thousands)
    Sector Share of Jobs 2009
    (percent of total)
    Growth 2008 – 2009
    (percent growth)
    Cumulative Growth 2001 – 2009
    (percent growth)
    2001-2009 Job Change (thousands) 2008-2009 Job Change (thousands)
    Northern Virginia, VA 355.2 27.2% 1.5% 22.4% 65.0 5.2
    Washington-Arlington-Alexandria, DC-VA-MD-WV 558.7 23.0% 0.9% 22.8% 103.6 5.1
    Austin-Round Rock, TX 112.4 14.4% 3.3% 18.7% 17.7 3.6
    Houston-Sugar Land-Baytown, TX 382.3 14.7% 0.9% 19.2% 61.5 3.2
    Virginia Beach-Norfolk-Newport News, VA-NC 106.6 14.0% 2.8% 8.0% 7.9 2.9
    Bethesda-Frederick-Rockville, MD 125.7 21.9% 2.1% 9.0% 10.4 2.6
    Wichita, KS 31.5 10.1% 3.5% 16.4% 4.4 1.1
    Chattanooga, TN-GA 25.9 10.6% 4.3% 11.8% 2.7 1.1
    Peoria, IL 23.0 12.1% 4.5% 43.2% 6.9 1.0
    Rochester, NY 61.8 11.9% 1.5% 1.9% 1.1 0.9
    Augusta-Richmond County, GA-SC 31.0 14.5% 3.0% 7.5% 2.2 0.9
    Mansfield, OH 5.1 9.1% 19.4% 4.1% 0.2 0.8
    Kennewick-Pasco-Richland, WA 20.8 22.2% 4.2% 20.2% 3.5 0.8
    St. Louis, MO-IL 195.4 14.6% 0.4% 3.9% 7.4 0.8
    Fayetteville-Springdale-Rogers, AR-MO 33.5 16.2% 2.2% 34.2% 8.5 0.7
    Macon, GA 12.1 11.9% 5.5% 31.2% 2.9 0.6
    Pittsburgh, PA 158.9 13.9% 0.4% 14.5% 20.1 0.6
    Fresno, CA 30.7 10.3% 1.9% 23.3% 5.8 0.6
    Provo-Orem, UT 23.3 12.4% 2.5% 16.7% 3.3 0.6
    Charleston-North Charleston-Summerville, SC 42.2 14.3% 1.3% 31.1% 10.0 0.5

    Over the past year, parts of northern Virginia – ground zero for the so-called “beltway bandits” who work in industries the government depends on to do its job – have enjoyed the fastest growth in business and professional services, adding over 5,200 jobs despite the current downturn.

    Other areas around the nation’s capital have also seen strong growth. The Washington D.C.-Arlington-Alexandria area, for example, came in second on our list, gaining nearly 5,100 positions, while No. 6 the Bethesda-Frederick-Rockville, Md., metro area added 2,600. In addition, yet another Virginia area – No. 5-ranked Virginia Beach-Norfolk-Newport News, a center for military-related industries – gained nearly 2,900 jobs in this sector.

    It’s far too early to thank the free-spending ways of Barack Obama’s administration for all this growth. As anyone can tell you, the Bush White House and its Republican Congress were not exactly models of fiscal restraint. Plus, Washington and Northern Virginia have seen growth in their business services sectors over the last several years, in the period stretching from 2001 to 2009. Together those two metros added over 165,000 new jobs in this critical, high-wage sector.

    Of course, you don’t have to head to Washington to find a high-paying job – although you might not be able to escape unpleasant summer weather. The other major group of business-services hot spots includes Austin, Texas, at No. 3, and Houston, at No. 4. These Lone Star local economies have continued to thrive not only during the current recession but also over the last decade.

    The others winners include farther-afield locales in Kansas, Tennessee, Illinois and New York. These areas could be gaining both from companies seeking to lower costs and from the new capabilities for remote work due to the Internet. Even though they didn’t make our list, a host of smaller communities – like Mansfield, Ohio; Provo, Utah; and Charleston, S.C. – also enjoyed significant growth in the business services sector over the past year.

    So if these are the places where this segment of the economy is growing and high-paying jobs are easier to come by, where is the opposite true? The worst cities on our list span three archetypes: Rust Belt basket cases, Sunbelt flame-outs and expensive big cities. Perhaps the toughest losses were in Michigan: Detroit and the Warren-Troy metro area suffered big setbacks both in the last year and over the last decade.

    Fastest Declining Professional and Business Services Sectors
    Area Name Jobs in Sector 2009
    (thousands)
    Sector Share of Jobs 2009
    (percent of total)
    Growth 2008 – 2009
    (percent growth)
    Cumulative Growth 2001 – 2009
    (percent growth)
    2001-2009 Job Change (thousands) 2008-2009 Job Change (thousands)
    Phoenix-Mesa-Scottsdale, AZ 289.2 16.0% -10.8% 7.9% 21.2 -35.1
    Warren-Troy-Farmington Hills, MI 202.5 18.5% -12.0% -21.2% -54.4 -27.7
    Chicago-Naperville-Joliet, IL 633.6 16.8% -4.1% -2.9% -19.0 -27.0
    Los Angeles-Long Beach-Glendale, CA 574.7 14.3% -4.2% -3.4% -20.4 -25.2
    Atlanta-Sandy Springs-Marietta, GA 390.3 16.4% -5.9% -1.3% -5.1 -24.4
    Orlando-Kissimmee, FL 170.9 16.2% -8.5% 7.7% 12.3 -16.0
    Santa Ana-Anaheim-Irvine, CA 261.9 18.0% -4.7% 4.0% 10.2 -12.8
    Minneapolis-St. Paul-Bloomington, MN-WI 253.4 14.4% -4.6% -4.6% -12.2 -12.3
    Edison-New Brunswick, NJ 164.5 16.3% -6.7% -2.6% -4.4 -11.9
    Detroit-Livonia-Dearborn, MI 108.9 14.7% -9.5% -20.9% -28.8 -11.4
    Indianapolis-Carmel, IN 120.3 13.4% -8.3% 13.6% 14.4 -10.8
    Riverside-San Bernardino-Ontario, CA 133.7 11.2% -6.5% 36.0% 35.4 -9.2
    Tampa-St. Petersburg-Clearwater, FL 223.2 18.5% -3.7% 12.3% 24.5 -8.6
    New York City, NY 595.7 15.8% -1.4% -0.8% -5.1 -8.4
    Newark-Union, NJ-PA 163.5 16.0% -4.7% -0.5% -0.8 -8.0
    Bergen-Hudson-Passaic, NJ 130.6 14.6% -5.8% -9.1% -13.0 -8.0
    Milwaukee-Waukesha-West Allis, WI 107.6 12.9% -6.6% -1.7% -1.8 -7.6
    Miami-Miami Beach-Kendall, FL 139.1 13.4% -4.7% 2.2% 3.0 -6.8
    Oakland-Fremont-Hayward, CA 158.0 15.6% -4.0% -7.1% -12.2 -6.7
    Las Vegas-Paradise, NV 108.2 12.1% -5.8% 38.1% 29.9 -6.6
    Boston-Cambridge-Quincy, MA 308.8 18.2% -2.0% -6.8% -22.5 -6.4
    Sacramento–Arden-Arcade–Roseville, CA 106.1 12.3% -5.6% -1.8% -1.9 -6.3
    Cleveland-Elyria-Mentor, OH 137.8 13.3% -4.3% -5.2% -7.6 -6.1
    Denver-Aurora-Broomfield, CO 207.0 16.9% -2.9% 4.0% 8.0 -6.1

    Consistent job losses in business services in these areas – some 54,000 in the Troy area since 2001 – reveal the clear connection between employment in business services and in the region’s fundamental auto industry. It turns out that elite services often prove dependent on basic industry. When industrial plants shut down, it’s not just blue-collar workers and company executives that suffer; as a result, these firms will use fewer lawyers, accountants, architects and technical consultants.

    A similar picture emerges in cities like Phoenix, which lost about 35,000 business-services jobs in just one year. This loss stems from the collapse of the housing bubble, which powered the rest of the regional economy. The same meltdown caused smaller but still significant reversals in one-time boomtowns like Orlando, Fla., Atlanta and Southern California’s Santa Ana region, which encompasses Orange County, where business service employment dropped by double-digit rates over the past year.

    Yet these same areas should see some recovery, perhaps more so than the traditional auto manufacturing-focused towns. Phoenix, Orlando and other Sun Belt locations – including a host of other areas in Florida – all saw increasing employment in business services over the past decade. If the economy comes back, along with a stabilization of the residential real estate market, business-services job growth will likely begin to take off again. After all, the fundamental reasons for the success of these areas, such as warm weather, lower costs and the need to serve a growing population, have not fundamentally changed.

    Perhaps most perplexing is the fate of some of the other places on our worst cities list, particularly the biggest metropolitan areas. The professional and business services sector is widely considered ideal for large, cosmopolitan centers, since lots of industries require support. But Chicago experienced a huge chunk of job losses – almost 25% – in this sector during the last year. Other big cities, including Los Angeles, Minneapolis and New York, also suffered.

    This is not a new phenomenon. These and other big cities, like Boston and San Jose, San Francisco and Oakland in California, have been shedding these types of jobs since 2001. These losses, however, have been concentrated at the lower-wage end of the business service pyramid, in areas like human resources and administration. These are the positions that companies can fill more easily and cheaply using the Internet or by hiring in less expensive outposts.

    That’s why Washington and its environs, which has seen across-the-board business growth, remain the great exception. Many business-services jobs outside the beltway appear to be becoming more nomadic, based in places where firms face lower costs and where workers can afford to live well on middle-income salaries. Even the long-term resiliency of higher-wage employment like law and accounting in traditional business hubs like New York could be at risk over time, with some jobs shifting to less expensive locales or even overseas.

    The changing nature of business services presents a boon to some communities and a challenge to others as they seek to survive and thrive in spite of the current recession. How some cities manage to grow this segment of their economies may well presage which parts of the country will thrive best during the years of recovery – and beyond.

    This article originally appeared at Forbes.

    Joel Kotkin is executive editor of NewGeography.com and is a presidential fellow in urban futures at Chapman University. He is author of The City: A Global History. His next book, The Next Hundred Million: America in 2050, will be published by Penguin early next year.

  • Who Killed California’s Economy?

    Right now California’s economy is moribund, and the prospects for a quick turnaround are not good. Unable to pay its bills, the state is issuing IOUs; its once strong credit rating has collapsed. The state that once boasted the seventh-largest gross domestic product in the world is looking less like a celebrated global innovator and more like a fiscal basket case along the lines of Argentina or Latvia.

    It took some amazing incompetence to toss this best-endowed of places down into the dustbin of history. Yet conventional wisdom views the crisis largely as a legacy of Proposition 13, which in effect capped only taxes.

    This lets too many malefactors off the hook. I covered the Proposition 13 campaign for the Washington Post and examined its aftermath up close. It passed because California was running huge surpluses at the time, even as soaring property taxes were driving people from their homes.

    Admittedly it was a crude instrument, but by limiting those property taxes Proposition 13 managed to save people’s houses. To the surprise of many prognosticators, the state government did not go out of business. It has continued to expand faster than either its income or population. Between 2003 and 2007, spending grew 31%, compared with a 5% population increase. Today the overall tax burden as percent of state income, according to the Tax Foundation, has risen to the sixth-highest in the nation.

    The media and political pundits refuse to see this gap between the state’s budget and its ability to pay as an essential issue. It is. (This is not to say structural reform is not needed. I would support, for example, reforming some of the unintended ill-effects of Proposition 13 that weakened local government and left control of the budget to Sacramento.)

    But the fundamental problem remains. California’s economy–once wondrously diverse with aerospace, high-tech, agriculture and international trade–has run aground. Burdened by taxes and ever-growing regulation, the state is routinely rated by executives as having among the worst business climates in the nation. No surprise, then, that California’s jobs engine has sputtered, and it may be heading toward 15% unemployment.

    So if we are to assign blame, let’s not start with the poor, old anti-tax activist Howard Jarvis (who helped pass Proposition 13 and passed away over 20 years ago), but with the bigger culprits behind California’s fall. Here are five contenders:

    1. Arnold Schwarzenegger

    The Terminator came to power with the support of much of the middle class and business community. But since taking office, he’s resembled not the single-minded character for which he’s famous but rather someone with multiple personalities.

    First, he played the governator, a tough guy ready to blow up the dysfunctional structure of government. He picked a street fight against all the powerful liberal interest groups. But the meathead lacked his hero Ronald Reagan’s communication skills and political focus. Defeated in a series of initiative battles, he was left bleeding the streets by those who he had once labeled “girlie men.”

    Next Arnold quickly discovered his feminine side, becoming a kinder, ultra-green terminator. He waxed poetic about California’s special mission as the earth’s guardian. While the housing bubble was filling the state coffers, he believed the delusions of his chief financial adviser, San Francisco investment banker David Crane, that California represented “ground zero for creative destruction.”

    Yet over the past few years there’s been more destruction than creation. Employment in high-tech fields has stagnated (See related story, “Best Cities For Technology Jobs“) while there have been huge setbacks in the construction, manufacturing, warehousing and agricultural sectors.

    Driven away by strict regulations, businesses take their jobs outside California even in relatively good times. Indeed, according to a recent Milken Institute report, between 2000 and 2007 California lost nearly 400,000 manufacturing jobs. All that time, industrial employment was growing in major competitive rivals like Texas and Arizona.

    With the state reeling, Arnold has decided, once again, to try out a new part. Now he’s posturing as the strong man who stands up to dominant liberal interests. But few on the left, few on the right or few in the middle take him seriously anymore. He may still earn acclaim from Manhattan media offices or Barack Obama’s EPA, but in his home state he looks more an over-sized lame duck, quacking meaninglessly for the cameras.

    2. The Public Sector

    Who needs an economy when you have fat pensions and almost unlimited political power? That’s the mentality of California’s 356,000 workers and their unions, who make up the best-organized, best-funded and most powerful interest group in the state.

    State government continued to expand in size even when anyone with a room-temperature IQ knew California was headed for a massive financial meltdown. Scattered layoffs and the short-term salary givebacks now being considered won’t cure the core problem: an overgenerous retirement system. The unfunded liabilities for these employees’ generous pensions are now estimated at over $200 billion.

    The people who preside over these pensions represent the apex of this labor aristocracy. This year two of the biggest public pension funds, CalPERS and CalSTERS, handed out six-figure bonuses to its top executives even though they had lost workers billions of dollars.

    Almost no one dares suggest trimming the pension funds, particularly Democrats who are often pawns of the public unions. Some reforms on the table, like gutting the two-thirds majority required to pass the budget, would effectively hand these unions keys to the treasury.

    3. The Environment

    Obama holds up California’s environmental policy as a model for the nation. May God protect the rest of the country. California’s environmental activists once did an enviable job protecting our coasts and mountains, expanding public lands and working to improve water and air resources. But now, like sailors who have taken possession of a distillery, they have gotten drunk on power and now rampage through every part of the economy.

    In California today, everyone who makes a buck in the private sector–from developers and manufacturers to energy producers and farmers–cringes in fear of draconian regulations in the name of protecting the environment. The activists don’t much care, since they get their money from trust-funders and their nonprofits. The losers are California’s middle and working classes, the people who drive trucks, who work in factories and warehouses or who have white-collar jobs tied to these industries.

    Historically, many of these environmentally unfriendly jobs have been sources of upward mobility for Latino immigrants. Latinos also make up the vast majority of workers in the rich Central Valley. Large swaths of this area are being de-developed back to desert–due less to a mild drought than to regulations designed to save obscure fish species in the state’s delta. Over 450,000 acres have already been allowed to go fallow. Nearly 30,000 agriculture jobs–held mostly by Latinos–were lost in the month of May alone. Unemployment, which is at a 17% rate across the Valley, reaches upward of 40% in some towns such as Mendota.

    4. The Business Community

    This insanity has been enabled by a lack of strong opposition to it. One potential source–California’s business leadership–has become progressively more feeble over the past generation. Some members of the business elite, like those who work in Hollywood and Silicon Valley, tend to be too self-referential and complacent to care about the bigger issues. Others have either given up or are afraid to oppose the dominant forces of the environmental activists and the public sector.

    Theoretically, according to business consultant Larry Kosmont, business should be able to make a strong case, particularly with the growing Latino caucus in the legislature. “You have all these job losses in Latino districts represented by Latino legislators who don’t realize what they are doing to their own people,” he says. “They have forgotten there’s an economy to think about.”

    But so far California’s business executives have failed to adopt a strategy to make this case to the public. Nor can they count on the largely clueless Republicans for support, since GOP members are often too narrowly identified as anti-tax and anti-immigration zealots to make much of a case with the mainstream voter. “The business community is so afraid they are keeping their heads down,” observes Ross DeVol, director of regional economics at the Milken Institute. “I feel they if they keep this up much longer, they won’t have heads.”

    5. Californians

    At some point Californians–the ones paying the bills and getting little in return–need to rouse themselves. The problem could be demographic. Over the past few years much of our middle class has fled the state, including a growing number to “dust bowl” states like Oklahoma, Texas and Arkansas from which so many Californians trace their roots.

    The last hope lies with those of us still enamored with California. We have allowed ourselves to be ruled by a motley alliance of self-righteous zealots, fools and cowards; now we must do something. Some think the solution is reining in citizens’ power by using the jury pool to staff a state convention, as proposed by the Bay Area Council, or finding ways to undermine the initiative system, which would remove critical checks on legislative power.

    We should, however, be very cautious about handing more power to the state’s leaders. With our acquiescence, they have led this most blessed state toward utter ruin. Structural reforms alone, however necessary, won’t turn around the economy’s fundamental problems and help California reclaim its role as a productive driver of the American dream.

    This article originally appeared at Forbes.

    Joel Kotkin is executive editor of NewGeography.com and is a presidential fellow in urban futures at Chapman University. He is author of The City: A Global History. His next book, The Next Hundred Million: America in 2050, will be published by Penguin early next year.

  • Special Report: Infill in US Urban Areas

    One of the favored strategies of current urban planning is “infill” development. This is development that occurs within the existing urban footprint, as opposed that taking place on the fringe of the urban footprint (suburbanization). For the first time, the United States Bureau of the Census is producing data that readily reveals infill, as measured by population growth, in the nation’s urban areas.

    2000 Urban Footprint Populations

    The new 2007 estimates relate to urban areas or urban footprints as defined in 2000 and are produced by the American Community Survey program of the Bureau of the Census. Urban areas are the continuous urbanization that one would observe as the lights of a “city” on a clear night from an airplane. It is the extent of development from one side of the urban form to the other. Further, urban areas are not metropolitan areas, which are always larger and are defined by work trip travel patterns. Metropolitan areas always include adjacent rural areas, while urban areas never do.

    The Process of Infill

    Although embraced with often religious passion within the urban planning community, infill is neither good nor bad in terms of social or environmental impact. Infill always increases population densities and that means more traffic. If road capacity is increased sufficiently, traffic congestion can be kept at previous levels. If on the other hand, nothing is done, traffic congestion is likely to increase along with population. This means slower traffic and more stop and go operations, which inevitably increases the intensity of air pollution with the potential to cancel out any reductions in greenhouse gas emissions (GHG) that might occur if average car trip lengths decline. Similar difficulties can occur with respect to other infrastructure systems, such as sewer and water. Expanding roads, sewer and water systems in already developed areas can be far more expensive than new systems on greenfield sites. Regrettably, boosters of infill routinely ignore these issues.

    But infill has been going on for years, along with suburbanization, both in the United States and in other first world nations. This is indicated by the general densification trend that occurred in US urban areas between 1990 and 2000 and the longer term densification trends that occurred in a number of southwestern urban areas, such as Los Angeles, San Jose, Riverside-San Bernardino, Phoenix, Dallas-Fort Worth and Las Vegas. All these traditionally “sprawling” areas have, in fact, been densifying since 1960 or before. Since 2000, 33 of the nation’s 37 urban areas with a population exceeding 1,000,000 population experienced population infill to their 2000 urban footprints.

    Infill in Traditionally Regulated Markets (More Responsive Markets)

    Infill is a natural consequence of the traditional post-World War II land use regulation, which tends towards accommodating both demographic growth and market forces. This has been replaced by more prescriptive (often called “smart growth”) land use regulation in some urban areas. Under traditional regulation, suburban development followed a “leap frog” process, moving ever further out. This is roundly condemned in today’s planning literature and among leading academics and policy makers.

    Leap frog development occurs where urban development skips over empty land and creates a less continuous urban fabric. Land is developed based upon the interplay between sellers and buyers. Due to fewer planning restrictions, no seller can be sure that their land will be purchased since there is always plenty of land that buyers can otherwise purchase. This keeps land prices down. In the more responsive markets, it is typical for land and site infrastructure costs to be 20 percent of the total price land and house price.

    Infill occurs as land that has been “leaped” over is subsequently purchased for development. Again, because buyers have plenty of choices, prices of the infill land remains low, so that land and infrastructure costs remain relatively affordable in relationship to the overall new house purchase price.

    The result is an urban area that is generally continuous, though with a transitional “ragged edge.” The ragged edge enabled the broad expansion of home ownership that occurred in the decades following World War II by keeping house prices low.

    Infill in More Prescriptive Markets (Smart Growth)

    The infill process is quite dramatically different in more prescriptive markets. Infill might be mandated as a percentage of total development or by severely limiting the development allowed to occur closer to the urban fringe. Sellers of land on which development is permitted have disproportionate power to charge higher prices because the planning regime seriously limits the availability of alternative sites for buyers. This, of course, flows through to house prices. The share of land and site infrastructure can rise to two-thirds of the house and land cost. The urban area may have a “clearer” edge, but at a significant loss in housing affordability.

    Infill Trends in the 2000s

    The new infill estimates indicate that American urban areas continue to densify. Between 2000 and 2007, the 33 of the 37 urban areas of more than 1,000,000 population experienced densification in their 2000 urban footprints. The average population infill increase was 5.6 percent (See Table the following table).

    Population Infill in 2000 Urban Footprints
    2000-2007
      Population Change: 2000 Urban Footprint Population Density of 2000 Urban Footprint in 2007  
    Urban Area 2000 Census 2007 Estimate Change % Rank Rank
    Riverside–San Bernardino, CA       1,506,816      1,800,117     293,301 19.5% 1         4,110 8
    Atlanta, GA       3,499,840      4,118,485     618,645 17.7% 2         2,100 36
    Austin, TX         901,920      1,051,962     150,042 16.6% 3         3,308 17
    Las Vegas, NV       1,314,357      1,518,835     204,478 15.6% 4         5,311 5
    Houston, TX       3,822,509      4,370,475     547,966 14.3% 5         3,377 16
    Portland, OR–WA       1,583,138      1,779,705     196,567 12.4% 6         3,755 12
    Phoenix, AZ       2,907,049      3,254,634     347,585 12.0% 7         4,078 9
    Dallas–Fort Worth, TX       4,145,659      4,549,281     403,622 9.7% 8         3,236 18
    Orlando, FL       1,157,431      1,267,976     110,545 9.6% 9         2,799 24
    San Antonio, TX       1,327,554      1,440,794     113,240 8.5% 10         3,540 14
    Tampa–St. Petersburg, FL       2,062,339      2,209,067     146,728 7.1% 11         2,754 25
    Sacramento, CA       1,393,498      1,488,647       95,149 6.8% 12         4,034 10
    Seattle, WA       2,712,205      2,896,844     184,639 6.8% 13         3,040 21
    Miami, FL       4,919,036      5,243,679     324,643 6.6% 14         4,703 6
    Washington, DC–VA–MD       3,933,920      4,174,187     240,267 6.1% 15         3,611 13
    Denver, CO       1,984,887      2,087,803     102,916 5.2% 16         4,192 7
    Indianapolis, IN       1,218,919      1,278,687       59,768 4.9% 17         2,316 34
    Columbus, OH       1,133,193      1,175,132       41,939 3.7% 18         2,960 22
    Kansas City, MO–KS       1,361,744      1,408,900       47,156 3.5% 19         2,413 31
    Virginia Beach, VA       1,394,439      1,442,494       48,055 3.4% 20         2,742 26
    San Jose, CA       1,538,312      1,588,544       50,232 3.3% 21         6,110 2
    Los Angeles, CA     11,789,487    12,171,625     382,138 3.2% 22         7,302 1
    Cincinnati, OH–KY–IN       1,503,262      1,546,730       43,468 2.9% 23         2,305 35
    Baltimore, MD       2,076,354      2,133,371       57,017 2.7% 24         3,128 19
    San Diego, CA       2,674,436      2,747,620       73,184 2.7% 25         3,514 15
    New York, NY–NJ–CT     17,799,861    18,223,567     423,706 2.4% 26         5,440 4
    Minneapolis–St. Paul, MN       2,388,593      2,438,359       49,766 2.1% 27         2,727 27
    Chicago, IL–IN       8,307,904      8,467,804     159,900 1.9% 28         3,992 11
    St. Louis, MO–IL       2,077,662      2,103,040       25,378 1.2% 29         2,540 30
    Milwaukee, WI       1,308,913      1,324,365       15,452 1.2% 30         2,719 28
    Boston, MA–NH–RI       4,032,484      4,077,659       45,175 1.1% 31         2,350 33
    Providence, RI–MA       1,174,548      1,183,622        9,074 0.8% 32         2,353 32
    Philadelphia, PA–NJ–DE–MD       5,149,079      5,178,918       29,839 0.6% 33         2,880 23
    San Francisco, CA       3,228,605      3,214,137      (14,468) -0.4% 34         6,099 3
    Detroit, MI       3,903,377      3,831,575      (71,802) -1.8% 35         3,041 20
    Pittsburgh, PA       1,753,136      1,687,509      (65,627) -3.7% 36         1,981 37
    Cleveland, OH       1,786,647      1,705,917      (80,730) -4.5% 37         2,641 29
    Total  116,773,113  122,182,066  5,408,953 5.6%
    Data from US Bureau of the Census

    Riverside-San Bernardino, long castigated as a “sprawl” market, had the largest population infill, at 19.5 percent. Atlanta ranked number two, at 17.7 percent. This is a real surprise, since Atlanta was the least dense major urban area in the world in 2000, ranked second in 2000s infill. As a result, it is likely that Pittsburgh- often held up as a model of urban regeneration – is now the world’s least dense major urban area. On the other hand, if Atlanta’s infill rate continues, its 2000 urban footprint will be more dense than that of Boston by 2015.

    Austin ranked third, adding 16.6 percent population to its 2000 urban footprint. Las Vegas ranked fourth, with a 15.6 percent increase in its 2000 urban footprint. The density of Las Vegas is increasing so rapidly that by the 2010 census its 2000 urban footprint will be more dense than the 2000 New York urban footprint, should the current rates continue.

    Perhaps most surprising of all is that Houston ranked fifth, added 14.3 percent to its 2000 urban footprint. This may surprise those who have denounced Houston’s largely deregulated regulatory environment, both in the city and in unincorporated county areas in the suburbs. Yet overall Houston’s infill exceeded that of smart growth model Portland. The Rose City stood at sixth, adding 12.4 percent to its 2000 urban footprint.

    Perhaps equally surprising, Portland remains less dense than average for a western urban area. Its 2000 urban footprint density trailing Los Angeles, San Jose, San Francisco, Las Vegas, Denver, Riverside-San Bernardino, Phoenix and Sacramento, while leading only San Diego and Seattle.

    The top ten were rounded out by Phoenix (7th), Dallas-Fort Worth (8th), Orlando (9th) and San Antonio (10th). It is worth noting that like Houston, the unincorporated suburbs of Austin, Dallas-Fort Worth and San Antonio have largely deregulated land use regulation, yet these urban areas ranked high in infill.

    Interestingly some of the greatest infill growth also took place in the fastest growing, traditionally “sprawling” cities. Atlanta also had the largest numeric increase in the population of its 2000 urban footprint, at more than 600,000. Houston was a close second, at nearly 550,000.

    In contrast, population losses since 2000 in the urban footprints of Cleveland, Pittsburgh, Detroit and San Francisco, means these urban areas experienced no population infill. San Francisco’s loss enabled San Jose to move into second position nationally after Los Angeles in the population density of its 2000 urban footprint.

    How the Core Cities Fared

    The core cities (municipalities) attracted, on average, their population share. Approximately 30 percent of the infill growth occurred inside the core cities. Even this figure may be a bit high, due to the impacts of annexation

    All of the infill in Philadelphia, Baltimore, Chicago, Providence and Minneapolis-St. Paul occurred outside the core cities. The city of Portland attracted barely 10 percent of its urban area infill, despite highly publicized (and subsidized) infill projects such as the Pearl District. Core cities attracted the largest share of infill growth in such diverse cities as San Antonio, San Jose, Columbus, Phoenix and New York.

    Note: Additional information available at http://www.demographia.com/db-uzafoot2007.pdf

    Wendell Cox is a Visiting Professor, Conservatoire National des Arts et Metiers, Paris. He was born in Los Angeles and was appointed to three terms on the Los Angeles County Transportation Commission by Mayor Tom Bradley. He is the author of “War on the Dream: How Anti-Sprawl Policy Threatens the Quality of Life.

  • San Jose, California: Bustling Metropolis or Bedroom Community?

    Dionne Warwick posed the question more than 40 years ago, yet most Americans still don’t know ‘The way to San Jose’. Possessing neither the international cachet of San Francisco nor the notoriety of Oakland, San Jose continues to fly under the national radar in comparison to its Bay Area compatriots. Even with its self-proclaimed status as the ‘Heart of Silicon Valley’, many would be hard pressed to locate San Jose on a map of California.

    More well-known American cities may try to gain population by branding themselves as interesting places, but San Jose does not struggle to attract newcomers. Sprawling over 178 square miles, San Jose sits at the southern end of the San Francisco Bay. This year the city exceeded the 1 million population mark for the first time.

    So what makes this city, the 10th-largest in the United States, appealing? Unlike its precious neighbor 50 miles to the north, San Francisco, people move to San Jose primarily for jobs – especially those related to the coveted technology sector. Whereas San Francisco balances its role as playground for the independently wealthy and welfare state for the lumpenproletariat, San Jose remains favored among families and those looking for a safe environment in which to raise children – not to mention, the weather is better.

    San Jose does not stimulate a sense of urban exaltation. Aside from a commercial downtown core with a collection of mediocre high-rises (limited in height due to do downtown’s adjacency to the San Jose Airport), the city is unapologetically suburban in a character.

    San Jose’s pattern of development can be traced back to its origins as an agricultural community supporting early Spanish settlers who chose to settle in the fertile Santa Clara Valley. It remained a modest-size agrarian community until the end of World War II when it underwent a period of rapid expansion-not unlike that of Los Angeles to the south. During the 1950s, with the emergence of semiconductor technology derived from silicon, San Jose and the greater Santa Clara Valley exploded into a center for the evolution of computer technology.

    Today, San Jose can best be understood by its ambivalent relationship with neighboring Silicon Valley cities. Mid-size suburbs such as Cupertino, Sunnyvale, Mountain View and Palo Alto, all located west/northwest of San Jose as one travels up the peninsula towards San Francisco, are very distinct and separate entities. Home to some of Silicon Valley’s heaviest hitters (Cupertino has Apple, Sunnyvale has Yahoo!, Mountain View has Google, Palo Alto has Hewlett-Packard, Facebook and Stanford University), these cities largely define the technology-focused region. To be sure, San Jose’s has its share of big players, including eBay and Adobe as well as the ‘Innovation Triangle’, an industrial area of north San Jose, home to the headquarters of large companies like Cisco Systems and Cypress Semiconductor.

    Yet, despite the presence of these firms, San Jose has become ever more a residential community, with among the worst jobs to housing balances in the region. Furthermore, a whopping 59% of the city’s developed land constitutes residential use – 78% of that being single-family detached housing. In this sense, despite being the largest city, San Jose essentially serves as a ‘bedroom community’ for the rest of Silicon Valley.

    This has been a burden for the city, which, unlike its neighbors, lacks enough large information technology companies to help fill their tax coffers. In contrast job rich ‘green’ cities like Palo Alto have remained staunchly ‘anti-growth’ regarding residential development and consequently have very high housing prices.

    This pattern poses fiscal problems for San Jose. City officials have long been aware of the need to stimulate economic development instead of continuing to lose out to its neighbors but the city seems determined to increase further its role as dormitory for its neighbors. Indeed, amazingly the city’s development agenda has in recent years shifted to a relentless focus on high-density, multi-family residential in the downtown core and along transit corridors. In 2007, 79% of all new housing built in San Jose was multi-family – a staggering deviation from its history of low density development.

    Though well-intentioned, the slant towards densification has yielded a glut of empty condo units throughout the city. Those that have purchased units in new developments often find themselves with underwater mortgages. During a recent visit to one the flashy new downtown condo buildings, The 88, I entered a desolate sales office and was greeted by a skittish sales agent. When asked how sales were, my question was deferred without a direct answer in an act of not-so-quiet desperation.

    Although it’s clear most people in San Jose prefer lower density living, the city government continues hedging tax dollars against a future in which newcomers will want to live in a high-density setting. Outside of downtown, low to mid-rise multi-family housing has been built along the city’s light-rail lines in what are conceived to be ‘transit villages’. The popularity for such a lifestyle is questionable given the high price point and unreasonable HOA dues of these condo units, particularly when single-family detached houses can be purchased at comparable prices.

    Despite these issues, San Jose seems hell-bent on its path towards densification. The city has major plans to develop the area around its Diridon Train Station, just west of downtown, as California High-Speed Rail and BART are projected to make their way to San Jose. Furthermore, the city government is counting on the Oakland A’s baseball team making a move to San Jose.

    From the Champs-Élysées to Tiananmen Square, grand urban visions are what have defined cities historically. As a product of the Silicon Valley ethos as well as an observer of planning trends, I would argue that this is no longer valid – especially for any city with the hopes of a prosperous future. Rather, in democratic societies, it will be the idiosyncrasies of individual actors and the prospect of upward mobility that will define a sense of place.

    Obsessed with density and urban form, planners don’t seem to grasp the chicken and egg conundrum – the notion that lifestyle amenities follow on the heels of economic opportunity. San Jose needs to cast its future on nurturing its entrepreneurs instead of trying to become something it is not yet ready to become.

    Adam Nathaniel Mayer is a native of the San Francisco Bay Area. Raised in the town of Los Gatos, on the edge of Silicon Valley, Adam developed a keen interest in the importance of place within the framework of a highly globalized economy. He currently lives in San Francisco where he works in the architecture profession.

  • Can California Make A Comeback?

    These are times that thrill some easterners’ souls. However bad things might be on Wall Street or Beacon Hill, there’s nothing more pleasing to Atlantic America than the whiff of devastation on the other coast.

    And to be sure, you can make a strong case that the California dream is all but dead. The state is effectively bankrupt, its political leadership discredited and the economy, with some exceptions, doing considerably worse than most anyplace outside Michigan. By next year, suggests forecaster Bill Watkins, unemployment could nudge up towards an almost Depression-like 15%.

    Despite all this, I am not ready to write off the Golden State. For one thing, I’ve seen this movie before. The first time was in the mid 1970s. The end of the Vietnam War devastated the state’s then powerful defense industry, leaving large swaths of unemployment and generating the first talk about the state’s long-term decline.

    An even scarier remake came out in the 1990s. Everything was going wrong, from the collapse of the Soviet Union and the unexpected deflating of Japan to a nearly Pharaonic set of plagues, ranging from earthquakes and fires to the awful Los Angeles riots of 1992.

    Yet each time California came roaring back, having reformed itself and discovered new ways to create wealth. In the wake of the early ’70s decline came the first full flowering of Silicon Valley as well as other tech regions, from the west San Fernando Valley to Orange and San Diego counties. Much of the spark for this explosion of growth came from those formerly employed in the defense and space sectors.

    The ’90s recovery was even more remarkable. Amazingly, the politicians actually were part of the solution. Aware the state’s economy was crashing, the state’s top pols–Assembly Speaker Willie Brown, Sen. John Vasconcellos, Gov. Pete Wilson–made a concerted effort to reform the state’s regulatory regime and otherwise welcomed businesses.

    The private sector responded. High-tech, Hollywood, international trade, fashion, agriculture and a growing immigrant entrepreneurial culture all generated jobs and restored the state’s faded luster.

    These sectors still exist and still excel even under difficult conditions. The problem this time is that the political class seems clueless how to meet the challenge.

    Politics have not always been a curse to California. In the 1950s and 1960s, the Golden State’s growth stemmed in large part from what historian Kevin Starr describes as “a sense of mission” on the part of leaders in both parties. Starr chronicles this period in his forthcoming book, Golden Dreams: California in an Age of Abundance, 1950-1963.

    Under figures like Earl Warren, Goodwin Knight and Pat Brown, Starr notes, California “assembled the infrastructure for a great commonwealth.” Their legacy–the great University system, the California Water Project, the freeways and state park system–still undergirds what’s left of the state economy.

    Perhaps the best thing about these investments was that they helped the middle class. Sure, nasty growers, missile makers and rapacious developers all made out like bandits–which is why many of them also backed Pat Brown. But the ’50s and ’60s also ushered in a remarkable period of widespread prosperity.

    Millions of working- and middle-class people gained good-paying jobs, and could send their children to what was widely seen as the world’s best public university system. People who grew up in New York tenements or dusty Midwest farm towns now could enjoy a suburban lifestyle complete with single-family homes, cars, swimming pools and drive-through hamburger stands.

    “This was an epic success story for the middle class,” historian Starr notes. It’s one reason why, when people ask me about my politics, I proudly identify myself as a Pat Brown Democrat.

    That’s why California’s current decline is so bothersome. A state that once was home to a huge aspirational middle class has become increasingly bifurcated between a sizable overclass, clustered largely near the coast, and a growing poverty population.

    Over the past 40 years California’s official poverty rate grew from 9% to nearly 13% in 2007, before the recession. Three of its counties–Monterey, San Francisco and Los Angeles–boast large populations of the über rich but, adjusted for cost of living, also suffer some of the highest percentages of impoverished households in the nation.

    Most worrisome has been the decline of the middle–the increasingly diverse ranks of homeowners, small business people and professionals. The middle has been heading out of state for much of the past decade. Politically, they have proven no match for the power of the wealthy trustfunders of the left, the powerful public employee union as well as a small, but determined right wing.

    The good news is that the middle class shows signs of stirring. The nearly two-to-one rejection of the governor’s budget compromise reflected a groundswell of anger toward both the Terminator and his allies in the legislature.

    Simply put, California voters sense we need something more than an artful quick fix built to please the various Sacramento interest groups. Required now is a more sweeping revolutionary change that takes power away from the state’s most powerful lobby, the public employees, whose one desired reform would be ending the two-thirds rule for approval of new taxes and budgets.

    Middle-class Californians are asking, with justification, why we should be increasing taxes–we’re ranked sixth-highest in the nationto pay for gold-plated state employee pensions as well as an ever-expanding social welfare program. Although state spending has grown at an adjusted 26% per capita over the past 10 years, it is hard to discern any improvement in roads, schools or much of anything else.

    As an opening gambit, the right’s solution–strict limits on state spending–makes perfect sense. However, long-lasting reform needs to be about more than preserving property and low taxes. To appeal to the state’s increasingly minority population, as well as the younger generation, a reform movement also has to be about economic growth and jobs.

    Not surprisingly, local leaders of the “tea party” movement gained some profile from last week’s vote. Yet the right, which has exhibited strong nativist tendencies, is not likely to win over an increasingly diverse state.

    In my mind, California’s revival depends on three key things. First, the lobbyist-dominated Sacramento cabal needs to be shattered, perhaps turning the legislature into a part-time body, as proposed by one group. Perhaps the cleverest plan has come from Robert Hertzberg, a former Speaker of the Assembly who heads up the reformist California Forward group.

    Hertzberg proposes a radical decentralization of power to the state’s various regions, as well as cities and even boroughs in urban areas like Los Angeles. This would break the power of the Sacramento system by devolving tax and spending authority to local governments.

    Secondly, California needs to develop a long-term economic growth strategy. Over the past decade, California’s growth has become ever more bubblicious, dependent first on the dot-com bubble and then one in housing. The basic economy–manufacturing, business services, agriculture, energy–has been either ignored or overly regulated. Not surprisingly, we could see 20% unemployment, or worse, in places like Salinas and Fresno by next year.

    Third, both political reform and an economic strategy aimed at restoring upward mobility depends on a revival of middle-class politics in this state. It would include building an alliance between the more reasoned tea partiers and saner elements of the progressive community.

    The new alliance would not be red or blue, liberal or conservative, but would represent what historian Starr calls “the party of California.” At last there could be a political home for Californians who are angry as hell but still not yet ready to give up on the most intriguing, attractive and potentially productive of all the states.

    This article originally appeared at Forbes.

    Joel Kotkin is executive editor of NewGeography.com and is a presidential fellow in urban futures at Chapman University. He is author of The City: A Global History and is finishing a book on the American future.

  • California Meltdown: When in doubt, Blame the Voters!

    By rejecting the complex Sacramento budget settlement, Californians have brought about an earthquake of national significance as has not been seen since the passage of Proposition 13 over thirty years ago. Once again, California voters handed politicians something they fear more than anything else, constraints on the ability to raise taxes and raid revenues for their pet interests.

    Some, like long time Los Angeles Times statehouse reporter George Skelton thinks it’s the voters’ fault, as he suggested in his recent op-ed. The problem, we are told, lies with voters. The state’s massive fiscal crisis, which I and others warned was coming, was apparently unforecastable to California politicians and their enablers, like Skelton.

    Blame the voters will become a large part of the national and local media spin. It is not the first time. Consider Proposition 13. The problems that led up to Prop 13 were years in the making, and they were well understood. Inflation and rising home prices were increasing taxes beyond what citizens were prepared to pay. Sacramento tried several times to address the problem, but then as now, politicians couldn’t make hard decisions. The entrenched interests, notably the public employee unions, would not hear of anything that might shrink state revenues.

    Contrary to some versions of history, Proposition 13 was not backed by oil companies, land developers and other business interests. In fact, most opposed it.

    Proposition 13 backers were outmanned, outspent and certainly without much media support. The measure was passed because after years of incompetence in Sacramento, California voters, like Medieval peasants, grabbed their pitchforks and torches and stormed the castle. They passed Prop 13.

    Some interpret this story as showing voter ignorance and fickleness. I interpret it as showing that California voters are patient, but only to a point. Once they have reached a certain point, California voters take matters into their own hands. The results are invariably far more onerous for the state than if the political class had effectively faced the issue. Part of the reason for this is because the voters have fewer tools available to them. Legislatures and governors may have scalpels, voters have only axes.

    Gray Davis was the victim of a similar uprising. He took the fall for a government that had failed. Arnold was going to be different. He would be the Governator. He won election promising mortal combat with special interests. In 2005, he tried to change things but was outmaneuvered by his union-backed opponents. After losing round one, he became Gray Davis but without his predecessor’s grasp of the essentials of government. As the Sacramento Bee’s Dan Walters has pointed out, hubris and ignorance make a deadly combination.

    Now, we have a budget crisis, and California voters are unwilling to give Sacramento a pass. Why?

    Maybe they don’t think they are getting value for their increased investment in government. California spent about $2,173 per resident (2000 dollars) in the 1997-1988 budget. The 2007-2008 budget spends about $2,738 (2000 dollars) per resident. That represents a 26 percent increase in real (inflation adjusted) per-capita spending in ten years.

    What have California voters purchased with their 26 percent increase in government spending? Are the roads 26 percent better? Are schools 26 percent better? What is 26 percent better?

    That is Sacramento’s problem. It is very hard to identify what good that this increase in spending has purchased. If it has been a good investment, why haven’t California’s leaders convinced the voters?

    Maybe you can make a case that we are 26 percent better off; maybe not. I don’t know, but then I haven’t seen a strong effort to make the case. Instead, we get predictions of doom. We’ll cut back on teachers. We’ll let prisoners out of jail. Skelton says “And, oh yes, the elderly poor, blind and disabled – welfare moms and children’s healthcare? They’ll take the biggest hits, as usual.”

    The problem with predictions of doom is that they don’t ring true, or they sound as if the political leaders will punish voters for forcing the leaders to face a budget constraint. Voters can remember 1997-1998. California had teachers. Prisoners were in jail. Healthcare was provided for those with the least resources. If California had these essential services then, and the State is spending 26 percent more now, why cut those essential services now?

    That is the question the California’s leaders have to answer soon. Today Sacramento faces a crisis. The governor and the legislature will have to deal with a real binding budget constraint, and how they choose to deal with that constraint will make a huge difference. They could show leadership. They could make difficult choices. They could stand up to the special interests that will spare no effort to punish them.

    They may not. They may try to punish voters by cutting essential services. They may try even more Enron-style accounting tricks. They may sell assets or use federal money to push the problem to future legislators and governors. They may make poor choices. They may avoid cutting entitlements and public employee pensions, the real source of the state’s fiscal distress.

    We are heading towards a convulsion, not only here in California but in a host of high-tax, high-regulation states now controlled by their own employees. This includes New York, Illinois, and New Jersey for starters. In the age of Obama, with its celebration of bigger government, this suggests perhaps a whiff of a counter-revolution.

    Bill Watkins, Ph.D. is the Executive Director of the Economic Forecast Project at the University of California, Santa Barbara. He is also a former economist at the Board of Governors of the Federal Reserve System in Washington D.C. in the Monetary Affairs Division.

  • In California, the Canary is Dead

    Canaries were used in early coal mines to detect deadly gases, such as methane and carbon monoxide. If the bird was happy and singing, the miners were safe. If the bird died, the air was not safe, and the miners left. The bird served as an early warning system.

    Domestic migration trends play a similar early warning system for states. California’s dynamism was always reflected by its ability to attract newcomers to the state. But today California’s canary is dead.

    Here’s the logic. If net domestic migration is positive, the state’s economy is reasonably sound. Economic growth, taxes, housing, and amenities are strong enough to keep people where they are and attract others. If net domestic migration is negative, it usually means that lack of economic growth, taxes, quality of life, and housing have deteriorated sufficiently to drive people away. This happens despite the inevitable pain of leaving the security and comfort of family, friends, and familiar surroundings.

    California has been a destination for migrating workers and families since 1849. They came form every state and from around the world. Often the migrants faced tremendous challenges and hardship. Illegal immigrants from Mexico and other developing countries still must leap over such barriers. Often, California’s migrants came in waves. The 1850s, 1930s, and 1950s all saw huge surges tied to huge events – the Gold Rush, the Depression and the post-war boom. But even between these waves, California consistently experienced a steady inflow of new immigrants.

    Immigration has been good for California. The new residents brought ambition, skills, and a willingness to take risks. They found a state with abundant natural resources, from oil to rich soil and ample, if sometimes distant water resources. Together with the people already there, they created an economic powerhouse. They built cities with amenities that rival any other. They fed much of the nation and large numbers overseas. They did this while persevering much of California’s unique endowment: the vast coastline, the Sierra Nevada, and the deserts.

    California, with 12 percent of the United States population, became the world’s sixth largest economy while managing to maintain the aura of paradise at the same time. Opportunity and housing were abundant. California was a great place to have a career and raise a family.

    Most recently, though, this has begun to change. California is no longer a preferred destination, at least for domestic migrants. The state’s economy is limping along considerably worse than that of the nation. Opportunity is limited. Housing is relatively expensive, even after the dramatic deflation of the past two years, except for some very hard-hit and generally less attractive inland areas. Taxes are high and increasing. Regulation is onerous and becoming more so. Many California communities are outright hostile to business.

    Consequently, net domestic migration has been negative for 10 of the past fifteen years. International migration to California remains positive, but that reflects more on the weakness of the economies and the attraction of existing ethnic networks than the intrinsic superiority of California. This represents a sea change: anyone predicting it fifteen years ago would have been laughed out of the room.

    What happened?

    California’s economy was badly hit by the 1990s recession. The State’s aerospace and defense sectors were especially decimated. Middle-class families moved out by the hundreds of thousands.

    The 1990s out migration caused some soul searching in California. There was lots of talk, and a little action on making the State more competitive. Then came the technology and real estate booms. Domestic migration turned positive. The half-hearted efforts to make California more competitive faded as policy makers were lulled into complacency by the strength of California’s resurgence.

    But the problems that bedeviled the state in the 1990s – high housing prices and taxes, cascading regulations and a deteriorated infrastructure – had only been obscured by the boom. By 2005 migration began to turn negative, largely as soaring housing prices discouraged newcomers and encourage many residents to cash out and move to less expensive places. California had priced itself, and the dream, out of competitiveness. Since then, California has seen four consecutive years of increasingly negative domestic migration. The recent net outflow numbers have been smaller than in the 1990s, but it may be because other tradidional California migrant destination economies – like Oregon, Washington, Nevada and Arizona – have become less competitive as well.

    Today, many argue that California will bounce back, but they can’t identify the reason. What sector will lead the resurgence? They seem to think economic growth will come with the sunshine, beaches, and mountains. There was plenty of sunshine in the 80 years between the founding of the first mission and the gold rush, and not much happened. Similarly, the differences between California cities and neighboring Mexican cities show clearly that successful economies need more than good looks and nice climate.

    It’s hard right now to assume California’s future will include the same predominance in technological innovation. Agriculture is running out of water, in large part due to environmental lawsuits, and the state no longer seems willing to invest in new water projects. Even the entertainment industry is increasingly looking outside of California for growth. You have to ask: what does California offer that will overcome the State’s high costs, regulatory environment, and antipathy to business?

    That is the short term. The long term doesn’t look very good either. The public universities, a major source of innovation over the past two decades, are facing increasingly severe budget challenges. It is unlikely that they will be able to maintain their status even as other states – Texas, Colorado, New Mexico – eye further expansion. Even more ominous are gains in countries, such as China and India, who have long sent their best and brightest to the Golden State.

    All this suggests a relative decline in California’s long-term prospects. What should we do? Part of California’s problem is its political process. The state’s chronic inability to do much of anything reinforces stasis. As Dan Walters says, “everyone has a veto on everything.”

    But even improving the political process may not be enough. Much of Coastal California is dominated by rich, aging, baby boomers. The residents of this increasingly geriatric ghetto often don’t worry much about economic opportunity. They may have the money and votes to guarantee that growth does not impinge on their lifestyles. Unless these conditions change, it will be unlikely to see a renewal of strong domestic migration to California in the coming years.

    Bill Watkins, Ph.D. is the Executive Director of the Economic Forecast Project at the University of California, Santa Barbara. He is also a former economist at the Board of Governors of the Federal Reserve System in Washington D.C. in the Monetary Affairs Division.

  • U-Haul Prices as Migration Indicator

    Austin fared very well on this year’s Best Cities Rankings, and here’s another interesting indicator of the difference in migration between Austin and San Francisco:

    “When comparing California with Texas, U-Haul says it all. To rent a 26-foot truck oneway from San Francisco to Austin, the charge is $3,236, and yet the one-way charge for that same truck from Austin to San Francisco is just $399. Clearly what is happening is that far more people want to move from San Francisco to Austin than vice versa, so U-Haul has to pay its own employees to drive the empty trucks back from Texas.”

    This anecdote comes from a report comparing business environments in Texas to California.

    Here’s a table of the latest domestic migration numbers from US Census for all metropolitan areas of more than 1.5 million total population (rate numbers are per 1,000 population):

    NAME
    Population, 2008
    Net Domesitc Migration Rate, 2008
    Ave. Net Domesic Mig Rate, 2001-2008
    New York-Northern New Jersey-Long Island, NY-NJ-PA 19,006,798 -7.6 -12.0
    Los Angeles-Long Beach-Santa Ana, CA 12,872,808 -9.0 -12.2
    Chicago-Naperville-Joliet, IL-IN-WI 9,569,624 -4.4 -6.8
    Dallas-Fort Worth-Arlington, TX 6,300,006 7.0 5.7
    Philadelphia-Camden-Wilmington, PA-NJ-DE-MD 5,838,471 -3.8 -2.3
    Houston-Sugar Land-Baytown, TX 5,728,143 6.6 4.5
    Miami-Fort Lauderdale-Pompano Beach, FL 5,414,772 -8.7 -5.1
    Atlanta-Sandy Springs-Marietta, GA 5,376,285 8.2 10.2
    Washington-Arlington-Alexandria, DC-VA-MD-WV 5,358,130 -3.4 -2.9
    Boston-Cambridge-Quincy, MA-NH 4,522,858 -1.8 -7.1
    Detroit-Warren-Livonia, MI 4,425,110 -13.9 -9.1
    Phoenix-Mesa-Scottsdale, AZ 4,281,899 12.3 17.9
    San Francisco-Oakland-Fremont, CA 4,274,531 1.3 -10.5
    Riverside-San Bernardino-Ontario, CA 4,115,871 -1.9 16.1
    Seattle-Tacoma-Bellevue, WA 3,344,813 3.6 0.9
    Minneapolis-St. Paul-Bloomington, MN-WI 3,229,878 -1.1 -1.0
    San Diego-Carlsbad-San Marcos, CA 3,001,072 0.1 -4.8
    St. Louis, MO-IL 2,816,710 -2.0 -1.8
    Tampa-St. Petersburg-Clearwater, FL 2,733,761 2.4 12.9
    Baltimore-Towson, MD 2,667,117 -4.6 -1.6
    Denver-Aurora, CO /1 2,506,626 7.3 1.8
    Pittsburgh, PA 2,351,192 -1.0 -2.9
    Portland-Vancouver-Beaverton, OR-WA 2,207,462 8.3 6.2
    Cincinnati-Middletown, OH-KY-IN 2,155,137 -1.7 -1.2
    Sacramento–Arden-Arcade–Roseville, CA 2,109,832 2.2 8.7
    Cleveland-Elyria-Mentor, OH 2,088,291 -7.1 -7.5
    Orlando-Kissimmee, FL 2,054,574 1.6 15.9
    San Antonio, TX 2,031,445 11.5 10.4
    Kansas City, MO-KS 2,002,047 0.7 1.5
    Las Vegas-Paradise, NV 1,865,746 7.9 23.7
    San Jose-Sunnyvale-Santa Clara, CA 1,819,198 -1.5 -16.4
    Columbus, OH 1,773,120 1.4 1.8
    Indianapolis-Carmel, IN 1,715,459 4.0 4.8
    Charlotte-Gastonia-Concord, NC-SC 1,701,799 20.9 18.2
    Virginia Beach-Norfolk-Newport News, VA-NC 1,658,292 -9.4 -0.6
    Austin-Round Rock, TX 1,652,602 22.0 17.2
    Providence-New Bedford-Fall River, RI-MA 1,596,611 -6.6 -3.7
    Nashville-Davidson–Murfreesboro–Franklin, TN 1,550,733 10.9 9.6
    Milwaukee-Waukesha-West Allis, WI 1,549,308 -4.2 -5.9