Tag: San Francisco

  • The Story of How Marin Was Ruined

    Marin County is a a picturesque area across the Golden Gate Bridge from San Francisco of quaint walkable towns, with homes perched on rolling hills and a low rise, unspoiled feel. People typically move to Marin to escape the more urbanized South and East Bay and San Francisco. Eighty-three percent of Marin cannot be built on as the land is agricultural and protected open space. 

    This is not stopping ABAG, developers, social equity, housing and transit advocates from pushing for high density housing near transit in Marin. Plans for high density housing have sprung up the length of the county – multiple Marin communities found themselves declared Plan Bay Area "Priority Development Areas" (PDAs) making them targets for intense high density development. These designations occurred with little or no consultation by the elected officials that had volunteered them, and without any clear understanding of obligations to develop or impact.

    Residents finally came together and said they’d had enough after an unsightly 5 story, 180 unit apartment complex appeared adjacent to an existing freeway choke-point – the city that allowed it had little choice due to onerous ABAG housing quotas that if unmet left the town open to litigation by housing advocates with crippling legal bills and penalties. The last straw was the publication of a station area plan to generate transit ridership that suggested 920 more high density units be built in nearby Larkspur – another freeway bottleneck. 

    This video, put together by Citizen Marin, a coalition of neighborhood groups seeking to restore local control, was put together to drive awareness of this accelerated urbanization. For Marinites the video serves as a wake up call – most moved to Marin to live in a more rural / suburban location. Marin offers some of California’s most walkable and attractive downtowns already: Sausalito, Mill Valley and San Rafael. All offer the kind of small town charm that are a model for others to emulate and attract visitors and residents.

    The video was written and produced by Citizen Marin’s Richard Hall. The video’s narrator is from San Rafael – not San Rafael in Marin County but San Rafael, Argentina, and the animation was put together by a team from Kathmandu Nepal.

  • How Houston’s Missing Media Gene Hobbles Its Global City Ambitions

    In an upcoming study I am working on with Chapman University’s Center for Demographics and Policy, we show that San Francisco and Houston are North America’s “emerging” global cities. They are also rival representative champions and exemplars of two models of civic development. San Francisco is the world’s technology capital; focused on the highest levels of the economic food chain; paragon of the new, intangible economy; and promoter environmental values and compact development.  Houston is the closest thing to American laissez-faire; unabashed embracer of the old economy of tangible stuff, including unfashionable, but highly profitable, industries like oil, chemicals, and shipping.

    San Francisco embraces development restrictions that it sees as environmentally sustainable — and not coincidentally produced the highest housing costs compared to income in the nation, rendering the region unaffordable to all but the elite — whereas Houston has risen as an “opportunity city” for the non-elite; and the land of no-zoning and unrestricted development.  Somewhat unexpectedly, both cities are remarkably socially tolerant. Houston has an openly lesbian Democratic mayor and is extremely diverse, and while San Francisco may be a bit more free wheeling with its Folsom Street Fair and such, it’s also more strictly enforces its intellectual and political orthodoxy.

    Yet to date the competition between these two emerging models has been non-existent, at least from Houston’s perspective. Simply put, the Bay Area has played its hand brilliantly, and is lavished with praise in the media. In contrast Houston seems to be missing the self-promotion gene, at least outside what it has to pay for with advertising. The Bay Area has built its own image, often with the avid support of journalists who grant tech moguls demi-god status, and understandably prefer San Francisco’s spectacular scenery, mild weather and world-class restaurants to flat, steamy Houston, whose exciting food scene is typically housed in nondescript strip malls.

    In conventional (that is New York or London) terms it’s easy to see San Francisco as a global capital. It has long been established as an elite national center, the financial capital of the West Coast, as well as the traditional center, along with parts of New York, of the American counter-culture. With the comparative decline of Los Angeles, the Bay Area reigns supreme on the west coast. Its technology industry strides the globe like a colossus, its tech titans have managed, at least to date, to play simultaneously the roles of both modern day robber barons and populist heroes.

    Houston is less obvious. Though the energy capital of the world, Houston is still emerging as a prominent national and global city. It’s less mature, and was a small, obscure city when San Francisco was already emerging as the uncontested capital of the west coast.  And unlike San Francisco, whose only real rival is much smaller Seattle, Houston competes with an equally large, and in many ways also rising rival in Dallas-Ft. Worth.

    Unlike tech, energy has produced few rockstars, but many who are castigated as demons. Although there are 5,000 energy companies and 26 Fortune 500 headquarters in Houston, few of its leaders have achieved public prominence apart from Dick Cheney and Enron’s Jeff Skilling and Ken Lay — not exactly folk heroes.

    This is not to say some energy people don’t deserve celebration. For example, few Americans noticed the recent death of George Mitchell, the father of the fracking revolution that has driven America’s greenhouse gas emissions down at the fastest rate in the world, and one of America’s premier developers of master planned developments in the form of The Woodlands near Houston. The Economist said of this son of poor Greek immigrants, “Few businesspeople have done as much to change the world as George Mitchell.”  (Most people hearing the name would probably think of former Maine Senator George Mitchell).

    The maturity curve alone isn’t enough to account for the difference. Two additional factors are at work. First, the Bay Area self-consciously sees itself as a leader and moral exemplar. It wants to world to follow where it leads. Houston it seems, perhaps in line with its laissez-faire approach, wants to leave others alone, and be left to its own.  It may boast of having a great model, but whether others adopt has been of no particularly great local concern.

    The second big divergence relates to media. After all, the media, understood broadly, is how we come to have knowledge about or opinions of many things. Simply put, San Francisco and the tech industry get the power of media, while Houston doesn’t.

    The content creators may still prefer a New York, LA, or DC but the tech moguls are circling the last redoubts of entertainment and information.   Apple now has a dominant position in content distribution for music and is expanding in other areas.  Google generates huge advertising revenues that are greater than the entire newspaper and magazine industry.  Despite its many troubles, Yahoo remains one of the most-visited news sites. Meanwhile in just last year or two, Facebook co-founder Chris Hughes has bought the venerable New Republic while Seattle’s Jeff Bezos  recently bought the Washington Post. Pierre Omidyar, founder of Ebay, recently announced a $250 million new media venture featuring Glenn Greenwald and other well-known leftist media types.

    This isn’t just hubris, it’s good business. With Silicon Valley magnates starting to come under the same scrutiny as their 1% peers in other industries, it pays to have the means to control the narrative. Glenn Greenwald helped break the story on NSA snooping, but now that he’s on Silicon Valley’s payroll, how likely is it that he’ll take a similarly tough line on tech company privacy matters?  Give the Bay Area/tech crowd their due – they know what they are doing.

    Houston, by contrast, has close to zero media influence or impact and seems not to care. It’s much less an influencer of media than one whose reputation has been shaped by it, and often not in a good way. Though there are many sprawl dominated metropolises in America, it’s Houston that has become the bête noire of urbanists.

    It’s easy to understand historically why Houston has so little media influence, but harder to understand why the city is so blasé about it.  Tory Gattis, a former McKinsey consultant and local Houston blogger, suggests that it has to do with the DNA of the energy industry.  Most energy companies in Houston are B2B operations, so have little need for mass media. Energy has always been a political game and the industry’s approach has been a fairly direct one: employ a phalanx of lobbyists and former politicians around the world to help secure deals.  Also, unlike with the latest smart phone or social media app, you don’t need to convince anybody to fill up his gas tank or turn on his furnace in the winter.  The product is already completely understood by the end customer and literally sells itself.

    This mindset explains why the city has a blind spot, a missing gene if you will, that keeps it from understanding the necessity of having a robust media presence as part of its ambition to become a true global city. The Bay Area tech community may have been slow to the party when it comes to lobbying, but they are spending big to catch up fast and many of their executives have political as well as media aspirations. But despite its incredible wealth and surfeit of billionaires, Houston is absolute nowhere when it comes to media or thought leadership, and seems indifferent to the fact.

    Beyond merely asserting a role on the stage, getting in the media game is critical to the survival of Houston and its model.  The Bay Area sees itself as a model for a future America and world. It is spending big, lobbying big, and invading politics to create the kind of future it wants to see. Its mindset is to dominate.

    Houston may be content to let San Francisco go its own way but the reverse does not hold.  Silicon Valley has its sights set on overturning the fossil fuel industry through big investments (and good ol’ government pork) in green tech companies. Legal mandates that favor their investments are popular. It should be no surprise that folks like Bay Area billionaire Thomas Steyer have been vocal opponents of the KeystoneXL pipeline. (Such opposition is not uniform. Mark Zuckerberg’s Fwd.us organization supports KeystoneXL. But there’s clearly a lot of Silicon Valley support for policies that aren’t great for the Houston model).

    Houston can brag all its wants about its legitimate accomplishments in important areas like job and population growth and in providing middle-class opportunity. But if it wants to claim the mantle of global city, or even just head off threats to its way of doing business, it needs, like the Bay Area, to self-consciously stake out the role of leader.  For starters, that means putting its bigtime financial and intellectual muscle behind getting its message out. That means, like it or not, investing not only in oil wells, but inkwells.

    Aaron M. Renn is an independent writer on urban affairs and the founder of Telestrian, a data analysis and mapping tool. He writes at The Urbanophile.

    Photo by telwink.

  • High Speed Rail Decision: Victory for Rule of Law

    California Judge Michael Kenny has barred state bond funding for the California high speed rail system, finding that “the state’s High-Speed Rail Authority failed to follow voter-approved requirements designed to prevent reckless spending on the $68 billion project.” These protections had been an important in securing voter approval of a $10 billion bond issue in 2008. Sacramento Bee columnist Dan Walters suggested that without the protections in Proposition 1A, the measure “probably would have failed” to obtain voter approval.

    According to the court decision, the California High Speed Rail Authority (CHSRA) had failed to identify $25 billion of the funding that would be necessary to complete the first 300 mile segment. This was required by the terms of Proposition 1A as enacted by the legislature and approved by the voters. Yet, without a legally valid business plan, CHSRA was steaming ahead, at least until the court decision.

    The principal longer-term significance of the ruling is that “rule of law” remains in effect in California. Elizabeth Alexis, co-founder of Californians for Responsible Rail Design (CARRD), a group opposed to the project,  told the Los Angeles Times that CHSRA had been conducting itself as if it were “above the law” (Note 1).

    Judge Kenny’s decision means that the state of California cannot ignore its laws, even when its leadership finds them politically inexpedient. Just like the businesses from the largest companies to the smallest used car lot, the law forbids the state from making legally binding promises and then casting them aside arbitrarily.

    The Court Decision

    The San Diego Union-Tribune summarized the court decision as follows:

    Superior Court Judge Michael Kenny ruled that the California High-Speed Rail Authority could not proceed with using billions of dollars in bond funds to begin construction because it had not credibly identified funding sources for the entire $31 billion it will take to finish the 300-mile initial segment, nor had it completed necessary environmental reviews for the segment. These requirements were among the taxpayer protections written into law by California voters in November 2008, when they voted narrowly for Proposition 1A to allow the state to issue $9.95 billion in bonds as seed money for the project. Kenny said the state must develop a plan that comports with these requirements.

    The Union Tribune further reported that Judge Kenny rejected arguments by the state Attorney General that state the legislature, rather than Proposition 1A (now state law which has not been repealed) was the final authority on how the bonds are used.

    The Los Angeles Daily Newsindicated that the decision left the high speed rail project without either a funding plan or the ability to borrow money. The only remaining source of construction funding is a federal grant, which requires a match of state funding.

    Background

    Proposition 1A and the high speed rail project have had a difficult history.

    A $10 billion high speed rail bond issue to support the project (then called Proposition 1) was scheduled for 2008, after having been postponed twice. There was concern, however, in the state legislature that Proposition 1 had insufficient fiscal, environmental and management guarantees to attract a majority vote of the electorate. As a result, legislature enacted and Gov. Arnold Schwarzenegger signed Assembly Bill 3034, which added substantial protections and recast the ballot measure as Proposition 1A. Assemblywoman Catherine Gagliani, the author, said that the legislation “establishes additional fiscal controls on the expenditure of state bond funds to ensure that they are directed to construction activities in the most cost-effective and efficient way.”

    Leading high speed rail proponent and then CHSRA Chairman Quentin Kopp (Note 2), applauded Assembly Bill 3034 indicating that “Californians will now be able to vote on a high-speed train system grounded in public-private financing and guided by fiscal accountability with the guarantee of no new taxes to fund the system,"

    The Promised System

    In the voter ballot pamphlet, proponents told voters that the proposed system would operate from San Francisco to Los Angeles and Anaheim, as well as through the Inland Empire (Riverside-San Bernardino) to San Diego and to Sacramento. This complete system was to cost $45 billion, according to the proponents (a figure that had already risen substantially).

    Like many other large infrastructure projects, costs were soon to explode. By 2011, the cost had escalated to a range of almost $100 billion to more than $115 billion. Further, the promised extensions to Sacramento and the Inland Empire and San Diego were not included in that price (Note 3).

    From High Speed Rail to “Blended” System

    The political reaction to the cost escalation was negative, leading the CHSRA to radically revise the remaining San Francisco to Los Angeles and Anaheim line. CHSRA removed exclusive high-speed rail tracks in the San Francisco-San Jose and Los Angeles metropolitan areas. The cost of this "blended" system was estimated at $68 billion. CHSRA maintained its claim that the legislatively required travel time of 2:40 could be achieved without the genuine high speed rail configurations in the two metropolitan areas. Sacramento Beecolumnist Walters characterized this expectation as based on “assumptions that defy common sense.”

    Former CHSRA Chair Quentin Kopp withdrew his support at this point, referring to the “blended system” as “the great train robbery.” Kopp also raised the possibility that the new plan could violate Proposition 1A, a judgment that Judge Kenny’s decision confirmed.

    Kevin Drum, of Mother Jones may have provided the best summary of situation as it stands today:

    Its numbers never added up, its projections were woefully rose-colored, and it was fanciful to think it would ever provide the performance necessary to compete against air and highway travel. Since then, things have only gotten worse as cost projections have gone up, ridership projections have gone down, and travel time estimates have struggled to stay under three hours.

    Drum had previously characterized CHSRA claims as “jaw-droppingly shameless,”adding that “A high school sophomore who turned in work like this would get an F.”

    Where From Here?

    Proponents have not given up. As The Economistreported, proponents took comfort in the fact that “Judge Kenny did not cancel the project altogether.” The Economist continued “But if that is a victory, it is not clear how many more wins California high-speed rail can handle.”

    The stalwart supporter San Francisco Chronicle editorialized that the court decision was a “bump” in the path for the project. Yet even the Chronicle conceded that: “The court results are a serious warning sign that the financial fundamentals need work.” 

    Too Big to Fail?

    Columnist Columnist Dan Walters fears that to make the financial fundamentals work would require making the project “too big to fail:”

    As near as I can tell, the HSR authority’s plan all along has been to simply ignore the law and spend the bond money on a few initial miles of track. Once that was done, no one would ever have the guts to halt the project because it would already have $9 billion sunk into it. So one way or another, the legislature would keep it on a funding drip.

    Such a strategy would force California taxpayers to fill the gargantuan funding gap, which for the entire Los Angeles to San Francisco line now stands at approximately $65 billion. With the federal funding of approximately $3 billion, the state is 95 percent short of the $68 billion it needs.

    California taxpayers may not be so accommodating. Even before Judge Kenny’s decision, LA Weekly reports that a USC/Los Angeles Times poll shows statewide opposition now to have risen to 53 percent of voters, while 70 percent would like to have a new vote on Proposition 1A (see “Californians Turn Against LA to SF Bullet Train”).

    Even the federal funding is being questioned.  California Congressman Jeff  Denham, also a former supporter of the project, joined with Congressman Tom Latham to ask (link to letter) the United States Government Accountability Office if  further federal disbursements could be illegal, given the uncertainty of the state funding needed to “match” the federal grant.

    Congressman Kevin McCarthy, the majority whip in the US House of Representatives has indicated that he will work with others in Congress to deny further federal funding to the project.

    The San Jose Mercury-News, which like the Chronicle had been a strong supporter of Proposition 1A in 2008 has long since climbed off the train. In an editorial following Judge Kenny’s decision, the Mercury-News decried the project’s “bait and switch,” tactics and called for “an end to this fraud.”

    The Winners: California Citizens

    At this point, the words of legendary New York Yankees catcher Yogi Berra seem appropriate: “It ain’t over till it’s over.” However, Judge Kenny has rewarded California citizens with something that never should have been taken away from them – a government that follows its laws.

    —-

    Note 1: This is not the first time that the state has run afoul of the law on the high speed rail project. According to the Sacramento Bee:

    The Howard Jarvis Taxpayers Association had challenged the ballot language for Proposition 1A, arguing the Legislature used its pen to “lavish praise on its measure in language that virtually mirrored the argument in favor of the proposition.” The appeals court sided with HJTA [stating], “the Legislature cannot dictate the ballot label, title and official summary for a statewide measure unless the Legislature obtains approval of the electorate to do so prior to placement of the measure on the ballot.”

    Unlike the present decision, the state suffered no consequences for its violation and Proposition 1A was not invalidated.

    Note 2: Chairman Kopp is a retired judge, former state Senator and former member of the San Francisco Board of Supervisors.

    Note 3: Joseph Vranich and I have authored two reports questioning the ability of the California high speed rail system to meet its objectives (financial, environmental, ridership, and operations). The first, The California High Speed Rail Proposal: A Due Diligence Report, was published by the Reason Foundation, Citizens Against Government Waste and the Howard Jarvis Taxpayers Association in 2008. The second, California High Speed Rail: An Updated Due Diligence Report, was published by the Reason Foundation in 2012.

    —-

    Wendell Cox is a Visiting Professor, Conservatoire National des Arts et Metiers, Paris and the author of “War on the Dream: How Anti-Sprawl Policy Threatens the Quality of Life.

    Photo: US Constitution (from National Archives)

  • Los Angeles: Will The City Of The Future Make It There?

    When I arrived in Los Angeles almost 40 years ago, there was a palpable sense that here, for better or worse, lay the future of America, and even the world. Los Angeles dominated so many areas — film, international trade, fashion, manufacturing, aerospace — that its ascendency seemed assured. Even in terms of the urban form, L.A.’s car-dominated, multipolar configuration was being imitated almost everywhere; it was becoming, as one writer noted, “the original in the Xerox” machine.

    Yet today the nation’s second-largest city seems to have fallen off the map of ascendant urban areas. Today’s dynamic cities in terms of job and population growth are the “new Los Angeleses,” such as Houston, Dallas, Phoenix or Charlotte; at the same time L.A. lags many more traditional “legacy” cities in job creation and growth, notably New York, Boston and Seattle. Worst of all, L.A. has lost its status as the dominant city on the West Coast; that title, in terms of both economic and political power, has shifted to the tech-heavy Bay Area.

    With a weak economy and little media outside Hollywood, the city has lost much of its cachet. A Businessweek survey last year ranked San Francisco asAmerica’s best city to live in. Los Angeles was 50th, behind such unlikely competitors as Cleveland, Omaha, Tulsa, Indianapolis and Phoenix. In another survey that purported to identify the top 10 cities for millennials, Seattle ranked first, followed by Houston, Minneapolis, Dallas, Washington, Boston and New York. Neither L.A. nor Orange County made the cut.

    L.A.’s relative decline reflects a collective inability to readjust to changing economic conditions. Some of this has to do with the end of the Cold War, but also with the loss of the headquarters of many of the area’s top defense contractors, such as Lockheed and, most recently, Northrop Grumman. In 1990, the county had 130,100 aerospace workers. A decade later, that number dropped by more than half to 52,400. By 2010, the county’s aerospace jobs numbered 39,100.

    With the exception of drone technology, the region’s aerospace industry, as one analyst put it, has become “dormant,” a victim of a talent drain and a difficult business environment. This decline has weakened the metro area’s standing as an industrial center — L.A. has lost almost 20% of its manufacturing jobs since 2007. Meanwhile STEM employment in the Los Angeles-Santa Ana area is still stuck below its 2002 levels; once arguably the world’s largest agglomeration of scientists and engineers, the region has now dipped below the national average in the proportion of STEM jobs in the local economy.

    In contrast to the Bay Area, whose tech community also was largely nurtured by defense contracts and NASA, L.A.’s defense and aerospace industries never pivoted into the vast civilian market. Capital, too, has played a role. The L.A. area has lots of rich people, but a relatively weak venture capital community. For example, the Bay Area was a recipient of roughly 45% of U.S. venture capital investment in the third quarter of 2013, while far more populous Los Angeles-Orange County took in under 6.5%.

    The growth of VC-financed companies is one reason why L.A. has been less able to produce high wage jobs than its northern rival. According to a recent projection by Economic Modeling Specialists Inc., high-wage jobs will account for only 28% of L.A.’s job growth from 2013 through 2017 compared to 45% in the Bay Area.

    Far greater problems can be seen further down the economic food chain. The state’s heavy industry — traditionally the source of higher-paid blue-collar employment — entirely missed the nation’s broad manufacturing resurgence. In the first decade of the 2000s, according to an analysis by the Praxis Strategy Group, L.A. lagged all but 10 of the nation’s 51 large metro areas in creating manufacturing jobs.

    Two other once-unassailable economic niches in L.A., its port and entertainment, also are under assault. The expansion of the Panama Canal has increased the appeal of the Gulf ports, as do plans for expanded port facilities in Baja, California.  These shifts threaten many of the roughly 500,000 generally well-paid blue-collar jobs in the local logistics industry.

    Then there’s the slow but steady erosion of L.A.’s dominance in its signature industry, entertainment. Motion picture employment is down 11,000 since 2001. In the same period New York has notched modest gains alongside growth in New Orleans and Toronto. New announcements of industry expansions and an uptick in production in L.A. show that Tinseltown is far from dead, but challenges continue to mount from overseas and domestic competitors.

    Perhaps most shocking has been the tepid response to this relative decline among L.A.’s business and political leaders. Once local entrepreneurs imagined great things, like massive water and port systems, dominated the race for space and planned out the suburban dreamscapes of Lakewood, Valencia and the Irvine Ranch.

    Arguably the signature achievement of this past decade, and the one getting the most attention in the media, has been the revival of downtown as a residential and cultural hub. Having essentially abandoned the model of a multipolar city, L.A. has poured billions in infrastructure and subsidies into a half-baked attempt to turn Los Angeles into a faux New York. This is something of a fool’s errand since barely 3% of area residents work downtown, and most cultural consumers live far away on the westside or in the San Fernando Valley.

    New Mayor Eric Garcetti is also a density advocate, and is placing huge bets on the massive building of high-end high-rise housing, all this despite weak job and population growth. In his campaign he emerged as the candidate of developers who want to densify the city, including Hollywood, over sometimes fierce grassroots opposition.

    Compared to his inept and economically clueless predecessor, Antonio Villaraigosa, Garcetti represents something of an upgrade. He at least knows jobs matter at least as much as development deals for contributors. Yet he remains pretty much a creature of the failed leadership culture of L.A., which is dominated by public employee unions, subsidy-seeking developers and greens, largely from the city’s affluent westside.

    Can L.A. turn itself around? The essential ingredients that drove the city’s ascendency remain: its location on the Pacific, its near-perfect climate and spectacular topography. The key now is for the region to build an economic strategy that allows it to use its assets, and build around its increasingly immigrant-dominated grassroots economy. Innovation in music, fashion and food continue at the grassroots level, with much of the inspiration coming from the city’s increasingly racially diverse mestizo culture.

    What L.A. needs now is not a slick media campaign, but a concerted effort to tap this neighborhood-centered energy. The city of the future needs to reinvent itself quickly, before it fades further behind its competitors on the coasts and in Texas. Successful cities such as  Boston, San Francisco, Seattle  and Houston all managed to find ways to nurture new industries to supplement their traditional ones. Los Angeles should be able to do the same, but only if it seizes on its fundamental assets can it again become a city with a future.

    This story originally appeared at Forbes.com.

    Joel Kotkin is executive editor of NewGeography.com and Distinguished Presidential Fellow in Urban Futures at Chapman University, and a member of the editorial board of the Orange County Register. He is author of The City: A Global History and The Next Hundred Million: America in 2050. His most recent study, The Rise of Postfamilialism, has been widely discussed and distributed internationally. He lives in Los Angeles, CA.

  • The ‘Great State’ of San Francisco

    The public stock offering by Twitter reflects not only the current bubble in social media stocks, but also the continuing shift in both economic and political power away from Southern California to the San Francisco Bay Area, home to less than one in five state residents. Not since the late 19th century, when San Francisco and its environs dominated the state, has influence been so lopsidedly concentrated in just one region.

    The implications of this shift are profound not only for the ascendant northerners, but also for the increasingly powerless, rudderless regions that are home to the vast majority of Californians. With some 16 million residents by far the state’s largest region, Southern California long dominated both state politics and the economy. Today it, along with virtually all interior parts of the state, is effectively ruled by the Bay Area’s admixture of venture capitalists, tech moguls, political and environmental activists.

    This is very bad news, not just for conservatives and Republicans, a species close to extinction in the Bay Area, but for many working and middle-class Democrats. The Bay Area ideological grip – fiercely green and politically correct to a fault – has separated California from its historic commitment to economic diversity and into a one-size-fits-all approach.

    The current shift of political power has been building for the last decade, and has put to an end a Southern California ascendency that ran from the days of Richard Nixon and Ronald Reagan to Pete Wilson, Gray Davis and Arnold Schwarzenegger. Today, there is not one Southland politician with any true state-wide influence. Indeed, the only politicians of any influence from Southern California have been a steady procession of union-influenced politicians: Fabian Nunez, Herb Wesson, Karen Bass and John Perez – all who have served as State Assembly speakers. And all of them will eventually fade into well-deserved obscurity.

    In contrast, notes long-time analyst Dan Walters, the Bay Area has established a “near-hegemony in California politics.” Home to both of the state’s U.S. Senators, San Francisco’s Dianne Feinstein and Marin’s Barbara Boxer, it also domiciles the state’s most important House leader, Nancy Pelosi, again of San Francisco. But the real domination is at the state-wide level where Bay Area residents control virtually every key political office, including Lt. Gov. Gavin Newsom, former mayor of San Francisco and Attorney Gen. Kamala Harris, San Francisco’s former district attorney.

    Astute observers of state politics, such as Joe Matthews, note that the “machine” nature of Bay Area politics, most epitomized by former San Francisco Congressman Phil Burton and his brother, John, has shaped a political class with sharper elbows. Urban San Francisco, in particular, he suggests, has a rough-and-tumble aspect missing from Southern California’s more dispersed and largely indifferent variety.

    This bizarrely lopsided configuration could prove a temporary and random phenomena, but the long-term economic and demographic trends favor a growing Bay Area ascendency. The current boom in Silicon Valley is minting billions in new riches for denizens of high-tech companies and their financiers at a time when office parks across most of the state, including Los Angeles and Orange Counties, are suffering significant vacancies. In contrast, those in Palo Alto and San Francisco are filling up even at ever-rising prices.

    This reflects in large part the secular decline of Southern California, which has never fully recovered from the loss of its landmark aerospace industry as well as the Los Angeles riots. The area’s dependence on manufacturing, where it remains the nation’s largest center, has suffered huge damage – down 18 percent just since 2007. Some of this can be terraced to the very regulatory policies backed by Bay Area politicos and pundits.

    Race is a factor here, too. For its part, the Bay Area’s population is increasingly dominated by well-educated Anglos and Asians – while historically underperforming African Americans and Latinos, largely immigrants, are concentrated in southern California. San Francisco, for example, is only 22 percent black or Hispanic; in Los Angeles, this percentage approaches 60 percent.

    There is also a vast chasm which has developed in terms of both job creation and unemployment rates. Over the past six years San Francisco and Silicon Valley, after losing many jobs in the 2000-2001 tech bust, have created 44,000 new jobs and now have recovered their losses from 2007. In contrast, Los Angeles and Orange counties, even after some recent growth, are stuck almost 300,000 below their 2007 levels. Not surprisingly unemployment in Santa Clara county sits around 7 percent while San Francisco county and San Mateo county unemployment numbers are under 6 percent. In contrast Los Angeles, the state’s largest county, stays at roughly 10.8 percent.

    Even worse off are places like the Central Valley and the Inland Empire, that have large numbers of under-educated people, and have long depended on such basic industries as construction, agriculture, manufacturing and logistics. Riverside-San Bernardino counties and Sacramento county together are still almost 200,000 jobs below their 2007 levels. Some of the rural counties in the Central Valley still suffer double-digit unemployment rates and staggering levels of poverty even as mid-twenties Bay Area nerds – often heads of companies with no history of profit – engage millions, and even billions, in IPO wealth.

    The confluence of Bay Area political and economic power is not coincidental. Increasingly the Silicon Valley oligarchs are rapidly replacing Hollywood as the primary source of cash for Democratic politicians.

    Energy provides the clearest example of the Bay Area’s ability to determine policy. Many major tech firms and venture capitalists have made millions backing renewable energy ventures made profitable by state mandates and subsidies. With the high energy-consuming industrial part of the Silicon Valley increasingly eclipsed by social media and software segments, high-priced electricity matters less and less to tech oligarchs who can easily place their servers in lower-cost states. Opposition to oil and gas development, which could resuscitate some of the state’s hard-hit quarters, is predictably strongest in the Bay Area.

    Similarly, strict controls over water use, although expensive for the Bay Area, hit agricultural and industrial users mostly located in the interior the hardest. These, measures do not much impact the ultra-rich buyers in places like Palo Alto, much less in lawn-less San Francisco.

    Is this reconfiguration a permanent one? Certainly the Bay Area’s swagger will decline once the current tech bubble, as is inevitable, implodes, likely within a year or two. The “tech glitz” around concentrations of start-up companies is a movie we have seen before. Back in the early years of the decade, similar firms fell victim to flawed business models and rapid industry consolidation. In San Francisco, for example, tech employment crashed from a high of 34,000 in 2000 to barely 18,000 four years later.

    But even if the Bay Area’s economic edge recedes, its political influence is unlikely to be challenged in the near future given the dearth of talented politicians. Indeed the only possible governor candidate from south of San Jose, Antonio Villaraigosa, is lightly regarded for his less-than-successful term as mayor of Los Angeles; his only hope in a primary lies in bloc voting by his fellow Latinos.

    Instead, most likely, our next governor will be either Gavin Newsom or state Attorney General Kamala Harris, progressives from San Francisco. Until Southern California can develop new leaders to replace today’s mediocrities, and starts to push an agenda appropriate to our poorer and more diverse population, we better get used to living in what has become the Great State of San Francisco.

    This story originally appeared at The Orange County Register.

    Joel Kotkin is executive editor of NewGeography.com and Distinguished Presidential Fellow in Urban Futures at Chapman University, and a member of the editorial board of the Orange County Register. He is author of The City: A Global History and The Next Hundred Million: America in 2050. His most recent study, The Rise of Postfamilialism, has been widely discussed and distributed internationally. He lives in Los Angeles, CA.

  • Jerry Brown and California’s “Attractive” Poverty

    Jerry Brown is supposed to be a different kind of politician: well informed, smart, slick, and skilled.  While he has had some missteps, he’s always bounced back.  His savvy smarts have allowed him to have a fantastically successful career while generally avoiding the egregious dishonesty that characterizes so many political practitioners.

    So, I was shocked to read that he said that California’s poverty is a result of the State’s booming economy.  Here’s part of the Sacramento Bee report:

    Gov. Jerry Brown, whose pronouncements of California’s economic recovery have been criticized by Republicans who point out the state’s high poverty rate, said in a radio interview Wednesday that poverty and the large number of people looking for work are "really the flip side of California’s incredible attractiveness and prosperity."

    The Democratic governor’s remarks aired the same day the U.S. Census Bureau reported that 23.8 percent of Californians live in poverty under an alternative calculation that includes the cost of living. Asked on National Public Radio’s "All Things Considered" about two negative indicators — the state’s nation-high poverty rate and the large number of Californians who are unemployed or marginally employed and looking for work — Brown said, "Well, that’s true, because California is a magnet.

    "People come here from all over in the world, close by from Mexico and Central America and farther out from Asia and the Middle East. So, California beckons, and people come. And then, of course, a lot of people who arrive are not that skilled, and they take lower paying jobs. And that reflects itself in the economic distribution."

    This is so incredibly wrong that I’m worried that Brown has lost his head and ability to reason.   If he really believes what he said, he’s living in the past and he’s so ill informed as to be delusional.  If he doesn’t believe what he said, I’m worried that his political skills have slipped.  To my knowledge, he’s never said anything so clearly at odds with the truth in his career.

    Here are the facts:

    • California’s poverty is not where the jobs are, which is what we’d expect if what Brown said was true.  Most of California’s jobs are being created in the Bay Area, a region of fabulous wealth. By contrast, California’s poverty is mostly inland. San Bernardino, for example, has the second highest poverty rate for American cities over 200,000 population, and no, it’s not because it’s a magnet. Most of California’s Great Central Valley is a jobs desert, but the region is characterized by persistent grinding poverty and unemployment.  No one in recent years is moving to Kings County to look for a job.
    • States with opportunity have low poverty rates.  North Dakota may have America’s most booming economy.  According to the Census Bureau, North Dakota’s Supplemental Poverty Measure is 9.2 percent.  That is, after adjustments for cost of living, 9.2 percent of North Dakotans live in poverty.  The rate in Texas – a state with a very diverse population, and higher percentages of Latinos and African-Americans – is 16.4 percent.  California leads the nation with 23.8 percent of Californians living in poverty.
    • According to the U.S. Census, domestic migration (migration between California and other states) has been negative for 20 consecutive years. That is, for 20 years more people have left California for other states than have come to California from other states. Wake up, Jerry, this is no longer your Dad’s state – or that of his successor, Ronald Reagan. This is a big change from when Brown was elected governor the first time.  At that time, California was a magnet.  It had a vibrant economy, one with opportunity.  California was a place where you could have a career, afford a home, raise a family.  It was where the American Dream was realized.
    • How about the magnetic attraction for immigrants from all over the world? According to the Census Bureau, international migration to California is way down.  The number of California international immigrants has been declining for a decade at least.  Indeed, in recent years there have been about half as many international immigrants to California than we saw in the 1990s.  Over the past decade, the number of foreign born increased more in Houston than the Bay Area and Los Angeles put together. Opportunity, not  “attractiveness”, drives people to move.
    • The result of negative domestic migration and falling international migration is the total migration to California has been negative in each of the past eight years.  More people have left California than have come to California for eight consecutive years. 
    • California’s migration trends combined with falling birth rates has resulted in the lowest sustained population growth rates that California has seen.

    The data are clear: Brown’s assertions have no basis in fact.  California – with the exception only recently of the Bay Area – is not a magnet. California is not "incredibly attractive and prosperous."  People are not coming from all over the world. California may beckon, but more are leaving, and those here are having fewer children. California’s seductive charms go only so far.

    I don’t know if I’d prefer that Brown was delusional or lying. On the one hand, policy made from a delusional analysis of the world is sure to be bad policy. Brown, for example, may convince himself that Twitter, Google, and Facebook are the future of the California economy, without recognizing how few people, particularly from the working class or historically disadvantaged minorities, they employ. On the other hand, Brown is very skilled in the political arts. If someone as skilled as he has to resort to such outright misdirection, we may be in worse shape than I think.

    Bill Watkins is a professor at California Lutheran University. and runs the Center for Economic Research and Forecasting, which can be found at clucerf.org.

    Jerry Brown photo by Bigstock.

  • American Cities May Have Hit ‘Peak Office’

    Despite some hype and a few regional exceptions, the construction of office towers and suburban office parks has not made a significant resurgence in the current recovery. After a century in which office space expanded nationally with every uptick in the economy, we may have reached something close to “peak office” in most markets.

    The amount of new office space in development is extraordinarily low by historical standards, outside of a handful of markets. Back in the mid-1980s, according to the commercial real-estate research firm CoStar, upward of 200 million square feet of office space was built annually. After dropping precipitously in the early 1990s, construction rose again to 200 million square feet a year in the early 2000s before dropping well under 150 million square feet in 2006, and lower after that. This year, in what is purported to be the middle of an economic recovery,  we will add barely 30 million square feet,according to Reis Inc.

    Even with this paltry construction, vacancy rates nationwide have barely moved, hovering around 17%. This is nowhere near low enough to justify much more construction in the vast majority of markets, where office rents remain well below 2007 levels.

    Indeed, the trend in real estate remains to convert office spaces to other uses,particularly residential. Large-scale office construction is happening in just a handful of markets; New York and Houston are the only ones with 10 million square feet being built, with smaller amounts in the works in Boston, Washington, Dallas-Ft. Worth and the San Francisco Bay Area.

    Most of the current anemic growth is happening outside downtown areas. Silicon Valley, which is essentially a sprawling suburb, currently has about as much construction as San Francisco. In Houston, another big metro area with robust job growth, there is a new 47-story high-rise being developed downtown, but much of the action is taking place on the periphery, notably in the Energy Corridor. ExxonMobil’s massive new campus, at 3 million square feet, ranks with One World Trade Center in Manhattan as the nation’s largest new office projects.

    Through the third quarter this year, the amount of new office space under construction in suburban areas was roughly double the amount being built in central business districts, by CoStar’s count. Furthermore, only 7.1 million square feet of office space was absorbed downtown in the first nine months of 2013, compared to 51.5 million in suburban areas, CoStar says. But overall there is still 100 million square feet less space being used today than in 2007, and at current absorption rates, it could take six or seven years just to get back to where we were before the recession.

    The Weak Economy

    The key question here is not the geography of office space but why so little is being built. As long as economic growth is modest, don’t expect much change in the skyline in most downtowns, or suburbs. Job growth has been mediocre at best, and much of that has been in the low-wage and part-time category. McJobs and part-time workers do not generally fill office towers.

    The dirty little secret of this recovery is that labor participation rates are at the lowest level since 1978. Underemployment is rife, at around 18% to 20%, and much of that likely includes large numbers of people who used to work in offices.

    This is true even in New York City, where the rate of “office-using employment” has been dropping since the late 1960s and even in the recovery, has yet to rebound to the levels of 2000.

    Changing Use of Space

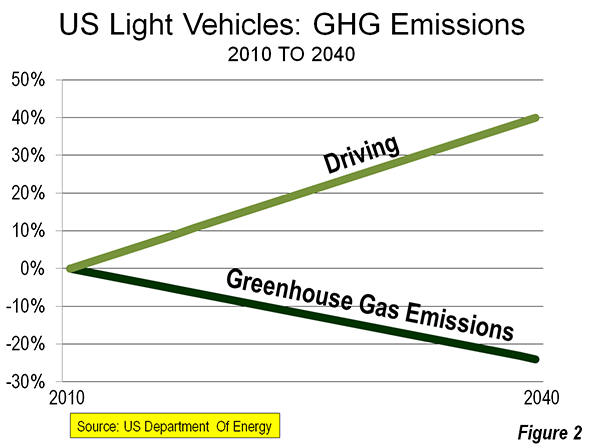
    Just as we have gotten used to more fuel-efficient cars, companies now utilize space more efficiently than before, largely through information technology. This is a trend many companies plan to accelerate. In the past, for example, your average mid-level executive had his own secretary; now it’s more common to have perhaps one aide for several managers. Historically office developers assumed that each worker would require 250 square feet of space; by the end of the decade this could drop to 100 to 125 square feet.

    Even the most notoriously bureaucratic of professions, law, is scaling back. A recent Cushman and Wakefield survey  found that most firms — many already downsizing — were working to reduce their office footprint per attorney from 800 to 500 square feet. Almost two out of five expect to use “hoteling,” or the sharing of offices among attorneys, something very rare a decade ago.

    At the same time, some of the sectors that are the best bets for expansion, such as information technology and media, are increasingly seeking out unconventional office space. Mayor Mike Bloomberg’s drive to upzone large parts of Midtown Manhattan to create ever-taller towers works operates on the assumption that new users will be much like the old ones. But some experts, such as New York-based architect Robert Stern, suggest that ultra high-rise development does not appeal to either creative businesses and tourists, while preserving older districts, with already developed buildings, does.

    Self-Employment and Home-Based Businesses

    Perhaps the biggest long-term threat lies in the shift from corporate to self-employment. From 2001 to 2012, the number of self-employed workers grew by 14%, according to a recent study by Economic Modeling Specialists. This is occurring not only in the metro areas that suffered the worst during the recession, such as Phoenix, Los Angeles and Riverside-San Bernardino, but also in the healthiest economies such as Houston and Seattle.

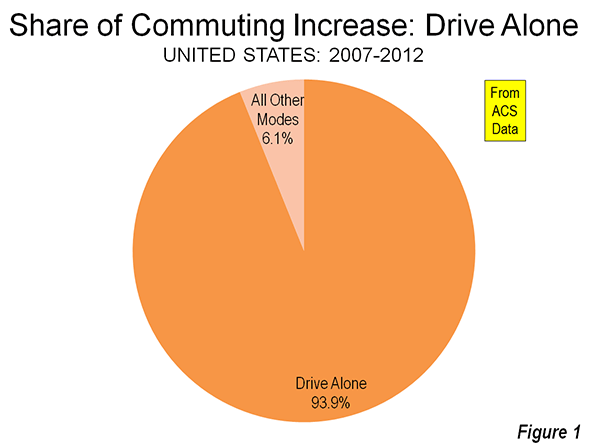
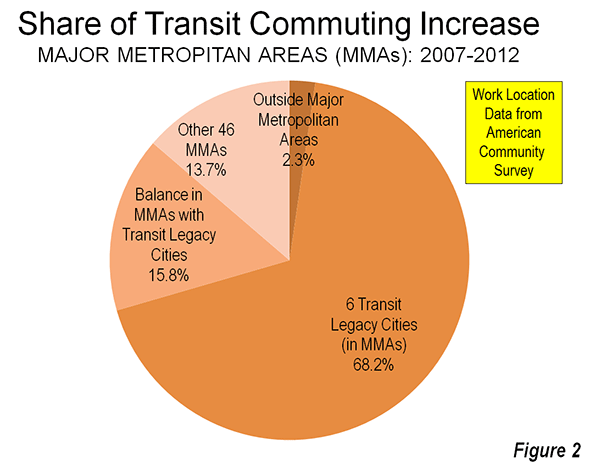
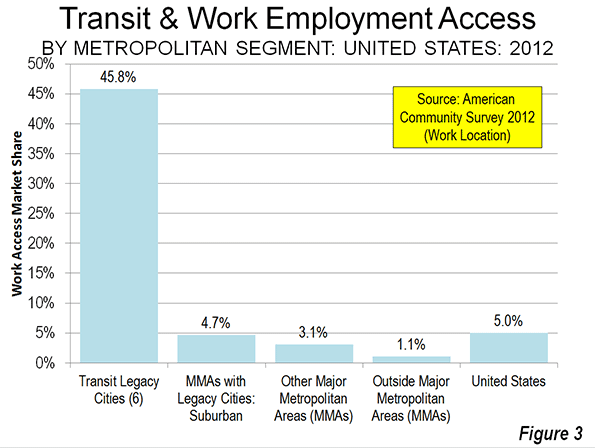
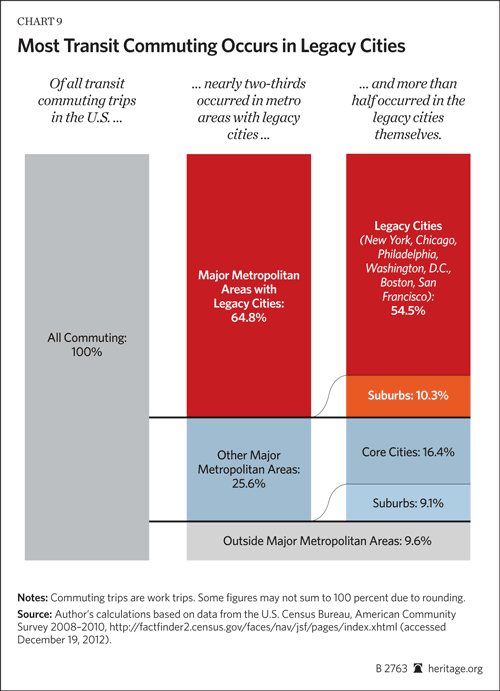
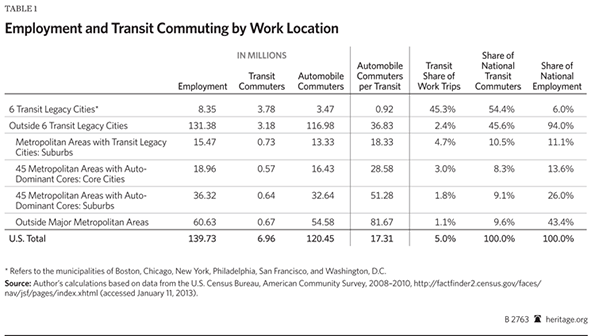
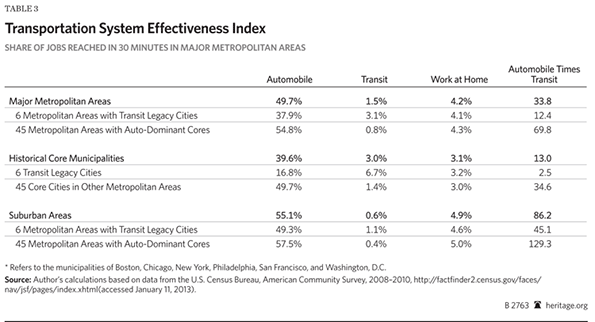
    Some of these now self-employed workers may end up in small offices, but many don’t leave home at all. Working at home is growing far faster than commuting by either car or transit, and in most U.S. metro areas, far exceeds those who get to work by public conveyance, most often to downtown areas. Over the past decade the number of U.S. telecommuters expanded 41% to some 1.7 million, almost double the much-ballyhooed increase of 900,000 transit riders.

    Are We Blowing Another Bubble?

    In some specialized, fast-growing markets, new office construction may well be justified. Raleigh is seeing some new construction in its small downtown, as are hot job markets such as Austin and oil-rich Midland, Texas, where a proposed 53-story office tower would be the tallest building between Dallas and Los Angeles.

    But in New York, plans for massive new office tower construction seem to contradict an unemployment rate considerably above the national average. Financial services, the primary driver of the Manhattan market, is showing signs of economic distress, with firms moving middle-management jobs to more affordable places such as Richmond, Va.; Pittsburgh; St. Louis; and Jacksonville, Fla.

    Perhaps even more worrisome, less than half of the space in new buildings in Manhattan is preleased, compared to over 70% in both Houston and Boston, and a remarkable 92% in San Jose/Silicon Valley. This reflects an apparent dearth of large employers in New York who could conceivably afford and fill ultra-expensive office space in the coming years, a recent article in Crain’s New York points out. Tech companies might be expected to help fill the gap, but we have to remember that after the last boomlet Silicon Alley suffered asteep contraction; it has since recovered, but could be hit hard again if the current bubble pops.

    San Francisco, the other current darling of office developers, is even more dependent on the current dot-com boom. The IPOs of Frisco-based firms such as Twitter appear to suggest the prospect of a whole new generation of office occupants. By one account, there is as much as 12 million square feet of new office space in the pipeline in the city, enough to satisfy historical demand for the next 16 years.

    Yet past experience shows many of these companies will likely dissolve or merge in the next few years. They may be fewer in numbers and longer established than last time around, as some local boosters eagerly suggest, but most are still unprofitable and many may never be truly viable. Following the 2000 dot-com crash, San Francisco office occupancy dropped roughly 10 million square feet, while tech employment crashed from a high of 34,000 in 2000 to barely 18,000 four years later.  As one real-estate executive put it at the time, “The office-space market here ”reminds me of the Road Runner cartoon where the Coyote runs into the wall.”

    Observers also point out that more traditional businesses, such as banks, continue to ship jobs elsewhere, in large part due to extraordinarily high costs. The fact that pre-leasing for SF’s new office buildings is barely 33% should add to the caution.

    None of this suggests there are not some good opportunities for new construction, but the office building’s role as a key indicator of the strength of the U.S. economy has faded. In great cities, rather than a ballyhooed era of new office skyscrapers we will see more conversions and the construction of residential high-rises, as well as medical buildings. The secular trend is for the dispersion of business service employment to smaller markets, and into people’s homes. The glory days of the American office tower are over, and not likely to return soon, given technological trends and a persistently tepid economy.

    This story originally appeared at Forbes.

    Joel Kotkin is executive editor of NewGeography.com and Distinguished Presidential Fellow in Urban Futures at Chapman University, and a member of the editorial board of the Orange County Register. He is author of The City: A Global History and The Next Hundred Million: America in 2050. His most recent study, The Rise of Postfamilialism, has been widely discussed and distributed internationally. He lives in Los Angeles, CA.

    Photo by Mark Lyon — Full Floor For Rent.

  • Driving Alone Dominates 2007-2012 Commuting Trend

    New data from the American Community Survey makes it possible to review the trend in mode of access to employment in the United States over the past five years. This year, 2012, represents the fifth annual installment of complete American Community Survey data. This is also a significant period, because the 2007 was a year before the Lehman Brothers collapse that triggered the Great Financial crisis, while gasoline prices increased about a third between 2007 and 2012.

    National Trends

    The work trip access data is shown in Tables 1 and 2. Driving alone continued to dominate commuting, as it has since data was first reported in the 1960 census. In 2007, 76.1 percent of employment access was by driving alone, a figure that rose to 76.3 percent in 2012. Between 2007 and 2012, driving alone accounted for 94 percent of the employment access increase, capturing 1.55 million out of the additional 1.60 million daily one-way trips (Figure 1). The other 50,000 new transit commutes were the final result of increases in working at home, transit and bicycles, minus losses in car pooling and other modes.

    Carpools continued to their long decline, losing share in 43 of the 52 major metropolitan areas. Approximately 810,000 fewer people travel to work by carpools in 2012, which reduced its share from 10.7 percent to 9.7 percent.

    Transit did better, rising from 4.9 percent of work access in 2007 to 5.0 percent in 2012. There was an overall increase of approximately 250,000 transit riders. This increase, however, may be less than might have anticipated in view of the much higher gasoline prices and the imperative for commuters to save money in a more difficult economy.

    Bicycling also did well, rising from a 0.5 percent share in 2007 to a 0.6 percent share in 2012. Approximately 200,000 more people commuted by bicycle by 2012.

    Walking retained its 2.8 percent share, with only a modest 15,000 increase over the period. The largest increase in employment access outside single occupant driving was working at home, which rose from 4.1 percent to 4.4 percent. This translated into an increase of approximately 470,000.

    Metropolitan Area Highlights

    Among the 52 metropolitan areas with more than 1 million population (major metropolitan areas), 47 had drive alone market shares of 70 percent or more. Birmingham was the highest, at 85.6 percent. Surprisingly, this grouping included metropolitan areas with reputations for strong transit ridership, such as Chicago, Philadelphia, and Portland. Four metropolitan areas had drive alone shares of between 60 percent and 70 percent: Seattle, Washington, Boston, and San Francisco, which had the second lowest in the nation at 60.8 percent. As would be expected, New York had by far the lowest drive alone market share at 50.0 percent.

    Consistent with its low drive alone market share, New York led by a large margin the other metropolitan areas in its transit work trip market share. Transit carried 31.1 percent of New York commuters, up nearly a full percentage point from the 30.2 percent in 2007. New York alone accounted for nearly one-half of the growth in transit commuting over the period.

    San Francisco continued to hold onto second place, with a 15.1 percent transit market share, up a full percentage point from 2007. Washington rose to 14.0 percent, up from 13.2 percent in 2007. Boston (11.9 percent) and Chicago (11.0 percent) were the only other major metropolitan areas to achieve a transit work trip market share of more than 10 percent, and were little changed from 2007.

    Working at home continued to increase at a larger percentage rate than any other mode of work access. Four metropolitan areas were tied for the top position in 2012, at 6.4 percent. These included Raleigh, Austin, San Diego, and Portland, all metropolitan areas with a strong high-tech orientation. In San Diego and Portland, where large light rail systems have been developed, working at home is now more popular as a mode of access to work than transit.

    According to 2012 US Census Bureau estimates, the major metropolitan areas comprised 55.2 percent of the national population. These metropolitan areas represented a slightly larger share of total employment, at 57.3 percent. The combined major metropolitan areas also had similar shares to their national population share in each of the employment access modes, ranging from a low of 55.3 percent of communters driving alone to 59.9 percent of walkers. The one exception was transit, where the major metropolitan areas constituted nearly all of commuters, at 90.7 percent, well above their 55.2 percent share of US population (Table 1).

    Table 1
    Distribution of Employment Access (Commuting) by Employment Location: 2012
    SHARE OF WORK ACCESS BY MODE (2012)
      All Employment Drive Alone Car Pool Transit Bike Walk Other Work at Home
    MAJOR METROPOLITAN AREAS 57.3% 55.3% 55.4% 90.7% 59.9% 56.0% 55.6% 59.3%
    Metropolitan Areas with Legacy Cities 17.1% 13.8% 14.4% 65.4% 21.5% 27.8% 18.3% 17.1%
      6 Legacy Cities (see below) 6.0% 2.7% 4.1% 55.1% 12.7% 16.3% 7.8% 4.6%
      Suburban 11.1% 11.1% 10.3% 10.3% 8.8% 11.5% 10.5% 12.6%
      New York Metropolitan Area 6.4% 4.2% 4.5% 39.6% 5.8% 13.6% 8.5% 5.9%
        Legacy City: New York 3.1% 1.0% 1.5% 35.4% 4.2% 9.5% 4.2% 2.5%
        Suburban 3.3% 3.2% 3.0% 4.2% 1.7% 4.1% 4.3% 3.5%
      5 Other Metropolitan Areas with Legacy Cities 10.7% 9.6% 9.9% 25.8% 15.7% 14.2% 9.8% 11.2%
        5 Legacy Cities (CHI, PHI, SF, BOS, WDC) 2.9% 1.7% 2.6% 19.7% 8.5% 6.8% 3.6% 2.1%
        Suburban 7.8% 7.9% 7.3% 6.1% 7.1% 7.5% 6.2% 9.1%
    46 Other Major Metropolitan Areas 40.2% 41.5% 41.0% 25.3% 38.4% 28.2% 37.3% 42.2%
    OUTSIDE MAJOR METROPOLITAN AREAS 42.7% 44.7% 44.6% 9.3% 40.1% 44.0% 44.4% 40.7%
    United States 100% 100% 100% 100% 100% 100% 100% 100%
    Calculated from American Community Survey: 2012 (one year)

    Follow this link to a table containing data for the nation’s major metropolitan areas.

    Commuting Becomes More Concentrated in Legacy Cities

    This concentration of transit commuting was most evident to the six large "transit legacy cities," (the core cities of New York, Chicago, Philadelphia, San Francisco, Boston, and Washington), which still exhibit sufficient remnants of their pre-automobile urban cores that support extraordinarily high transit market shares. The transit legacy cities accounted for 55 percent of all transit commuting destinations in the United States, yet have only six percent of the nation’s jobs. Between 2007 and 2012, the concentration increased, with transit legacy cities accounting 68 percent of the additional transit commutes were between 2007 and 2012. Outside the legacy cities, there was relatively little difference in the share of transit commutes within metropolitan areas with legacy cities and in the other major metropolitan areas (Figure 2)

    The key to the intensive use of transit in the legacy cities is the small pockets of development that are particularly amenable to high transit market shares – the six largest downtown areas (central business districts) in the United States. Most of the commuting to transit legacy cities is to these downtown areas, Yet, the geographical areas of these downtowns is very small. Combined, the six downtown areas are only one-half larger than the land area of Chicago’s O’Hare International Airport. This yields employment per square mile densities of from 40 to 150 times densities of employee residences throughout their respective urban areas.  

    Not surprisingly, transit has very strong market shares to work locations in the transit legacy cities, at 45.8 percent. At the same time, transit commuting to locations outside the transit legacy cities is generally well below the national average. The exception is New York, where transit commuting to suburban locations is 6.4 percent, above the overall national average of 5.0 percent. In the five other metropolitan areas with transit legacy cities, transit commuting to suburban locations is 3.9 percent. This drops to 3.1 percent, overall, in the 46 other major metropolitan areas and 1.1 percent in the rest of the nation (Table 2 and Figure).

    Table 2
    Employment Access (Commuting) by Employment Location: 2012
      Drive Alone Car Pool Transit Bike Walk Other Work at Home
    MAJOR METROPOLITAN AREAS 73.6% 9.4% 7.9% 0.6% 2.8% 1.2% 4.5%
    Metropolitan Areas with Legacy Cities 61.7% 8.2% 19.2% 0.8% 4.6% 1.3% 4.4%
      6 Legacy Cities (see below) 33.9% 6.5% 45.8% 1.3% 7.6% 1.6% 3.3%
      Suburban 76.8% 9.1% 4.7% 0.5% 2.9% 1.1% 5.0%
      New York Metropolitan Area 50.0% 6.8% 31.1% 0.6% 6.0% 1.6% 4.1%
        Legacy City: New York 23.7% 4.6% 57.1% 0.8% 8.6% 1.6% 3.5%
        Suburban 74.8% 8.9% 6.4% 0.3% 3.5% 1.6% 4.6%
      5 Other Metropolitan Areas with Legacy Cities 68.6% 9.0% 12.1% 0.9% 3.7% 1.1% 4.6%
        5 Legacy Cities (CHI, PHI, SF, BOS, WDC) 44.8% 8.6% 33.7% 1.8% 6.5% 1.5% 3.1%
        Suburban 77.6% 9.1% 3.9% 0.6% 2.7% 1.0% 5.1%
    46 Other Major Metropolitan Areas 78.7% 9.9% 3.1% 0.6% 2.0% 1.1% 4.6%
    OUTSIDE MAJOR METROPOLITAN AREAS 79.9% 10.1% 1.1% 0.6% 2.9% 1.3% 4.2%
    United States 76.3% 9.7% 5.0% 0.6% 2.8% 1.2% 4.4%
    Transit legacy cities include the municipalities of New York, Chicago, Philadelphia, San Francisco, Boston & Washington

    Staying the Same

    The big news in the last five years of commuting data is that virtually nothing has changed. This is remarkable, given the greatest economic reversal in 75 years and continuing gasoline price increases that might have been expected to discourage driving alone. Yet, driving alone continues to increase, while the most cost effective mode of car pooling continued to suffer huge losses, while working at home continued to increase strongly.

    Wendell Cox is a Visiting Professor, Conservatoire National des Arts et Metiers, Paris and the author of “War on the Dream: How Anti-Sprawl Policy Threatens the Quality of Life.

    Photograph: DART light rail train in downtown Dallas (by author)

  • Plan Bay Area: Telling People What to Do

    The San Francisco area’s recently adopted Plan Bay Area may set a new standard for urban planning excess. Plan Bay Area, which covers nearly all of the San Francisco, San Jose, Santa Rosa, Vallejo and Napa metropolitan areas, was recently adopted by the Metropolitan Transportation Commission (MTC) and the Association of Bay Area Governments (ABAG). This article summarizes the difficulties with Plan Bay Area, which are described more fully in my policy report prepared for the Pacific Research Institute (Evaluation of Plan Bay Area).

    Plan Bay Area would produce only modest greenhouse gas emissions reductions, while imposing substantial economic costs and intruding in an unprecedented manner into the lives of residents. The Plan would require more than three quarters of new residences and one third of net additional employment to be located in confined "priority development areas." These measures have been referred to as “pack and stack” by critics. The net effect would be to virtually ban development on the urban fringe, where the organic expansion of cities has occurred since the beginning of time.

    Irrational Planning

    Violating perhaps the most fundamental requirement of a rational plan, Plan Bay Area begins with a situation that no longer exists. Further, it is based on exaggeration, systematic disregard of official federal government projections and overly optimistic planning assumptions.

    Exaggerated Population Projection: The Plan assumes that the Bay Area will grow 55 percent more rapidly between 2010 and 2040 than official California state Department of Finance population projections indicate. These state-produced estimates have tended themselves to be on the high side (Figure 1). The planners scurried about to resolve these differences, but there is no indication that the state will be revising its projections. Plan Bay Area’s population projection would require growth in the Bay Area to increase by more than one-half from the 2000-2010 annual rate. The exaggeration of population growth has its uses: it leads to a higher greenhouse gas emissions projection for 2040, providing a rationale for stronger policy interventions.

    Ignoring Current Greenhouse Gas Emissions Projections: The Plan also ignores the new, more favorable DOE fuel economy projections (Figure 2). These projections were issued in December, well before the publication of the draft plan in April and the adoption of the final plan in July. Indeed, if the new DOE projections had been published the day before, Plan Bay Area should have been placed on hold and revised. In short, Plan Bay Area was out of date when adopted.

    Overly Optimistic Planning Assumptions: The Plan assumes that travel by light vehicle (automobiles, sport utility vehicles and pickups) would be reduced by substantial increases in transit ridership. Plan Bay Area presumes that expanding transit service 27 percent over the next 30 years will lead to a near doubling of transit ridership. This is stupefying, since over the last 30 years, transit ridership remained virtually the same, while service was expanded nearly twice as much as would be planned from 2010 to 2040.

    The plan also assumes that residents forced into the priority development areas will use transit and walking much more, materially reducing their use of light vehicles. This research behind this assumption is skewed toward transit oriented developments located on rail lines with good access to downtown. But nearly nine out of 10 employees in the Bay Area work outside the downtowns of San Francisco and Oakland, and that number is increasing (according to Plan Bay Area).

    Given recent history, it seems wishful thinking to believe that small transit service expansions and downtown oriented transit development can do much to attract drivers from cars. The modest gains greenhouse gas emissions reductions projected in Plan Bay Area are likely exaggerations.

    Plan Bay Area’s “pack and stack” densification is likely to produce even less than the modest substitution of transit and walking for driving (see The Transit-Density Disconnect). Traffic congestion, in this already highly congested area, is likely to be worsened, which could nullify part or all of the greenhouse gas emission reductions expected from reduced vehicle use.

    Correcting Plan Bay Area Forecasts

    Plan Bay Area would only modestly reduce light vehicle travel and greenhouse gas emissions. This is illustrated in Figure 3, which shows that the “pack and stack” strategies that would force most new residents and jobs into priority development areas, Plan Bay Area would reduce greenhouse gas emissions by 2 percent (“Plan Bay Area” line compared to the “Trend” or “doing nothing” line).

    By contrast, correcting the Plan Bay Area 2040 population estimates to reflect the state population projections would reduce greenhouse gas emissions more than eight times as much (17 percent), without the “pack and stack” strategies. A further correction of the Plan Bay Area 2040 estimates to reflect the latest DOE fuel economy projections, would reduce greenhouse gas emissions 22 percent, 11 times as much as the “pack and stack” strategies.

    Heavy Costs for Households and Businesses

    The Plan’s “pack and stack” strategies seem likely to exacerbate the Bay Area’s already high cost of living. Currently, the San Francisco and San Jose metropolitan areas have the worst housing affordability among the nation’s 52 metropolitan areas with more than 1 million residents. San Jose’s median house price relative to its median household income was 7.9 last year, according to the Demographia International Housing Affordability Survey. San Francisco’s median multiple was 7.8. This severely unaffordable housing results from recent decades of urban containment or smart growth policies, which have severely restricted the land on which development can occur. This drives up prices (other things being equal), consistent with economic principle. This has been made worse by house and apartment impact fees imposed on developers that are far above the national average.

    By comparison, in major metropolitan areas that have not implemented strong urban containment policies, the median multiple has typically been 3.0 or less since World War II, including the Bay Area before its adoption (Figure 4). The “pack and stack” strategies would largely limit new development to small parts of the Bay Area, an even more draconian prohibition than the long standing restrictions on urban fringe development. This further rationing of land could be expected to drive land prices even higher, making it even more difficult for households and businesses to live within their means.

    The problem is already acute. The new US Census Bureau housing cost adjusted data shows California to have the highest poverty rate among the states and the District of Columbia (metropolitan area data is not available). An early 2000s Public Policy Institute of California report showed Bay Area poverty to be nearly double the official rate, adjusted for the cost of living. Ultra pricey San Francisco had among the ten highest poverty rates – over twenty percent – of any urban county in the country.

    Unaffordable housing has also fueled an exodus to the San Joaquin Valley (Central Valley). Now more than 15 percent of the workers in the Stockton metropolitan area commute to the Bay Area, which led the Federal Office of Management and Budget adding Stockton to the San Jose-San Francisco combined metropolitan area (combined statistical area). In addition, the greater traffic congestion is likely to lengthen work trip travel times. This is likely to further increase emission while also burdening job creation and economic growth (see Traffic Congestion, Time and Money).

    Ignoring the Economy and Poverty

    Plan Bay Area effectively ignores these costs (despite rhetoric to the contrary), by failing to subject its strategies to a cost per ton metric. According to the United Nation’s Intergovernment Panel on Climate Change (IPCC), sufficient greenhouse gas emissions reductions can be achieved at a cost between a range of $20 to $50 per ton. The previous regional plan (through 2035) included such estimates. Only highway strategies achieved the IPCC range. Transit and land use strategies cost from four to more than 100 times the top of the IPCC range. Even those estimates did not include the prohibitively higher housing costs that result from urban containment policies. The cost metric is crucial, because spending more than necessary to reduce greenhouse gas emissions limits job creation and economic growth, which leads to reduced household affluence and greater poverty. This is the very opposite of the economic objectives of public policy. Virtually all political jurisdictions around the world seek greater prosperity for their residents and less poverty. A legitimate regional plan requires subjecting its strategies to economic metrics.

    Opposition

    There is opposition to Plan Bay Area. A citizen movement worked for rejection and has now filed suit claiming that the Plan violates the California Environmental Quality Act. The suit also alleges that MTC and ABAG used a questionable interpretation of state law and regulation to justify the irrational Plan outcomes.

    Recorded Votes

    Opponents were also successful in obtaining a rare recorded vote at ABAG. The governing board (General Assembly) is composed of selected elected officials from cities and counties who are not elected to their ABAG positions. ABAG adopts virtually all of its actions by consensus, rather by recorded votes, as occurs in many of the nation’s regional planning boards.

    Consensus decision making seem especially odd in California, where inability to obtain sufficient votes in the legislature for the state budget required a constitutional amendment. Neither do city councils and county commissions operate on a consensus basis on controversial issues.

    There is no shortage of controversial issues, at ABAG or other regional planning agencies. A good first reform would be for recorded votes to be the rule, rather than the exception. Consensus decision making may be appropriate for clubs, but it is not for representative bodies in a democracy.

    Impeding the Quality of Life

    Plan Bay Area was outdated when approved and reflects a world that no longer exists. Drafters have insisted on extravagantly expensive and intrusive policies that produce only minimal greenhouse gas reductions, and at great cost, using, among other things, unreasonably bloated population forecasts to bolster their approach. Unless changed, the Plan will likely be more successful in driving up housing prices, limiting options for households, and further congesting traffic than meeting its stated goal of reducing   greenhouse gas emissions.

    Wendell Cox is a Visiting Professor, Conservatoire National des Arts et Metiers, Paris and the author of “War on the Dream: How Anti-Sprawl Policy Threatens the Quality of Life.

    Photo: San Francisco (by author)

  • Transit Legacy Cities

    Transit’s greatest potential to attract drivers from cars is the work trip. But an analysis of US transit work trip destinations indicates that this applies in large part to   just a few destinations around the nation. This is much more obvious in looking at destinations than the more typical method of analysis, which looks at the residential locations of commuters. This column is adapted from my new Heritage Foundation Backgrounder "Transit Policy in an Era of the Shrinking Federal Dollar."

    Transit Legacy Cities

    Transit commuting is heavily concentrated to destinations in just the six core cities (historical core municipalities) of New York, Chicago, Philadelphia, San Francisco, Boston and Washington (Backgrounder Chart 9). I call them the "transit legacy cities," because their high transit market shares relate to their development before the automobile became dominant. Because there is such a lack of clarity in the use of terms that apply to cities, it is important to emphasize that the transit legacy cities are municipalities, not the surrounding metropolitan areas or urban areas, where the majority of residents live (Note 1). 


    The transit legacy cities account for nearly 55 percent of the nation’s transit commuters, by work trip destinations, according to the American Community Survey (2008-2010). By contrast, the transit legacy cities have an overall national employment market share barely one-tenth their national transit share (6 percent). Moreover, combined, the transit legacy cities cover a land area little larger than the core city (municipality) of Jacksonville, Florida.

    At the same time, the "other side of the coin" is that commuting to other destinations is dominated by the automobile, from the suburbs in metropolitan areas with transit legacy cities, and even more so in the other 45 major metropolitan areas (with more than 1,000,000 population) and the balance of the nation.

    Legacy Cities: Transit’s Strength

    The extent of the concentration in the six transit legacy cities is illustrated in Backgrounder Table 1. In some ways, transit is, first and foremost,  really a New York story. More than one-third of all transit work-trip commuting is to destinations in the core city of New York. The dominance is even greater for high-capacity subways/elevated services, a mode in which where New York represents two-thirds of national commuting.

    The Key: Large, Concentrated, Well Served Downtowns: The concentration of transit commuting in the six transit legacy cities reflects the factor that is probably more responsible than any other for attracting people from cars to transit. This is a highly concentrated downtown area (central business district, or "CBD") from which a dense network of rapid transit services radiates.

    The six transit legacy cities are also home to the six largest CBDs in the nation, where transit’s share of commuting is far higher than compared to the rest of the nation. Approximately three quarters of commuters to the sprawling Manhattan CBD in New York (south of 59th Street) commuted by transit in 2000. Less well known is that New York also contains the CBD with the second largest transit work trip destination, downtown Brooklyn (58 percent), which is followed by downtown Chicago (55 percent).

    In addition, between nearly 40 percent and more than 50 percent of commuters used transit to the CBDs of Boston, San Francisco, Philadelphia and Washington. While covering a land area less than one-half the size of Orlando’s Walt Disney World, these downtowns accounted for 35 percent of national transit commuting.

    Outside the Transit Legacy Cities: Automobile and Work at Home Country

    So what about the 94 percent of US commuters who work outside the transit legacy cities? The answer is that the automobile dominates, and transit has been overtaken by working at home. In the suburban areas of metropolitan areas with transit legacy cities, the car carries 18 times as many people to work locations as transit. In the core municipalities of the 45 major metropolitan areas without legacy cities, cars carry 29 times as many commuters as transit, and 51 times as many in the suburbs. Outside the nation’s major metropolitan areas, cars carry 82 times as many commuters as transit (Backgrounder Table 1)

    Further, outside the transit legacy cities, working at home (including telecommuting) provides access to twenty percent more jobs than transit (Backgrounder Table 3).

    An American Love Affair with the Automobile?

    The enduring myth of the American love affair with automobile is countered by the huge transit market shares to city downtowns . For example, commuters to Manhattan are five times as likely to use transit as cars. On the other hand, commuters to the edge city of Parsippany, on the I-287 corridor in suburban New Jersey are 50 times as likely to use their cars as transit. Yet both employment centers serve the same labor market. The issue is not preferences, it is rather rational choice. It would be irrational for most people to commute to Manhattan by car, principally because of the traffic congestion and cost, particularly for parking. It would similarly be irrational for most people to commute to Parsippany by transit, because it either could not be done at all, or it would take too long.

    Transit’s work trip destination market share is an effective measure of its relevance to the market.

    And lest anyone should counter that the answer is more money, consider this.

    A Cost Not A Revenue Problem

    Portland (with a core city that is not a legacy city) has long been held out as a model for improving transit. Yet, after billions of dollars in federal and local tax subsidies, more than 50 times as many people travel to work to suburban locations by car as by transit. More than five times as many work at home as use transit, and working at home costs taxpayers virtually nothing. Yet, despite all these billions, Portland’s transit system is in crisis. Tri-Met’s  Executive Director Neil McFarlane has warned of 70 percent service cuts over 12 years without substantial changes to union contracts.

    Transit’s fundamental problem is not insufficient revenue but insufficient cost control. Since 1983, national transit expenditures have risen at an inflation-adjusted rate nine times that of its increase in commuters (Note 2). Even if costs were under control, it would be financially impossible to provide automobile-competitive transit throughout the modern urban area, as Professor Jean-Claude Ziv and I showed in our WCTRS paper (Megacities and Affluence: Transport and Land Use Considerations).

    Celebrating Transit

    Yet, beyond its inability to convert generous taxpayer subsidies into corresponding ridership increases, transit deserves credit for the large number of people it moves to jobs in the legacy cities. This success should be celebrated although it remains an impossible, prohibitively expensive, dream elsewhere.

    Wendell Cox is a Visiting Professor, Conservatoire National des Arts et Metiers, Paris and the author of “War on the Dream: How Anti-Sprawl Policy Threatens the Quality of Life.”

    —-

    Note 1: Each of the transit legacy cities has a lower population than the surrounding suburbs. This ranges from nearly 45 percent of the population in the suburbs of the New York metropolitan area to little more than 10 percent in Washington.

    Note 2: Within the first 30 days of my time on the Los Angeles County Transportation Commission, I became convinced that transit’s principal problem was cost control (see Toward More Prosperous Cities). This was then and today remains clear from the above-inflationary escalation of unit costs. Regrettably that trend continues today and has seriously impeded transit’s ability to increase ridership.

    —–

    Photo: Downtown Philadelphia (by author)