Tag: San Francisco

  • The New Places Where America’s Tech Future Is Taking Shape

    Technology is reshaping our economic geography, but there’s disagreement as to how. Much of the media and pundits like Richard Florida assert that the tech revolution is bound to be centralized in the dense, often “hip” places where  “smart” people cluster. Some, like Slate’s David Talbot, even fear the new tech wave may erode whatever soul is left to increasingly family free, neo-gilded age San Francisco.

    Such claims have been bolstered by the tech boom of the past few years — especially the explosion of social media firms in places like Manhattan and San Francisco. Yet longer-term trends in tech employment suggest such favored media memes will ultimately prove well off the mark. Indeed, according to an analysis by the Praxis Strategy Group, the fastest growth over the past decade in STEM (science, technology, engineering and mathematics-related) employment has taken place not in the most fashionable cities but smaller, less dense metropolitan areas.

    From 2001 to 2012, STEM employment actually was essentially flat in the San Francisco and Boston regions and  declined 12.6% in San Jose. The country’s three largest mega regions — Chicago, New York and Los Angeles — all lost tech jobs over the past decade. In contrast, double-digit rate expansions of tech employment have occurred in lower-density metro areas such as Austin, Texas; Raleigh, N.C.; Columbus, Ohio; Houston and Salt Lake City. Indeed, among the larger established tech regions, the only real winners have been Seattle, with its diversified and heavily suburbanized economy, and greater Washington, D.C., the parasitical beneficiary of an ever-expanding federal power, where the number of STEM jobs grew 21% from 2001 to 2012, better than any other of the 51 largest U.S. metropolitan statistical areas over that period.

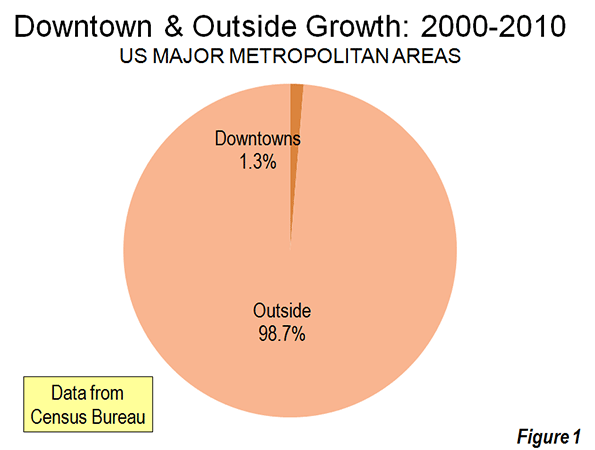
    The question is whether the last two to three years, during which places like San Francisco, New York and Boston have enjoyed stronger STEM growth than their peripheries, represents a paradigm shift or is just a cyclical phenomenon. As with tech in general, the long-term trends are not so city-centric; over the past decade,  the core counties nationwide overall have lost about 1.1% of their tech jobs while more peripheral areas have experienced a gain of 3.5%.

    Today’s urban tech boom looks a lot like a rerun of the dot-com boom of the late 1990s. In that period media-savvy dot-com startups proliferated in such places as South of Market in San Francisco and the Silicon Alley in lower Manhattan. At their height, these firms and their founders were as likely to be covered in the fashion and lifestyle sections as on the business pages.

    Yet by the early 2000s, many of these dot-com darlings had merged, been acquired or simply gone out of business. Anchored largely on hype, they fell victim to flawed business models, and rapid industry consolidation.  In San Francisco, for example, tech employment crashed from a high of 34,000 in 2000 to barely 18,000 four years later. Silicon Alley suffered a similar downward trajectory, losing 15,000 of its 50,000 information jobs in the first five years of the decade.

    The peaking social media boom, marked by the weak performance of Facebook’s IPO last year, suggest another bust at the end of the “hype cycle.” Urban darlings such as  San Francisco’s Zynga and Chicago’s Groupon have floundered in spectacular fashion. More are likely to join them.

    These firms may have generated buzz, but they have done not so well at the mundane task of making money. One problem may be that  the most avid users of social media are largely young people from the “screwed” generation who lack much in the way of spending power — a clear turnoff to advertisers. Now , with venture capital flows declining overall,  cooler heads in the Valley are shifting bets to more business-oriented engineering and research-intensive fields more grounded in marketplace realities.

    And what about the future of the Valley — still home to virtually all the Bay Area’s top tech firms? Its glory days as a job generator and economic exemplar seem to have passed. Between 1970 and 1990 the number of people employed in tech in the Valley more than doubled to 268,000, and then burgeoned to over 540,000 in the 1990s. At the peak of the last tech boom in 2001, the unemployment rate in Santa Clara County was a tiny 3%; the Silicon Valley Manufacturing Group confidently predicted there would be another 200,000 jobs by 2010.

    However, at what may be the peak of the current boom, the number of tech jobs in the Valley remains down from a decade ago and unemployment is over 7.7%, just around the national average. In reality, social media was never going to reverse the downward trajectory in the rate of job growth. Old-line companies like  Hewlett-Packard or Intel, with over 50,000 employees in the U.S. alone, were capable of creating a broad range of opportunities for workers; in contrast, the social media big three of Facebook, LinkedIn and Twitter together have less than 6,500 employees.

    As the social media industry matures and consolidates,   employment is likely to continue shifting to less expensive, business-friendly areas. The Bay Area, where the overall cost of living is 68% higher than the national average and housing is the most expensive in the nation, may continue to attract and retain only the highest-end, best-paid workers. But for the most part they will follow the path of established tech firms such as  Apple, Intel, Adobe, eBay and IBM  to lower-cost places like Austin, Columbus and Salt Lake City. A similar phenomena also can be seen in other urban-centered industries, such as entertainment and finance where  virtually all employment growth is in places like St. Louis, Des Moines and Phoenix, even as the largest centers, New York, Chicago, Boston, Los Angeles and San Francisco have suffered significant job losses.

    Demographic forces may further accelerate these trends. The critical fuel for tech growth, educated labor, is now expanding faster in places like Columbus, Austin, Raleigh, Dallas and Houston than in Boston, San Jose and San Francisco. The old centers may still enjoy a lead in brains, but other places are catching up rapidly.

    Companies may also discover that with many millennials starting to hit their 30s, some may seek to leave their apartments to buy houses and start families. In California new local regulations essentially ban the construction of new single-family homes in some of the state’s biggest metro areas, pricing this option out of reach for all but a few, and forcing a key demographic group to seek residence elsewhere.

    Under these conditions, Silicon Valley will be forced to rely increasingly on inertia and mustering of financial resources than innovation. As a result, the nation’s tech map will continue to expand from the Bay Area, Boston, Seattle and Southern California to emerging metropolitan areas in North Carolina, Texas, Utah, Colorado and the Pacific Northwest. In the future parts of Florida, Phoenix, and even Great Plains cities like Sioux Falls and Fargo could also achieve some critical mass.

    Ultimately, one of the main dynamics of the information age — that even sophisticated tasks  can be done from anywhere — works against the dominion of single hegemonic industry centers like Wall Street, Hollywood and Silicon Valley. The tech sector is particularly vulnerable to declustering, due in large part thanks to the freedom from geography created by technologies of its own making.   Silicon Valley may continue to reap riches from the periodic technology  gold rush , but in the longer term, tech growth will continue its long-term dispersion to ever more parts of the country.

    STEM Occupations in the Nation’s 51 Largest Metropolitan Areas
    MSA Name 2001 – 2012 Growth 2005 – 2012 Growth 2010 – 2012 Growth 2012 Location Quotient LQ Change, 2001 – 2012
    Washington-Arlington-Alexandria, DC-VA-MD-WV 21.1% 12.7% 3.7% 2.19 10.6%
    Riverside-San Bernardino-Ontario, CA 18.6% -1.4% 2.2% 0.57 1.8%
    San Antonio-New Braunfels, TX 18.3% 17.2% 4.5% 0.83 1.2%
    Baltimore-Towson, MD 17.9% 11.4% 3.9% 1.37 15.1%
    Raleigh-Cary, NC 17.9% 14.6% 6.2% 1.53 0.0%
    Las Vegas-Paradise, NV 17.2% -2.6% 0.8% 0.52 4.0%
    Salt Lake City, UT 16.3% 18.1% 7.4% 1.16 4.5%
    Houston-Sugar Land-Baytown, TX 15.7% 17.2% 6.6% 1.20 -2.4%
    Seattle-Tacoma-Bellevue, WA 15.4% 22.2% 6.7% 1.86 8.1%
    Jacksonville, FL 13.0% 6.5% 2.4% 0.87 8.7%
    Austin-Round Rock-San Marcos, TX 12.2% 17.2% 9.1% 1.82 -8.5%
    San Diego-Carlsbad-San Marcos, CA 11.3% 8.0% 2.1% 1.38 6.2%
    Columbus, OH 10.4% 12.8% 4.7% 1.27 7.6%
    Orlando-Kissimmee-Sanford, FL 9.4% -1.1% 0.8% 0.84 -3.4%
    Indianapolis-Carmel, IN 6.9% 6.5% 2.7% 1.04 2.0%
    Nashville-Davidson–Murfreesboro–Franklin, TN 6.7% 3.5% 2.4% 0.77 -1.3%
    Sacramento–Arden-Arcade–Roseville, CA 6.4% 3.5% 0.4% 1.33 2.3%
    Oklahoma City, OK 5.5% 9.6% 6.4% 0.89 -1.1%
    Pittsburgh, PA 5.3% 10.3% 4.9% 1.07 5.9%
    Virginia Beach-Norfolk-Newport News, VA-NC 4.8% 2.3% 0.5% 1.10 3.8%
    Charlotte-Gastonia-Rock Hill, NC-SC 4.3% 8.2% 5.7% 0.99 -3.9%
    Kansas City, MO-KS 4.0% 5.8% 4.6% 1.12 4.7%
    Richmond, VA 3.8% 4.4% 3.4% 0.99 0.0%
    Cincinnati-Middletown, OH-KY-IN 3.7% 5.5% 6.8% 1.02 4.1%
    Buffalo-Niagara Falls, NY 3.2% 6.4% 3.6% 0.90 4.7%
    Dallas-Fort Worth-Arlington, TX 3.1% 11.4% 5.5% 1.19 -5.6%
    San Francisco-Oakland-Fremont, CA 2.5% 15.0% 9.9% 1.63 5.8%
    Phoenix-Mesa-Glendale, AZ 2.3% 3.5% 3.9% 1.05 -6.3%
    Minneapolis-St. Paul-Bloomington, MN-WI 2.2% 6.7% 5.9% 1.31 1.6%
    Portland-Vancouver-Hillsboro, OR-WA 1.6% 6.4% 5.4% 1.19 -3.3%
    Louisville/Jefferson County, KY-IN 0.9% 9.6% 6.9% 0.76 0.0%
    Denver-Aurora-Broomfield, CO 0.5% 10.8% 3.7% 1.43 -2.1%
    Atlanta-Sandy Springs-Marietta, GA -1.0% 5.5% 6.5% 1.07 -2.7%
    Boston-Cambridge-Quincy, MA-NH -1.3% 11.2% 6.0% 1.64 -1.2%
    Providence-New Bedford-Fall River, RI-MA -1.5% -1.6% 1.9% 0.88 2.3%
    Philadelphia-Camden-Wilmington, PA-NJ-DE-MD -2.8% -1.4% 1.4% 1.06 -1.9%
    Hartford-West Hartford-East Hartford, CT -4.5% 1.5% 0.3% 1.10 -3.5%
    New York-Northern New Jersey-Long Island, NY-NJ-PA -4.6% 2.8% 3.2% 0.90 -6.2%
    St. Louis, MO-IL -4.8% -1.7% 1.4% 1.05 -0.9%
    Milwaukee-Waukesha-West Allis, WI -6.1% -0.8% 4.0% 1.00 0.0%
    Tampa-St. Petersburg-Clearwater, FL -6.3% -4.3% 2.5% 0.89 -3.3%
    Miami-Fort Lauderdale-Pompano Beach, FL -6.4% -8.3% 0.6% 0.67 -8.2%
    Los Angeles-Long Beach-Santa Ana, CA -7.1% -3.5% 3.1% 0.98 -5.8%
    Memphis, TN-MS-AR -7.3% -4.0% 0.7% 0.62 -4.6%
    Cleveland-Elyria-Mentor, OH -8.8% -2.1% 4.3% 0.89 1.1%
    Chicago-Joliet-Naperville, IL-IN-WI -10.8% -1.4% 3.5% 0.87 -7.4%
    Birmingham-Hoover, AL -11.4% -8.0% -2.0% 0.76 -8.4%
    Rochester, NY -12.0% -2.1% 4.1% 1.14 -10.2%
    San Jose-Sunnyvale-Santa Clara, CA -12.6% 12.4% 8.3% 3.18 -4.8%
    New Orleans-Metairie-Kenner, LA -16.0% -7.4% -2.4% 0.74 0.0%
    Detroit-Warren-Livonia, MI -17.7% -10.3% 10.5% 1.42 -3.4%
    Analysis by Mark Schill, Praxis Strategy Group
    Data Source: EMSI 2012.4 Class of Worker – QCEW Employees, Non-QCEW Employees & Self-Employed 

    The LQ (location quotient) figure in the table above is the local share of jobs that are STEM occupations divided by the national share of jobs that are STEM occupations. A concentration of 1.0 indicates that a region has the same concentration of STEM occupations as the nation. The analysis covers 80 STEM occupations in all industries.

    Joel Kotkin is executive editor of NewGeography.com and a distinguished presidential fellow in urban futures at Chapman University, and a member of the editorial board of the Orange County Register . He is author of The City: A Global History and The Next Hundred Million: America in 2050. His most recent study, The Rise of Postfamilialism, has been widely discussed and distributed internationally. He lives in Los Angeles, CA.

    This piece originally appeared at Forbes.com.

    Computer engineer photo by BigStockPhoto.com.

  • California’s Poor Long-term Prognosis

    California’s current economic recovery may be uneven at best, but things certainly look better now than the pits-of-hell period in 2008. A cautiously optimistic New York Times piece proclaimed "signs of resurgence," and there was even heady talk in Sacramento of eventually sighting that rarest of birds, a state budget surplus.

    Yet such outbreaks of optimism should not blind us to the bigger issue: the long-term secular decline of the state’s economy. Whether you believe that the new higher taxes may now slow our growth, as my colleagues at Chapman University now believe, or right the fiscal ship, as is widely hoped in the blue California press, it’s more important to look more at the long-term trends, and assess where we stand compared with our domestic competitors.

    California, despite its enormous natural and human resources, is losing ground in most basic areas. Its unemployment rate, a still-horrendous 10 percent, stands as the nation’s third-highest. This is not a new development or the product of a run of bad luck. The state’s unemployment rate has been consistently above the national average for almost all of the past 20 years. Most interior counties, including the Inland Empire and the Central Valley, now suffer unemployment rates well into the double digits, with some approaching 15 percent.

    Overall, the state is still down a half-million jobs during the recession. California’s losses since its employment peak have been considerably above the national average, some 3 percent, far worse than the 2.3 percent erosion seen nationwide. Despite the modest recent uptick, the California Budget Project projects the state would need to add twice as many jobs per month to fully recover from the recession by the summer of 2015.

    Other long-term trends confirm the state’s secular decline in competitiveness. Take per capita income – a decent indicator of relative progress. In 1945, journalist John Gunther, writing his famous "Inside USA," gushingly described California "the most spectacular and most diversified American state … so ripe, golden." At the time, the state boasted the third-highest per capita income in the nation. As late as 1980, the state still ranked fourth. Today, despite Silicon Valley’s money machine, California has fallen to 12th and appears headed for further decline.

    Despite hopes in Sacramento and in the media, high-tech alone can not bail out the state. The much hoped-for windfall around the time of the Facebook IPO has failed to produce the expected fiscal bonanza for the state treasury. Silicon Valley famously gets nearly half the country’s venture capital, but its impact on the rest of the state has diminished. In the 1980s and 1990s, tech booms stretched prosperity throughout its surrounding regions and as far as Sacramento. Now it barely covers half the Bay Area; unemployment in Oakland remains at around 13 percent and one child in three lives in poverty.

    Part of this reflects the shift from an industrial high-tech focus to one fixated on software and social media. Given the extraordinary ease with which support and even research operations can be moved, once companies start to grow, they easily head to India, China or over to lower-cost locales like Utah or Texas. "Sure, we are getting half of all the venture capital investment but in the end we have relatively small research and development firms only," observes Jack Stewart, president of the California Technology and Manufacturing Association. "Once they have a product or go to scale, the firms move elsewhere. The other states end up getting most of the middle-class jobs."

    This can be seen in the long-term trends in STEM (science, technology, engineering, mathematics-related) jobs. Over the past decade, even with the current bubble, Silicon Valley’s STEM employment, according to estimates by Economic Modeling Specialists Inc., has increased by a mere 4 percent over the past decade. In contrast, science-based employment jumped 25 percent in Seattle, 20 percent in Houston and 16.8 percent in Austin, Texas.

    The tech scene in the Los Angeles Basin is doing even worse. STEM employment in the Los Angeles-Santa Ana area is still stuck below 2002 levels, partially a residue of the continued decline of the region’s once-globally dominant aerospace industry. The region, once arguably the world’s largest agglomeration of scientists and engineers, has now dipped below the national average in proportion of STEM jobs.

    Far greater problems can be seen further down the economic food chain, where many working-class and middle-class Californians traditionally have been employed. The state’s heavy industry – traditionally the source of higher-paid blue-collar employment – has missed out on the nation’s broad manufacturing resurgence. Over the past 10 years, according to an analysis by the Praxis Strategy Group, California has ranked 45th among the states in terms of heavy metal job creation, losing 126,000 jobs – more than 27 percent; San Francisco-Oakland ranked last among 51 large metropolitan areas. Both Los Angeles-Orange and San Bernardino ranked in the bottom 10.

    Despite hype about "green jobs," the immediate prospect for a big manufacturing turnaround is not bright. Because of its high energy costs and other regulatory costs, industrial investment has dried up in California. According to the California Technology and Manufacturing Association, California in 2011 did not even make the top 10 states in terms of new industrial investment, accounting for a paltry 2 percent. This was about one-third or less the share garnered by rivals such as Texas, North Carolina and rebounding "rust belt" states, like Pennsylvania.

    Construction, another pillar of higher-paid blue-collar employment, has recovered a bit but remains in worse shape than elsewhere. Overall, the state has lost almost 300,000 construction jobs from the 2007 peak, an almost 40 percent loss compared with 29 percent for the country as a whole.

    Even the trade sector, stalwart performer in producing high-wage jobs, may soon be declining. Recent labor disputes by highly paid, politically powerful California port workers – shutting down operations for eight days in Los Angeles and Long Beach – has reinforced the notion that the state’s an increasingly unreliable place to do business. After peaking around 2002, our ports are watching growth shift to the Gulf ports, such as Houston, and to the ports of the south Atlantic. The challenge will become far greater once the Panama Canal is widened in 2014 to accommodate larger ships from Asia.

    California is also squandering its chance to participate in a potential fourth source of basic employment, the massive expansion in domestic oil-and-gas production. The Golden State sits on potentially the largest gusher in the nation – the Monterey Formation is now estimated to be four times as rich in oil as North Dakota’s Bakken Formation. But our green consciousness dictates we don’t exploit our resources too much. In the past decade, Texas created some 200,000 generally high-paying energy jobs, while greener-than-thou California has generated barely one-tenth as many.

    As a result, wealthier, older, whiter, generally better-educated coastal areas can recover, but the prospects are dismal the further you head into the increasingly Latino, younger and less-educated inland areas. You have flush times for venture capitalists and celebrities, but growing poverty elsewhere. For at least two decades California’s poverty rate has remained higher than the national average. Now, notes a new Census estimate, the Golden State has a poverty rate of more than 23 percent, the highest in the country, something unthinkable a generation ago.

    Clearly, progressive policies are having socially regressive effects. Over the past few years the state, as a recent Public Policy Institute of California study demonstrates, has become ever substantially more unequal than the rest of the nation. Typical California middle-income workers have seen their median wage, adjusted for inflation, decline 4.5 percent since 2006, and now is at the lowest level since 2008. Only the highest-paid workers have avoided a decline in earnings.

    Fortunately, the elements to regain our former broad-based prosperity are still in place. The critical human assets are there: entrepreneurs, hardworking immigrants, top universities. We boast advantages from legacy industries – entertainment and fashion to technology and agriculture. And, perhaps most importantly, California retains its remarkable natural blessings of massive energy resources, fertile soil and a benign climate.

    The imperative now is to take fuller advantage of all these blessings in the coming years. Otherwise California will become poorer, more socially bifurcated and relegated by other places to the proverbial "dustbin of history."

    This piece first appeared in the Orange County Register.

    Joel Kotkin is executive editor of NewGeography.com and is a distinguished presidential fellow in urban futures at Chapman University, and contributing editor to the City Journal in New York. He is author of The City: A Global History. His newest book is The Next Hundred Million: America in 2050, released in February, 2010.

  • The Drive-It-Yourself Taxi: A Smooth Ride?

    Despite a corporate sponsor that paid handsomely for the naming rights, Londoners stubbornly refer to our bikesharing system as ‘Boris Bikes’, in a nod to our colourful Mayor, Boris Johnson. But what will we call our new drive-it-yourself taxis? My suggestion: ‘Boris Cabs’ – and they are now a reality here, thanks to Daimler’s car2go service, if you happen to live in one of three small and separate sections of town. But why did a one-way carsharing system have to limp into London, when more than a dozen other cities have welcomed these arrangements with open arms? In the US, car2go first appeared in Austin, Texas, and since then has moved into Washington, D.C, Miami, Portland Oregon, San Francisco, San Diego, and Seattle. It operates in Canada and, on the Continent, in Paris and Amsterdam, among other locations. So why no splashy launch across England’s Capital, and no images of a smiling Boris cutting a ribbon?

    First, roads in London are balkanised. Our regional transport agency (Transport for London) runs the main arteries, and they provide little on-street parking, the mother’s milk of one-way carsharing. That leaves the local streets in the the domain of the 33 boroughs that are each independent municipalities. Car2go is making a brave attempt to get off the ground here by starting with hundreds of cars (the press release reports 500; in practice,170 are in operation two weeks after the launch) in disconnected sections of town, something it has not resorted to anywhere else. Its standard practice is to strike a city-wide deal with whoever’s in charge of on-street parking, and no single agency fits that bill here. What’s the rush? Well, BMW is hot on their heels with its competing DriveNow system, with staff in London well into the advanced stages of planning.

    Second, there is genuine uncertainty about the impacts”. Will we take drive-it-yourself cabs to work, and avoid the crush on the Tube? It would be a very different experience than traditional carsharing — London is said to be Zipcar’s second-biggest market after NYC — which doesn’t work for the daily commute. In the Zipcar model (soon to be the ‘Zipcar by Avis’ model?) you take a car on a round-trip basis and pay by the hour, like filling a parking meter. The novelty of this new generation of drive-yourself cabs lies in their flexibility: as with a taxi meter, you pay by the minute for just the time it takes you to get from ‘A’ to ‘B’, then drop the car off and forget about it.

    What does this mean for traffic congestion? CO2 emissions? What about the cute blue-and-white Smart Fortwo-model cars now parked in your neighbourhood – will they mean less parking for private car owners? Not bloody likely. The expectation is that, in time, enough private car owners will switch to using the fleet’s cars, meaning that on balance fewer cars will need to be parked. But try explaining this to car2go’s new neighbours who are not familiar with the subtleties and will be the ones dealing with the growing pains as we feel our way forward.

    Transport is a long game, so it will be years until we properly understand the impacts of drive-yourself cabs. My research suggests that likely impacts are:

    1) A much larger market than traditional carsharing (about four times as many subscribers)
    2) A roughly 4% reduction in personal car ownership
    3) About a 1% decrease in car driving vehicle miles travelled (including personal cars, traditional carsharing, and drive-yourself cabs)
    4) About a 1% decrease in the number of public transport journeys

    We can be reasonably certain that some surprising impacts will be revealed during field trials, and if at some future point London’s authorities are not happy with the knock-on effects there’s nothing to stop us from regulating the industry like any other. But for the moment we don’t understand it well enough to do anything other than let the operators experiment and keep tabs on what’s happening.

    We just don’t know what the impacts on traffic levels and CO2 will turn out to be, and, frankly, it’s unfair to – as some suggest – hold the industry to a no-net-traffic/CO2 standard. We don’t do that to Black Cabs or [advance-booking-only] minicabs, or indeed to the automotive or urban transport sectors more broadly. A fairer standard, admittedly more complex to administer, would be to assess whether net value is created after accounting for effects on traffic levels, emissions and more. In other words: get the prices right, just like the economics textbooks say.

    The question that needs thinking through is what would transport in London look like if drive-yourself taxi systems went viral and we came to depend on them. What happens, for instance, when instead of 500 of these cabs there are 50,000, and the necessary communication links go down? How would the transport system work if on-road congestion became replaced by virtual queuing to get access to a car? And what about times when the system is under stress, like when a hurricane is approaching, for instance. Is it OK to just flip the switch off on the whole fleet? Who would make this decision, and what guidelines would they follow?

    If the history of the car in cities has taught us anything, it is that we need to be humble about our ability to forecast the future. So what is the way forward for Boris Cabs in London? Start with a small fleet and short-duration contracts. Be clear on the objectives and flexible on the implementation. Keep our options open. It will be an interesting ride.

    Scott Le Vine, AICP is a research associate in transport systems at Imperial College London and a trustee of the shared-mobility NGO Carplus, which serves as the UK’s carsharing trade body. He authored the recent study Car Rental 2.0: Car club [carsharing] innovations and why they matter.

    Flickr photo: Car 2 Go in the 1700 block of Q Street, NW, Washington DC on Easter Sunday, 8 April 2012 by Elvert Barnes Photography

  • Where Americans Are Moving

    The red states may have lost the presidential election, but they are winning new residents, largely at the expense of their politically successful blue counterparts. For all the talk of how the Great Recession has driven people — particularly the “footloose young” — toward dense urban centers, Census data reveal that Americans are still drawn to the same sprawling Sun Belt regions as before.

    An analysis of domestic migration for the nation’s 51 largest metropolitan statistical areas by demographer Wendell Cox shows that the 10 metropolises with the largest net gains from 2000 through 2009 are in the Sun Belt, led by Phoenix, and followed by Riverside-San Bernardino, Calif.; Atlanta; Dallas-Ft. Worth; and Las Vegas.

    Migration has slowed from a high of nearly 2 million annually in 2006 to less than 800,000 last year, but the most recent numbers show that the Sun Belt states, though chastened by the recession, are far from dead, as often alleged. This part of America, widely consigned to what the Bolshevik firebrand Leon Trotsky called the “dustbin of history” by Eastern pundits, somehow manages to continue to draw Americans seeking opportunities, in particular from the large coastal metropolitan regions.

    Migration data for the most recent one-year period available, July 2010 t0 July 2011, show the Great Recession has shaken the rankings up quite a bit within the circle of fast-growth regions. The biggest winner has been Texas. The Lone Star state boasts four of the 10 metro areas with the largest net migration gains for the past two years.  Dallas ranks first, followed by Austin in third place, Houston in fifth and San Antonio in eighth. In contrast, some of the growth leaders over the 2000-09 period, notably Las Vegas, and to a lesser extent Phoenix, have tumbled considerably in the rankings. The lesson here: a strong economy has to be based on something more than gaming, tourism and home construction. Energy, technology, manufacturing and trade are far preferable as an economic base.

    Also posting strong net migration gains for 2010-11 were Miami (second place), Washington, D.C. (sixth), and Seattle (ninth). In each of these areas, economic conditions appear to have improved. The once disastrous condo glut in the Miami area, which includes Dade, Broward and Palm Beach counties, has begun to clear up as foreign buyers pour into the region. Taxpayer-funded Washington is surging with new jobs and the highest incomes in the land. Seattle continues a long-term evolution toward the healthiest of the blue-state private economies. San Francisco, a consistent big loser for the last decade, jumped to 19th, presumably as a result of the current dot.com bubble.

    Another huge turnaround can be seen in New Orleans, which ranked a dismal 43rd for 2000-09 as residents fled not only Katrina but a stagnant, low-wage, corruption-plagued economy. But in our 2010-11 ranking, the Crescent City surged to a respectable 16th, one of the biggest migration turnarounds in the country.

    How about the biggest losers? From 2000-09, the metropolitan areas that suffered the biggest net domestic migration losses resemble something of an urbanist dream team: New York, which saw a net outflow of a whopping 1.9 million citizens, followed by the Los Angeles metro area (-1,337,522), Chicago, Detroit, and, despite recent improvements, San Francisco-Oakland. The raw numbers make it clear that California has lost its appeal for migrants from other parts of the U.S., and has become an exporter of people and talent (and income).

    And despite the cheap money Bernanke-Geithner policies of the past few years that have benefited giant banks centered in the bluest big cities, people continue to leave these areas.  The 2010-11 numbers show the deck chairs on the migratory titanic have stayed remarkably similar, with New York still ranking first among the 51 biggest metro areas for net migration losses, followed by Chicago, Los Angeles, Detroit and Philadelphia. In most of these cases only immigration from abroad, and children of immigrants, have prevented a wholesale demographic decline.

    What can we expect now? It seems clear that the urban-centric policies of the Obama administration have not changed Americans’ migration patterns. The weak recovery has slowed migration, but expensive, overregulated and dense metropolitan areas continue to lose population to lower-cost, less regulated and generally less dense regions. This may speed up as recent tax hikes squeeze the hard-pressed middle class and if, as appears likely, the social media bubble continues to deflate.

    If the economy somehow gains strength, it may only serve to further accelerate these trends. The incipient recovery in housing prices seems likely, at least in places like California and the Northeast, to create yet another bubble. This will give people more incentive to move to less expensive areas, particularly those who can cash in by selling a house in a pricier city and moving to a less expensive one. The differential in housing costs between New York and Tampa-St. Petersburg now stands at historic highs, and near peak bubble highs between Los Angeles and Phoenix; the traditional growth states are looking more attractive all the time for people looking to make quick money in an economy with shrinking opportunities elsewhere. This includes the massive wave of aging boomers, many of whom may see selling a house in California or the Northeast as a way to make up for less than adequate IRAs. The combination of low prices and warmer weather in the past has proven an irresistible one for those retiring or simply down-shifting their careers. This appeal is likely to grow as the senior population expands.

    Other demographic factors could further drive this trend. As the millennial generation ages and starts looking for places to buy homes and raise families, many will seek out places that are both affordable and offer better economic opportunities. These will tend to be in the South and Southwest, particularly Texas, and Plains States metro areas such as Oklahoma City.

    Finally we can expect immigrants, particularly from Asia, to continue to seek out housing bargains and new opportunities primarily in the Sun Belt states, as our recent study of changing Asian settlement patterns revealed. More will be shifting from the high-priced, low-growth big metros for opportunity cities such as Houston, Dallas-Fort Worth, Raleigh and Charlotte.

    Overall we can  expect domestic migration to pick up, and to follow the well-trodden path from the great cities of the Northeast and California to the Sun Belt’s  resurgent boom towns. This may be bad news to many urban pundits and big city speculators, but it also should create new opportunities for more perceptive, and less jaded, investors.

    2010-2011 Net Domestic Migration for the Nation’s 51 Largest Regions
    Rank by Net Flow Metropolitan Area Net Flow Rate Per 1,000 Residents Rank by Rate
    1 Dallas-Fort Worth-Arlington, TX 39,021 6.04 10
    2 Miami-Fort Lauderdale-Pompano Beach, FL 36,191 6.43 9
    3 Austin-Round Rock-San Marcos, TX 30,669 17.47 1
    4 Tampa-St. Petersburg-Clearwater, FL 27,157 9.68 3
    5 Houston-Sugar Land-Baytown, TX 21,580 3.58 16
    6 Washington-Arlington-Alexandria, DC-VA-MD-WV 21,517 3.80 15
    7 Denver-Aurora-Broomfield, CO 19,565 7.59 7
    8 San Antonio-New Braunfels, TX 19,515 8.97 4
    9 Seattle-Tacoma-Bellevue, WA 17,598 5.07 13
    10 Riverside-San Bernardino-Ontario, CA 15,131 3.54 17
    11 Charlotte-Gastonia-Rock Hill, NC-SC 13,778 7.74 6
    12 Raleigh-Cary, NC 13,262 11.53 2
    13 Atlanta-Sandy Springs-Marietta, GA 12,419 2.33 18
    14 Portland-Vancouver-Hillsboro, OR-WA 11,388 5.07 12
    15 Orlando-Kissimmee-Sanford, FL 10,394 4.82 14
    16 New Orleans-Metairie-Kenner, LA 10,153 8.59 5
    17 Nashville-Davidson–Murfreesboro–Franklin, TN 9,323 5.81 11
    18 Oklahoma City, OK 8,746 6.90 8
    19 San Francisco-Oakland-Fremont, CA 5,880 1.35 22
    20 Phoenix-Mesa-Glendale, AZ 5,585 1.32 24
    21 Pittsburgh, PA 3,740 1.59 20
    22 Jacksonville, FL 2,911 2.15 19
    23 Sacramento–Arden-Arcade–Roseville, CA 2,856 1.32 23
    24 Columbus, OH 2,219 1.20 26
    25 Indianapolis-Carmel, IN 1,940 1.10 27
    26 Louisville/Jefferson County, KY-IN 1,886 1.46 21
    27 Richmond, VA 1,546 1.22 25
    28 Salt Lake City, UT 915 0.80 28
    29 San Diego-Carlsbad-San Marcos, CA 816 0.26 29
    30 Minneapolis-St. Paul-Bloomington, MN-WI 536 0.16 30
    31 Baltimore-Towson, MD -1,341 -0.49 32
    32 Boston-Cambridge-Quincy, MA-NH -1,627 -0.36 31
    33 Birmingham-Hoover, AL -2,452 -2.17 35
    34 Buffalo-Niagara Falls, NY -2,558 -2.25 38
    35 San Jose-Sunnyvale-Santa Clara, CA -2,704 -1.46 34
    36 Kansas City, MO-KS -2,820 -1.38 33
    37 Memphis, TN-MS-AR -2,933 -2.22 37
    38 Rochester, NY -3,320 -3.15 40
    39 Hartford-West Hartford-East Hartford, CT -4,749 -3.92 45
    40 Milwaukee-Waukesha-West Allis, WI -4,862 -3.12 39
    41 Providence-New Bedford-Fall River, RI-MA -6,254 -3.91 44
    42 Las Vegas-Paradise, NV -6,353 -3.24 41
    43 Virginia Beach-Norfolk-Newport News, VA-NC -7,086 -4.22 47
    44 Cincinnati-Middletown, OH-KY-IN -7,149 -3.35 42
    45 St. Louis, MO-IL -10,260 -3.64 43
    46 Cleveland-Elyria-Mentor, OH -12,521 -6.04 51
    47 Philadelphia-Camden-Wilmington, PA-NJ-DE-MD -13,133 -2.20 36
    48 Detroit-Warren-Livonia, MI -24,170 -5.64 49
    49 Los Angeles-Long Beach-Santa Ana, CA -50,549 -3.92 46
    50 Chicago-Joliet-Naperville, IL-IN-WI -53,908 -5.68 50
    51 New York-Northern New Jersey-Long Island, NY-NJ-PA -98,975 -5.22 48


    Joel Kotkin is executive editor of NewGeography.com and is a distinguished presidential fellow in urban futures at Chapman University, and contributing editor to the City Journal in New York. He is author of The City: A Global History. His newest book is The Next Hundred Million: America in 2050, released in February, 2010.

    This piece originally appeared at Forbes.

    Dallas photo by Bigstock.

  • How California Lost its Mojo

    The preferred story for California’s economy runs like this:

    In the beginning there was prosperity.  It started with gold.  Then, agriculture thrived in California’s climate.  Movies and entertainment came along in the early 20th Century.  In the 1930s there was migration from the Dust Bowl.  California became an industrial powerhouse in World War II.  Defense, aerospace, the world’s best higher education system, theme parks, entertainment, and tech combined to drive California’s post-war expansion.

    Then, in the evening of November 9th, 1989, the Berlin Wall came down.  On December 25, 1991, the Soviet Union was dissolved.  The Cold War was over.  America responded by cutting defense spending and called the savings the Peace Dividend.

    California paid that peace dividend.  A huge portion of California’s military industrial complex was destroyed.  The aerospace industry was downsized, never to come back.  Hundreds of thousands of well-paying manufacturing and engineering jobs were lost.

    The ever-resilient California bounced back though.  Tech, driven by an entrepreneurial culture and fed by California’s great universities drove California’s economy to new heights.

    Then, there was the dot.com bust.  A mild national recession was much more painful for a California dependent on its tech sector.  Eventually California recovered.  California’s tech sector and climate, aided by a housing boom, restored California’s prosperity.

    The housing boom was followed by a housing bust.  Again, California paid a high price, and unemployment skyrocketed to 30 percent above the national average.

    Today, California is recovering.  Its tech sector is once again bringing prosperity to the state.  Furthermore, California’s green legislation is providing the motivation for a brave new future of economic growth and environmental virtue.

    The story is true through the Peace Dividend.  California did pay a high price for the collapse of the Soviet Union.  California’s defense sector did begin a decline, and it never recovered.  But, defense recovered in other places, as the country expanded defense spending by 21 percent in the 2000s.  The United States has constantly been engaged in wars and conflicts for over a decade.  On a real-per-person basis, the United States is spending as much on defense as it has at any time since 1960. 

    But when it comes to the present, the narrative falls down.  Defense has rebounded, but not in California.  California’s defense sector is small and declining, not because of a permanently smaller U.S. defense sector, but because of something about California.

    California’s tech sector did boom after the collapse of California’s defense sector, but that doesn’t mean that California recovered.  In fact, much of California never recovered.  It’s the aggregation problem. 

    The 1990s’ recovery was largely a Bay Area recovery.  Los Angeles hardly saw any uptick in employment.  Here is a chart comparing Los Angeles County’s jobs growth rate with the San Jose Metropolitan Statistical Area (MSA): 

    San Jose probably had California’s fastest growing job market in the 1990s.  Los Angeles was not the states slowest.  Still, the differences are striking.

    A few years ago, a couple of my graduate students looked at California data from 1990 through 1999.  They divided California into two regions, the Bay Area and everywhere else.  The Bay Area was defined as Sonoma, Marin, Napa, Solano, Contra Costa, Alameda, Santa Clara, Santa Cruz, San Mateo, and San Francisco counties.  Using seven indicators of economic growth, they performed relatively simple statistical tests to see if the two geographies experienced similar economies.  The indicators were employment, wages, home prices, bank deposits, population growth, construction permits, and household income.

    By every measure except population growth, the Bay Area outperformed the rest of the state.  The exception was probably due to commuters to the Bay Area, given that region’s exceptionally high housing prices. 

    Some economists will tell you that California saw faster-than-national job growth from the mid 1990s until the great recession.  This is another aggregation problem.  The claim is technically true, but only in the sense that California had a higher proportion of the nation’s jobs in 2007 than it did in 1995.  If you look at annual data, you will see that California’s share of the nation’s jobs only grew from 1995 through 2002.  Since then, California’s share of United States jobs resumed its decline:

    In reality, California never recovered from the dot.com bust.  California, perhaps the best place on the planet to live, couldn’t keep up in a housing boom.  Something was wrong.

    California had lost its mojo. 

    Opportunity is now greater outside California than inside California.  For almost 150 years, California was as widely known for its opportunity as it was for its sunshine.  The combination was like a drug.  George Stoneman, an army officer destined to become California’s 15th governor, spoke for millions when he said "I will embrace the first opportunity to get to California and it is altogether probable that when once there I shall never again leave it." 

    They did come to California, and they made an amazing place.  Opportunity-driven migrants are different than other people.  They take big risks to leave everything they know for an uncertain future in a new place.  They are confident, bold, and brash.   California became just as confident, bold, and brash.  The Anglo-American novelist Taylor Caldwell spoke the truth when she said "If they can’t do it in California, it can’t be done anywhere."

    That was then.  Today, California can’t even rebuild an old Hotel.

    The Miramar Hotel is a partially-demolished eyesore beside the 101 Freeway in Montecito, just south of Santa Barbara.  The Hotel’s initial structure was built in 1889.  Over the years, it was expanded to a 29 structure luxury hotel and resort.  In September 2000 it was closed for renovations which were expected to take 18 months.  That was when the fighting started.  Community groups, neighbors, and governments all had their own idea of what the Miramar should be.  Two owners later, and after millions of dollars, the future to the Miramar is still uncertain.

    The Miramar Hotel is a case study of what is wrong with post-industrial California, precisely because it should have been easy, and because it is not unique.  Everything is hard to do in California.  The state that once moved rivers of water hundreds of miles across deserts and over or through mountain ranges can’t rebuild a hotel.

    The situation will get worse.  California has become the place people are leaving.  The following chart shows that for 20 years more people have left California for other states than came to California from other states:

    California’s population is still increasing because of births and international immigration. 

    Two decades of negative domestic migration has taken its toll.  Millions of risk-taking, confident, bold, and brash people have left California.  They took California’s mojo with them.

    That seems pretty clear when you look at some statistics:  California’s unemployment is way above the national average.  With only about 12 percent of the nation’s population, California has over 30 percent of the nation’s welfare recipients.  San Bernardino has the nation’s second highest poverty rate among cities over 200,000.

    Sometimes though, aggregated data can hide California’s weakness, and some, representing the always-present constituency for the status quo, use these data to deny that California’s future is any less golden. 

    Most recently, those representing the constituency for the status quo have used California’s aggregated jobs data to argue that all is well in California.  They argue that California’s tech sector is leading California to a new golden future.

    Year-over-year data confirm that, through August 2012, California gained jobs at a faster pace than the United States.  Once again, though, that growth is largely confined to one industry and one geography.  California’s tech sector is recovering, and amidst a generally weak recovery, it appears strong enough to generate pretty impressive aggregated results.  If we disaggregate California’s data, we will find that there is not just one California.  There is a rich and mostly coastal California, with a few smaller inland counties on the San Francisco-Lake Tahoe corridor.  Another California is very poor and mostly inland.

    Here’s a list of California’s poorest counties by poverty rate:

    County

    Poverty Rate

    Child Poverty Rate

    Rank

    Del Norte

    23.5

    30.6

    3

    Fresno

    26.8

    38.2

    1

    Imperial

    22.3

    31.8

    6

    Kern

    21.4

    30.3

    10

    Kings

    22.5

    29.7

    5

    Madera

    21.7

    31.7

    8

    Merced

    23.1

    31.4

    4

    Modoc

    21.9

    32.5

    7

    Siskiyou

    21.5

    30.7

    9

    Tulare

    33.6

    33.6

    2

    Here’s a list of California richest counties by poverty rate:

    County

    Poverty Rate

    Child Poverty Rate

    Rank

    Calaveras

    11.1

    18.3

    10

    Contra Costa

    9.3

    12.7

    4

    El Dorado

    9.4

    11.6

    5

    Marin

    9.2

    10.9

    3

    Mono

    10.8

    15

    8

    Napa

    10.7

    14.7

    7

    Placer

    9.1

    10.7

    2

    San Mateo

    7

    8.5

    1

    Santa Clara

    10.6

    13.3

    6

    Ventura

    11

    15.3

    9

    There are some big differences here.  The percentage of Fresno’s children living in poverty is four and half times the percentage of San Mateo children living in poverty.  In fact, the data for California’s poorest counties looks like third-world data.

    When disaggregated, the job-growth data shows the same story.  Through 2012’s second quarter, jobs in the San Jose MSA were up 3.6 percent on a year-over-year basis.  In Los Angeles, jobs were up only 1.1 percent, while in Sacramento they were up only 0.6 percent.  For comparison, U.S. jobs were up about 1.3 percent for the same time period.

    You can perform this analysis for all types of data.  When the data are disaggregated, the story is always the same.  It’s telling us that California needs to get its mojo back, and the current tech boom is likely not to be enough for its recovery.

    Bill Watkins is a professor at California Lutheran University and runs the Center for Economic Research and Forecasting, which can be found at clucerf.org.

    Unemployment photo by BigStockPhoto.com.

  • Flocking Elsewhere: The Downtown Growth Story

    The United States Census Bureau has released a report (Patterns of Metropolitan and Micropolitan Population Change: 2000 to 2010.) on metropolitan area growth between 2000 and 2010. The Census Bureau’s the news release highlighted population growth in downtown areas, which it defines as within two miles of the city hall of the largest municipality in each metropolitan area. Predictably, media sources that interpret any improvement in core city fortunes as evidence of people returning to the cities (from which they never came), referred to people "flocking" back to the "city" (See here and here, for example).

    Downtown Population Trends: Make no mistake about it, the central cores of the nation’s largest cities are doing better than at any time in recent history. Much of the credit has to go to successful efforts to make crime infested urban cores suitable for habitation, which started with the strong law enforcement policies of former New York Mayor Rudy Giuliani.

    However, to characterize the trend since 2000 as reflective of any "flocking" to the cities is to exaggerate the trend of downtown improvement beyond recognition. Among the 51 major metropolitan areas (those with more than 1 million population), nearly 99 percent of all population growth between 2000 and 2010 was outside the downtown areas (Figure 1).

    There was population growth in 33 downtown areas out of the 51 major metropolitan areas. As is typical for core urban measures, nearly 80 percent of this population growth was concentrated in the six most vibrant downtown areas, New York, Chicago, Philadelphia, Washington, Boston and San Francisco.

    If the next six fastest-growing downtown areas are added to the list (Dallas-Fort Worth, Houston, Los Angeles, Portland, San Diego and Seattle), downtown growth exceeds the national total of 205,000 people, because the other 39 downtown areas had a net population loss. Overall, the average downtown area in the major metropolitan areas grew by 4000 people between 2000 and 2010. That may be a lot of people for a college lacrosse game, but not for a city. While in some cases these increases were substantial in percentage terms, the population base was generally small, which was the result of huge population losses in previous decades as well as the conversion of old disused office buildings, warehouses and factories into residential units.

    Trends in the Larger Urban Cores: The downtown population gains, however, were not sufficient to stem the continuing decline in urban core populations. Among the 51 major metropolitan areas, the aggregate data indicates a loss of population within six miles of city hall. In essence, the oasis of modest downtown growth was more than negated by losses surrounding the downtown areas. Virtually all the population growth in the major metropolitan areas lay outside the six mile radius core, as areas within the historical urban core, including downtown, lost 0.4 percent.

    Even when the radius is expanded to 10 miles, the overwhelming majority of growth remains outside. Approximately 94 percent of the aggregate population growth of the major metropolitan areas occurred more than 10 miles from downtown (Figure 2). Figure 3 shows that more than one-half of the growth occurred 20 miles and further from city hall. Further, the population growth beyond 10 miles (10-15 mile radius, 15-20 miles radius and 20 mile and greater radius) from the core exceeded the (2000) share of population, showing the continuing dispersal of American metropolitan areas (Figure 4).

    Chicago: The Champion? The Census Bureau press release highlights the fact that downtown Chicago experienced the largest gain in the nation. Downtown Chicago accounted for 13 percent of the metropolitan area’s growth with an impressive 48,000 new residents. However, while downtown Chicago was prospering, people were flocking away from the rest of the city. Within a five mile radius of the Loop, there was a net population loss of 12,000 and a net loss of more than 200,000 within 20 miles (Figure 5). Only within the 36th mile radius from city hall is there a net population gain.

    Cleveland: Comeback City and Always Will Be? In view of Cleveland’s demographic decline (down from 915,000 in 1950 to 397,000 in 2010), any progress in downtown Cleveland is welcome. But despite the frequently recurring reports, downtown Cleveland’s population growth was barely 3,000. Despite this gain, the loss within a 6 mile radius was 70,000 and 125,000 within a 12 mile radius. Beyond the 12- mile radius, there was a population increase of nearly 55,000, which insufficient to avoid a metropolitan area population loss.

    Other Metropolitan Areas: A total of 30 major metropolitan areas suffered core population losses, despite the fact that many had downtown population increases.

    • Five major metropolitan areas suffered overall population losses (Buffalo, Cleveland, Detroit, Pittsburgh and Katrina ravaged New Orleans).
    • St. Louis, with a core city that holds the modern international record for population loss (from 857,000 in 1950 to 319,000 in 2010), experienced a population decline within a 27 mile radius of city hall. Approximately 150 percent of the growth in the St. Louis metropolitan area was outside the 27 mile radius. Even so, there was an increase of nearly 6,000 in the population of downtown St. Louis.
    • There were population losses all the way out to a considerable distance from city halls in Memphis (16 mile radius), Cincinnati (15 mile radius) and Birmingham (14 mile radius). The three corresponding downtown areas also lost population.
    • Despite having one of the strongest downtown population increases (12,000), population declined within a 10 mile radius of the Dallas city hall. This contrasts with nearby Houston, which also experienced a strong downtown increase (10,000) but no losses at any radius of the urban core.
    • Milwaukee experienced a small downtown population increase (2,000), but had a population loss within an11 mile radius.

    The other 21 major metropolitan areas experienced population gains throughout. Even so, most of the growth (77 percent) was outside the 10 mile radius. San Jose had the most concentrated growth, with only 24 percent outside a 10 miles radius from city hall. All of the other metropolitan areas had 60 percent or more of their growth outside a 10 mile radius from city hall.

    As we have observed before, 2000 to 2010 was, unlike the 1970s and other decades, more friendly to the nation’s core cities, although less so than the previous decade. Due to the repurposing of old offices and other structures, sometimes aided by subsidies, small downtown slivers may have done better than at any time since before World War II. But the data is clear. Suburban growth was stronger in the 2000s than in the 1990s. The one percent flocked to downtown and the 99 percent flocked to outside downtown.

    Population Loss Radius: Major Metropolitan Areas
    Miles from City Hall of Historical Core Municipality*
    Major Metropolitan Areas (Over 1,000,000 Population Share of Metropolitan Growth Population Loss Radius (Miles)
    "Outside Downtown" (2- Mile Radius) Outside 5-Mile Radius Outside 10-Mile Radius
    MAJOR METROPOLITAN AREAS: TOTAL 98.7% 100.4% 93.5% 6
    Atlanta, GA 99.6% 101.1% 99.9% 9
    Austin, TX 98.1% 96.7% 81.9% 0
    Baltimore, MD 106.5% 118.7% 99.5% 9
    Birmingham, AL 104.2% 132.5% 124.9% 14
    Boston, MA-NH 90.8% 76.9% 67.3% 0
    Buffalo, NY Entire Metropolitan Area Loss
    Charlotte, NC-SC 99.1% 97.4% 75.0% 3
    Chicago, IL-IN-WI 86.7% 103.3% 144.6% 35
    Cincinnati, OH-KY-IN 105.1% 126.8% 135.2% 15
    Cleveland, OH Entire Metropolitan Area Loss
    Columbus, OH 100.5% 104.3% 86.9% 7
    Dallas-Fort Worth, TX 99.0% 101.0% 100.7% 10
    Denver, CO 98.0% 100.3% 89.8% 5
    Detroit,  MI Entire Metropolitan Area Loss
    Hartford, CT 99.2% 92.7% 67.2% 0
    Houston, TX 99.2% 99.5% 98.0% 0
    Indianapolis. IN 102.1% 112.1% 89.6% 8
    Jacksonville, FL 100.2% 106.3% 85.3% 8
    Kansas City, MO-KS 99.5% 109.0% 113.3% 12
    Las Vegas, NV 101.4% 98.0% 63.6% 4
    Los Angeles, CA 97.3% 102.2% 97.6% 8
    Louisville, KY-IN 102.5% 108.5% 90.9% 8
    Memphis, TN-MS-AR 101.2% 118.5% 143.5% 16
    Miami, FL 99.4% 93.0% 91.3% 0
    Milwaukee,WI 95.9% 109.0% 107.5% 11
    Minneapolis-St. Paul, MN-WI 97.4% 99.2% 100.1% 7
    Nashville, TN 100.0% 101.4% 92.4% 7
    New Orleans. LA Entire Metropolitan Area Loss
    New York, NY-NJ-PA 93.5% 81.7% 68.9% 0
    Oklahoma City, OK 100.1% 96.8% 83.5% 2
    Orlando, FL 99.7% 99.4% 84.2% 0
    Philadelphia, PA-NJ-DE-MD 92.6% 98.8% 96.3% 7
    Phoenix, AZ 100.7% 101.8% 93.6% 6
    Pittsburgh, PA Entire Metropolitan Area Loss
    Portland, OR-WA 95.0% 91.5% 62.7% 0
    Providence, RI-MA 96.2% 91.7% 70.1% 0
    Raleigh, NC 99.6% 93.0% 67.7% 0
    Richmond, VA 95.7% 91.7% 70.2% 0
    Riverside-San Bernardino, CA 99.5% 97.2% 85.8% 0
    Rochester, NY 146.9% 149.3% 82.5% 9
    Sacramento, CA 99.9% 94.4% 79.5% 0
    Salt Lake City, UT 98.9% 95.1% 84.1% 0
    San Antonio, TX 101.1% 102.5% 86.7% 7
    San Diego, CA 96.3% 94.1% 90.1% 0
    San Francisco-Oakland, CA 90.7% 87.6% 82.2% 0
    San Jose, CA 95.1% 79.1% 24.3% 0
    Seattle, WA 96.5% 91.9% 81.4% 0
    St. Louis,, MO-IL 94.8% 119.7% 148.9% 27
    Tampa-St. Petersburg, FL 98.6% 97.8% 83.7% 0
    Virginia Beach-Norfolk, VA-NC 93.1% 90.1% 82.3% 0
    Washington, DC-VA-MD-WV 97.5% 94.5% 87.9% 0
    Calculated from Census Bureau data
    *Except in Virginia Beach-Norfolk, Where Virginia Beach is used


    ——-

    Notes:

    Population Weighted Density: In its report, the Census Bureau uses "population-weighted density," rather than average population density to compare metropolitan areas. The Census Bureau justified this use as follows:

    "Overall densities of CBSAs can be heavily affected by the size of the geographic units for which they are calculated. Metropolitan and micropolitan statistical areas are delimited using counties as their basic building blocks, and counties vary greatly across the country in terms of their geographic size. With this in mind, one way of measuring actual residential density is to examine the ratio of population to land area at the scale of the census tract, which—of all the geographic units for which decennial census data are tabulated—is typi­cally the closest in scale to urban and subur­ban neighborhoods".

    The Census Bureau rightly points out the problem with comparing metropolitan area density. However, it is a problem of the federal government’s making, by virtue of using metropolitan area building blocks (counties) that are sometimes too large for designation of genuine metropolitan areas. These difficulties have been overcome by the national census authorities in Japan in Canada, for example, where smaller building blocks are used (such as municipalities or local government authorities).

    Further, the Census Bureau already has a means for measuring population density at the census tract level, which is "the closest in scale to urban and suburban neighborhoods." This is the urban area.

    "Population-weighted density" is an interesting concept that can provide an impression of the density that is perceived by the average resident of the metropolitan area. Unfortunately, in its report, the Census Bureau is less than precise with its terminology and repeatedly fails to modify the term density with the important "population-weighted" qualification. This could lead to considerable misunderstanding.

    The Census Bureau did not provide average population densities based for the mileage radii. Because of large bodies of water (such as Lake Michigan in Chicago can reduce land areas, it was not possible to estimate population densities by radius.

    Census Bureau Revision of Incorrect Report: We notified the Census Bureau of errors in its press release and report on September 27. The problems included substitution of San Francisco population data for Salt Lake City as well as metropolitan population in the supporting spreadsheet file. On September 28, the Census Bureau issued a revised press release and report to rectify the errors. Later the erroneous spreadsheet was withdrawn and had not been re-posted as of October 1. We have made corrections to the spreadsheet for this analysis.

    Note: Larger "Downtown" Populations in Smaller Metropolitan Areas: Because of the broad 2-mile radius measure used by the Census Bureau, most of the population increase characterized as relating to downtown occurred outside the major metropolitan areas. This is simply because in smaller metropolitan areas, such an area (12.6 square miles) will necessarily contain a larger share of the metropolitan area. Further, many smaller metropolitan areas are virtually all suburban and had experienced little or no core population losses over the decades that have been so devastating to many large core municipalities. On average, 2.7 percent of the population of major metropolitan areas was within a two-mile radius of city hall in 2010. By comparison, in smaller metropolitan areas, approximately 12.7 percent of the population was within a two mile radius.

    Photograph: Chicago Suburbs: (where nearly all the growth occurred), by author

  • Is California the New Detroit?

    Most Californians live within miles of its majestic coastline – for good reason. The California coastline is blessed with arguably the most desirable climate on Earth, magnificent beaches, a backdrop of snow-capped mountains, and natural harbors in San Diego and San Francisco. The Golden State was aptly named. Its Gold Rush of 1849 was followed a century later by massive post-war growth.

    There is no mystery why California’s population and economy boomed after the Second World War. Education in California became the envy of the world. California’s public school system led the nation in innovation with brand new schools and classrooms. The Community College system that fed its universities was free for its students. A college education at the UC and Cal State systems was inexpensive. UC-Berkeley, with its graduate schools, was arguably the greatest in the world while Stanford developed into the Harvard of the West. An efficient highway system moved California’s automobile driven commerce while fertile soil of the Central Valley became the fruit and vegetable basket of the world.

    The next wave hit in the 80s as former orchards south of San Francisco morphed into the Silicon Valley. Intel and other chip manufacturers led the computer and software revolution bringing high tech jobs and immense new wealth to the Golden State. The dot-com revolution of the 90s brought more gold to California. Innovators like Google and Apple cashed in by nurturing the Internet era. The next decade heralded the greatest housing and mortgage boom in the nation’s history. Developers from Orange County, south of Los Angeles, invented creative financing vehicles that drove home sales, and profits, to record heights by 2006.  
     
    This success has created a problem: Californians, due to their golden history, live unreflective lives. The Tea Party movement generated a political tsunami that swept more than 60 incumbents from political office in 2010, but the wave petered out at California’s state line as Democrats take every elected office in the state.

    The state budget, mandated to balance by law, has been billions in the red for ten straight years. Yet Californians re-elect the same politicians, year after year, who produce budgets with multi-billion dollar deficits. California voters rejected Meg Whitman, the billionaire founder of Ebay, in favor of Jerry Brown. California now has a $16 billion deficit which “assumes” that California voters will pass massive tax increases on themselves. If they do not, the 2013 deficit becomes a mind numbing $20 billion. Yet despite the red ink, Governor Brown signed into law a “high speed rail” bill that will spend $6 billion on a train between Fresno and Bakersfield – not LA and San Francisco as promised. Polls turned against the choo-choo, but there remain no outcry from California voters.

    California voters rejected Carly Fiorina, who ran Hewlett Packard, for Barbara Boxer in the 2010 Senate race. To protect the endangered Delta Smelt, a fish known better as bait, water has been diverted from Central Valley farms to the Pacific Ocean. Orchards in the Central Valley were allowed to wither and die resulting in unemployment in the Central Valley as high as 40%. Imagine Californians on food stamps, living in what was the fruit basket of American.  

    California’s business climate now ranks dead last according to 650 CEOs measured by Chief Executive Magazine. Apple will take 3,600 jobs to its new $280,000,000 facility in Austin Texas – jobs that California would have had in the past. Texas ranked first in the same survey. California’s unemployment rate is consistently higher than 10% of its work force, and there are few jobs for college students who graduate with as much as $100,000 in student loans. Despite overwhelming evidence that bad public policy is chasing away jobs, the same state politicians are sent back to Sacramento every two years.

    California’s public education system, once the envy of the world, now ranks 46th in the nation in per pupil spending and faces a $1.4 billion cut in the fall. In the last month, three California cities declared bankruptcy. More will follow. Take Poway for example. Its school board borrowed $100,000,000 (for 33,000 students) through a Capital Appreciation Bond. The politicians told the voters there would be no payments for 20 years. What they did not explain was the residents must pay back $1 billion dollars on their $100 million loan. Beginning in 2021, tiny Poway will be forced to pay $50 million per year in bond payments. Huge property tax assessments will be required if homes do not appreciate 400% by then, which is unlikely under foreseeable circumstances.   

    Rather than stare at themselves in the mirror, Californians should take a look at Michigan. In the 50s greater Detroit was the fourth-largest city in America with 2 million inhabitants and the world’s most dominant industry: the automobile.

    Most people had a good paying job. Its burgeoning middle class was the model of the world with excellent public schools and universities. Detroit in 2012 is a shadow of that once great metropolis. Its population has shrunk to 714,000. The average price of a home has fallen to $5,700. Unemployment stands at 28.9%. It has a $300,000,000 deficit. There are 200,000 abandoned buildings in the derelict city. Its public education system, in receivership, is a disgrace producing more inmates than graduates. In 2006, the teacher’s union forced the politicians to reject a $200,000,000 offer from a Detroit philanthropist to build 15 new charter schools. Jobs long ago abandoned Detroit for places like South Carolina and Alabama, with their “right to work” laws and low taxes.

    Now Detroit’s Mayor has proposed razing 40 square miles of the 138 square miles of this once great American city returning 70,000 abandoned homes to farmland. Even such a draconian plan may not be enough to save the city. If a hurricane had hit Detroit, more of us would know of this tragedy in our midst, but this fate was man-made and not wrought by nature. Detroit has had one party rule for more than fifty years. Louis C. Miriani served from September 12, 1957 to January 2, 1962 as Detroit’s last Republican mayor. Since that time the Democrats have ruled the Motor City.  John Dingell has served region since 1956. His father was the Congressman from 1930 to 1956. Despite the disastrous decline of their city, Detroit voters send him back to Congress twenty-two times.

    Like Detroit, California now has one party rule. The Democrats of California did not need a single Republican vote to pass their budget. Governor Brown’s plan is to address the nation’s largest deficit by raising taxes instead of cutting spending. If passed, the deficit would drop from $20 billion to a mere $16 billion. The budget does nothing to cure the systemic problems of a bloated bureaucracy. It does not eliminate one of California’s 519 state agencies.  

    Caltrans stopped building highways under Brown’s first term, but the people kept coming. Now 37 million Californians are locked in traffic jams each day. Brown was rewarded for such prescience with re-election as Governor. California’s egotistical politicians passed the Global Warming Solutions Act in 2006 (AB32) to “solve” climate change. Dan Sperling, an appointee to the California Air Resources Board (CARB) and a professor of engineering and environmental science at UC Davis, is the lead advocate on the board for a “low carbon fuel standard.” The powerful state agency charged with implementing AB 32 and other climate control measures, claims the low carbon fuel standard will “only” raise gasoline prices $.30 gallon in 2013. The California Political Review reported implementation of these the policies will raise prices by $1.00 per gallon.

    Detroit was once the most prosperous manufacturing city in the world, a title later secured by California.    Will California follow Detroit down a tragic path to ruin? In 1950, no one could imagine the Detroit of 2010. In 1970, when foreign imports started to make a foothold, the unions and their bought and paid for politicians resisted any change. In the 1990s as manufacturers fled to Alabama and South Carolina, the unions and their political minions held firm, even as good jobs slipped away. No one in Detroit envisioned their future.

    Today, California is following Michigan’s path with exploding pension obligations, a declining tax base, and disastrous leadership. Housing prices have fallen 30 to 60% across the state, evaporating trillions of dollars of equity and wealth. Unemployment remains stubbornly high and under-employment is rife. Do our politicians need any more signs?

    Governor Brown’s budget will first slash money to schools and raise tuition on its students while leaving all 519 state agencies intact. He apparently will protect political patronage at all costs. Jobs, and job creators, are fleeing the state. Intel, Apple, and Google are expanding out of the state. The best and brightest minds are leaving for Texas and North Carolina. The signs are everywhere. Meanwhile, the voters send the same cast of misfits back to Sacramento each year – just as Detroit did before them.

    The beaches are still beautiful. The mountains are still snow capped and the climate is still the envy of the world. Detroit never had that. But will California’s physical attributes be enough? If the people of California want to glimpse their future, they need look no farther than once proud City of Detroit and the once wealthy state of Michigan.

    It can happen here.

    Robert J Cristiano PhD is the Real Estate Professional in Residence at Chapman University in Orange, CA, a Senior Fellow at the Pacific Research Institute in San Francisco, CA and President of the international investment firm, L88 Companies LLC in Denver – Newport Beach – Washington DC – Prague. He has been a successful real estate developer for more than thirty years.

  • The Uncertain Future of the California Bullet Train

    On July 18, at a site pregnant with symbolism — the future location of what HSR advocates hope will become San Francisco’s terminus of the state’s bullet train — California Gov. Jerry Brown signed a bill to fund construction of the first section of the high-speed line. Earlier in the day, Brown had traveled for a similar ceremony to Los Angeles, the other "bookend" of the project. The bill signing ceremonies followed the state Senate’s approval (by a single vote) earlier in the month of nearly $8 billion in state and federal money to build the initial section of the line in the Central Valley and to make  a series of  transportation infrastructure improvements in the LA and Bay Area. 

    According to sources at the California High Speed Rail Authority (CHSRA), the total infrastructure commitment now involves:

    *  $6 billion for construction of the first section of the high-speed line in the Central Valley ($2.7B of state HSR bonds and $3.3B of federal ARRA funds);

    *  $1.2 billion for electrification of Caltrain, the commuter rail line in the SF Peninsula (half from state HSR bonds and half from local funds);

    *  $1 billion for San Francisco’s Central Subway (of which $61M is in HSR "connectivity" funds and $930M in federal New Starts money);

    *  $1.5 billion in other connectivity improvements (BART car replacements, LA Metrolink upgrades, LA regional connector, grade separation improvements) funded by the remaining "connectivity" funds, which must be matched ; and

    *  $1 billion in other SoCal projects ($500M from state HSR funds which must be matched).

    As can be seen from the above summary, almost half the funding is for upgrades to conventional transit/commuter rail services in LA and the Bay Area. Much to the chagrin of high-speed purists, the project has morphed into a statewide transportation program much of which is totally unrelated to the high-speed rail initiative approved by the voters in Proposition 1A.

    Whether this shift in emphasis represents "a giant fraud perpetrated on the voters who passed Proposition 1A and voted for a true HSR system;" or whether this is a "victory for common sense, a decision that wisely places greater value on satisfying present-day needs than on promises and conjectures of distant-in-time benefits" depends on one’s point of view (both are direct quotes from our interviews.) While bullet train visionaries will view the "bookends" strategy as a betrayal of the original Prop 1A pledge, pragmatists will hail it as a prudent and realistic move to gain political support and a  hedge against  the uncertainties facing the high speed rail project. Just what obstacles confront the project in the months ahead can be gleaned from the discussion below.

    Obstacles and Uncertainties

    Despite the celebratory and self-congratulatory tone of the Governor’s speech, the project faces a number of impediments that could delay it for years if not put an end to it altogether. As a headline in a Wall Street Journal article put it, "For Now, the Bullet Train May Go Nowhere." (WSJ, July 8, 2012). The hurdles the project must overcome include:

    *   A major lawsuit asserting that the Central Valley line project as proposed and approved by the Legislature does not comply with various provisions of the enabling Proposition 1A. According to the plaintiffs, the deficiencies include:(1) no electrification, (2) lack of a "useable segment" (the 130 mile section in the Central Valley by itself is claimed not to satisfy the requirements of an operable segment); (3) lack of adequate committed funding; (4) trip times above the promised 2 hrs 40 min; (5) the need for an operating subsidy; (6) inability to meet the Federal requirement to complete project by September 2017; and (7) inability to meet the promise of a "one-seat ride" from LA to SF (the "blended" approach would require at least one transfer). (John Tos, Aaron Fukuda and County of Kings v. California High Speed Rail Authority). The suit is moving toward trial sometime in 2013.

    *   A lawsuit filed by the Madera County and the Madera and Merced County Farm Bureaus asking for a preliminary injunction to block rail construction in the Central Valley, slated to begin later this year. The suit asserts that the rail line would disrupt 1500 acres of fertile land by cutting off irrigation canals. Officials of the two bureaus say more than 500 farmers whose land lies in the path of the rail line plan to fight any attempts by the state to seize their properties by eminent domain. "It’s going to be a long battle for the Rail Authority," said executive director of the Merced County Farm Bureau. "There is going to be opposition every step of the way."

    *   Several lawsuits challenging the Program level EIR for the Bay-Area-to-Central-Valley section of the statewide project. A victory by the challengers of the Program EIR would "undo" the project level EIRs for the Central Valley construction project, according to Gary A Patton, an attorney who has been involved in the litigation.

    *   Several environmental lawsuits charging the HSR project with violations of the state environmental law (CEQUA) and the Endangered Species Act. The Governor, under pressure from environmentalists, has recently withdrawn his threat  to waive CEQUA requirements.

    *   The possibility of a legal challenge that Proposition 1A money is being used "unlawfully," i.e. for non-HSR projects, in the "bookend" areas.

    Any of the above actions could delay the issuance of the bonds and/or land acquisition, potentially delaying the start of construction and threatening the Authority’s ability to complete the Central Valley section by the federally imposed deadline of September 2017.

    When asked about the potential impact of litigation on the Authority’s schedule, Chairman Dan Richard observed that "simply filing a lawsuit does not means they will win, nor if they do win does it automatically mean injunctive relief." In other words, the litigation may or may not delay construction in the Central Valley. It’s California, so there will always be lawsuits," Richard added with a chuckle.

    The "Bookends" Approach 

    Chairman Richard’s approach is two-pronged. While supportive of the distant vision of linking the Southern and Northern portions of the state with a high-speed rail line, he sees a need to show signs of near-term service improvements in order to gain crucial political support of skeptical local officials and the public. The dollars spent on the "bookends" could have "an immediate and dramatic effect" he told us.

    Improving the metropolitan "bookends" of the system will make it possible to increase the speed of local commuter trains and thus bring immediate travel benefits to large segments of California’s urban population. Will Kempton, chief executive of the Orange County Transportation Authority (OCTA) and chairman of the Independent Peer Review Group advising the High Speed rail Authority agrees. It will be a good investment whether or not the overall $68 billion high-speed rail project ever gets completed, he said. Sensing a promise of new money, planning and transportation agencies in Southern California and the Bay Area have thrown their support to the Authority’s "bookend" strategy.

    The Long-Term Strategy

    As for implementing the high-speed rail project itself, Richard is convinced that its various pieces will eventually fall into place, one step at a time. "What we’re doing is building a high-speed rail line," he told us, "that will connect to the existing tracks and allow passenger-only service between the town of Madera (north of Fresno) and Bakersfield. It will cut significant time off the trip from Oakland/Sacramento to Bakersfield.. At the same time we will be upgrading Metrolink from LA/Union Station up to Palmdale and we have our sight set on the next phase, which is Bakersfield to Palmdale. Once that gap is closed, we’ll have an intercity rail line from LA to northern California, albeit one with a couple of transfers, but we think that is when private sector investment will come in and help upgrade the entire line to full high speed rail. Even our critics agree that if we get to Palmdale, everything changes. We’re not that far away, in terms of either miles or dollars. … Richard summed up, "We took great pains to make sure the investment is not stranded. The point is that we have an effective beachhead for a true advanced passenger rail system."

    Exactly how does the Authority propose to fund the $8-11B cost to close the gap from Bakersfield and the Central Valley to Palmdale and down to LA (assuming the project does not go over budget)? Richard remains serene and confident. "We will have about $4 billion of our bonds left," he said." They must be matched. We will be looking for federal funding, to be sure, arguing that this can help free up freight capacity, assist goods movement through the Central Valley and enhance the efficiency of ports. … We will also be pushing hard to look at other private sources…If all of that fails, we have the prospect of state cap-and-trade revenues."

    These are heroic assumptions. Future federal support is highly uncertain. Congress, by eliminating Title V of the Senate transportation bill (the National Rail System Preservation, Expansion and development Act of 2012) from the final version of the surface transportation reauthorization (MAP-21) and by denying Administration requests for high-speed rail funds three years in a row, could not have sent a clearer message that states should not count on continued congressional funding of high speed rail, Transportation Secretary Ray LaHood’s bluster notwithstanding ("We will not be dissuaded by the naysayers in Congress…High speed rail is alive and well in America…The Administration is keeping high-speed rail on track…") "The President’s high-speed rail program is "a vision disconnected from reality," members of the Democratic-controlled Senate Budget Committee lectured Secretary LaHood at a recent hearing.

    Private sector funding is equally problematic. "We see no evidence that private investors are taking serious interest in this project at this time," a financial consultant knowledgeable in public-private partnerships told us. As for cap-and-trade revenues, their use to bail out HSR is expected to meet with opposition from the state legislature, according to several sources.

    For the backers of high speed rail, the implications are grave. Absent further federal funds and absent private capital, the State will be obliged to seek a fresh infusion of public money as early as 2014 if it is to continue pursuing its $68 billion train project. Will California voters be willing to approve new bonds for this venture, given recent surveys indicating dwindling popular support? Can the Governor and the Authority keep the faith alive by dangling a vision of a bullet train that few voters (and politicians) can hope to see deployed in their lifetime? There is reason to be skeptical.

    Ken Orski has worked professionally in the field of transportation for over 30 years.

    CA route map by Wikipedia user CountZ.

  • High Speed Rail Advocates Discredit Their Cause – Again

    Is there any high speed rail boondoggle big enough to make rail transport advocates reject it?  Sadly, for all too many of them, the answer is No, as two recent developments make clear.

    The first is in California, where the state continues to press forward on a high speed rail plan for the state that could cost anywhere from $68 billion to $100 billion. Voters had previously approved $10 billion in bonds for the project, but as the state’s economy and finances have continued to sour – including multiple major cities going bankrupt – the polls have turned against it, and with good reason. The state faces the prospect of already enacted education cutbacks if Gov. Jerry Brown’s tax increase proposal in not approved in a vote this fall.  Other painful service cuts loom. Voters are rightly asking themselves if now is the time to be borrowing public money for very expensive, speculative infrastructure. 

    Equally, many of the much cited overseas examples of high-speed rail seem, well, to be off the tracks.    China’s rail system has serious safety problems, for example. And developing the most extensive high speed rail system in Europe hasn’t stopped Spain from seeing 50% youth unemployment, a 3 percentage point increase in the VAT tax, and a humiliating bailout from the rest of the EU.

    Nevertheless, the California assembly recently voted to go full speed head on its high speed rail plans. As part of an overall $8 billion rail spending package, the state is borrowing $2.6 billion to complement $3.2 billion in federal funds left over from the stimulus (shovel ready???) to build a starter segment of the line linking Bakersfield and Madera through the Central Valley. This is the easiest segment on which to build – though legal action is likely to delay construction – but doesn’t do anything to link the state’s huge population centers around LA and the Bay Area. With no more significant federal funds likely to be forthcoming, and the state’s finances a wreck, this segment risks becoming an embarrassing white elephant, or, as critics call it, “a train to nowhere”.

    After this vote it came to light that respected French high speed rail operator SNCF had approached California officials, private funding in hand, with a preliminary offer to build the LA-SF link themselves on a better and cheaper alignment along I-5 that would cost only $38 billion. But this was rejected by the state. The Times account suggests this rejection came about due to a combination of a political preference for the inefficient Central Valley segment and the clout of Parsons Brinckerhoff, the lead contractor.  Some commentators have referred to this revelation as a “bombshell.”

    Despite management misstep after management deception, rail advocates around the country cheered California’s decision to build the Central Valley segment. Jerry Brown, with not much to show for his reprise as Governor, is excited of course. Secretary of Transportation Ray LaHood called it a “big win.”  America 2050 (an offshoot of the Regional Plan Association of New York), “commended” the state for “taking a big step forward.”  Streetsblog called it a “major victory.”  While I respect what these organizations do in other contexts, this high speed rail vote is not a major victory, but a major defeat for common sense.

    But apparently not willing to let California take the prize in the rail boondoggle category without a fight, Amtrak shortly thereafter issued a “vision” for rail in the Northeast Corridor that would provide faster service between Boston and Washington, DC – at a cost of $151 billion. Strange as it sounds, some commentators actually lauded Amtrak for reducing costs since the previous plan was $169 billion.  The Brookings Institution was measured in its reaction to the plan, but managed to describe it as “more rational.”   With Republicans seemingly safely in charge of the House for now, and large federal deficits projected for the mid-term future, $151 billion for Amtrak seems purest fantasy.

    These developments are unfortunate because high speed rail could play an important role in US transportation, particularly in the Northeast. But that’s unlikely to happen because of the indiscriminate way establishment advocates have supported anything with the “high speed rail” label attached, ranging from $2 billion, 110 MPH peak speed Toonerville Trolleys in Illinois that barely beat Megabus in terms of journey time to the California rail boondoggle, regardless of merit. All they know that if it claims to be high speed rail, they are in favor of it.

    There are other people who take a more serious view. Unfortunately, they tend to be outsiders with little influence.  For example, Alon Levy suggested a set of near term, incremental Northeast Corridor improvements that might cost 90% less than Amtrak’s plan.

    $8 billion in stimulus dollars have gone to purchase us nothing of any real significance in terms of rail infrastructure. That money, invested wisely in high priority projects in the Northeast Corridor, could have made a big difference and started building a real demonstrated case for high speed rail investment in America. Unfortunately, the way high speed rail has been botched by its advocates, all the money we’ve spent on it has accomplished just the opposite. If California’s Central Valley segment is built and the complete line is never finished, it will likely discredit high speed rail in America for the long term.

    Aaron M. Renn is an independent writer on urban affairs and the founder of Telestrian, a data analysis and mapping tool.

    CA route map by Wikipedia user CountZ.

  • The Cities Where A Paycheck Stretches The Furthest

    When we think of places with high salaries, big metro areas like New York, Los Angeles or San Francisco are usually the first to spring to mind. Or cities with the biggest concentrations of educated workers, such as Boston.

    But wages are just one part of the equation — high prices in those East and West Coast cities mean the fat paychecks aren’t necessarily getting the locals ahead. When cost of living is factored in, most of the places that boast the highest effective pay turn out to be in the less celebrated and less expensive middle part of the country. My colleague Mark Schill of Praxis Strategy Group and I looked at the average annual wages in the nation’s 51 largest metropolitan statistical areas and adjusted incomes by the cost of living. The results were surprising and revealing.

    In first place is Houston, where the average annual wage in 2011 was $59,838, eighth highest in the nation. What puts Houston at the top of the list is the region’s relatively low cost of living, which includes such things as consumer prices and services, utilities and transportation costs and, most importantly, housing prices: The ratio of the median home price to median annual household income in Houston is only 2.9, remarkably low for such a dynamic urban region; in San Francisco a house goes for 6.7 times the median local household income. Adjusted for cost of living, the average Houston wage of $59,838 is worth $66,933, tops in the nation.

    Most of the rest of the top 10 are relatively buoyant economies with relatively low costs of living. These include Dallas-Fort Worth (fifth), Charlotte, N.C. (sixth), Cincinnati (seventh), Austin, Texas (eighth), and Columbus, Ohio (10th). These areas all also have housing affordability rates below 3.0 except for Austin, which clocks in at 3.5. Similar  situations down the list include such mid-sized cities as  Nashville, (11th), St.Louis (12th), Pittsburgh, (13th), Denver (15th) and New Orleans (16th).

    One major surprise is the metro area in third place: Detroit-Warren-Livonia, Mich. This can be explained by the relatively high wages paid in the resurgent auto industry and, as we have reported earlier, a huge surge in well-paying STEM (science, technology, engineering and math-related) jobs. Combine this with some of the most affordable housing in the nation and sizable reductions in unemployment — down 5% in Michigan over the past two years, the largest such drop in the nation. This longtime sad sack region has reason to feel hopeful.

    Only two expensive metro areas made our top 10 list. One is Silicon Valley (San Jose-Sunnyvale-Santa Clara), where the average annual wage last year of $92,556, the highest in the nation, makes up for its high costs, which includes the worst housing affordability among the 51 metro areas we considered: housing prices are nearly 7 times the local median income. Adjusted for cost of living, that $92,556 paycheck is worth $61,581, placing the Valley second on our list.

    In ninth place is Seattle, which placed first on our lists of the cities leading the way in manufacturing and STEM employment growth. Housing costs, while high, are far less than in most coastal California or northeast metropolitan areas.

    What about the places we usually associate with high wages and success? The high pay is offset by exceedingly high costs. Brain-rich Boston has the fifth-highest income of America’s largest metro areas but its high housing and other costs drive it down to 32nd on our list. San Francisco ranks third in average pay at just under $70,000, some $20,000 below San Jose, but has equally high costs. As a result, the metro area ranks a meager 39th on our list.

    Much the same can be said about New York which, like San Francisco, is home to many of the richest Americans and best-paying jobs. The average paycheck clocks in at $69,029, fourth-highest in the country, but high costs, particularly for housing, eat up much of the locals’ pay: adjusted for cost of living, the average salary is worth $44,605. As a result, the Big Apple and its environs rank only 41st on our list.

    Long associated with glitz and glitter, Los Angeles does particularly poorly, coming in 46th on our list. The L.A. metro area may include Beverly Hills, Hollywood and Malibu, but it also is home to South-Central Los Angeles, East L.A. and small, struggling industrial cities surrounding downtown. The relatively modest average paycheck of $55,000 annually, 12th on our list, is eaten up by a cost of living that is well above the national average. This creates an unpleasant reality for many non-celebrity Angelenos.

    Many of the metro areas that rank highly on our list have enjoyed rapid population growth and strong domestic in-migration. Houston, Dallas-Fort Worth, and Austin all have been among the leaders the nation in both domestic migration and overall growth both in the last decade and so far in this one. In the past year, for example, Dallas led the nation with 40,000 net migrants while Austin’s population growth, 4 percent, was the highest rate among the large metropolitan areas.

    In contrast, many of the cities toward the bottom of our list — notably the Los Angeles and New York areas — have led the country in domestic outmigration. Between 2000 and 2009, the nation’s cultural capitals lost a total of over 3 million people to other parts of the country. Although migration has slowed in the recession, the pattern has continued since 2010.

    And how about the future? Income and salary growth has been so tepid recently that few large cities can claim to have made big gains over the past five years; there has been continued volatility as some regions that did worst in the past decade — for example San Francisco — pick up steam. Unfortunately any growth in such highly regulated areas also tends to increase costs rapidly, particularly for housing. In California, this is made much worse by both soaring taxes and a regulatory regime that drives up costs faster than income games.

    Similarly these high prices seem to have the effect of driving out middle-class workers; places like New York, Los Angeles and San Francisco have extraordinary concentrations of both rich and poor workers but fewer in the middle. As we pointed out in our annual job and STEM rankings, many technology, manufacturing and business service jobs are heading not to the hotspots but more to the central part of the country.

    Over time, it seems clear that, for the most part, the best prospects for the future lie in places that both experience income and employment gains but remain relatively affordable. These include some cities that didn’t crack the top 10 of our list but appear to be gaining ground, such as Nashville, Pittsburgh, St. Louis, San Antonio and New Orleans, a once beleaguered city that has experienced the nation’s fastest per capita personal income growth since 2005.

    Maintaining affordability and a wide range of high-paying jobs many not be as glamorous a metric for success as the number of hip web startups or the concentration of educated people. But over time it is likely to be about as good a guide to future prospects as we have.

    Joel Kotkin is executive editor of NewGeography.com and is a distinguished presidential fellow in urban futures at Chapman University, and contributing editor to the City Journal in New York. He is author of The City: A Global History. His newest book is The Next Hundred Million: America in 2050, released in February, 2010.

    This piece originally appeared in Forbes.

    Houston photo by BigStockPhoto.com.


    Note: The table below was updated with 2012 data, so it may not match the narrative above discussing 2011 data. Contact Mark Schill at mark@praxissg.com.

    Metropolitan Pay per Job 2012 – Adjusted for Cost of Living
    MSA Name 2012 Avg. Annual Wage Unadj. Rank 2012 Adj Annual Wage Adj. Rank Rank Change
    Houston-Sugar Land-Baytown, TX $67,279 7 $75,256 1 6
    San Jose-Sunnyvale-Santa Clara, CA $107,515 1 $71,534 2 (1)
    Detroit-Warren-Livonia, MI $60,503 16 $64,571 3 13
    Dallas-Fort Worth-Arlington, TX $60,478 17 $62,867 4 13
    Austin-Round Rock-San Marcos, TX $58,103 19 $62,679 5 14
    Memphis, TN-MS-AR $53,069 36 $61,780 6 30
    Charlotte-Gastonia-Rock Hill, NC-SC $57,506 20 $61,636 7 13
    Atlanta-Sandy Springs-Marietta, GA $58,836 18 $60,844 8 10
    Seattle-Tacoma-Bellevue, WA $67,225 8 $60,237 9 (1)
    Cincinnati-Middletown, OH-KY-IN $54,683 26 $59,828 10 16
    Nashville-Davidson–Murfreesboro–Franklin, TN $53,928 30 $59,787 11 19
    Birmingham-Hoover, AL $52,773 37 $59,563 12 25
    St. Louis, MO-IL $54,112 29 $59,398 13 16
    Columbus, OH $53,634 33 $59,395 14 19
    Denver-Aurora-Broomfield, CO $62,021 11 $59,068 15 (4)
    Washington-Arlington-Alexandria, DC-VA-MD-WV $79,852 2 $58,672 16 (14)
    Chicago-Joliet-Naperville, IL-IN-WI $62,746 10 $58,477 17 (7)
    Pittsburgh, PA $55,004 24 $58,021 18 6
    New Orleans-Metairie-Kenner, LA $54,636 27 $57,151 19 8
    Salt Lake City, UT $53,901 31 $56,978 20 11
    Raleigh-Cary, NC $53,243 34 $56,762 21 13
    Milwaukee-Waukesha-West Allis, WI $55,434 22 $55,825 22 0
    Phoenix-Mesa-Glendale, AZ $53,835 32 $55,788 23 9
    Minneapolis-St. Paul-Bloomington, MN-WI $61,515 14 $55,645 24 (10)
    Oklahoma City, OK $50,641 42 $55,345 25 17
    Jacksonville, FL $51,763 40 $55,126 26 14
    Richmond, VA $55,065 23 $55,010 27 (4)
    Tampa-St. Petersburg-Clearwater, FL $50,462 43 $54,969 28 15
    Louisville/Jefferson County, KY-IN $50,385 44 $54,945 29 15
    Hartford-West Hartford-East Hartford, CT $67,826 6 $54,787 30 (24)
    Kansas City, MO-KS $54,378 28 $54,706 31 (3)
    Philadelphia-Camden-Wilmington, PA-NJ-DE-MD $63,615 9 $54,372 32 (23)
    Cleveland-Elyria-Mentor, OH $54,701 25 $53,946 33 (8)
    Boston-Cambridge-Quincy, MA-NH $73,267 5 $53,363 34 (29)
    San Francisco-Oakland-Fremont, CA $79,137 3 $52,988 35 (32)
    San Antonio-New Braunfels, TX $49,219 47 $52,867 36 11
    Rochester, NY $51,798 39 $52,533 37 2
    Baltimore-Towson, MD $61,542 13 $51,759 38 (25)
    Buffalo-Niagara Falls, NY $50,013 46 $50,723 39 7
    Las Vegas-Paradise, NV $50,378 45 $50,328 40 5
    New York-Northern New Jersey-Long Island, NY-NJ-PA $77,640 4 $50,169 41 (37)
    Portland-Vancouver-Hillsboro, OR-WA $56,134 21 $49,414 42 (21)
    Virginia Beach-Norfolk-Newport News, VA-NC $51,693 41 $49,091 43 (2)
    Miami-Fort Lauderdale-Pompano Beach, FL $52,357 38 $48,012 44 (6)
    Orlando-Kissimmee-Sanford, FL $46,481 48 $47,771 45 3
    San Diego-Carlsbad-San Marcos, CA $61,149 15 $46,822 46 (31)
    Los Angeles-Long Beach-Santa Ana, CA $61,634 12 $46,411 47 (35)
    Providence-New Bedford-Fall River, RI-MA $53,071 35 $42,254 48 (13)
    Riverside-San Bernardino-Ontario, CA $46,084 49 $41,000 49 0
    Indianapolis-Carmel, IN $53,839 No data
    Sacramento–Arden-Arcade–Roseville, CA $59,200 No data
    2012 wage data: EMSI Class of Worker, 2012.3
    Cost of living data: C2ER