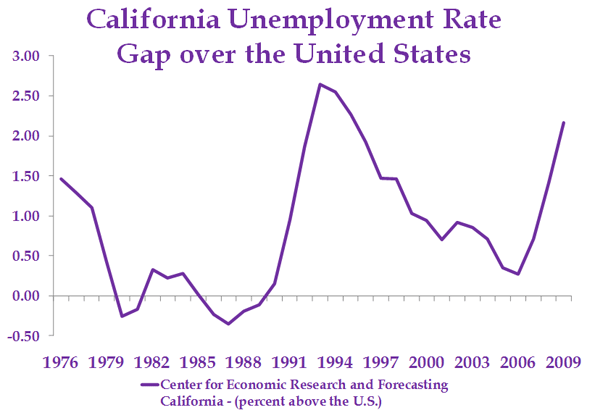
On March 25th, the Bureau of Labor statistics released a report that showed that California jobs had increased by 96,000 in February. The state’s cheerleaders jumped into action. Never mind that the state still has a 12.2 percent unemployment rate, and part of the decline from 12.4 percent is because just under 32,000 discouraged workers left California’s labor force in February.
Unfortunately, the cheerleaders are likely to once again be disappointed. It is unwise to build a case on one data point. Data are volatile and subject to all sorts of technical issues. For example, the estimate of California’s job growth is seasonally adjusted data and subject to revision.
More importantly, even if California did see 96,000 new jobs in February, that pace is unlikely to be maintained. California’s economy is just too burdened by the State’s DURT: Delay, Uncertainty, Regulation, and Taxes. Instead of enjoying the truly vibrant recovery one would expect given its climate, location, natural resources, university network, workforce, and natural and manmade amenities, California’s economy will grow far below its potential, burdened by its DURT.
People often ask me to identify the most important impediment to California’s economic growth, but there isn’t just one. Every business is different. One may be most impacted by regulation, another by taxes. Instead, it is the total cost of the DURT.
Taxes are certainly one component of DURT. The Tax Foundation ranked California 49th in business taxes and Kiplinger ranks California worst in retiree’s taxes, which serves as a good proxy for individual tax burdens. No doubt, California’s taxes are high, but that alone wouldn’t be too big a problem. People happily pay to live in California. Higher taxes and home costs are just the beginning.
California is in its own class when it comes to regulation; nothing is unimaginable in a state where bulk of the executive leadership comes from the San Francisco-Oakland area. Today, there are two regulations that are particularly hurting California’s economy, AB32 and SB375. AB32 is California’s attempt to unilaterally solve the planet’s global warming problem. It will have serious implications, all of them detrimental to economic activity. SB375 attempts to advance its global warming goals through regional planning mandates. Here’s a sympathetic analysis of SB375 from a smart guy.
Those are just the most onerous regulations. California has thousands of regulations and more come daily. California had 725 new laws come into effect on January 1, 2011, and the state has over 500 constitutional amendments, averaging over four new constitutional amendments a year.
Which brings us to uncertainty.
Uncertainty about the future regulatory environment is detrimental to economic activity. It is extraordinarily difficult to plan when the regulatory environment is in such a state of flux, and nothing is unimaginable.
Regulatory uncertainty is far from California’s only source of uncertainty. California’s local governments are notoriously fickle, particularly in the generally affluent coastal areas. I know of one project that spent four years in planning, only to be denied by the City Council, even though the project was supported by the planning department. That’s just expensive. Developers spend hundreds of thousands of dollars on architects, engineers, and planning consultants while jumping through the hoops set up by the planning department, neighborhood groups, environmentalists, and other special interest groups.
This type of story is all too common in Coastal California. Some California communities, such as Santa Monica, require that prior to building a new house, you must use two by fours, string, and flags to provide the outline of the proposed structure for up to 90 days. This is to facilitate neighbor complaints before the project is built.
The previous story also relates to delay. Delay in California is legendary, a result of regulatory hurdles, demand for studies, and legal action. California newspapers often describe projects as controversial, but this is redundant. Every project is controversial in California.
Want to rebuild an aging bridge? Someone will sue you and claim the old bridge is a historical landmark. Want to put in a solar farm? Someone will sue you because the land is home to endangered rats, turtles, salamanders, toads, fairy shrimp, or something. Endangered species are everywhere in California. Want to put a condominium project in a depressed part of town? Someone will sue you because it doesn’t match the neighborhood. Want to build a house? Someone will sue you because it will block their view.
All these things and more happen in California. It’s no surprise that businesses find California a very challenging place to be profitable. California’s markets are huge. No doubt about it. So, some business will operate in the state. California’s location on the Pacific Rim and it ports also compel some business to be in California, even if costs are high. California is a fantastic place to live. So, people who can afford to will live here. Some business owners will locate businesses where the owner wants to live. But, most businesses are too competitive to give up profits to live in California. Many keep their headquarter s here while shipping their new jobs to other states, or abroad.
Even so, California is unlikely to become Detroit. It, sadly, is also unlikely to achieve its potential or regain its previous economic vigor. The cost of California DURT is just too high. Instead, the place will become increasingly divided. Coastal regions, for the foreseeable future, will become even more affluent, heavily white and increasingly Asian. Hosts of unseen, less fortunate people support them, often commuting from more hardscrabble interior locations.
Considerable poverty will coexist uncomfortably in California’s coastal paradise. Working class families already crowd into housing units designed for one family, and this will likely only get worse.
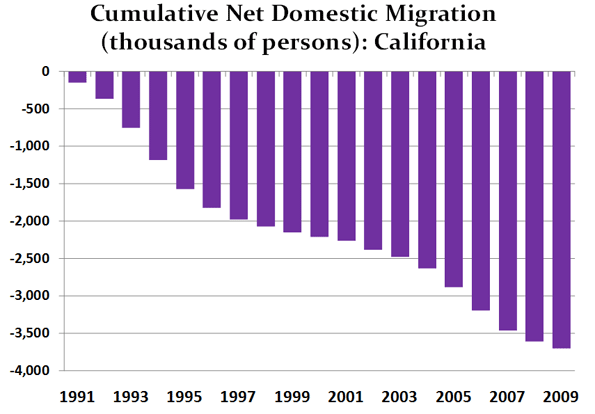
What Coastal California won’t have is much of a middle class. Lack of opportunity and high housing costs makes the most pleasant parts of California an unattractive place for people who define quality of life by opportunity and affordable housing, young families. Domestic migration is likely to continue to be negative.
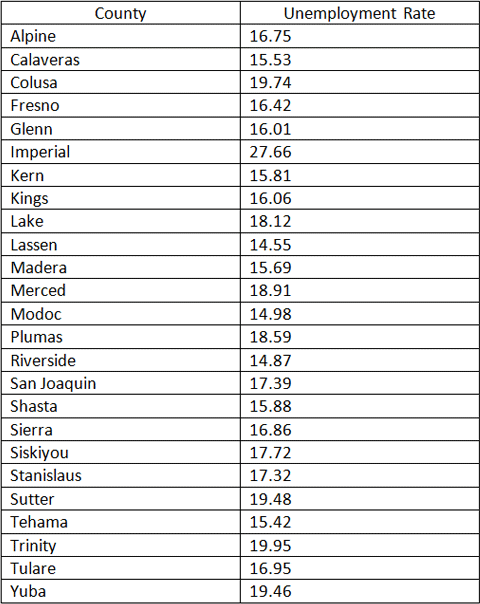
For its part, inland California is already depressed, 27 counties have unemployment rates over 15 percent. Eight have unemployment rates above 20 percent. Even during the boom, many of California’s inland areas had extraordinarily high unemployment rates. Central California’s poverty and blight will only get worse.
All this is courtesy of expensive California DURT. Because of it, California’s economy will lag. More importantly, California seems to be morphing into almost a Hollywood caricature. The self-absorbed hedonistic wealthy live side by side with the poor, like a combination of a Club Med and Leisure Village in a third-world country.
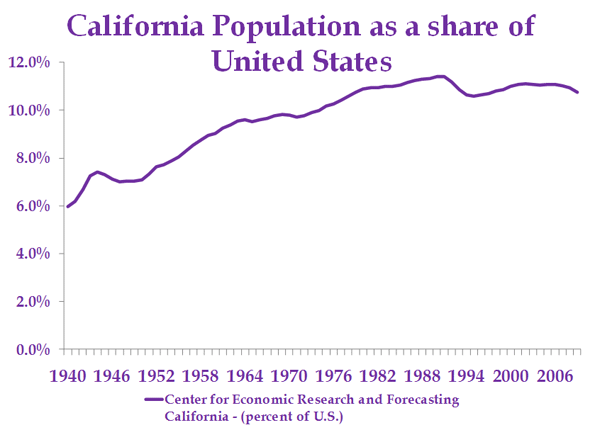
Bill Watkins is a professor at California Lutheran University and runs the Center for Economic Research and Forecasting, which can be found at clucerf.org.
Photo by chavez25