Tag: Seattle

  • The Heavy Price of Growth Management in Seattle

    The University of Washington Study: Economist Theo Eicher of the University of Washington has published research indicating that regulation has added $200,000 to house prices in Seattle between 1989 and 2006. Eicher told the Seattle Times that “Seattle is one of the most regulated cities and a city whose housing prices are profoundly influenced by regulations.”

    Not surprisingly, this caused consternation in the planning community, which would prefer to minimize or dismiss any negative consequences of planning regulations on housing affordability.

    The Washington Chapter of the American Planning Association (W-APA) published a response. Admitting that “land use regulations do add costs to housing”, it criticizes the Eicher study for focusing “solely on cost” and ignoring how land use regulations add to the quality of life. (Note 1). A recent Washington Policy Center report provides a detailed critique of the W-APA report. This article evaluates Seattle housing affordability trends using basic price and income data and the Median Multiple (median house price divided by median household income), a standard affordability measure that has been recommended by both the World Bank and the United Nations.

    How Growth Management Raises House Prices: It has been established that overly prescriptive land use regulation (called growth management or smart growth) raises house prices. As the former governor of the Reserve Bank of New Zealand Donald Brash has pointed out the affordability of housing is overwhelmingly a function of just one thing, the extent to which governments place artificial restrictions on the supply of residential land.

    However, the mere adoption of growth management or smart growth polices does not increase housing costs. Where, for example, an urban growth boundary (a favored strategy of growth management) is drawn far enough from the urban area, there may be little interference with developable land values. This was the case in Portland, for example, in its early growth management days. However, as land was developed and the urban growth boundary was not moved sufficiently outward in response, land became more scarce and land prices were driven up, leading to Portland’s severe housing unaffordability.

    How Growth Management Drives Up House Prices: Land prices are driven up as market participants perceive scarcity. When government policies constrict the supply of land, developers purchase “land banks” to ensure that they have access to land inventory. Without growth management, developers and builders can purchase land when they need it, because governments have not placed artificial restrictions on its supply.

    In the more prescriptive environment, property appraisals rise and sellers are able to obtain higher prices because development is prohibited on most land. In short, sellers face less competition and can command much higher prices.

    Sometimes growth management proponents claim that their communities have sufficient land available for building. However, the interplay between land buyers and sellers creates a rigged game that leads to higher land prices. This is obvious in everywhere from Seattle and Portland to California and Florida. In these markets, there is not a sufficient supply of “affordable land” for building. A New Zealand government’s “2025 Taskforce” found the price of comparable land to be about 10 times as high if it is inside an urban growth boundary rather than outside (essentially across the road).

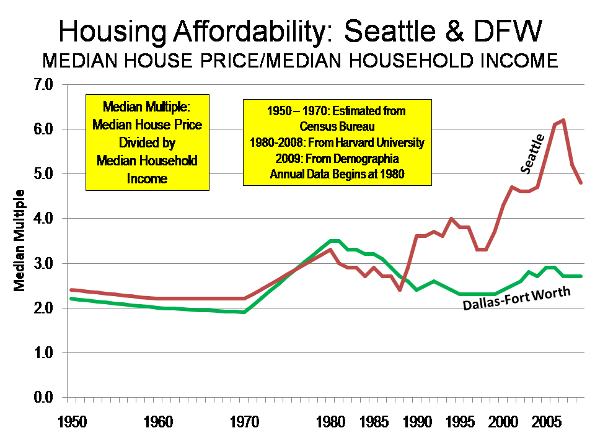
    Seattle’s Lost Housing Affordability Decade: During the decade of the housing bubble (1997 to 2007), the median house price increased from $169,000 to $395,000 in Seattle. In 1997, Seattle’s housing affordability was rated “moderately affordable,” with a Median Multiple of 3.3 (median house price divided by median household income). By 2007, the Median Multiple had escalated to 6.2, indicating housing unaffordability worse than any major metropolitan area between World War II and 1997. (Figure 1). Of course, other markets, particularly in California, became even more unaffordable after 1997.

    In Seattle and other more prescriptive markets, house prices exploded during the housing bubble. At the same time, many other markets experienced only modest house price increases. The easier money and profligate lending practices thus produced very different results. In more prescriptive markets, like Seattle, both underlying and speculative demand drove prices to unprecedented heights. In the more responsive markets, the generally higher underlying demand was accommodated by planning systems that permitted sufficient new housing to be built on affordable land and price escalation was far more modest (as were subsequent price losses).

    New House Example: The role of Seattle’s growth management in driving up land and house prices is obvious. According to W-APA, approximately 62% of the cost of a new house in 1999-2000 was in construction costs. A new house in 1997 costing the same as a median house price would have involved approximately $105,000 in construction costs. Based upon subsequent house cost increases and the decline in house construction costs relative to the rest of the nation in Seattle, construction costs on the same house should have risen $40,000 from 1997 to 2007 (Note 2). At the same time, the median house price in Seattle increased $225,000. Less ss than 20% of the cost escalation could be attributed to construction cost inflation. Nearly $185,000 was due to other factors, principally higher land prices.

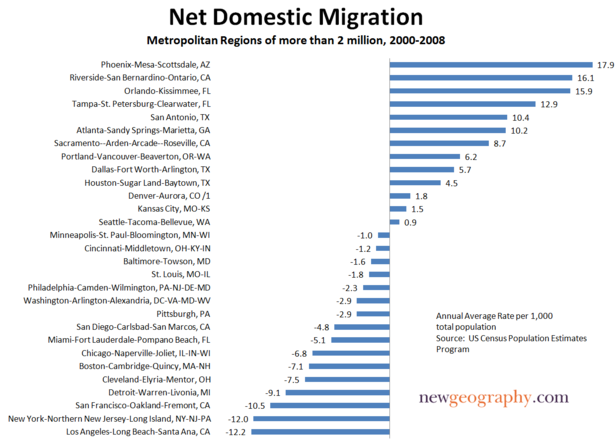
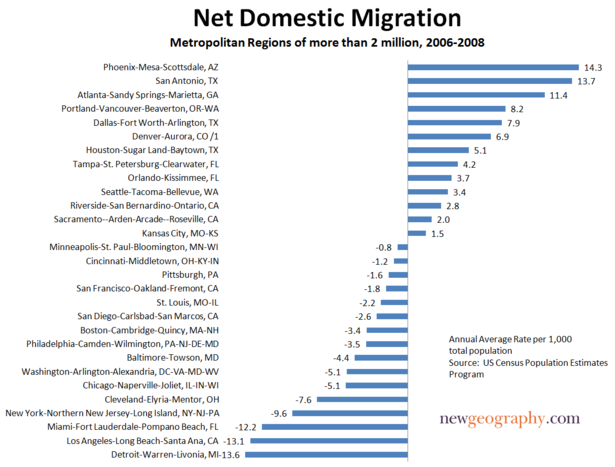
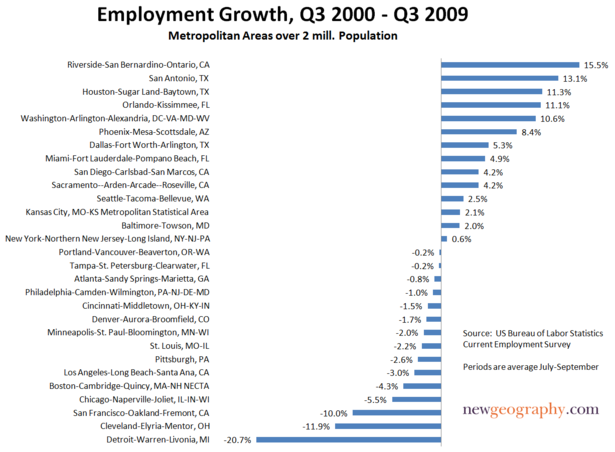
    Comparing Seattle to Dallas-Fort Worth: Things were very different in more responsive markets, as is illustrated by Dallas-Fort Worth (Figure 2). Dallas-Fort Worth, now the nation’s fourth largest metropolitan area, trailing only New York, Los Angeles and Chicago has grown more than twice as fast as Seattle (21.2% from 2000 to 2008, compared to 9.6%). Dallas-Fort Worth’s underlying demand has been even greater relative to Seattle, as indicated by its net domestic migration. Dallas-Fort Worth has added more than 10 times as many domestic migrants (260,000 versus 23,000) and more than 5 times its 2000 population (5.0% v. 0.8%). Moreover, and perhaps surprisingly, the Dallas-Fort Worth urban area (along with Houston) is more compact (read “sprawls” less) than Seattle (Note 3). Finally, the share of sub-prime mortgages was higher in Dallas-Fort Worth than in Seattle.

    Yet, despite this huge demand, housing affordability has remained below the historic Median Multiple norm of 3.0. In 2007, the Dallas-Fort Worth Median Multiple was 2.7. The median house price increased $32,000 from 1997 to 2007 and more than 70% of the change was due to construction costs.

    In 1997, the Seattle median house price was $54,000 higher than in Dallas-Fort Worth. By 2007, the price of a median house in Seattle had escalated to nearly $250,000 more than its counterpart in Dallas-Fort Worth (Since 2007, house prices have dropped $90,000 in Seattle and $5,000 in Dallas-Fort Worth, illustrating the more intense price volatility of tightly regulated markets. Even so, Seattle housing affordability remains materially worse than before).

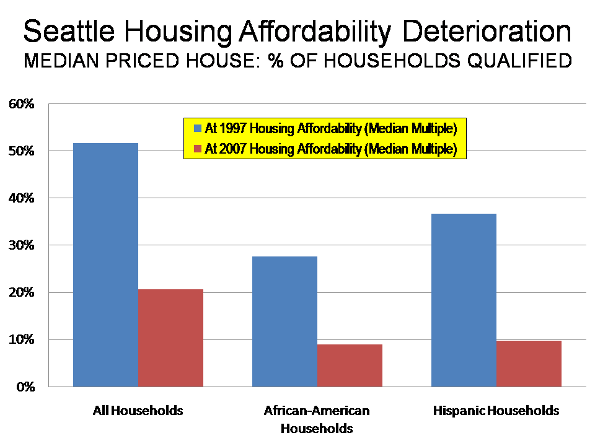
    Driving Households out of the Home Ownership Market: If 1997 housing affordability (using the Median Multiple) had been retained, 50% of Seattle households would have been able to qualify for a mortgage on the median priced house. However, by 2007 only about 20% of Seattle households could have qualified for a mortgage on the median priced house in 2007 at present FHA underwriting standards (Note 4).

    Impact on Minority Households: The highest price, however is being paid by Seattle’s minority households (Figure 2).

    • The share of African-American households able to qualify for a mortgage on the median priced house declined nearly 70% compared to 1997 affordability (Median Multiple). At 1997 housing affordability, more than 25% of African American households would have been able to qualify for a mortgage on the median priced house in 2007. In reality, by 2007, less than 10% of African-American households could have qualified for a mortgage on the median priced house.
    • The share of Hispanic households able to qualify for a mortgage on the median priced house declined more than 70% compared to 1997 affordability (Median Multiple). At 1997 housing affordability, more than 35% of Hispanic households would have been able to qualify for a mortgage on the median priced house in 2007; by 2007 than number had plunged to less than 10%.

    The High Price of Growth Management in Seattle: The 10-year trend of house prices increases in the Seattle metropolitan area supports Eicher’s analysis. We readily admit to the charge of evaluating housing affordability “solely on price.” There is still the dubious W-APA claim that land regulation adds to the quality of life. But whose quality of life? As housing affordability declines, the quality of life may be raised for some, but only by keeping others down.


    Notes:

    (1) The W-APA report makes the common error of presuming that land use restraints were not a factor in the house price escalation of Phoenix and Las Vegas. In fact, the Brookings Institution ranks both metropolitan areas as toward the more restrictive end of the regulatory spectrum. These overly prescriptive regulatory environments are exacerbated by the fact that in both metropolitan areas much of the developable suburban land is owned by government, and is being auctioned, though at a rate less than demand. These factors combined to drive auction prices per acre up nearly 500% in Phoenix and nearly 400% in Las Vegas during the housing bubble. Despite their high building rates, these land restrictions denied sufficient affordable land for development to keep house prices from rising rapidly. Further, W-APA refers to Phoenix and Las Vegas as having “relatively unfettered sprawl,” yet both are more compact than Seattle. In 2000, the Las Vegas urban area (area of continuous urban development) was 62% more dense than Seattle and the Phoenix urban area was 28% more dense than Seattle (calculated from US Bureau of the Census data).

    (2) There are no reliable sources for median new house prices at the metropolitan area level. Generally, however, US Bureau of the Census data indicates that in the West, the median priced new house costs have averaged 6% more than the median priced house in the 2000s. Construction cost escalation (national and Seattle) is calculated from R.S. Means Residential Square Foot Costs (1997 and 2007 editions).

    (3) In 2000, the Seattle urban area had a density of 2,844 persons per square mile. Dallas-Fort Worth had a density of 2,946 and Houston had a density of 2,951. All three were relatively close to Portland (3,340), but well behind Los Angeles (7,069), which is the most dense major urban area in the nation.

    (4) Estimated assuming a FHA “front end ratio” of 29%, (mortgage, property tax and homeowners insurance divided by gross annual income) and a 10% down payment. Calculated using 2007 American Community Survey income data for the Seattle metropolitan area.


    Wendell Cox is a Visiting Professor, Conservatoire National des Arts et Metiers, Paris. He was born in Los Angeles and was appointed to three terms on the Los Angeles County Transportation Commission by Mayor Tom Bradley. He is the author of “War on the Dream: How Anti-Sprawl Policy Threatens the Quality of Life.

  • Who’s Dependent on Cars? Try Mass Transit

    The Smart Growth movement has long demonstrated a keen understanding of the importance of rhetoric. Terms like livability, transportation choice, and even “smart growth” enable advocates to argue by assertion rather than by evidence. Smart Growth rhetoric thrives in a political culture that rewards the clever catchphrase over drab data analysis, but often fails to identify the risks for cities inherent in their war against “auto-dependency” and promotion of large-scale mass transit to boost the “sustainability” of communities.

    Yet in pursuing this transit-friendly future political leaders rarely confront this inescapable reality: public transportation is fiscally unsustainable and utterly dependent on the very car-drivers transit boosters so often excoriate. For example, a major source of funding for transit comes from taxes paid by motorists, which include principally fuel taxes but also sales taxes, registration fees and transportation grants. The amount of tax diversion varies from place to place, but whether the metro region is small or large the subsidies are significant. In Gainesville, Florida – a college town of 120,000 – the regional transit system received 80 percent of the city’s local option gas tax in 2008. In New York City, the Triborough Bridge and Tunnel Authority diverts 68 percent of its toll revenues to subways and buses.

    In addition to local subsidies, state and federal agencies fund transit operations with revenue from gas taxes and other motorist user fees. In 2007 transit agencies received $10.7 billion from the federal Highway Trust Fund, and that is a conservative figure since another $11.7 billion was diverted for vaguely phrased “non-highway purposes.”

    In contrast, fare box recovery doesn’t come close to covering operating expenses. Nor can transit pay for its own capital outlay. Last year the Metropolitan Washington Airports Authority moved to dedicate toll revenue and toll bonds to cover half the cost of the $5.26 billion Dulles Metrorail project.

    The implications of transit’s auto-dependency are serious. Americans drove 11 billion fewer miles between 2008 and 2009, and for each mile not traveled local, state, and federal taxes were not collected. Without these anticipated revenues, transit systems across the country have suffered and, ironically, those hit hardest are the people who are dependent on public transportation ,that is in most cities, the poor and the young.

    In D.C., transit riders are being warned by Metro officials to expect half-hour waits for buses and trains and more crowded rides as they cut services and lay off positions to close a $40 million budget shortfall. Santa Clara County’s Valley Transit Authority has announced plans to reduce bus service by 8 percent and light rail service by 6.5 percent. In Arizona, both Tempe and Phoenix face major cuts that will lengthen wait times and eliminate routes. Even as demand for transit increases in states like Minnesota, the decline in funding is leading to major readjustments in service.

    The situation is so dire in New York City – with by far the most extensive transit system in the country – that advocates used students as props to protest service cuts caused by a $400 million budget shortfall. Though transit receives funding from other sources, there can be no mistaking the key role played by motorists.

    The decline in driving can be attributed largely to the economic downturn and increased unemployment, but even when the recession ends transit agencies will face an uncertain funding future. New technologies are making automobiles cleaner and more fuel efficient, which will allow people to drive more while paying and polluting less. If auto makers meet new federal standards, cars will soon be achieving 35.5 miles per gallon instead of today’s 27.5 mpg average. Economic growth continues to disperse and there has been a strong uptick in telecommuting.

    But perhaps the biggest threat to the future of auto-dependent transit is the very “cause” that seeks to establish it as the preferred travel mode. The planning doctrine called Smart Growth with its rationale of sustainable development is growing in popularity in urban areas across the country. Local officials are enamored with visions of auto-light cities where the buses are full, sidewalks are crowded and there are more bicycles on the road than cars.

    Beneath the appealing rhetoric of Smart Growth rests the assumption that automobiles are intrinsically bad and that public policy should be directed at restricting their use. Rarely do policymakers weigh the automobile’s many benefits and the improving technologies that are mitigating its negative environmental impact. Even rarer is discussion of whether transit can realistically match the convenience and flexibility of the automobile for both individuals and families.

    Distracted perhaps by pictures of ornate transit hubs and shiny rail cars, many policy makers fail to focus on developing a fiscally sustainable plan for public transportation. They miss the fundamental problem that anything heavily subsidized –particularly in a budget constrained atmosphere – is, by definition, unsustainable. (To the extent roads are subsidized, it breaks down to about a half-penny per passenger mile; transit subsidies are 100 times more than driving subsidies.) Ideally, user fees would cover all expenses of all transportation modes, including driving.

    A responsible policy goal should be for transit users to put their fair share in the fare box. However, given the current tax diversion imbalance, local officials should at least target a near-term goal for fare box recovery of 85 percent of costs instead of its current one-third average. This will reduce both their fatal auto-dependency and the instability that comes when external revenue sources are impacted by external factors like an economic downturn.

    Transit agencies should also right-size their bus fleets. Despite visions of large 55-passenger vehicles filled to capacity with contented commuters, only a small portion of routes in any urban area can fill these big box buses even during certain peak times. A smaller sized fleet would be not only less expensive but also more flexible, allowing cities to adjust routes and increase headways for greater service. It would also have a smaller carbon footprint.

    Finally, responsible policymakers should suspend most of their plans to build rail transit. In addition to routinely running over-budget, rail transit- outside of a few cities such as Washington DC and New York- simply does not carry many passengers relative to automobiles to justify its enormous operating expenses . The Santa Clara Valley Transportation Authority, for example, spent $55.5 million in operating expenses in 2008, recovering just $8.6 million from passenger fares and costing taxpayers an average of $5.88 per trip.

    Rubber tire transit is more efficient compared to rail as a service to those needing public transportation. Santa Clara’s operating expenses per vehicle revenue mile were 25 percent less for bus than for light rail. Additionally, bus transit is far more flexible, easier to expand and less disruptive in the construction phase.

    Essentially, policymakers need to see transit as a service with an important but limited role to play in most urban regions. With jobs and more activities spreading to the suburbs and exurbs – a process often accelerated by economically disruptive urban policies, cities should focus transit on a limited number of central core commuters as well as those people who cannot drive. Unfortunately, such goals are too modest for planners who envision transit as the catalyst for large scale social engineering and who have little concern for their regions’ economic bottom line.

    The dirty little secret remains that public transportation would collapse without the automobile. It will remain unsustainable as long as it remains dependent on that which public policy is trying to discourage. Smart Growth rhetoric makes for great campaign literature but not for smart decision-making. Responsible officials should question the underlying assumptions about automobiles and begin reconsidering the fiscal calculus that underlies transit policy.

    Ed Braddy is the executive director of the American Dream Coalition, a non-profit public policy organization that examines transportation and land-use policies at the local level. The ADC’s annual conference will be held this year on June 10-12 in Orlando, Florida.

    Photo: ahockley

  • Urbanity Drives Gay Rights Victory in Washington

    If anyone were to doubt that there really are two Washingtons, that the Seattle metropolitan core (and its playgrounds) are another world from most rural to small city Washington (especially east of the Cascade crest), a look at the maps for the vote on Referendum 71 last November should be persuasive. These are not subtle, marginal differences, but indisputable polarization in what political and cultural researchers may call the modernist-traditional divide.

    Referendum 71 passed by a 53 to 47 percent vote, and revealing the power of the King County electorate, which alone provided a margin of 204,000, compared to a statewide margin of 113,000! To overcome the problem of variable size of precincts, and the need to suppress too small numbers, I aggregated precincts to census tracts, which have the added advantage of permitting comparison of electoral results with social and economic data from the census.

    Looking at the statewide map, about 85 percent of the territory of the state (95 % in Eastern WA, 70 % in western WA) voted NO. But the strong no vote came from overwhelmingly rural areas and small towns. The only core metropolitan census tracts that voted a majority no were in Richland-Kennewick area, Yakima and Longview. The heart of traditionalist, and arguably, of anti-gay sentiment lies in the farm country of eastern Washington, especially wheat and ranching areas in Adams, Douglas, Garfield, Lincoln, Walla Walla and Whitman counties, but extending also to the rich irrigated farmlands of Grant, Franklin, Benton and Yakima counties. The highest no votes in western Washington were far rural stretches, and most interesting, Lynden, home to many Dutch descendants, members of the conservative Christian Reformed Church. Not surprisingly the census tracts in eastern Washington which supported Referendum 71 were the tracts dominated by Washington State University in Pullman, around Central Washington university in Ellensburg, the mountain resorts tracts in western Okanogan (Mazama, Twisp), and a few tracts in the core of the city of Spokane.

    Across western Washington majorities against Ref 71 prevailed over a sizeable contiguous southeastern area, from northern Clark and Skamania through urban as well as rural Lewis county (reinforcing the county’s reputation of being the anti-Seattle!) into much of southeastern Pierce county. A lesser vote against 71 occurred in the rest of rural small town western Washington, including most of rural Snohomish county.

    The zone of strong support, voting over 60 percent in favor, flowed largely from Seattle and its inner commuting zone, its spillover playgrounds and retirement areas of Port Townsend and the San Juans, and college and university dominated tracts around Western Washington in Bellingham, the Evergreen State College, Olympia, plus the downtown cores of Vancouver, Tacoma and Everett. Weaker but still supportive were rural spillover, retirement and resort tracts, often in coastal or mountain areas of Pacific, Grays Harbor, Jefferson, Clallam, Skagit and Whatcom counties.

    Looking at the detailed map of central Puget Sound, we can see revealing contrasts between the two camps. Support levels of over 75 percent almost coincides with the city of Seattle boundaries (not quite so high in the far south end), and its professional commuting outliers of Bainbridge and Vashon, plus the downtown government core of Olympia and tracts around the University of Puget Sound and the UW Tacoma.

    Moderately high support (60 to 75 percent) surrounds the core area of highest support, most dominantly in the more affluent and professional areas north of Seattle through Edmonds and east to Redmond, Issaquah and Sammamish (Microsoft land). Weak but still positive votes occurred in the next tier of tracts, around Olympia, north and west of inner Tacoma, most of urban southwest Snohomish county and much of exurban and rural King county (quite unlike most rural areas). But on the contrary, the shift to opposition is remarkably quick and strong in southeastern King and especially in Pierce county, in northern and eastern Snohomish county, and, not surprisingly, in military dominated parts of Kitsap county (e.g., Bangor) and Pierce (Fort Lewis).

    The temptation to compare the voting levels of census tracts with social and economic conditions of those tracts is too great to resist. Here are the strongest correlations (statewide).

    Washington State Correlations with voting in favor of Ref 71
    % Use transit 0.75 %  Drive SOV -0.54
    % Non-family HH 0.65 % HW families -0.45
    % Single 0.48 Average HH size -0.53
    % Same sex HH 0.57
    % aged 20—39 0.43 %  under 20 -0.55
    % foreign born 0.28 % Born in Wash. -0.4
    % College grad 0.65 % HS only -0.62
    % Black 0.27 % white -0.13
    % Asian 0.42 % Hispanic -0.22
    Manager-Profess 0.53 % Craft occup -0.46
    % in FIRE 0.34 % laboring occup -0.47

    These statistics reflect the profound Red-Blue division of the American electorate, in both the geographic differences (large metropolitan versus rural and small town), as well as the modern versus traditional dimension (socially liberal or conservative). The strongest single variable is not behavioral, but transit use is a surrogate for the metropolitan/non-metropolitan split. The critical social characteristic lies in the nature of households: the traditional family versus non-families (partners, roommates, singles). This is a powerful tendency, and useful to describe differences in areas, but of course many in families – often more educated and professional – support Ref 71, and many singles – often elderly, or opposite sex partners – opposed it, especially in more conservative parts of the state.

    The next strongest set of variables, clearly visual from the maps, lay in the strong split of the electorate according to the predominant educational level of the tracts. The tendency of the more educated to support 71 represents the key statistic of the “modern” vs “Traditional” dimension, and is closely related to the differences by occupation and industry. Managers and professionals, and those working in finance, and information sectors tended to be supportive of 71, while those in laboring and craft occupations, and in manufacturing, transport and utilities, tended to oppose. (South King county and much of Pierce county have high shares of blue collar jobs).

    Finally differences by race exist, but are not so strong as, say, in the presidential election in 2008 (although the correlation of the percent for Ref 71 and for Obama was .90).

    Yes, greater Seattle is indeed very different than the rest of Washington and much of America as well.

    Richard Morrill is Professor Emeritus of Geography and Environmental Studies, University of Washington. His research interests include: political geography (voting behavior, redistricting, local governance), population/demography/settlement/migration, urban geography and planning, urban transportation (i.e., old fashioned generalist).

  • The World’s Smartest Cities

    In today’s parlance a “smart” city often refers to a place with a “green” sustainable agenda. Yet this narrow definition of intelligence ignores many other factors–notably upward mobility and economic progress–that have characterized successful cities in the past.

    The green-only litmus test dictates cities should emulate either places with less-than-dynamic economies, like Portland, Ore., or Honolulu, or one of the rather homogeneous and staid Scandinavian capitals. In contrast, I have determined my “smartest” cities not only by looking at infrastructure and livability, but also economic fundamentals.

    These criteria unfortunately exclude mega-cities like New York, Mexico City, Tokyo or Sao Paulo, which suffer from congenital congestion, out-of-control real estate prices and expanding income disparities–symptoms of what urban historian Lewis Mumford described as “megalopolitan elephantiasis.”

    Instead, today’s “smart” cities tend to be smaller, compact and more efficient: places like Amsterdam; Seattle; Singapore; Curitiba, Brazil; and Monterrey, Mexico. This is not an entirely new notion: Between the 14th and 18th centuries, modest-sized cities like Venice, Italy; Antwerp, Belgium; and Amsterdam nurtured modern capitalism and created canals and vibrant urban quarters that remain wonders even today.

    In the Pacific-centric modern era, smart commercial cities are increasingly found outside Europe. Indeed, the most likely 21st-century successor to 15th-century Venice is Singapore, a commercially minded island nation that, like its forebear, is run by an often enlightened authoritarian regime.

    When it first achieved independence in 1965, Singapore’s condition was comparable to other developing cities like Bombay, Cairo, Lagos or Calcutta. The island city’s neighbors included unstable countries like Vietnam, Malaysia and Thailand. Its GDP per capita ranked well below those of Argentina, Trinidad, Greece or Mexico.

    The country’s first prime minister and current eminence grise, Lee Kuan Yew, was determined to change reality. Today, Singapore, with a population of less than 5 million, boasts an income level close to the wealthiest Western countries and a per-capita GDP ahead of most of Europe and all of Latin America. Once largely semi-literate, its population is now among the best-educated in Asia.

    To be sure, this enviable achievement was accomplished in an authoritarian fashion, but much of what Singapore has done must be considered “smart” by any reasonable accounting. Strategic investments taking advantage of its location between the Indian and Pacific Oceans have paid off handsomely: Today Singapore Airport is Asia’s fifth largest, and the city’s port ranks as the largest container entrepôt and is the second biggest, after Shanghai, in terms of cargo volume in the world.

    All this has made Singapore a huge lure for foreign companies, with over 6000 multinationals, including 3600 regional headquarters, now located there. For foreign managers, engineers and scientists, largely English-speaking Singapore offers a pleasant and predictable environment, particularly compared with other Asian centers.

    At least one recent survey by the World Bank’s International Finance Corporation rates Singapore No. 1 in the world for ease of doing business. Although its growth has been slowed by the recession, the city’s close ties to the resurging economies of Southeast Asia, China and India lead many forecasters to predict a strong recovery over the next year.

    Hong Kong, yet another outpost of British imperialism, has also performed well. Last year the World Bank ranked the area No. 3 for ease of doing business, compared with No. 89 for the rest of China. As long as Chinese Communists allow wider freedoms in Hong Kong than in the mainland, the area should continue to take advantage of its basic assets, including the world’s third-largest container port, an excellent airport and a highly skilled entrepreneurial population.

    The continuing appeal of Hong Kong was vindicated by the recent decision of Hong Kong Shanghai Bank Chief executive George Geoghegan to relocate there from London. As the center of the world economy continues to shift to Asia while Europe and America struggle, he is likely to find more company.

    Not all the world’s “smart” cities are trading giants like Hong Kong and Singapore. They also include well-run metropolises, such as the city of Curitiba. The south Brazilian city is regarded as an innovator in everything from bus-based rapid transit, used by some 70% of residents, and its balanced, diverse economic development strategy.

    With a population of 3.5 million, Curitiba demonstrates how to achieve the evolving Brazilian dream without the mass violence, transportation dysfunction and ubiquitous grinding poverty that plague many other Latin American metro areas. The city’s program of building “lighthouses”–essentially electronic libraries–for poorer residents has become a model for developing cities world wide. These are among the reasons Reader’s Digest recently named Curitiba the best place to live in Brazil.

    Another similarly “smart” city in the developing world is Monterrey, Mexico, which has emerged from relative obscurity and turned itself into a major industrial and engineering center over the past few decades. The city of 3.5 million sits adjacent to the dynamic U.S.-Mexico border region and has 57 industrial parks specializing in everything from chemicals and cement to telecommunications and industrial machinery.

    Over the last decade, the area has consistently grown at a faster rate than the rest of Mexico–or, for that matter, the United States. Monterrey and its surrounding state, Nuevo Leon, now boast per-capita GDP roughly twice that of the rest of Mexico.

    Although hard-hit by the current recession, Monterrey seems poised for an eventual recovery. Dominated by powerful industrial families, the area has long been business-friendly. It has also become a major education center, with over 82 institutions of higher learning and 125,000 students, led by the Instituto Technologico de Monterey, considered by some Mexico’s equivalent of MIT or Cal Tech.

    Of course, “smart” cities also exist in the advanced industrial world. Amsterdam, a longstanding financial and trading capital, is home to seven of the world’s top 500 companies, including Philips and ING. Relatively low corporate taxes and income taxes on foreign workers attract individuals and companies, one reason why, in 2008, the Netherlands was largest recipient of American investment in Europe. Amsterdam’s advantages include a well-educated, multilingual population and a lack of political corruption.

    Amsterdam’s relatively small size–740,000 in the city and 1.2 million for the entire metropolitan area–belies its strategic location in the heart of Europe and proximity to the continent’s dominant port, Rotterdam. The city’s Schiphol airport, Europe’s third-busiest, is only 20 minutes from the center of Amsterdam, a mere jaunt compared with commutes to the major London or Paris airports. Schipol has also spawned a series of economically vibrant “edge cities” that appear like more transit-friendly versions of Houston or Orange County, Calif.

    North America also has its share of smart cities. Although self-obsessed greens might see their policies as the key to the area’s success, Seattle’s growth really stems more from economic reality. In this sense, Seattle’s boom has a lot to do with luck–it’s the closest major U.S. port to the Asian Pacific, which has allowed it to foster growing trade with Asia.

    Furthermore, Seattle’s proximity to Washington state’s vast hydropower generation resources–ironically the legacy of the pre-green era–assures access to affordable, stable electricity. The area also serves as a conduit for many of the exportable agricultural and industrial products produced both in the Pacific Northwest and in the vast, resource-rich northern Great Plains, linked to the region by highways and freight rails.

    As North America’s economy shifts from import and consumption toward export and production, Seattle’s rise will be a model for other business-savvy cities in the West and South. Houston’s close tie to the Caribbean, as well as its dominant global energy industry, thriving industrial base, huge Texas Medical Center complex and first-rate airport, all work to its long-term advantage. Arguably the healthiest economically of America’s big cities, Houston is also investing in–not just talking about–its green future; last year it was the nation’s largest municipal purchaser of wind energy.

    Another smart town poised to take advantage of an industrial expansion is Charleston, S.C., which has expanded its port and manufacturing base while preserving its lovely historic core. Once an industrial backwater, Charleston now seems set to emerge as a major aerospace center with a new Boeing 787 assembly plant, which will bring upward of 12,000 well-paying jobs to the region.

    Further inland, Huntsville, Ala., has long had a “smart” core to its economy–a legacy of its critical role in the NASA ballistic missile program. Today the area’s traditional emphasis on aerospace has been joined by bold moves into such fields as biotechnology. Kiplinger recently ranked the area’s economy No. 1 in the nation.

    With the likely rise in commodity prices over the next decade, Canada also seems likely to produce several successful cities. Perhaps the best positioned is Calgary, Alberta. Over the past two decades, the city’s share of corporate headquarters has doubled to 15%, the largest percentage of main offices per capita in Canada.

    Although last year’s plunge in oil prices hit hard, rising demand for commodities in Asia should help revive the Albertan economy by next year.

    In their press releases, all these cities make a point of bragging about being green and environmentally conscious. Yet they have demonstrated their “intelligence” in other ways–by exploiting their locations and resources to make savvy business and development decisions. At the end of the day, it will not be their clean air but their commercial prowess–as has been the case in history–that will sustain their success in the decades ahead.

    List of the World’s Smartest Cities

    1. Singapore The 21st-century successor to 15th-century Venice, this once-impoverished island nation now boasts an income level comparable to the wealthiest Western countries, with a per-capita GDP ahead of most of Europe and Latin America. Singapore Airport is Asia’s fifth-largest, and the city’s port ranks as the largest container entrepot in the world. Over 6,000 multinational corporations, including 3,600 regional headquarters, are located there, and it was recently ranked No. 1 for ease of doing business.
    2. Hong Kong As the center of the world economy continues to shift from West to East, Hong Kong is certainly reaping the benefits. Hong Kong Shanghai Bank’s chief executive recently relocated there from London. Its per-capita GDP is ranked 15th in the world. The Heritage Foundation and The Wall Street Journal have ranked Hong Kong the freest economy in the world.
    3. Curitiba, Brazil This well-run metropolis in southern Brazil is famous for its rapid bus-based transit, used by 70% of its residents, and its balanced, diverse economic development strategy. The city’s program of building “lighthouses”–essentially electronic libraries–for poorer residents has become a model for developing cities worldwide. Environmental site Grist recently ranked Curitiba the third “greenest” city in the world.
    4. Monterrey, Mexico Over the past few decades Monterrey has emerged from relative obscurity into a major industrial and engineering center. The city of 3.5 million has 57 industrial parks, specializing in everything from chemicals and cement to telecommunications and industrial machinery. Monterrey and its surrounding state, Nuevo Leon, boast a per-capita GDP roughly twice that of the rest of Mexico.
    5. Amsterdam This longstanding financial and trading capital is home to seven of the world’s top 500 companies, including Philips and ING. Relatively low corporate taxes and income taxes on foreign workers attract companies and individuals. Amsterdam’s advantages include a well-educated, multilingual population and a lack of political corruption, as well as its location–in the heart of Europe, close to a major international airport and a short train trip to Rotterdam, the continent’s dominant port.
    6. Seattle, Wash. Seattle’s location close to the Pacific Ocean has nurtured trade with Asia, and its proximity to Washington state’s vast hydro-power generation station assures access to affordable, stable clean electricity. The area also serves as the conduit for many of the exportable agricultural and industrial products produced both in the Pacific Northwest and in the vast, resource-rich northern Great Plains, closely linked to the region by highways and freight trains.
    7. Houston, Texas Houston’s close tie to the Caribbean, as well as its dominant global energy industry, thriving industrial base, huge Texas Medical Center complex and first-rate airport all work to its long-term advantage. Arguably the big city in the U.S. with the healthiest economy, Houston is also investing in a “green” future; last year it was the nation’s largest municipal purchaser of wind energy.
    8. Charleston, S.C. Charleston has expanded its port and manufacturing base while preserving its lovely historic core. Once an industrial backwater, Charleston now seems poised to emerge as a major aerospace center, with the location of a new Boeing 787 assembly plant there, which will bring upward of 12,000 well-paying jobs to the region.
    9. Huntsville, Ala. This southern city has long had a “smart” core to its economy, a legacy of its critical role in the NASA ballistic missile program. Today the area’s traditional emphasis on aerospace has been joined by bold moves into such fields as biotechnology. Kiplinger recently ranked the area’s economy No. 1 in the nation.
    10. Calgary, Alberta With the likely rise in commodity prices over the next decade, Canada seems likely to produce several successful cities. Over the past two decades, Calgary’s share of corporate headquarters has doubled to 15%, the largest percentage of main offices per capita in Canada. Although the plunge in oil prices hit hard, rising demand for commodities in Asia should help revive the Albertan economy by next year.

    This article originally appeared at Forbes.com.

    Joel Kotkin is executive editor of NewGeography.com and is a distinguished presidential fellow in urban futures at Chapman University. He is author of The City: A Global History. His next book, The Next Hundred Million: America in 2050, will be published by Penguin Press early next year.

  • Migration: Geographies In Conflict

    It’s an interesting puzzle. The “cool cities”, the ones that are supposedly doing the best, the ones with the hottest downtowns, the biggest buzz, leading-edge new companies, smart shops, swank restaurants and hip hotels – the ones that are supposed to be magnets for talent – are often among those with the highest levels of net domestic outmigration. New York City, Los Angeles, San Francisco, Boston, Miami and Chicago – all were big losers in the 2000s. Seattle, Denver, and Minneapolis more or less broke even. Portland is the only proverbially cool city with a regional population over two million that gained any significant number of migrants.

    Those who find this an occasion for a schadenfreude moment attribute it to tax and regulatory climates. Clearly, things like cost of doing business are clearly very important. And indeed this is often under-rated by cool city proponents. And other things equal, people do prefer low tax jurisdictions. Still, is this the only answer, or is there another explanation? Could it be that rather than high costs driving migration, both costs and migration are being driven by other underlying factors?

    Perhaps the root problem is structural change in the economy in the age of globalization. As business became more globalized and more virtualized, this created demand for new types of financial products and producer services – notably in the law, accounting, consultancy, and marketing areas – to help businesses service and control their far flung networks. Unlike many activities, financial and producer services are subject to clustering economics, and have ended up concentrated in a relatively small number of cities around the world.

    These so-called “global cities” serve as control nodes for various global networks and key production sites for these services, along with other specialized niches they long had. In effect, more distributed economic activities requires increasing centralization of select functions, particularly the most highly value-added functions. Yet these activities are not set in stone; for example, areas that were once centers for global business, like Cleveland or Detroit, are fading; others like Houston and Dallas are rising.

    Yet unlike the Texas cities, which retain a strong middle-class and middle-echelon economy, many of the more elite, established urban centers – for example New York and London – increasingly create parallel economies and labor markets in those cities. These cities now generally contain two kinds of people and firms: those who are part of the global city functions and those who are not. Those who are engaged in global city functions operate in a world of very high value-added activities; specialized, niche skill markets; and rising demand conditions. Those skills are not readily acquired outside of global cities. Often, they are sub-specialized to particular places as different global cities specialize in different niches.

    In many cases, these functions have not yet migrated to India or China or often even another global city. This tends to inflate salaries significantly for these specialized, niche skill jobs.

    On the other hand, many people who once thrived in these cities have not benefited from these economic forces. They often are in occupations where labor arbitrage is feasible, and their jobs can either be off-shored, or readily transferred to lower cost locales in the US. This includes manufacturing work, but also important but less specialized white collar occupations like basic accounting, loan officers, corporate IT, and HR. In short, the routine side of the traditional monolithic corporate headquarters and services firm.

    In effect, in these global cities, two economic geographies share the same physical geography – and those economic geographies are in conflict. One set requires catering to high skill, highly paid workers and firms where cost is a secondary concern. The other involves occupations and industries where cost is very much a concern. The occupants of these two geographies have very different public policy priorities. Which of them will win out?

    In a global city, particularly a mature and expensive one, the elite geography wins. It is generating the most money, and with money comes power and influence. Additionally, the high wage workers in these industries are simply able to pay more for real estate and other items. Their mere paychecks are driving up costs in the city they live in. They are re-ordering the city in their own high income image, aided and abetted by a speculative financial fueled housing bubble.

    The prestige of these industries burnishes the civic brand, making them attractive to civic boosters. What’s more, leaders in global cities feel that these are their businesses of their future. For them the attractiveness of concentrating in areas where you think you can create a “wide moat” advantage makes sense.

    This is why cities like Portland, Minneapolis, Denver, and Seattle haven’t fared nearly so badly – they aren’t really full metal global cities and thus, while not always cheap, have remained relatively affordable versus places like San Francisco and New York.

    At the same time it is not easy for these more expensive cities to adopt a low tax, low cost approach. For many reasons, places like San Francisco, New York, and London will never, no matter what they do, be able to match Atlanta, Houston, or Dallas, or even Chicago in a war on costs. That would be a suicide mission. Their logical strategy is to follow the law of comparative advantage, and specialize where you have the best competitive position in the market, and that’s global city functions.

    Many other cities have followed this strategy, but with differing success. Fearing to end up like the next Michigan and Detroit pair, many states and cities have invested heavily to build up urban amenities to cater to the global city firms and their workers: transit systems, showplace public buildings, art and culture events, bike lanes, and beautification. Cost fell by the wayside as a concern, as did investments in priorities of the traditional middle class.

    This explains why, for example, not only have taxes gone up, but things like schools and other basic services have declined so badly in places like California. Traditional primary and secondary education is not important to industries where California is betting its future. Silicon Valley, Hollywood, and biotech draw their workers from the best and brightest of the world. They source globally, not locally. Their labor force is largely educated elsewhere. Basic education and investments in poorer neighborhoods has no ROI for those industries. With the decline of high tech manufacturing in Silicon Valley, even previously critical institutions such as community colleges are no longer as needed.

    The same goes for growth and sprawl. They are playing a game of quality over quantity. They specialize in elite urban areas and elite suburbs or exurbs. For example, San Francisco also has Marin, Palo Alto and Los Altos Hills. New York has, in addition to Manhattan, Greenwich and northern Westchester. The only thing they need size for is sheer scale in certain urban functions, and they already have it. Growth is unnecessary for them and only brings problems.

    It also explains the highly pro-immigration stance of these cities, as a large service class is needed for globalization’s new aristocrats. Immigrants are needed as low cost labor in the burgeoning restaurant and hotel business. In America’s global cities immigrant housekeepers, landscapers, and nannies are common. They may not dress like His Lordship’s butler, but that doesn’t make them any less servants.

    Lastly, it explains why we have seen the same polarizing class pattern so consistently despite broad geographic and socio-political differences between places like Los Angeles, Boston, and Chicago, to say nothing of overseas locales like London. A common global phenomenon probably has a common underlying cause.

    The traditional middle class, feeling the squeeze, is simply moving to where its own kind is king and its own priorities are catered to. In a battle of conflicting economic geographies, the one with higher value added wins, displacing others in what Jane Jacobs termed the “self-destruction of diversity”. First, an attractive environment draws diverse uses, then one becomes economically dominant and, through superior purchasing power, displaces other uses over time. The story ends when that dominant economic activity exhausts itself – the true danger facing global cities, though fortunately they are generally not dependent on just one small niche. It’s basic comparative advantage.

    If you are just an average middle class guy, why live in one of those global cities anyway? Unless you have roots there that you value, take advantage of something you can’t get anywhere else such as by having a passion for world class opera, or are one of globalization’s courtiers – a hanger on like a high end chef, artist, or indie rocker, perhaps – why put up with the high cost and hassles? It makes no sense. You’re better off living in suburban Cincinnati than suburban Chicago.

    And frankly, the folks on the global city side prefer it if you leave anyway. Immigrants are unlikely to start trouble, but a middle class facing an economic squeeze and threat to its way of life might raise a ruckus. That won’t happen if enough of them move to Dallas and rob the rest of critical mass and resulting political clout.

    Many of those leaving are college educated, especially, when they get older, get married, and start having families. A relatively large number of these people could be replaced by a smaller number of elite bankers, biotech PhDs, and celebrity chefs. In that case, both “narratives” could hold simultaneously. One type of talent moves in, while a greater number of a different kind moves out. As with trade generally, this could even be viewed as a win-win in some regard.

    Again, it is easy to blame the costs and public policy. Clearly there is room for improvement in governance such as reigning in out of control civil service pay and pensions in places like California and New York. But what is more pernicious is the rising income gap in America, and the likely outcomes it drives when a city acquires a small elite economic class with incomes that far outstrip the average, and lacks strong economic linkages to the rest of the city other than for personal services. It sets in motion economic logic that undermines the traditional middle class, which then starts leaving, exacerbating the gap.

    For years we worried that a large, stable middle class with a permanent, largely minority underclass constituted an unjust order. As it turns out, the alternatives are sometimes worse. Ultimately some American cities have come to take on the cast of their third world brethren, a perhaps somewhat less extreme version of Mexico City or São Paulo, where vast wealth and glitter exist side by side with the favelas.

    This explains why America’s global cities often feel more kinship with their international peers than with many of the places in their own country. The global cities, which now enjoy something of a political ascendency, are also sundering the American commonwealth. Taking steps to prevent a further widening of the income gap may be the only way to save these cities’ middle class – and maintain the solidarity of the country.

    Aaron M. Renn is an independent writer on urban affairs based in the Midwest. His writings appear at The Urbanophile.

  • Numbers Don’t Support Migration Exodus to “Cool Cities”

    For the past decade a large coterie of pundits, prognosticators and their media camp followers have insisted that growth in America would be concentrated in places hip and cool, largely the bluish regions of the country.

    Since the onset of the recession, which has hit many once-thriving Sun Belt hot spots, this chorus has grown bolder. The Wall Street Journal, for example, recently identified the “Next Youth-Magnet Cities” as drawn from the old “hip and cool” collection of yore: Seattle, Portland, Washington, New York and Austin, Texas.

    It’s not just the young who will flock to the blue meccas, but money and business as well, according to the narrative. The future, the Atlantic assured its readers, did not belong to the rubes in the suburbs or Sun Belt, but to high-density, high-end places like New York, San Francisco and Boston.

    This narrative, which has not changed much over the past decade, is misleading and largely misstated. Net migration, both before and after the Great Recession, according to analysis by the Praxis Strategy Group, has continued to be strongest to the predominately red states of the South and Intermountain West.

    This seems true even for those seeking high-end jobs. Between 2006 and 2008, the metropolitan areas that enjoyed the fastest percentage shift toward educated and professional workers and industries included nominally “unhip” places like Indianapolis, Charlotte, N.C., Memphis, Tenn., Salt Lake City, Jacksonville, Fla., Tampa, Fla., and Kansas City, Mo.

    The overall migration numbers are even more revealing. As was the case for much of the past decade, the biggest gainers continue to include cities such as San Antonio, Dallas and Houston. Rather than being oases for migrants, some oft-cited magnets such as New York, Boston, Los Angeles and Chicago have all suffered considerable loss of population to other regions over the past year.

    Much the same pattern emerges when you look at longer-term state demographic patterns. A recent survey by the Empire Center for New York State Policy found that the biggest net losers in terms of per capita outmigration between 2000 and 2008 were, with the exception of Louisiana, all blue state bastions. New York residents lead in terms of rate of exodus, closely followed by the District of Columbia, Michigan, Pennsylvania, Massachusetts and California.

    An even greater shock to the sensibilities of the insular, Manhattan-centric media, the report found that most of the movement from the Empire State was not from the much-dissed suburbia, but from that hip and cool paragon, New York City. This can not be ascribed as a loss of the unwanted: According to the report, those leaving the city had 13% higher incomes than those coming in.

    How can this be, when everyone who’s smart and hip is headed to the Big Apple? This question was addressed in a report by the center-left, New York-based Center for an Urban Future. True, considerable numbers of young, educated people come to New York, but it turns out that many of them leave for the suburbs or other states as they reach their peak earning years.

    Indeed, it’s astonishing given the many clear improvements in New York that more residents left the five boroughs for other locales in 2006, the peak of the last boom, than in 1993, when the city was in demonstrably worse shape. In 2006, the city had a net loss of 153,828 residents through domestic out-migration, compared to a decline of 141,047 in 1993, with every borough except Brooklyn experiencing a higher number of out-migrants in 2006.

    Of course, blue state boosters can point out that the exodus has slowed with the recession, as opportunities have dried up elsewhere. True, the flood of migration has slowed across the nation. Yet it has only slowed, not dried up. When the economy revives, it’s likely to start flowing heavily again.

    More important, the key group leaving New York and other so-called “youth-magnets” comprises the middle class, particularly families, critical to any long-term urban revival. This year’s Census shows that the number of single households in New York has reached record levels; in Manhattan, more than half of all households are singles. And the Urban Future report’s analysis found that even well-heeled Manhattanites with children tend to leave once they reach the age of 5 or above.

    The key factor here may well be economic opportunity. Virtually all the supposedly top-ranked cities cited in this media narrative have suffered below-average job growth throughout the decade. Some, like Portland and New York, have added almost no new jobs; others like San Francisco, Boston and Chicago have actually lost positions over the past decade.

    In contrast, even after the current doldrums, San Antonio, Orlando, Houston, Dallas and Phoenix all boast at least 5% more jobs now than a decade ago. Among the large-narrative magnet regions only one–government-bloated greater Washington–has enjoyed strong employment growth.

    The impact of job growth on the middle class has been profound. New York City, for example, has the smallest share of middle-income families in the nation, according to a recent Brookings Institution study; its proportion of middle-income neighborhoods was smaller than that of any metropolitan area except Los Angeles.The same pattern has also emerged in what has become widely touted as America’s “model city”–President Obama’s adopted hometown of Chicago.

    The likely reasons behind these troubling trends are things rarely discussed in “the narrative”–concerns like high costs, taxes and regulations making it tough on industries that employ the middle class. One clear culprit: out of control state spending. State spending in New York is second per capita in the nation (anomalous Alaska is first); California stands fourth and New Jersey seventh. Illinois is down the list but coming up fast. Over the past decade, while its population grew by only 7%, Illinois’ spending grew by an inflation-adjusted 39%.

    The problem here is more than just too-large government; it lies in how states spend their money. Massive public spending increases over the past decade in California, New Jersey, Illinois and New York have gone overwhelmingly into the pockets and pensions of public employees. It certainly has not flowed into such basic infrastructure as roads, bridges and ports that are needed to keep key industries competitive.

    The American Association of State Highway Transportation, for example, ranked New York 43rd in the country and New Jersey dead last in terms of quality of roads. Some 46% of the Garden State’s roads were rated in poor condition, compared with the national average of 13%, even as the state’s spending reached new highs. The typical New Jersey driver spends almost $600 a year in auto repairs necessitated by the poor conditions of the roads.

    In contrast, states in the South and parts of the Plains tend to pour their public resources into productive uses. Cities like Mobile, Ala., Houston, Charleston, S.C., and Savannah, Ga., have been investing in port facilities to take advantage of the planned widening of the Panama Canal. The primary goal is to take business away from the increasingly expensive, overregulated and under-invested ports of the Northeast and West Coast. Similarly, places like Kansas City and the Dakotas are looking to boost their basic rail and road networks to support export-heavy industries.

    Even in the face of the Obama administration’s strongly urban-centric, blue state-oriented economic policy, these generally less than hip places appear poised to grow as the economy recovers. Virtually all the top 10 economies that have withstood the recession come from outside the “youth-magnet” field: San Antonio; Oklahoma City; Little Rock, Ark.; Dallas, Baton Rouge, La.; Tulsa, Okla., Omaha, Neb.; Houston and El Paso, Texas. The one exception to this rule, Austin, also benefits from being located in solvent, generally low-tax Texas.

    This continued erosion of jobs and the middle class from the blue states and cities is not inevitable. Many of these places enjoy enormous assets in terms of universities, strategic location, concentrations of talented workers and entrenched high-wage industries. But short of a massive and continuing bailout from Washington, the only way to reverse their decline will be a thorough reformation of their governmental structure and policies. No narrative, no matter how well spun, can make up for that reality.

    This article originally appeared at Forbes.com.

    Joel Kotkin is executive editor of NewGeography.com and is a distinguished presidential fellow in urban futures at Chapman University. He is author of The City: A Global History. His next book, The Next Hundred Million: America in 2050, will be published by Penguin Press early next year.

  • The White City

    Among the media, academia and within planning circles, there’s a generally standing answer to the question of what cities are the best, the most progressive and best role models for small and mid-sized cities. The standard list includes Portland, Seattle, Austin, Minneapolis, and Denver. In particular, Portland is held up as a paradigm, with its urban growth boundary, extensive transit system, excellent cycling culture, and a pro-density policy. These cities are frequently contrasted with those of the Rust Belt and South, which are found wanting, often even by locals, as “cool” urban places.

    But look closely at these exemplars and a curious fact emerges. If you take away the dominant Tier One cities like New York, Chicago and Los Angeles you will find that the “progressive” cities aren’t red or blue, but another color entirely: white.

    In fact, not one of these “progressive” cities even reaches the national average for African American percentage population in its core county. Perhaps not progressiveness but whiteness is the defining characteristic of the group.

    The progressive paragon of Portland is the whitest on the list, with an African American population less than half the national average. It is America’s ultimate White City. The contrast with other, supposedly less advanced cities is stark.

    It is not just a regional thing, either. Even look just within the state of Texas, where Austin is held up as a bastion of right thinking urbanism next to sprawlvilles like Dallas-Ft. Worth and Houston.

    Again, we see that Austin is far whiter than either Dallas-Ft. Worth or Houston.

    This raises troubling questions about these cities. Why is it that progressivism in smaller metros is so often associated with low numbers of African Americans? Can you have a progressive city properly so-called with only a disproportionate handful of African Americans in it? In addition, why has no one called these cities on it?

    As the college educated flock to these progressive El Dorados, many factors are cited as reasons: transit systems, density, bike lanes, walkable communities, robust art and cultural scenes. But another way to look at it is simply as White Flight writ large. Why move to the suburbs of your stodgy Midwest city to escape African Americans and get criticized for it when you can move to Portland and actually be praised as progressive, urban and hip? Many of the policies of Portland are not that dissimilar from those of upscale suburbs in their effects. Urban growth boundaries and other mechanisms raise land prices and render housing less affordable exactly the same as large lot zoning and building codes that mandate brick and other expensive materials do. They both contribute to reducing housing affordability for historically disadvantaged communities. Just like the most exclusive suburbs.

    This lack of racial diversity helps explain why urban boosters focus increasingly on international immigration as a diversity measure. Minneapolis, Portland and Austin do have more foreign born than African Americans, and do better than Rust Belt cities on that metric, but that’s a low hurdle to jump. They lack the diversity of a Miami, Houston, Los Angeles or a host of other unheralded towns from the Texas border to Las Vegas and Orlando. They even have far fewer foreign born residents than many suburban counties of America’s major cities.

    The relative lack of diversity in places like Portland raises some tough questions the perennially PC urban boosters might not want to answer. For example, how can a city define itself as diverse or progressive while lacking in African Americans, the traditional sine qua non of diversity, and often in immigrants as well?

    Imagine a large corporation with a workforce whose African American percentage far lagged its industry peers, sans any apparent concern, and without a credible action plan to remediate it. Would such a corporation be viewed as a progressive firm and employer? The answer is obvious. Yet the same situation in major cities yields a different answer. Curious.

    In fact, lack of ethnic diversity may have much to do with what allows these places to be “progressive”. It’s easy to have Scandinavian policies if you have Scandinavian demographics. Minneapolis-St. Paul, of course, is notable in its Scandinavian heritage; Seattle and Portland received much of their initial migrants from the northern tier of America, which has always been heavily Germanic and Scandinavian.

    In comparison to the great cities of the Rust Belt, the Northeast, California and Texas, these cities have relatively homogenous populations. Lack of diversity in culture makes it far easier to implement “progressive” policies that cater to populations with similar values; much the same can be seen in such celebrated urban model cultures in the Netherlands and Scandinavia. Their relative wealth also leads to a natural adoption of the default strategy of the upscale suburb: the nicest stuff for the people with the most money. It is much more difficult when you have more racially and economically diverse populations with different needs, interests, and desires to reconcile.

    In contrast, the starker part of racial history in America has been one of the defining elements of the history of the cities of the Northeast, Midwest, and South. Slavery and Jim Crow led to the Great Migration to the industrial North, which broke the old ethnic machine urban consensus there. Civil rights struggles, fair housing, affirmative action, school integration and busing, riots, red lining, block busting, public housing, the emergence of black political leaders – especially mayors – prompted white flight and the associated disinvestment, leading to the decline of urban schools and neighborhoods.

    There’s a long, depressing history here.

    In Texas, California, and south Florida a somewhat similar, if less stark, pattern has occurred with largely Latino immigration. This can be seen in the evolution of Miami, Los Angeles, and increasingly Houston, San Antonio and Dallas. Just like African-Americans, Latino immigrants also are disproportionately poor and often have different site priorities and sensibilities than upscale whites.

    This may explain why most of the smaller cities of the Midwest and South have not proven amenable to replicating the policies of Portland. Most Midwest advocates of, for example, rail transit, have tried to simply transplant the Portland solution to their city without thinking about the local context in terms of system goals and design, and how to sell it. Civic leaders in city after city duly make their pilgrimage to Denver or Portland to check out shiny new transit systems, but the resulting videos of smiling yuppies and happy hipsters are not likely to impress anyone over at the local NAACP or in the barrios.

    We are seeing this script played out in Cincinnati presently, where an odd coalition of African Americans and anti-tax Republicans has formed to try to stop a streetcar system. Streetcar advocates imported Portland’s solution and arguments to Cincinnati without thinking hard enough to make the case for how it would benefit the whole community.

    That’s not to let these other cities off the hook. Most of them have let their urban cores decay. Almost without exception, they have done nothing to engage with their African American populations. If people really believe what they say about diversity being a source of strength, why not act like it? I believe that cities that start taking their African American and other minority communities seriously, seeing them as a pillar of civic growth, will reap big dividends and distinguish themselves in the marketplace.

    This trail has been blazed not by the “progressive” paragons but by places like Atlanta, Dallas and Houston. Atlanta, long known as one of America’s premier African American cities, has boomed to become the capital of the New South. It should come as no surprise that good for African Americans has meant good for whites too. Similarly, Houston took in tens of thousands of mostly poor and overwhelmingly African American refugees from Hurricane Katrina. Houston, a booming metro and emerging world city, rolled out the welcome mat for them – and for Latinos, Asians and other newcomers. They see these people as possessing talent worth having.

    This history and resulting political dynamic could not be more different from what happened in Portland and its “progressive” brethren. These cities have never been black, and may never be predominately Latino. Perhaps they cannot be blamed for this but they certainly should not be self-congratulatory about it or feel superior about the urban policies a lack of diversity has enabled.

    Aaron M. Renn is an independent writer on urban affairs based in the Midwest. His writings appear at The Urbanophile.

  • Go to Middle America, Young Men & Women

    A few weeks ago, Eamon Moynihan reviewed economic research on cost of living by state in a newgeography.com article. The results may seem surprising, given that some of the states with the highest median incomes rated far lower once prices were taken into consideration. The dynamic extends to the nation’s 51 metropolitan areas with more than 1,000,000 population (See Table).

    There is a general perception that the most affluent metropolitan areas are on the east coast and the west coast. Indeed, 8 of the 10 metropolitan areas with the highest nominal per capita income in 2006 were on the two coasts. These included San Francisco, San Jose and Seattle on the west coast and Washington, Boston, New York, Hartford and Philadelphia on the east coast. Middle-America is represented by Denver and Minneapolis-St. Paul. However, as anyone who has lived on the coasts and Middle America knows, a dollar in New York or San Francisco does not buy nearly as much as a dollar in Dallas-Fort Worth or Cincinnati.

    Per Capita Income: Purchasing Power Parity
    US Metropolitan Areas over 1,000,000 Population
        2006 Per Capita Income  
    Rank Metroplitan Area Purchasing Power Adjusted Nominal Nominal Rank
    1 San Francisco $46,287 $57,747 1
    2 Washington $45,178 $51,868 3
    3 Denver $44,798 $44,691 8
    4 Minneapolis-St. Paul $44,326 $44,237 9
    5 Houston $42,815 $43,174 11
    6 Boston $42,571 $50,542 4
    7 Pittsburgh $41,716 $38,550 20
    8 St. Louis $41,613 $37,652 27
    9 Milwaukee $41,572 $39,536 19
    10 Baltimore $41,451 $43,026 12
    11 Seattle $41,448 $45,369 6
    12 Kansas City $41,329 $37,566 28
    13 Hartford $41,104 $44,835 7
    14 New Orleans $40,935 $40,211 16
    15 Philadelphia $40,725 $43,364 10
    16 Dallas-Fort Worth $40,643 $39,924 17
    17 Cleveland $39,997 $37,406 30
    18 Indianapolis $39,843 $37,735 26
    19 Chicago $39,752 $41,591 14
    20 Richmond $39,282 $38,233 22
    21 New York $39,201 $49,789 5
    22 Birmingham $39,057 $37,331 31
    23 Cincinnati $38,691 $36,650 36
    24 Nashville $38,680 $37,758 25
    25 Detroit $38,670 $38,119 24
    26 Charlotte $38,632 $38,164 23
    27 Miami $38,555 $40,737 15
    28 San Jose $38,505 $55,020 2
    29 Jacksonville $38,413 $37,519 29
    30 Louisville $38,262 $36,000 41
    31 Oklahoma City $38,156 $35,637 42
    32 Las Vegas $37,691 $38,281 21
    33 Salt Lake City $37,381 $35,145 45
    34 San Diego $37,358 $42,801 13
    35 Rochester $37,066 $36,179 38
    36 Columbus $37,058 $36,110 39
    37 Atlanta $36,691 $36,060 40
    38 Memphis $36,501 $35,470 44
    39 Tampa-St. Petersburg $36,260 $35,541 43
    40 Portland $36,131 $36,845 35
    41 Buffalo $36,091 $33,803 48
    42 Norfolk (Virginia Beach metropolitan area) $35,418 $34,858 46
    43 Raleigh $35,087 $37,221 32
    44 San Antonio $34,913 $32,810 50
    45 Providence $34,690 $37,040 34
    46 Austin $33,832 $36,328 37
    47 Phoenix $33,809 $34,215 47
    48 Sacramento $32,750 $37,078 33
    49 Los Angeles $32,544 $39,880 18
    50 Orlando $32,095 $33,092 49
    51 Riverside-San Bernardino $25,840 $27,936 51
    Source:        
    http://www.bea.gov/scb/pdf/2008/11%20November/1108_spotlight_parities.pdf

    Purchasing Power Parity: Things change rather dramatically when purchasing power is factored in. Some years ago, international economic organizations, such as the Organization for Economic Cooperation and Development, the World Bank and the International Monetary Fund began using costs of living by nation to compare national economic performance, rather than currency exchange rate. This practice, called “purchasing power parity” is based upon the recognition that there may be substantial differences in the cost of living between nations.

    This can be illustrated by comparing Switzerland and the United States. For years, Switzerland has had a higher per capita GDP than the United States on an exchange rate basis. Switzerland’s gross domestic product per capita was $53,300 in 2006, nearly 30% above that of the United States ($42,000). However price levels in Switzerland are so high that incomes do not go nearly as far as the exchange rate would suggest. Once adjusted for purchasing power parity, the Swiss GDP per capita in 2006 drops to $39,000, well below that of the United States. Much of the difference has to do with regulation. The more liberal economy of the United States produces a lower cost economy than in Switzerland, or for that matter most of Western Europe. The US economic advantage would be even greater measured on a household basis, since US households include nearly 10% more members (generally children) than those in Western Europe.

    The same concept was applied by the Department of Commerce Bureau of Economic Analysis researchers in their review of purchasing power parities between US metropolitan areas in 2006. When purchasing power is factored in, five of the top metropolitan areas in nominal per capita income (not adjusted for purchasing power) drop out and are replaced by other metropolitan areas rarely thought of as among the nation’s most affluent.

    Among the three west coast nominal leaders, San Francisco remains as #1, in both nominal and purchasing power adjusted per capita income. Seattle dropped from 6th to 11th position. However, the real surprise is San Jose, which dropped from 2nd position to 28th.

    The east coast regions ranked among the top 10 metropolitan areas in nominal income also were decimated by their high costs, with only Washington (which rose from 3rd to 2nd) and Boston (which fell from 4th to 6th) remaining. New York fell from 5th to 21st, Hartford from 7th to 13th and Philadelphia from 10th to 16th.

    The two non-coastal metropolitan areas in the nominal top 10 remain, with Denver rising from to 3rd and Minneapolis-St. Paul rising from 9th to 4th.

    It can be argued that Middle-America replaced the five metropolitan areas dropping out of the top ten. Houston, long one of the most disparaged metropolitan areas among urbanists, occupies the 5th position (compared to its 11th ranking in the nominal list). Three of the new entrants are confirmed members of the Rust Belt: Pittsburgh (7th), St. Louis (8th) and Milwaukee (9th). Finally, there is a new east coast entrant, blue-collar Baltimore (10th).

    The Impact of Taxes: But that is just the beginning. Taxes also diminish the purchasing power of households. Unfortunately, there is virtually no readily available information on state and local taxation by metropolitan area. There is, however state and local government taxation data at the state level. If it is assumed that this data is representative of metropolitan differences (weighted proportionately by state in multi-state metropolitan areas), there would be changes in rank among the top 10. Denver would displace Washington in the number two position, closing more than one-half the gap with San Francisco. Even more surprisingly, St. Louis would move ahead of both Boston and Pittsburgh to rank 6th. Kansas City would leap over #11 Seattle, Baltimore, Milwaukee and Pittsburgh to rank 8th, trailing #7 Boston by $25, not much more than the price of a Red Sox standing room ticket. Pittsburgh would occupy the #9 position and Milwaukee #10 (See Figure).

    More than Housing: The largest differences in purchasing power stem from housing, with east coast and west coast metropolitan areas having generally higher housing costs. As a result of the housing bust and the larger house price drops in those areas, purchasing power adjusted incomes could recover relative to those of Middle America. However, the high cost of living on the east and west coasts extend to more than housing prices. Generally, according to proprietary (and for sale) ACCRA cost of living data, the west coast and east coast metropolitan areas have higher costs of living even without housing. These differences are largely in grocery costs, which probably reflects the anti-big box store planning regulations and politics that exist in many of these areas. Grocery costs in the more affluent middle-American metropolitan areas tend to be lower.

    Other Surprises: Outside the top 10 most affluent metropolitan areas, there are other surprises. Urban planning favorite Portland ranks 40th, just above Buffalo. Rust Belt Cleveland ranks 17th, a few positions above New York. Kansas City, with its highly decentralized civic architecture, ranks 12th, just behind Seattle. Indianapolis (17th) is more affluent than Chicago (18th) and both are more affluent than New York.

    Five of the bottom 10 metropolitan areas are in the south, including Virginia Beach, Raleigh, Austin, San Antonio and Orlando. But perhaps the biggest surprise of all is that four of the five lowest ranking metropolitan areas are in the southwest: Phoenix (47th), Sacramento (48th), Los Angeles (49th) and Riverside-San Bernardino (51st).

    The Dominance of Middle America: But among the 10 most affluent metropolitan areas in the nation, six or seven may be counted as Middle-America (depending on how Baltimore is classified). Only three are from the original group that supplies 8 of the top metropolitan areas when purchasing power is not considered.


    Related articles:
    Gross Domestic Product per Capita, PPP: World Metropolitan Regions
    Gross Domestic Product per Capita, PPP: China Metropolitan Regions

    Photograph: Pittsburgh

    Wendell Cox is a Visiting Professor, Conservatoire National des Arts et Metiers, Paris. He was born in Los Angeles and was appointed to three terms on the Los Angeles County Transportation Commission by Mayor Tom Bradley. He is the author of “War on the Dream: How Anti-Sprawl Policy Threatens the Quality of Life.

  • Playing with the Big Boys: The Costs of Fruitless Passenger Rail Tours

    In these hard times the New Zealand public is somewhat excited about the travel costs incurred by our Government Ministers and MPs. Overseas travel attracts particular rage and fury.

    A particularly galling example is a proposal by Christchurch City Mayor Bob Parker, his CEO Tony Marryat, and an urban planner, to visit the US to investigate the performance of light rail in Los Angeles, San Francisco Bay Area, Seattle and Vancouver.

    These cities seem unlikely to provide any relevant information, if only because their populations are many times those of Christchurch, a metropolis of roughly 370,000 and a downtown population of a mere 8000. In comparison:

    • Los Angeles – 13.8 million
    • San Francisco/San Jose – 5.3 million
    • Seattle – 3.3 million
    • Vancouver – 2.1 million

    The reason the Christchurch team cannot investigate a rail system in the US serving a metropolitan area of only some 350,000 people, and with a CBD of only 8,000 people, may be that because so far, at least, even the most enthusiastic Smart Growth planners in the US are not that silly.

    Randal O’Toole, who has made many studies of urban rail systems, points out in “Unlivable Strategies” that spending money on expensive forms of rail transit is fundamentally inefficient because other transportation systems cost far less to build.

    Light rail, he argues, has become popular in the United States precisely because it is expensive. Congress gives transit grants to cities on a first-come, first-served basis. So the cities that build the most expensive transit systems get the largest share of federal transit funding.

    Naturally, dozens of cities are in line to get their share of the pork.

    But that does not prove that light rail is worthwhile. Too many cities have built expensive rail lines and then found that, due to overruns, high operations and maintenance costs, or heavy mortgages, they have to cut back bus service. The result is that rail construction has actually led to reduced transit ridership in many, if not most, cases.

    The Grand Tour: My Version

    Los Angeles and San Francisco Bay

    Here is what the Christchurch Mayor and his team should learn from their visits to the Los Angeles and San Francisco Bay.

    • Los Angeles reinforces the Portland experience (a much smaller city) where cost overruns forced Portland to raise bus fares and cut bus service during construction of its first light-rail line in the 1980s. As a result, a smaller proportion of Portlanders ride transit to work and other places today than did so in 1980. A similar situation in Los Angeles led to a 17 percent decline in transit ridership between 1985 and 1995. The NAACP sued the transit agency for cutting bus service in low-income neighborhoods while building rail to middle-class neighborhoods. The suit forced the agency to scale back its rail plans and restore bus service, which led to a recovery of ridership.
    • In the San Francisco Bay Area, due to heavy rail debt, San Jose was forced to drastically cut bus and rail service in 2001 and lost 35 percent of its riders. The transit system had to make further cuts in 2007.

      Furthermore, despite (or because of) several extensions of the BART line, transit ridership in the San Francisco Bay Area has fallen by more than 10 percent since 1982. Several transit advocacy groups, including the Sierra Club (Piper, 2004), the Bay Area Transportation and Land Use Coalition (BATLUC, 2003), and the Bay Rail Alliance (Carpenter, 2007), actively oppose a proposed extension of BART to San Jose because they know investments in other forms of transit are much more cost effective.

    Overall, US urban areas with rail transit have not fared as well as areas with bus transit. Between 1990 and 2000, the number of people in regions with rail transit who commute to work by transit actually declined, while the number in regions with bus-only transit systems increased.

    The saddest part of these stories is that the people who lose tend to be those most dependent on transit due to low incomes or an inability to drive, while the people who end up riding rail lines tend to have higher incomes and plenty of auto-mobility. (Winston and Shirley, 1998, p. 9).

    Rail transit actually represents a transfer of resource from the poor to the well-off – Robin Hood at work in reverse gear.

    Seattle

    After getting voter approval for rail transit in 1996, Sound Transit began operating 31 miles of commuter rail service between Tacoma and Seattle in 1999. It also built a 1.6-mile streetcar line in downtown Tacoma at a cost of $50 million a mile, a third more than planned. As of December, 2003, Sound Transit also operates a 35-mile commuter rail line from Everett to Seattle.

    Sound Transit’s Seattle-Tacoma commuter-rail line is one of the least productive in the nation, carrying less than one seventh as many passenger miles per route mile as the average commuter-rail line. As a result it has one of the highest operating costs per trip or per passenger mile of any commuter rail line. Despite starting out with free service, the Everett line has been running more than 70 percent empty.

    Transit’s growth in travel and market share is almost entirely due to bus transit, not rail transit. But the growth in the region’s congestion is due to decisions made early in the decade to concentrate on rail transit rather than highway construction. Those decisions have harmed Seattle area residents in many ways, including cost overruns, congestion, transit’s cost ineffectiveness, and housing prices.

    Future plans: The Sound Transit agency originally projected that the cost of building a 24-mile light-rail line from the Seattle-Tacoma airport to the University of Washington and Northgate would be $2.4 billion. Shortly after receiving voter approval, the agency increased this estimate to $3.6 billion.

    After many stops and starts, last year voters endorsed an $18 billion Sound Transit plan for a 53 mile network which they hope will attract 25,000 daily riders by 2030.

    Our Christchurch team should learn from the Seattle story that, once embarked upon, these rail plans tend to eat ever increasing amounts of money.

    Vancouver

    We can only wish them luck on getting useful information out of Vancouver. There seem to be no collections of the statistics on the performance of the transit systems as are available to US researchers here and here (Excel files).

    However, we do note that in 2008 the operating cost of the Translink Sky Trains was C$773,737,000 and this was ‘covered’ by C$359,911,000 of fares and advertising, $262,298,000 motor fuel taxes,$255,741,000 property tax, parking site taxes $8,758,000 and others of $33,313,000.

    So the transfers from motorists and property owners are greater than the fare revenues.

    In 2008 the Long-term debt was C$1,822.7 million.

    Grand Plans

    Christchurch Mayor and his team are presumably looking at these rail systems as a means of supporting their Smart Growth plans for the Greater Christchurch area.
    If the Mayor and his team ask the right questions, and collect the right data, it will be evident to Blind Freddy’s dog that if these boondoggle systems have failed in these major cities, with their major concentrations of employment, then there is no way that light rail can provide a cost effective and efficient service to Christchurch and its environs.

    Sorry about that. Enjoy the trip.

    Owen McShane is Director of the Centre for Resource Management Studies, New Zealand.

  • The Geography of Class in Greater Seattle

    Most readers may not be initially very interested in the detailed geography of “class” in Seattle, but it actually matters not only for our area but for the whole debate over the shape of the urban future. Academics, perhaps Americans in general, are loath to admit to class differences, yet they remain very crucial to the understanding of how cities and regions evolve.

    Seattle is a great example of the transformation of a 20th century model of the American metropolis to a 21st century-cum-19th century “old World” model of metropolis. It is often held up as one of the role models for other cities, so its experiences should be considered seriously not only for American cities but for regions throughout the advanced world.

    Many readers, including those afflicted with political correctness, probably many upper and lower class folk uncomfortable with their home areas being labeled as of a particular class, or others, might feel that class is an obsolete Marxist term. They may prefer I use the safer term “socio-economic status” rather than “class.” Let’s admit it: “class” is used widely, as in “the middle class is getting squeezed” or the “tax burden on the lower classes.” As it has been for hundreds of years, class remains a meaningful descriptor of areas of obviously differing well-being.

    We should understand by identifying upper or middle or lower classes this does not imply “better than.” Class simply reflects the mix of inheritance, education, biology, experience, discrimination, and life events that lead to variability in economic well-being. Class is real. But there is certainly a legitimate concern with the identification of heterogeneous areas like census tracts as of a particular class, based on average or median values for the in fact diverse households in a tract. This method is far from perfect but nevertheless we and others find such generalization common, meaningful and useful.

    This map plots “factor scores,” a statistically constructed variable or index divided into six levels of “class:” two upper, two middle and two lower. It is timely to do this, since it was 50 years ago when Calvin Schmid, demographer in Sociology at the University of Washington, and my early mentor, performed a pioneering factor analysis of crime in Seattle – and this was before modern computers! The derived scores most reflect high weighting of the variables: percent of adults with a BA or more, percent in professional versus laboring occupations, median house value and median household income.

    As you look at the map, it’s clear how Seattle reflects very strongly what is generally described as gentrification. This means the reclaiming of the central core by the highly educated and professional, eschewing the suburban metaphorical desert. In the case of Seattle, this process occurring between 1985-2005 resulted in the displacement of over 50,000 less affluent and often minority households to south King county. The city begins to resemble the historic pattern of the rich and important occupying the vibrant core of the city, relegating the working poor to the suburbs, with poor access and inadequate services. Indeed, even now I am involved in a project to assess the lack of access of poor children, often minority or foreign born, to health care in south King county.

    The dominant “upper class” area is the Eastside, east of Lake Washington, and location of the affluent “edge city” of Bellevue, home of the Microsoft campus. A second set of upper class areas are waterfront and view neighborhoods, taking advantage of the Seattle area’s broken topography. The third is simply the University of Washington immediate hinterland. I suspect the location of a large research university with 42,000 students and 22,000 staff increasingly propels Seattle’s unusually high status, income and popularity. I think this is increasingly more important a factor than the presence of an increasingly less important downtown Seattle business center.

    Conversely, lower class areas include traditional zones of mixed housing, industry and transport, such as south Seattle, the older satellite cities of Everett (north), Bremerton (west), and especially Tacoma (south). The largest area of lower class neighborhoods extends from south Seattle through south King county to Tacoma, marked by historical development, displacement from Seattle and high minority population. The second large zone of lower class settlement is the rural fringe, especially in Pierce (south) and Snohomish (north) counties, and may surprise those who think all rural areas are the home of rich estates.

    Then there is the middle class. This is where the suburbs matter most. On the map, middle class areas (yellow and green) are intermediate in location as well and dominate the outer suburban areas as well as some older inner neighborhoods of Seattle and Tacoma. It is unfortunately true that race, ethnicity and class remain highly correlated especially within the core cities of Seattle and Tacoma, reflecting the continuing history of unequal education and job preparation and prospects.

    This analysis suggests one possible future of urban development following something of a European model, with most middle class people in the suburbs, while the rich and poor concentrate either in the urban core or in selected locales in the periphery. As for the city itself, it’s clear that the total landscape is not simply becoming wealthier but increasingly bifurcated between the affluent and the long-term poverty population. And suburbia, home to the vast majority of the region’s population remains the predominant home of the middle and working classes, with pockets of both wealth and poverty.

    Richard Morrill is Professor Emeritus of Geography and Environmental Studies, University of Washington. His research interests include: political geography (voting behavior, redistricting, local governance), population/demography/settlement/migration, urban geography and planning, urban transportation (i.e., old fashioned generalist)