Tag: Silicon Valley

  • President Obama Courts Silicon Valley’s New Digital Aristocracy

    President Obama’s San Francisco fundraiser with the tech elites today, along with the upcoming IPO for Facebook, marks the emergence of a new, potentially dominant political force well on its way to surpassing Hollywood and even Wall Street as the business bulwark of the Obama Democratic Party.

    In 2008 the industry gave Obama more than $9 million, three times what it raised for any other politician; it was the first time the digerati outspent Hollywood. The numbers will surely go up this year.

    “The Facebook instant millionaires and billionaires are about all Democrats,” said Morley Winograd, a longtime California Democratic activist and chronicler of information-age politics. “There’s an enormous amount of power residing there—and it will only get greater.”

    Even when they’ve competed with and acted like more established power brokers, the digital ruling class are treated with kid gloves compared to other wealthy elites, rarely suffering the disdain aimed at amoral bankers and at Hollywood’s general venality. Instead, the creators of our iPhones, social networks and Twitter accounts are held up as tool makers and business titans. That esteem is most pronounced among millenials, 75 percent of whom use social media, more than twice the percentage for boomers, according to Pew. When asked what makes their generation “unique,” the most common answer to the open-ended question is technology.

    Those who will benefit most from Facebook and other IPOs resemble the “one percent” about as much as Wall Street.

    In effect, it’s OK to be in the “1 percent”—or even the .0001 percent—if you develop nifty devices and invest in green companies. "We live in a bubble, and I don’t mean a tech bubble or a valuation bubble. I mean a bubble as in our own little world," Google chairman Eric Schmidt recently told the San Francisco Chronicle. "And what a world it is: companies can’t hire people fast enough. Young people can work hard and make a fortune. Homes hold their value. Occupy Wall Street isn’t really something that comes up in daily discussion, because their issues are not our daily reality."

    For their part, the “Occupiers” who struggled mightily to shut down the blue-collar Port of Oakland seem to never have considered an action against the pampered techies at Facebook’s lavish campus.

    The new plutocrats are unburdened by the obligations that come with existing large institutions; with no union presence, they don’t have to worry about anxious retirees or redundant older workers. Green pet causes that align with their financial interests buy more cover from the left, while conservatives, who rarely see anything wrong with extreme wealth, seem somewhat unconscious about the political orientation of the emerging new elite. Ninety-two percent of Facebook executive donations so far this year went to Democrats. This exceeds even the rock-solid support the Democrats enjoy among more established firms like Google and Apple, where support for Democrats runs to the high 80s. Although its former CEO, Meg Whitman, ran as the Republican candidate for governor in 2010, 96 percent of eBay-associated donations went to Democrats. The Seattle area’s two top digital firms, Amazon and Microsoft make two thirds or more of their donations to Democrats.

    The Obama administration’s opposition to the anti-piracy bills SOPA and PIPA came despite intense lobbying for the bill by his party’s long-time allies in Hollywood. Whatever the bills’ failings, their defeat also formally introduced the new power of the digerati moguls and their millions of followers. The presence of Steve Jobs’s wife, Lauren, as Michelle Obama’s guest at the State of the Union speech further cemented the ever-closer ties between the valley’s upper echelon and the president’s party.

    In California, the alliance between progressive Democrats and high tech is palpable. The digital elite has been a consistent backer of Gov. Jerry Brown’s jihad on greenhouse gases, helping finance the campaign against a 2010 measure intended to reform state’s draconian and likely job-killing energy and land-use laws. Google has emerged both as a key backer of the state’s climate-change politics and sought to profit by investing nearly a billion dollars in renewable-energy companies. These firms in turn depend on the state’s strict mandates on utilities to use “green” electricity for their revenues. It’s no coincidence that prominent valley VCs have been particularly active in alternative-energy firms such as Solyndra.

    Brown and the Democratic Party increasingly have come to regard these companies as a potential source of fiscal salvation for the perennial cash-short state. As the Golden State has banked on the valley, the tech firms have become ever more indispensable and now are even dipping their toes in the grubby waters of municipal politics, helping finance the campaign of San Francisco Mayor Ed Lee—who generously concocted new tax breaks for local firms such as Twitter and Zynga.

    The leftward shift by tech firms is a fairly recent development. In the 1970s and 1980s, the formative period for Silicon Valley, the area was politically contested. Valley constituencies routinely sent to Congress moderate Republicans like Pete McCloskey, Ed Zschau, and Tom Campbell. Today the GOP is virtually absent from the valley at all levels of government.

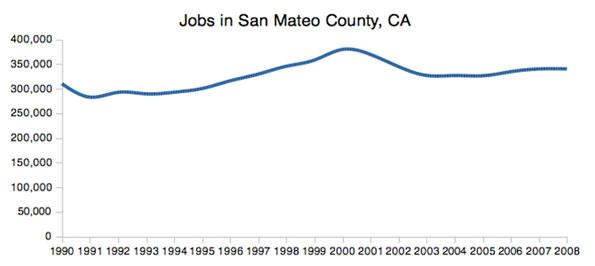
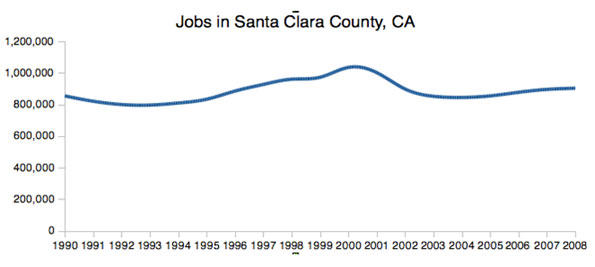
    Some old-line companies, like Hewlett-Packard and Intel, still tend to be fairly evenhanded in their political donations, but they are increasingly rare. Long-time valley maven Leslie Parks explains that the shift came as the Valley’s economy changed. In the 1980s and 1990s—the area’s greatest period of growth—its roots stood solidly in high-tech manufacturing. Now it focuses almost exclusively on product design and information: software, search, and social media. Over the past decade the San Jose area lost one third of its industrial workforce while the neighboring San Francisco region lost some 40 percent—the largest consistent loser among the nation’s 51 metropolitan areas.

    High-tech firms once concerned themselves with many of the same things as other manufacturing companies. They worried about electricity rates, obtrusive environmental legislation, high housing prices, and dysfunctional public education. Many naturally supported Republicans, or business-oriented Democrats.

    But as tech separated from industry, the valley moved leftward.

    Today’s digital aristocrats manufacture virtually nothing here; anything made in volume is produced outside California and usually out of the country. Software-based firms don’t worry about energy costs, since they can simply place their heavy user server farms in places like the Pacific Northwest with low electricity rates. They do not use much in the way of toxic chemicals or groundwater, making it easier to avoid scrutiny and harassment from California’s hyper-aggressive environmental regulators. Because they rely on an increasingly narrow band of highly educated employees from elite schools, the secular decline of the state’s higher education system hardly impacts them. And as many of their employees are young and tend to buy houses after collecting the spoils of an IPO, even high housing costs and poor public K-12 education don’t matter much.

    The growing diversity of the valley has also helped the Democrats. Although relatively few Latinos or African-Americans work in the new companies, new immigrants from Asia and the Middle East and their offspring abound. “You had a big change in diversity, and let’s face it the Republicans do not do well with diversity,” said Parks, who is Japanese-American. “The Democrats, particularly Obama, recognized appealing to these people was a necessity.”

    Many who celebrate this emerging power elite are still slow to recognize that they are in these company’s sights. As we become more dependent on internet based news and entertainment, cultural power is migrating away from New York publishers and Los Angeles studios towards Palo Alto and Menlo Park. Old-line media firms such as newspapers, book companies and the major networks may find themselves overmatched.

    This growing power may do more to concentrate economic power than any development since the Second World War. With their stockpile of personal data on their hundreds of millions of users, firms like Google and Facebook could prove the biggest threat to privacy since Big Brother. As Jason Lanier, a scholar-at-large at Microsoft Research, noted in a recent New York Times op-ed piece, the same companies that led the fight to keep the Internet “free” want to sell hundreds of billions of dollars in advertising built from that free, user-provided information.

    While the old valley empowered people by supplying technology, says Chicago law professor Lori Andrews, social-media firms instead leverage our personal information into fodder for not just advertisers but people reviewing job applications, medical records, and more.

    What’s more, the dominant firms are rapidly becoming oligopolies. In the old days, valley companies battled over everything from semiconductor chips and disk drives to servers and operating systems. In contrast, today’s digital industry tends to gravitate to the best-financed (usually by venture capital) and most well-connected companies. Microsoft, for example, still controls 90 percent of the operating-system-software industry; Facebook is likely to continue with a 60 percent to 70 percent share of the social-media marketplace. Google enjoys a higher than 80 percent share in search.

    This is a degree of control that exists in few older industries. Like the railroads of the old robber barons, those few firms who control the limited number of digital platforms can limit the profitability of smaller would-be competitors—and could end up slowing the rate of innovation in order to maintain their own positions. They may wear T-shirts to work, but the tycoons of Silicon Valley are, in some respects, J.P. Morgan’s true heirs.

    Populism may now be de rigeur inside of the Democratic Party, but the world being created by the new digital haute bourgeoise is anything but social democratic. Parks notes that the lower end of the valley economy, like janitors or food-service workers, generally labor for flinty-eyed outside contractors so they share as little as possible of the wealth collected by higher-skilled employees.

    Even Silicon Valley’s geography is increasingly unfriendly to the mass middle class, much less the aspiring working class. Due largely to strict land-use regulations, median housing costs, even adjusted for income, are among the highest in the nation, more than twice as high as those in places like Raleigh, Salt Lake City, Houston. or Dallas. With a 2,300-square-foot home in Palo Alto going for nearly $1.8 million, the digital heartland is largely off limits for most of us.

    Those who will benefit most from Facebook and other IPOs resemble the “1 percent” about as much as Wall Street. They may see themselves as “progressive,” but they create few broad-based opportunities for members of the middle and working class. A bit of their wealth may trickle down to Democratic politicians, but the rest of us, as dependent as we have become on their technology, have reaped little financial benefit from them. Whatever the value of their creative efforts, the new digital aristocracy’s political ascendency threatens both the populist roots of the Democratic Party and perhaps the delicate social balance of our Republic as well.

    This piece originally appeared in TheDailyBeast.

    Joel Kotkin is executive editor of NewGeography.com and is a distinguished presidential fellow in urban futures at Chapman University, and contributing editor to the City Journal in New York. He is author of The City: A Global History. His newest book is The Next Hundred Million: America in 2050, released in February, 2010.

    Official White House Photo by Pete Souza.

  • The Best Cities For Technology Jobs

    During tough economic times, technology is often seen as the one bright spot. In the U.S. this past year technology jobs outpaced the overall rate of new employment nearly four times. But if you’re looking for a tech job, you may want to consider searching outside of Silicon Valley. Though the Valley may still be the big enchilada in terms of venture capital and innovation, it hasn’t consistently generated new tech employment.

    Take, for example, Seattle. Out of the 51 largest metro areas in the U.S., the Valley’s longtime tech rival has emerged as our No. 1 region for high-tech growth, based on long- and short-term job numbers. Built on a base of such tech powerhouses as Microsoft, Amazon and Boeing, Seattle has enjoyed the steadiest and most sustained tech growth over the past decade. It is followed by Baltimore (No. 2), Columbus, Ohio (No. 3), Raleigh, N.C. (No. 4) and Salt Lake City, Utah (No. 5).

    To determine the best cities for high-tech jobs, we looked at the latest high-tech employment data collected by EMSI, an economic modeling firm. The Praxis Strategy Group‘s Mark Schill charted those areas that have gained the most high-tech manufacturing, software and services jobs over the past 10 years, equally weighting the last five years and the last two. We also included measures of concentration of tech employment in order to make sure we were not giving too much credence to relatively insignificant tech regions. Our definition of high tech industries is based on the one used by TechAmerica, the industry’s largest trade association.

    Despite the Valley’s remarkable concentration of tech jobs — roughly six times the national average — it ranked a modest No. 17 in our survey. This relatively low ranking reflects the little known fact that, even with the recent last dot-com craze sparking over 5% growth over the past two years, the Valley remains the “biggest loser” among the nation’s tech regions, surrendering roughly one quarter of its high -tech jobs — about 80,000 — in the past decade. Only New York City (No. 44) lost more tech jobs during that time.

    In contrast to this pattern of volatility, our top performers have managed to gain jobs steadily in the past decade — and have continued to add new ones in the last two years. In addition to our top five, the only other regions to claim overall tech gains in the last 10 years are Jacksonville, Fla. (No. 6), Washington, D.C. (No. 7), San Bernardino-Riverside, Calif. (No. 9), San Diego, Calif. (No. 9), Indianapolis (No. 11) and Orlando, Fla. (No. 24).

    So what accounts for high-tech success, and where will jobs most likely grow in the next decade? Certainly being home to a major research university makes a big difference. Seattle, Columbus, Raleigh and Salt Lake City all boast major educational and research assets.

    But it’s one thing to produce scientists and engineers; it’s another to generate employment for them over the long term. Clearly for the San Jose metropolitan region (which is home to Stanford) and the much-hyped No. 29 San Francisco area (home to the University of California Medical Center) academic excellence has not translated into steady growth in tech jobs. Over the past decade the Bay Area has given up 40,000 jobs, or 19% of its tech workforce, including a loss of nearly 6,000 in software publishing.

    Or look at the Boston region (ranked No. 22), which arguably boasts the most impressive concentration of research universities in the country. The region did add jobs in research and computer programming, but these were not enough to counter huge losses in telecommunications and electronic component manufacturing. Over the past decade, greater Beantown has given up 18% of its tech jobs, or more than 45,000 positions.

    One possible explanation may lie in costs, including very high housing prices, onerous taxes and a draconian regulatory environment. In tech, company headquarters may remain in the Valley, close to other headquarters and venture firms, but new jobs are often sent either out of the country or to more business friendly regions.

    Just look at the flow of jobs from Bay Area-based companies to places like the Salt Lake area. In the past two years Valley companies such as Twitter, Adobe, eBay, Electronic Arts and Oracle have all expanded into Utah. This region has many appealing assets for Bay Area companies and workers. Salt Lake City is easily accessible by air from California, possesses a well- educated workforce, has reasonable housing costs and offers world-class skiing and other outdoor activities.

    Another huge advantage appears to be closeness to the federal government, which expends hundreds of billions on tech products both hardware and software. This explains why Baltimore, primarily its suburbs, and the D.C. metro area have enjoyed steady tech growth and, under most foreseeable scenarios, likely will continue to do so in the coming years. Both regions have seen large gains in technology services industries, particularly programming, systems design, research, and engineering.

    Yet even business climate, while important, may not be enough to drive tech job growth. Texas ranks highly in most business surveys, including our own, but it did not fare so well in this one. Indeed No. 32 Austin, often thought as the most likely candidate for the next Silicon Valley, lost over 19% of its high-tech jobs over the past decade, including more than 17,000 jobs in semiconductor, computer and circuit board manufacturing. No. 18 Houston did far better, although it has also lost 6% of its tech jobs over the same period due to the cutbacks in the engineering service, a big sector there. Even more shocking: No. 46 Dallas, generally a job-creating dynamo, has seen roughly a quarter of its high-tech jobs go away, due primarily to losses in telecommunications carriers and in manufacturing of communications equipment and electronics.

    How about other potential up and comers for the coming decade? Two potentially big and somewhat surprising winners. The first: Detroit. Though the Motor City area lost 20% of its tech jobs in the past decade (ranking 40th on our list), it still boasts one of the nation’s largest concentrations of tech workers, nearly 50% above the national average. In the past two years, the region has experienced a solid 7.7% increase in technology jobs, the second highest rate of any metro area.

    The Motor City region seems to have some real high-tech mojo. According to the website Dice.com, Detroit has led the nation with the fastest growth in technology job offerings since February — at 101%. This can be traced to the rejuvenated auto industry, which is increasingly dependent on high-tech skills. Manufacturing is increasingly prodigious driver of tech jobs; games and dot-coms are not the only path to technical employment growth. This could mean good news for other Rust Belt cities, such as No. 28 Cincinatti or No. 38 Cleveland, as well as our Midwest standout, Columbus, which could benefit from growth sparked by the local natural gas boom.

    Another potential standout is No. 8 New Orleans, whose tech base remains relatively small but has expanded its tech workforce nearly 10% since 2009 — the highest rate of any of the regions studied. With low costs, a friendly business climate and world-class urban amenities, the Crescent City could emerge as a real player, aided by the growing prominence of research and development around Tulane University. There has also been a recent growing presence of the video game industry in the city.

    Looking forward, however, it makes sense to be cautious about where tech is heading. By its nature, this is a protean industry; the mix of jobs and favored locales tend to change. If the current boom in social media continues, for example, the Bay Area could recover more of its lost jobs and further extend its primacy. Similarly a surge in manufacturing and energy-related technology could be a boon to tech in Houston, Dallas as well as New Orleans. But based on both historic and recent trends, the surest best for future growth still stands with our top five winners, led by the rain-drenched, but prospering Seattle region.

    Best Places for High Tech Growth
    Ranking of 2, 5, and 10 year growth, industry concentration, and 5 and 10 year growth momentum
    Rank Metropolitan Area Rank Score
    1 Seattle  82.2
    2 Baltimore 75.7
    3 Columbus 67.9
    4 Raleigh 63.2
    5 Salt Lake City 60.0
    6 Jacksonville 59.2
    7 Washington, DC 58.9
    8 New Orleans 58.8
    9 Riverside-San Bernardino 58.2
    10 San Diego 56.1
    11 Indianapolis 55.9
    12 Buffalo 55.8
    13 San Antonio 54.0
    14 Charlotte 53.5
    15 St. Louis 51.6
    16 Pittsburgh 50.8
    17 San Jose 50.5
    18 Houston 50.2
    19 Hartford 50.0
    20 Nashville 49.6
    21 Providence 49.2
    22 Boston 48.3
    23 Minneapolis-St. Paul 48.3
    24 Orlando 48.1
    25 Portland 48.1
    26 Philadelphia 47.4
    27 Louisville 47.2
    28 Cincinnati 46.6
    29 San Francisco 46.6
    30 Denver 46.4
    31 Richmond 45.6
    32 Austin 45.1
    33 Atlanta 44.6
    34 Virginia Beach-Norfolk-Newport News 42.4
    35 Memphis 42.2
    36 Milwaukee 41.5
    37 Rochester 41.2
    38 Cleveland 40.9
    39 Phoenix 38.5
    40 Detroit 37.7
    41 Tampa 37.5
    42 Miami 33.2
    43 Sacramento 32.1
    44 New York 31.4
    45 Las Vegas 31.2
    46 Dallas-Fort Worth 31.0
    47 Chicago 30.2
    48 Los Angeles 29.5
    49 Oklahoma City 26.7
    50 Birmingham 23.5
    51 Kansas City 21.6
    Rankings measure employment in 45 high technology manufacturing, services, and software industry sectors.

    This piece first appeared at Forbes.com.

    Joel Kotkin is executive editor of NewGeography.com and is a distinguished presidential fellow in urban futures at Chapman University, and an adjunct fellow of the Legatum Institute in London. He is author of The City: A Global History. His newest book is The Next Hundred Million: America in 2050, released in February, 2010.

    Mark Schill of Praxis Strategy Group perfomed the economic analysis for this piece.

    Seattle photo courtesy of BigStockPhoto.com.

  • Silicon Valley Can No Longer Save California — Or The U.S.

    Even before Steve Jobs crashed the scene in late 1970s, California’s technology industry had already outpaced the entire world, creating the greatest collection of information companies anywhere. It was in this fertile suburban soil that Apple — and so many other innovative companies — took root.

    Now this soil is showing signs of exhaustion, with Jobs’ death symbolizing the end of the state’s high-tech heroic age.

    “Steve’s passing really makes you think how much the Valley has changed,” says Leslie Parks, former head of economic development for the city of San Jose, Silicon Valley’s largest city. “The Apple II was produced here and depended on what was unique here. In those days, we were the technology food chain from conception to product. Now we only dominate the top of the chain.”

    Silicon Valley’s job creation numbers are dismal. In 1999 the San Jose-Sunnyvale-Santa Clara area had over 1 million jobs; by 2010 that number shrank by nearly 150,000. Although since 2007 and early 2010 the number of information jobs has increased substantially — up roughly 5000 to a total of 46,000 — the industrial sector, which still employs almost four times as many people as IT, lost around 12,000. Overall the region’s unemployment stands at 10%, well above the national average of 9.1%.

    This is partly because Apple, Intel and Hewlett-Packard have shifted their production — which offered jobs to many lower- and medium-skilled Californians — to other states or overseas. With its focus just at the highest end, the Valley no longer represents the economically diverse region of the 1970s and 1980s. Indeed, it increasingly resembles Wall Street — with a few highly skilled employees and well-placed investors making out swimmingly.

    “Silicon Valley has become hyper-efficient; the region doesn’t create jobs anymore,” says Tamara Carleton, a locally based fellow at the Foundation for Enterprise Development. “In terms of revenue per employee, Facebook’s ratio is unprecedented. Even Apple hasn’t grown significantly this last decade, despite the successful launch of many products and services. While commendable, greater efficiency doesn’t put more jobs in the California economy.”

    This “hyper-efficiency” can be seen in the real state of the valley’s industrial/flex space market. The overall industrial vacancy rate remains 14%, two points higher than in 2009. Areas close to Stanford, such as Palo Alto and Mountain View, have done well, but others on the periphery, such as Gilroy, Milpitas and Fremont, and even parts of San Jose have vacancies reaching over 20%.

    California’s other high-tech centers, with the possible exception of San Diego, are doing worse. The state has been losing high-tech employment over the past decade, while such employment has surged not only in China and Korea, but also in competitor states such as Texas, Virginia, Washington and Utah. According to the annual Cyberstates study, California lost more high-tech jobs — about 18,000 — last year than any other state.

    California’s political leaders, particularly Democrats, still genuflect toward the Valley for economic salvation and job growth. But social media has not proved a jobs-creating dynamo, and it’s clear that the highly subsidized, venture backed “green economy” has floundered miserably and faces a less than rosy future.

    You can feel pride, as an American and Californian, in the legacy of the likes of Steve Jobs but also believe our future cannot be salvaged by high-tech alone. Many of the country’s greatest assets, for example, are physical; in California these include the best climate for any advanced region in the world, fertile soil, a prime location on the Pacific Rim and potentially huge fossil fuel energy reserves, which give it enormous competitive advantages.

    The green theocracy now in control of Sacramento, however, has little interest in these aspects of California. It may prove difficult, if not impossible, to modernize the ports of Los Angeles and Long Beach, prolific sources of good-paying white and blue collar jobs. These ports will soon face increased competition for Asian trade from Gulf and south Atlantic locales eagerly waiting for the 2014 widening of the Panama Canal.

    Administration officials such as Energy Secretary Steven Chu also slate the state’s agriculture for demise by climate change. But just in case he’s wrong, we should note that California’s agriculture — despite green attempts to cut off its water supply — accounts for 40% of state exports. It generates $12.7 billion annually in overseas sales and employs over 400,000 people directly and many thousands more in marketing, processing and warehousing.

    Similarly, California boasts some of the nation’s richest deposits of oil and gas, not only on its sensitive and politically nettlesome coast but along the coastal plains and in the Central Valley. The most recent estimates of the state’s reserves, according to the Energy Information Agency, include nearly 3 billion cubic feet of natural gas and more than three billion barrels of oil, roughly the same as Alaska and more than booming North Dakotas.

    Geologists and wildcatters, usually ahead of the game, believe we have touched only a small part of the state’s energy potential. Some discuss new oil shale discoveries, particularly in the Monterey region, that could dwarf even the massive Bakken find in North Dakota. “If you were in Texas,” quipped economist Bill Watkins to an audience in the hard-hit central California town of Santa Maria, a predominately Latino town north of Santa Barbara, “you’d be rich.”

    A judicious and carefully planned expansion of these resources, particularly in the less populated interior areas, could provide tens of thousands of high-paying jobs. It would also funnel desperately needed revenue to the state. At the same time, such development could forestall much higher energy costs, one of the things driving manufacturers in the state to move elsewhere.

    California is unlikely to take advantage of its physical bounty; its leadership seems to lack enthusiasm for any industrial expansion outside of the “green” economy. Industrial parks across the state are emptying, more houses go into foreclosure and local governments wither on the vine. Unless California begins to take its own economy seriously, it will continue to devolve from the aspirational place that produced not only Steve Jobs but scores of entrepreneurs in everything from movies and oil to agriculture and aerospace.

    The Valley itself will likely do fine. Steve Jobs helped cement the position of Santa Clara Valley as the epicenter of the high-tech world. But this accomplishment does relatively little for the rest of California. What we will miss will not only be Steve Jobs’ creative contributions, but how clearly his opportunistic, entrepreneurial spirit has ebbed away from the Golden State.

    This piece originally appeared at Forbes.com.

    Joel Kotkin is executive editor of NewGeography.com and is a distinguished presidential fellow in urban futures at Chapman University, and an adjunct fellow of the Legatum Institute in London. He is author of The City: A Global History. His newest book is The Next Hundred Million: America in 2050, released in February, 2010.

    Shanghai photo by flickr user acaben

  • Is The Information Industry Reviving Economies?

    For nearly a generation, the information sector, which comprises everything from media and data processing to internet-related businesses, has been ballyhooed as a key driver for both national and regional economic growth. In the 1990s economist Michael Mandell predicted cutting-edge industries like high-tech would create 2.8 million new jobs over 10 years.  This turned out to be something of a pipe dream. According to a recent 2010 New America Foundation report, the information industry shed 68,000 jobs in the past decade.

    Yet this year, information-related employment finally appears to be on the upswing, according to statistics compiled by Pepperdine University economist Michael Shires. The impact of this growth is particularly marked in such long-time tech hot beds as Huntsville, Ala., Madison, Wis., and San Jose-Sunnyvale-Santa Clara, Calif., in the heart of Silicon Valley, all of which have relatively high concentrations of such jobs.

    The San Jose area, home of Silicon Valley, arguably has benefited the most from the  information job surge. Much of this gain can be traced to the increase in social networking sites such as Facebook, LinkedIn and Twitter, all of which have been incubated in the Valley. Good times among corporations  have led many to invest heavily in software productivity tools, while those marketing consumer goods have boosted spending for software and internet-related advertising.

    The 5,000 mostly well-paying information jobs added this year was enough to boost San Jose’s standing overall among all big metros 20 places to a healthy No. 27 in our ranking of the best cities for jobs.

    But as economists enthuse over the tech surge, we need to note the limitations of information jobs even in the Valley. Software and internet jobs, which have increased 40% over the past decade, have not come close to making up for the region’s large declines in other fields, notably manufacturing, construction, business and financial services. Overall, the region has lost 18% of its jobs in the past decade — about 190,000 — the second-worst performance, after Detroit, among the nation’s largest metros. It still suffers unemployment of close to 10%, well above the national average of 9.0%.

    This dual reality can also be seen in the local real estate industry. Office vacancies may be back in the low single digits in some markets popular with social networking firms, such as Mountain View, but they remain around 14 or higher throughout the region — 40% higher than in 2008. No matter how impressive reporters find a new headquarters for high-fliers like Facebook, the surplus of redundant space, particularly in the southern parts of the Valley, suggest we are still far from a 1990s style boom.

    Some observers also warn that the long-term prospects for the Valley may not be as good as local boosters assume.  Analyst Tamara Carleton cites many long-term factors — like the financial condition of local cities and diminishing prospects for less skilled workers — that make it tougher on those who live below the higher elevations of the information economy. She also says that a precipitous decline in foreign immigration could slow future innovation.

    This dichotomy is even more evident in the other big information gainer among our large cities, Los Angeles. Although it is little known by the media or pundit class, the Big Orange actually boasts the nation’s single largest number of information jobs. Its over 5% growth in information jobs translates to roughly 10,000 new positions over the past year. In LA, the big sector for information jobs is likely not social media but traditional entertainment, one of the area’s core industries.

    Yet information growth clearly is not bailing out the overall economy. Other much larger sectors, such as manufacturing and business services, continue to shrink. The area still suffers from an unemployment rate of roughly 12%.

    Other information winners among our large metros include Boston and Seattle, both traditional centers for software-related jobs. These areas have not been as hard-hit by the real estate and industrial declines as their California counterparts, so increasing information employment does not constitute the outlier that we see in the Golden State.

    Less expected gains were notched by some of our other big information sector winners. One big surprise was New Orleans-Metairie-Kenner, whose information sector, including a growing film and television industry, expanded almost 39% in past year. As is the case with its strong overall rankings in our best cities survey, the Big Easy’s comeback from the devastation of Katrina is heartening. But we must curb our enthusiasm by pointing out that total regional employment remains 100,000 less than it was before the hurricane.

    Equally intriguing has been the strong performance of Warren-Troy-Farmington, Hills, Mich., and Detroit-Livonia, each of which has benefited from the resurgence of the American auto industry. In these areas, information jobs tend to be tied to the needs of large industrial companies. The state has also waged a major campaign for film and television jobs, as part of an attempt to diversify its economy.

    Yet for all the hype that surrounds industries like media and software, it’s critical to point out that overall this is not a huge employment sector. Even in Seattle — home to Microsoft, Amazon and other software based companies — information jobs account for barely 6% of the total. In Los Angeles, it’s 5%, compared with 10% each for manufacturing and hospitality. In media-centric New York, information accounts for barely 4% of jobs, less than half that of financial services and one-third that of the huge business service sector.

    In most other areas, including those experiencing strong growth, information jobs constitute an even smaller part of the economy. In New Orleans, Warren, Mich., and Detroit, such jobs account for less than 2% of employment . Still, the growth of this sector is a promising one for  economies that have long been dominated, like New Orleans, by the generally low-paying hospitality industry, or in the case of the Michigan cities, the volatile and often chronically hurting manufacturing sector.

    The increase in information jobs, however welcome, should not be sold as a universal elixir for  creating widespread prosperity. Over time, strong regional economies are those that rely on diverse employment sources rather than one.  Growth in high-tech and media jobs can wow impressionable reporters and earn economic developers bragging reights, but they can do only so much to lessen the recession’s impact on the vast majority of workers and the broader regional economy.

    Top Cities for Information Job Growth, 2009-2010
    New Orleans-Metairie-Kenner, LA 38.86%
    Honolulu, HI 25.11%
    Shreveport-Bossier City, LA 18.85%
    Huntsville, AL 14.71%
    Leominster-Fitchburg-Gardner, MA  13.33%
    Redding, CA 10.53%
    Madison, WI 10.20%
    San Jose-Sunnyvale-Santa Clara, CA 10.01%
    Grand Rapids-Wyoming, MI 7.63%
    Providence-Fall River-Warwick, RI-MA 6.33%
    Top Big Cities for Information Job Growth, 2009-2010
    New Orleans-Metairie-Kenner, LA 38.86%
    San Jose-Sunnyvale-Santa Clara, CA 10.01%
    Providence-Fall River-Warwick, RI-MA 6.33%
    Los Angeles-Long Beach-Glendale, CA  5.08%
    Warren-Troy-Farmington Hills, MI  3.97%
    Boston-Cambridge-Quincy, MA  3.54%
    Riverside-San Bernardino-Ontario, CA 3.46%
    Charlotte-Gastonia-Rock Hill, NC-SC 3.02%
    Detroit-Livonia-Dearborn, MI  2.48%
    Seattle-Bellevue-Everett, WA  1.47%

    Joel Kotkin is executive editor of NewGeography.com and is a distinguished presidential fellow in urban futures at Chapman University, and an adjunct fellow of the Legatum Institute in London. He is author of The City: A Global History. His newest book is The Next Hundred Million: America in 2050, released in February, 2010.

    Photo by Angelo Amboldi

  • The State of Silicon Valley

    Every year, the top officials, policy wonks, and business managers convene at the annual State of the Valley conference to discuss and debate the health of the region. Over a thousand attendees trekked to San Jose, Calif., on Feb. 18 for the release of this year’s report. Published since 1995 by Joint Venture Silicon Valley Network and distributed for free, the new 2011 Index of Silicon Valley reported bleak indicators and a gloomy outlook.

    The event provided Valley insiders a moment to reflect on the economic storm, and the mood was darkly optimistic. A persistent phrase tossed out was the “new normal,” old Wall Street jargon describing a repressed economic environment. Growth is too slow to bring down the unemployment rate, and government intervenes to save a struggling private sector.

    Tally of the Valley

    Certainly Silicon Valley has had its share of troubles suffering from poor state finances and severe global competition. Unemployment has hit nearly 10 percent, higher than when the recession started. The region’s population of three million, comprised of Santa Clara and San Mateo Counties, has continued to drop as talent leaves for opportunity in cheaper pastures. Foreign immigration, considered a critical factor in the region’s entrepreneurship, dropped by 40 percent to its lowest level in the last decade since 2009 and stayed flat through 2010.

    Adding to the woe, Silicon Valley towns are facing budget shortfalls and downsizing their public services. San Jose faces a 10th straight year of red ink, adding up to a gap of $110 million in the next fiscal year. Caltrain plans to close up to 16 stations to survive a record $30.3 million deficit – about one-third of the commuter rail’s operating budget.

    Education has also taken a big hit. The California college system is wheezing from tremendous budget cuts, calculated at $1.4 billion across the state, which hit all three levels of tertiary education. Foothill-De Anza Community College, one of the largest community college districts in the U.S., confronts roughly $10.9 million in cuts on top of drastic budget slashes from previous years.

    Further, the local housing market remains stagnant, and 2010 marked, due in part to a tough regulatory environment, the third consecutive year that Silicon Valley was the least affordable California region for first-time home buyers.

    In the Eye of the Beholder

    It’s a dismal state of affairs if you ask the local old guard. Judy Estrin, former chief technology officer of Cisco Systems, grumbled that one problem was outsourcing. Too many startups were adopting the practice in her view, and she told the audience, “Don’t automatically go to China.”

    Others were concerned that jobs were being shipped simply to towns east across the bay. Much ballyhooed and well-subsidized sectors, such as cleantech, would not produce enough jobs to be economically meaningful in the recovery. Attendees were fearful that the Valley has lost its edge.

    If those who know Silicon Valley best are somewhat pessimistic, the Valley looks golden for many looking from the outside. The day before the conference, President Obama sought money and advice from the Valley’s tech elite, including Steve Jobs of Apple and Mark Zuckerberg of Facebook. Obama’s agenda was to push innovation, and aside from escaping the U.S. capital now and then, it is tellingly that he turned first to Silicon Valley.

    The Valley has also inspired other city governments. New York City – which once boasted its own “Silicon Alley” was winning over the Valley’s decidedly suburban model – recently asked Stanford University to help train its urban talent. As one local reporter put it gleefully, New York is “hoping to replicate our Apple in The Big Apple”.

    Although financial analysts once considered Apple washed up as a stock less than 10 years ago, the technology company is now lauded for transforming the mobile and entertainment industry and turning Silicon Valley into a mobile mecca. Goaded by Apple, mobile manufacturing giant Sony Ericsson is shifting all its product development from Sweden to Silicon Valley. Nokia, the world’s largest mobile phone maker, is also reportedly considering plans to relocate its executives to the Valley.

    Growing Regional Value, Not Growth

    The prevailing question remains: how will Silicon Valley sustain its lead in innovation. For some the response is to either raise taxes or cut public services as a matter of survival. At the State of the Valley conference, the overriding call to action was to unite 110 local governments through centralized regional leadership. However, the notion of a regional governing body had been introduced before in the 1990s and failed instantly in California state legislation.

    So what might the future hold? Last year’s report card aside, financial analysts are cheery about the Valley’s prospects. Silicon Valley Bank’s Financial Group reports that technology spending is expected to grow by more than five percent in 2011. The majority of their clients finished 2010 in better financial shape than the prior year, and median revenues for all early and growth stage technology clients grew 50 percent from the year before.

    The IPO market has woken from its slumber. Seven tech IPOs have already occurred this year, raising $700 million in total, with an average return of 26.5%, according to research firm Renaissance Capital. Even the international press is writing about the next boom being led by Silicon Valley.

    For all the money being generated, Silicon Valley is not producing more jobs in the local economy. Many startups look to Facebook as a leader in the social media space. Its user base of 600 million has generated a massive population that dwarfs that of the U.S. Yet the company has only about 2000 employees. Facebook presents a conundrum. Is it an innovative global leader that has mastered the art of efficient scaling that is the beginning of a new era in Silicon Valley, or has Facebook become the antithesis of economic growth for the U.S. administration?

    Similar to Facebook, Apple is also spurning growth – at least as defined by the conventional measure of new jobs. The company has redefined the tech industry by creating new technologies and new solutions, but not necessarily creating new growth for the region directly. While Apple employs just 30,000 people, the subcontractor that actually assembles its products employs over a million workers, all in China. Developers for Apple’s software applications and hardware accessories are scattered around the world. Instead, Apple has fostered an ecosystem whose heart resides in Silicon Valley.

    Silicon Valley is changing perceptions and practices once again. Like the proverbial cat with nine lives, Silicon Valley has at least several more transformations ahead.

    Tamara Carleton, Ph.D., is a Fellow at the Foundation for Enterprise Development. Her research studies the organizational processes and structures that enable radical technological innovation.

  • Regional Exchange Rates: The Cost of Living in US Metropolitan Areas

    International travelers and expatriates have long known that currency exchange rates are not reliable indicators of purchasing power. For example, a traveler to France or Germany will notice that the dollar equivalent in Euros cannot buy as much as at home. Conversely, the traveler to China will note that the dollar equivalent in Yuan will buy more.

    Economists have attempted to solve this problem by developing "purchasing power parities," which are used to estimate currency conversion rates that equalize values based upon prices (Note 1). This helps establish the real value of money in a particular place.

    When people move from one region of the United States to another they can encounter a similar phenomenon. For example, a dollar is not worth as much in San Jose as it is in St. Louis. Research by the US Department of Commerce Bureau of Economic Analysis (BEA), for example, found that in 2006 a dollar purchased roughly 35 cents less in San Jose than in St. Louis. BEA researchers estimated "regional price parities" for states and the District of Columbia and for all of the nation’s metropolitan areas (Note 2). Regional price parities can be thought of as the equivalent of regional (state or metropolitan area) exchange rates. This research was covered in previous newgeography.com articles by Eamon Moynihan and this author.

    This article uses Department of Labor, Bureau of Labor Statistics metropolitan area consumer price indexes to estimate the 2009 cost of living and per capita personal income adjusted for the cost of living.

    Cost of Living: At the regional level (See Census Region Map, Figure 1), there are substantial differences in the cost of living (Figure 2). The lowest cost of living is in the Midwest, at 4.8 percent below the nation. The South has the second lowest cost of living at 3.9 percent above the national level. The West is the most expensive area, 13.5 percent above the national cost-of-living, while the Northeast’s cost-of-living stands 11.3 percent above the national rate.

    The cost of living in the South may seem higher than expected. But if the higher cost metropolitan areas of Washington, Baltimore and Miami are excluded, the cost of living in the South falls to 1.5 percent below the national rate. If the California metropolitan areas are excluded from the West, the cost of living still remains 4.0 percent above the national rate.

    Per Capita Income: The highest unadjusted per capita incomes are in the Northeast, followed by the West, the South and the Midwest. Yet when metropolitan area exchange rates are taken into consideration, the order changes significantly. The Northeast remains the most affluent, and the Midwest moves from last place to second place. The South is in third place, the same as its income rating, while the West falls from second place to fourth place (Figure 3).

    Cost of Living: Variations in the cost of living, which is reflected by the metropolitan area exchange rates, remains similar in 2009 to the 2006 rankings.

    The Top Ten: The lowest costs of living were in (Table 1):

    1. St. Louis, where $0.891 purchased $1.00 in value at the national average.
    2. Kansas City, where $0.903 purchased $1.00 in value at the national average.
    3. Cleveland, where $0.921 purchased $1.00 in value at the national average.
    4. Pittsburgh, where $0.941 purchased $1.00 in value at the national average.
    5. Cincinnati, where $0.944 purchased $1.00 in value at the national average.

    Rounding out the most affordable 10 are two metropolitan areas in the South (Atlanta and Dallas-Fort Worth), two in the Midwest (Detroit and Milwaukee) and one in the West (Denver). No Northeastern metropolitan area was ranked in the top 10.

    Table 1
    Estimated Cost of Living: 2009
    Metropolitan Areas over 1,000,000 with Local CPIs
    Rank Metropolitan Area
    Metropolitan Exchange Rate: to Purchase $1.00 at National Average
    Compared to Lowest Cost of Living
    1
    St. Louis, MO-IL
    $0.891
    0%
    2
    Kansas City, MO-KS
    $0.903
    1%
    3
    Cleveland, OH
    $0.921
    3%
    4
    Pittsburgh. PA
    $0.941
    6%
    5
    Cincinnati, OH-KY-IN
    $0.944
    6%
    6
    Atlanta. GA
    $0.958
    8%
    7
    Detroit. MI
    $0.959
    8%
    8
    Milwaukee. WI
    $0.959
    8%
    9
    Dallas-Fort Worth, TX
    $0.976
    10%
    10
    Denver, CO
    $0.996
    12%
    11
    Minneapolis-St. Paul, MN-WI
    $1.000
    12%
    12
    Houston, TX
    $1.000
    12%
    13
    Tampa-St. Petersburg, FL
    $1.006
    13%
    14
    Phoenix, AZ
    $1.011
    14%
    15
    Portland, OR-WA
    $1.034
    16%
    16
    Chicago, IL-IN-WI
    $1.041
    17%
    17
    Philadelphia, PA-NJ-DE-MD
    $1.054
    18%
    18
    Baltimore, MD
    $1.068
    20%
    19
    Riverside-San Bernardino, CA
    $1.078
    21%
    20
    Miami-West Palm Beach, FL
    $1.085
    22%
    21
    Seattle, WA
    $1.120
    26%
    22
    San Diego, CA
    $1.151
    29%
    23
    Boston, MA
    $1.175
    32%
    24
    Washington, DC-VA-MD-WV
    $1.181
    33%
    25
    Los Angeles, CA
    $1.222
    37%
    26
    San Francisco-Oakland, CA
    $1.258
    41%
    27
    New York, NY-NJ-PA
    $1.281
    44%
    28
    San Jose, CA
    $1.343
    51%
    Estimated from BEA 2006 data, adjusted by local Consumer Price Index for 2006-2009


    The Bottom Ten: The most expensive metropolitan areas were:

    28. San Jose, where $1.343 purchased $1.00 in value at the national average.
    27. New York, where $1.281 purchased $1.00 in value at the national average.
    26. San Francisco, where $1.268 purchased $1.00 in value at the national average.
    25. Los Angeles, where $1.222 purchased $1.00 in value at the national average.
    24. Washington, where $1.181 purchased $1.00 in value at the national average.

    The bottom ten also included three metropolitan areas in the West (Riverside-San Bernardino, San Diego and Seattle), one in the Northeast (Boston) and one in the South (Miami). There were no Midwestern metropolitan areas in the bottom 10.

    Per Capita Income: Per capita income in 2009 was then adjusted for the cost of living.

    Top Ten:Washington has the highest per capita income, adjusted for the cost of living, at $47,800. San Francisco placed second at $47,500. Denver ranked third at $46,200, while the cost-of-living adjusted income in Minneapolis-St. Paul was $45,800 and $45,700 in Boston. The top 10 also included two Midwestern metropolitan areas (St. Louis and Kansas City), two from the Northeast (Baltimore and Pittsburgh) and one from the West (Seattle).

    Bottom Ten: The least affluent metropolitan area was Riverside-San Bernardino, with a per capita income of $27,800. Phoenix was second least affluent at $33,900 while Los Angeles was third least affluent at $35,000. The fourth least affluent metropolitan area was Tampa-St. Petersburg at $36,600 and the fifth least affluent metropolitan area was Portland at $37,400. The bottom 10 also included two metropolitan areas from the South (Atlanta and Miami), two from the Midwest (Cincinnati and Detroit) and one from the West (San Diego).

    The cost of living adjusted income data includes surprises. New York, commonly considered a particularly affluent metropolitan area, ranked 17th in cost-of-living adjusted income, and below such seemingly unlikely metropolitan areas as Pittsburgh, Kansas City, Cleveland, St. Louis and Milwaukee. These metropolitan areas also ranked above San Jose, which ranked first in unadjusted income in 2000, but now ranks 16th in cost of living adjusted income (Table 2).

    Table 2
    Personal Income Per Capita Adjusted for  the Cost of Liviing
    Metropolitan Areas over 1,000,000 with Local CPIs
    Rank (Cost of Living Adjusted)
    Rank (Unadjusted Income)
    Metropolitan Area
    Per Capita Income 2009: Adjusted for Cost of Living
    Per Capita Income 2009: Unadjusted
    1
    2
    Washington, DC-VA-MD-WV
    $47,780
    $56,442
    2
    1
    San Francisco-Oakland, CA
    $47,462
    $59,696
    3
    8
    Denver, CO
    $46,172
    $45,982
    4
    9
    Minneapolis-St. Paul, MN-WI
    $45,772
    $45,750
    5
    4
    Boston, MA
    $45,707
    $53,713
    6
    18
    St. Louis, MO-IL
    $45,288
    $40,342
    7
    7
    Baltimore, MD
    $44,908
    $47,962
    8
    15
    Pittsburgh. PA
    $44,848
    $42,216
    9
    19
    Kansas City, MO-KS
    $43,862
    $39,619
    10
    6
    Seattle, WA
    $43,730
    $48,976
    11
    13
    Houston, TX
    $43,581
    $43,568
    12
    16
    Milwaukee. WI
    $43,477
    $41,696
    13
    11
    Philadelphia, PA-NJ-DE-MD
    $43,247
    $45,565
    14
    21
    Cleveland, OH
    $42,734
    $39,348
    15
    12
    Chicago, IL-IN-WI
    $41,990
    $43,727
    16
    3
    San Jose, CA
    $41,255
    $55,404
    17
    5
    New York, NY-NJ-PA
    $40,893
    $52,375
    18
    20
    Dallas-Fort Worth, TX
    $40,494
    $39,514
    19
    23
    Cincinnati, OH-KY-IN
    $40,437
    $38,168
    20
    10
    San Diego, CA
    $39,647
    $45,630
    21
    24
    Detroit. MI
    $39,147
    $37,541
    22
    17
    Miami-West Palm Beach, FL
    $38,124
    $41,352
    23
    26
    Atlanta. GA
    $38,081
    $36,482
    24
    22
    Portland, OR-WA
    $37,446
    $38,728
    25
    25
    Tampa-St. Petersburg, FL
    $36,561
    $36,780
    26
    14
    Los Angeles, CA
    $35,045
    $42,818
    27
    27
    Phoenix, AZ
    $33,897
    $34,282
    28
    28
    Riverside-San Bernardino, CA
    $27,767
    $29,930
    Estimated from BEA 2009 income data and 2006 regional price parity data, adjusted by local Consumer Price Index for 2006-2009


    Some expensive metropolitan areas such as Washington, San Francisco and Boston ranked at or near the top, but their cost-of-living adjusted incomes were considerably less than the unadjusted incomes. On average, it took $1.20 to purchase $1.00 of value at national rates in these three metropolitan areas. Washington’s unadjusted per capita income was 40 percent ($16,100) higher than that of St. Louis, however when the cost of living is factored in, Washington’s advantage drops to 6 percent ($2,500).

    Caveats: The analysis above does not consider cost-of-living differentials within metropolitan areas. For example, data from the ACCRA cost of living index indicates generally higher prices in the cores of the largest metropolitan areas, such as New York (especially Manhattan), Chicago and San Francisco. Further, these data make no adjustment for relative levels of taxation. A cost of living analysis using disposable income would produce different results, dropping higher taxed metropolitan areas to lower rankings and raising lower taxed metropolitan areas higher.

    Cost of Living Differences: Will They Continue? The spread in cost-of-living between metropolitan areas have been driven wider over the last decade by the relative escalation of house prices in some metropolitan areas in the West, Florida and the Northeast. Whether these shifts in cost of living will be reflected in migration patterns will be one of the things to look for in the new Census.

    ———

    Note 1: Purchasing power parity data is published by the World Bank, the International Monetary Fund (IMF) and the Organization for Economic Cooperation and Development (OECD).

    Note 2: The BEA research applied regional price parity factors only to employee compensation and excluded other income. It is possible that, had the analysis been expanded to these other forms of income, the differences in cost of living would have been greater.

    Photo: Rosslyn, VA business district, Washington (by author)

    Wendell Cox is a Visiting Professor, Conservatoire National des Arts et Metiers, Paris and the author of “War on the Dream: How Anti-Sprawl Policy Threatens the Quality of Life

  • Personal Income in the 2000s: Top and Bottom Ten Metropolitan Areas

    The first decade of the new millennium was particularly hard on the US economy. First, there was the recession that followed the attacks of 9/11. That was followed by the housing bust and the resulting Great Financial Crisis, which was the most severe economic decline since the Great Depression.

    Per capita personal incomes in America’s major metropolitan areas vary widely. Moreover, the changes in per capita incomes from 2000 to 2009 have also varied. The differences are particularly obvious when average incomes are adjusted for metropolitan area Consumer Price Indexes. The US Bureau of Labor statistics produces a Consumer Price Index for nearly 30 metropolitan areas. Among these, 28 metropolitan areas are covered by these local Consumer Price Indexes.

    While overall national inflation was approximately 25 percent between 2000 and 2009, the metropolitan area inflation indexes ranged from 16 percent in Phoenix to more than 32 percent in San Diego. Five additional metropolitan areas had 2000 to 2009 inflation of more than 30 percent, including Los Angeles, Riverside-San Bernardino, Miami, Tampa-St. Petersburg and San Diego. Four metropolitan areas experienced inflation of less than 20 percent, including Atlanta, Detroit and Cleveland and Phoenix.

    Overall, the 28 metropolitan areas covered by metropolitan inflation indexes averaged a per capita income decrease of 0.1 percent, after adjustment for inflation. Increases were achieved in 18 metropolitan areas, while decreases occurred in 10. The overall average declines occurred because the steepest loss (19 percent in San Jose), was far outside the plus 10 percent to minus 8 percent range of the other 27 metropolitan areas (Table).

    Metropolitan Area: Per Capita Income
    Metropolitan Areas Covered by Metropolitan Consumer Price Indexes
    Inflation Adjusted
    Rank Metropolitan Area
    2000 in 2009$
    2009
    Change
    1 Baltimore
    $    43,729
    $    47,962
    9.7%
    2 Pittsburgh
    $    39,024
    $    42,216
    8.2%
    3 Washington
    $    53,753
    $    56,442
    5.0%
    4 Philadelphia
    $    43,572
    $    45,565
    4.6%
    5 St. Louis
    $    38,636
    $    40,342
    4.4%
    6 Milwaukee
    $    40,028
    $    41,696
    4.2%
    7 Los Angeles
    $    41,382
    $    42,818
    3.5%
    8 Houston
    $    42,232
    $    43,568
    3.2%
    9 Cleveland
    $    38,396
    $    39,348
    2.5%
    10 Chicago
    $    42,761
    $    43,727
    2.3%
    11 Phoenix
    $    33,594
    $    34,282
    2.0%
    12 San Diego
    $    44,812
    $    45,630
    1.8%
    13 Kansas City
    $    39,020
    $    39,619
    1.5%
    14 New York
    $    51,638
    $    52,375
    1.4%
    15 Cincinnati
    $    37,852
    $    38,168
    0.8%
    16 Seattle
    $    48,651
    $    48,976
    0.7%
    17 Boston
    $    53,396
    $    53,713
    0.6%
    18 Minneapolis-St. Paul
    $    45,690
    $    45,750
    0.1%
    19 Denver
    $    46,205
    $    45,982
    -0.5%
    20 Miami-West Pallm Beach
    $    41,937
    $    41,352
    -1.4%
    21 Riverside-San Bernardino
    $    30,600
    $    29,930
    -2.2%
    22 Portland
    $    39,703
    $    38,728
    -2.5%
    23 Tampa-St. Petersburg
    $    38,048
    $    36,780
    -3.3%
    24 San Francico
    $    61,831
    $    59,696
    -3.5%
    25 Dallas-Fort Worth
    $    41,575
    $    39,514
    -5.0%
    26 Detroit
    $    40,412
    $    37,541
    -7.1%
    27 Atlanta
    $    39,775
    $    36,482
    -8.3%
    28 San Jose
    $    68,185
    $    55,404
    -18.7%
    Unweighted Average
    $    43,801
    $    43,700
    -0.2%

    The Top Ten: The strongest per capita personal income growth between 2000 and 2009 was in Baltimore, which had an inflation adjusted increase of 9.7 percent. This strong performance is not surprising due to Baltimore’s proximity to Washington and the federal government’s high paying jobs. It also receives spillover lucrative employment from federal contracts to health, defense and security companies. In fact, Baltimore did better than Washington. Washington, which extends from the District of Columbia and into Maryland, Virginia and West Virginia. Not that DC did badly; it boasted the third highest income growth, and 5.0 percent.

    However, perhaps the biggest surprise is the metropolitan area that slipped into the number two position between Baltimore and Washington. The Pittsburgh metropolitan area, which may have faced the most severe economic challenges of any major metropolitan area over the past 40 years, achieved per capita personal income growth of 8.2 percent. The Pittsburgh gain is all the more significant in view of the local financing difficulties which placed the city of Pittsburgh in the near equivalent of bankruptcy under Pennsylvania’s Act 47. However, as is the case in on number of metropolitan areas, the central city has become much less dominant and no longer seals the fate of the larger metropolitan area. Today, the city of Pittsburgh accounts for only 15 percent of the metropolitan area population.

    Philadelphia, the other long troubled region across the state, constitutes another surprise. Philadelphia placed fourth in per capita income growth at 4.6 percent only slightly behind Washington. The Philadelphia metropolitan area borders on that of Baltimore, stretching from Pennsylvania into New Jersey, Delaware and Maryland. Together with Washington and Baltimore, Philadelphia anchors the northern end of a corridor of comparative prosperity.

    Four of the next six positions are occupied by Midwest metropolitan areas. This may be unexpected because of the significant job losses sustained in this area since 2000. St. Louis, which stretches from Missouri into Illinois, ranked fifth in per capita income growth, at 4.4 percent. Milwaukee ranked sixth in its per capita income growth at 4.2 percent. Cleveland ranked ninth with per capita income growth of 2.5 percent, while Chicago placed 10th, with a gain of 2.3 percent in per capita personal income.

    Los Angeles was the only metropolitan area in the West to place in the top 10 in per capita income growth. Los Angeles ranked seventh growth of 3.5 percent. Houston replaced eighth with personal income growth of 3.2 percent.

    Overall, the East and Midwest captured six of the top ten income positions, while the South and West occupied four of the top ten positions.

    The Bottom 10: If the top 10 contained surprises, the bottom 10 could be even more surprising. Last place (28th) was occupied by San Jose, which experienced a stunning 18.7 percent decline in per capita inflation adjusted income between 2000 and 2009. This income loss is more than double that of the second-worst performing metropolitan area and more than triples that of all but two other metropolitan areas.

    The second worst position (27th) also contained a surprise, in Atlanta, which has enjoyed decades of unbridled growth. Yet, Atlanta experienced a per capita income loss of 8.3 percent. There was no surprise in the third to the last ranking (26th) of Detroit, with its automobile industry employment losses and the physical deterioration of its central city, which may be unprecedented in modern peace-time. Per capita incomes declined 7.1 percent in Detroit.

    Dallas-Fort Worth, which has also experienced strong growth in the past, posted a surprising fourth worst, with a per capita income decline of 5.0 percent. San Francisco, which has now replaced San Jose as the metropolitan area with the highest per capita income, ranked fifth worst and experienced a decline of 3.5 percent.

    All of the remaining bottom 10 positions were occupied by metropolitan areas that have developed a reputation for strong growth. Tampa St. Petersburg ranked 6th worst, with a per capita income loss of 3.3 percent. Portland (Oregon) ranked 7th worst with a personal income loss of 2.5 percent. Riverside San Bernardino, with the lowest per capita income ranking out of the 28 metropolitan areas, ranked 8th worst with a per capita income drop of 2.2 percent.

    The Miami (to West Palm Beach) metropolitan area ranked 9th in personal income growth with a loss of 1.4 percent from 2000 to 2009, while Denver topped out the bottom 10, ranking, with a per capita income loss of 0.5 percent

    Overall, the South and the West captured nine of the bottom ten positions, while only one Midwestern metropolitan area, Detroit, broke into the bottom ten.

    Of course, the 2000s certainly were an unusual time. But it does suggest that the dogma about the geography of regional prosperity needs to be challenged and perhaps thoroughly revised.

    Photo: Pittsburgh: Second Fastest Growing Income per Capita 2000-2009 (photo by author)

    Wendell Cox is a Visiting Professor, Conservatoire National des Arts et Metiers, Paris and the author of “War on the Dream: How Anti-Sprawl Policy Threatens the Quality of Life

  • If California Is Doing So Great, Why Are So Many Leaving?

    Superficially at least, California’s problems are well known. Are they well understood? Apparently not.

    About a year ago Time ran an article, “Why California is Still America’s future,” touting California’s future, a future that includes gold-rush-like prosperity in an environmentally pure little piece of heaven, brought to us by “public-sector foresight.”

    More recently, Brett Arends’ piece at Market Watch, “The Truth About California,” is more of the same. California’s governor elect, Jerry Brown, liked this piece so much that he tweeted a link to it.

    The optimist’s argument about California’s future ultimately hinges on the creativity of the state’s vaunted tech sector, in large part driven by regulation promulgated by an enlightened political class and funded by a powerful venture capital sector.

    No fundamentalist evangelical speaks with more conviction or faith than a California cheerleader expounding on the economic benefits of environmental purity brought about by command and control regulation.

    The more honest cheerleaders acknowledge that California has challenges, including persistent budget problems. Arends denies even the existence of a budget problem, demanding “Er, no, actually. It’s your assertion. You do the math.” Let me help you, Brett. The non-partisan California Legislative Analyst’s Office has done the math. You can find it here. They expect budget shortfalls in excess of $20 billion a year throughout their forecast horizon. This is on annual revenues of less than $100 billion.

    Last week the numbers got even worse, as the Governor-elect, Jerry Brown, acknowledged. The deficit may now be as much as $28 billion this year, and over $20 billion for the foreseeable future. This is more than a nuisance. There’s a reason, after all, why California has among the worst credit ratings of any state.

    Most people outside of California haven’t drank from this vat of the economic equivalent of LSD-laced Kool-Aid. People know that a state is in trouble when it has persistent intractable budget deficits, chronic domestic net out-migration, and 30 percent higher unemployment than the national average. Indeed, California’s joblessness, chronic budget deficits, governors, and credit rating have made the state the butt of jokes worldwide.

    How bad are things in California? California’s domestic migration has been negative every year since at least 1990. In fact, since 1990, according to the U.S. Census, 3,642,490 people, net, have left California. If they were in one city, it would be the third largest city in America, with a population 800,000 more than Chicago and within 200,000 of Los Angeles’ population.

    We’re seeing a reversal of the depression-era migration from the Dust Bowl to California. While California has seen 3.6 million people leave, Texas has received over 1.4 million domestic migrants. Even Oklahoma and Arkansas have had net-positive domestic migration trends from California.

    Those ultimate canaries in the coal mine, illegal immigrants, recognize California’s problems. Twenty years ago, about half of all United States illegal immigrants went to California. Today, that’s down to about one in four.

    The result of these migration trends is that California’s share of the United States population has been declining.

    What do these migrants see that so many of California’s political class do not see? They see a lack of opportunity. California’s share of United States jobs and output has declined since 1990, and its unemployment rate has remained persistently above the United States Average, only approaching the average during the housing boom.

    California’s unemployment is particularly troubling. As of October 2010, only two states, Nevada at 14.2 percent and Michigan at 12.8 percent, had higher unemployment rates than California’s 12.4 percent. California’s unemployment problem is particularly severe in its more rural counties. Twenty-five of California’s 58 counties have unemployment rates higher than Nevada’s:


    These unemployment rates approach depression levels. Some will excuse many of them because they are in agricultural areas, but many assert that low Midwest unemployment rates are due to a booming agricultural sector. Which one is it?

    California’s unemployment problems are not limited to rural and agricultural areas. Most of Riverside County’s population is very urban, yet the County’s unemployment rate is 14.87 percent. On December 7th, the Wall Street Journal listed the unemployment rates for 49 of America’s largest urban regions. California had six of the 19 metro areas with double-digit unemployment. These include such major cities San Diego, San Jose, and Los Angeles.

    Just as rural areas are not California’s only depressed areas, agriculture is not California’s only ailing sector. From 2000 to 2009, the only California sectors to gain jobs were government, education and health services, and leisure and hospitality.

    California’s cheerleaders claim that the state’s future is assured by a vibrant tech sector, but the data do not support that assertion. North Dakota’s Praxis Strategy Group has performed analysis by job skills. They compare Scientific, Technical, Engineering, and Math (STEM) jobs across states. Their analysis shows that California is the Nation’s ninth worst state in creating STEM jobs in post dot-com-bust years. It has produced far fewer new tech jobs than Texas, and far less on average, than the country over the past decade:


    In this respect, California’s precipitous decline is really quite shocking. In just a couple of decades, California has gone from being America’s economic star, a destination for ambitious people from around the world and abundant with opportunity, to home of some of America’s most distressed communities. It has been a man-made, slow motion tragedy perpetuated by a political class that is largely deluded.

    The cheerleader’s faith in command and control regulation and environmental purity is so strong they cannot see anything that contradicts that faith.

    But that faith is misplaced. Joel Kotkin, Zina Klapper, and I performed an extensive review of the economic impacts of one of California’s most important greenhouse gas regulation, AB 32, and found that command and control regulation in general and AB 32 in particular is inefficient, cost jobs, and depress economic activity. California’s Legislative Analyst’s Office agrees, as evidenced by this report.

    More depressing still are the growing ranks of what could be called “the resigned”. They simply have given up. These include a business leadership that is more interested in survival and accommodation than pushing an agenda for growth. Easier to get along here, and expand jobs and opportunities elsewhere, whether in other states or overseas.

    Yet ultimately California’s future is what Californians make of it. No place on Earth has more natural amenities or a more benevolent climate. No place has a location more amenable to prosperity, located between thriving Pacific Rim economies and the entire North American market. No place has more economic potential.

    But unless policy is changed, California’s future is dismal, with the specter of stubbornly high unemployment, limited opportunity, and the continued exodus of the middle class. California’s political class needs first to confront reality before we can hope to avoid a dismal future.

    Bill Watkins is a professor at California Lutheran University and runs the Center for Economic Research and Forecasting, which can be found at clucerf.org.

    Photo by Stuck in Customs

  • Jerry Brown: Machiavelli Or Torquemada?

    For more than one-third of a century Jerry Brown has proved one of the most interesting and original figures in American politics–and the 71-year-old former wunderkind might be back in office in 2010. If he indeed wins California’s gubernatorial election, the results could range from somewhat positive to positively disastrous.

    Brown is a multi-faceted man, but in political terms he has a dual personality, split between two very different Catholic figures from the 15th century: Machiavelli and Tomas de Torquemada. For the sake of California, we better hope that he follows the pragmatism espoused by the Italian author more than the stern visage of the Grand Inquisitor.

    Like a good Jesuit, Brown certainly can be flexible. Back in 1978, for example, he worked against Howard Jarvis’ Proposition 13, which capped real estate taxes. But once the measure was passed, Brown embraced it as his own. Indeed, he was so enthusiastic about the tax-cutting measure that Jarvis actually voted for Brown’s re-election late that same year. A month after the vote a Los Angeles Times poll revealed most Californians thought Brown actually supported 13.

    Brown also has shown his flexibility by throwing even loyal allies under the bus. Elected largely due to the electoral coalition constructed by his father, Edmund G. “Pat” Brown, Brown made a point of tweaking and restraining the expanding bureaucracy largely created by his father. He also took on the University of California and the welfare bureaucracy as well as agriculture, residential real estate and manufacturing giants.

    This Oedipal battle reflected Brown’s personal crankiness. He came into office, recalled top aide Tom Quinn, “questioning the values of the Democratic Party.”

    Ascetic and even monk-like, he rejected his father’s “build, build, build” philosophy and embraced E. F. Schumacher’s “small is beautiful” ideology. Like the 15th-century Florentine Catholic monk Girolamo Savanarola, he came to rid Sacramento of suberbia and luxuria.

    Brown was also ahead of his time. His early embrace of green politics–particularly energy conservation and renewable fuels–foreshadowed that of later Democrats, particularly Barack Obama. His strong outreach to Latinos and other minorities expanded his political base among California’s fastest-growing populations.

    Yet Brown understood that economic prosperity–not civil rights or environmental zealotry–was key to political ascendancy. Eastern journalists dismissed him as “Governor Moonbeam,” but they ignored his Machiavellian skill in recognizing and reaching out to rising economic forces, notably the high-tech entrepreneurs in the Silicon Valley and across Southern California. The growth of this sector, along with rising trade with Asia and the military boom after the Soviet invasion of Afghanistan, set the pace for the state’s strong rebound from its early 1970s doldrums.

    But Brown’s inquisitorial side surfaced again as he prepared a second run–he had made a charmingly eccentric assault in 1976–for the White House. Perhaps the prospect of facing a man of infinite flexibility, Bill Clinton, pushed him over the top, but Brown re-invented himself as a high-octane and, at times, shrill populist.

    After some years in the political wilderness, he reemerged in 1998 as Mayor of Oakland, a tough job even in good times. Although he remained predictably arrogant and aloof, the job of managing a working-class city seemed to have brought him to his senses. Like the ideal politician in The Prince, Brown governed with something approaching strategic precision, pushing economic development, embracing the police and supporting new infrastructure spending.

    Brown’s newfound reputation as a canny realist helped him win the election as attorney general in 2006. Yet once back in statewide politics, the inquisitorial side found expression. Convinced about the impending threat of global warming, Brown used his new powers to push the Gorite agenda with the passion of a Torquemada.

    Although Brown was not quite torturing heretics, he certainly applied the legal equivalent of thumbscrews to anyone–developers, cities, counties–who did not follow his prescriptions about “carbon neutrality.” Even proposals for sensible, relatively dense “in fill” development were turned aside in favor of utopian, economically unsustainable ideas about forced density and transit friendliness.

    Today, with California’s economy is in tatters–its unemployment well over 12%–and Brown’s crusade seems likely to make it worse. Onerous regulation threatens everything from the construction of new single-family homes to new employment tied to anything that releases demon carbon–including manufacturing, oil drilling and large-scale agriculture.

    All this has made Brown widely feared in much of California’s fractured, traumatized business community. Even worse, he has emerged as the standard-bearer of the public employee unions, the very force whose political power and pensions are bringing the state to the verge of economic ruin. The fact that Brown’s campaign is funded largely by these unions makes it, at least on the surface, unlikely to challenge the hegemony of our putative “civil servants.” They are said to be ready to spend up to $40 million on “independent” campaigns to help beat back any chance of a GOP victory.

    This is worrisome given Brown’s role in fostering the expansion of public-sector unions during his term, a group whose ascendancy has become arguably the single biggest factor in the state’s precipitous decline during his last gubernatorial reign. As author Steven Greenhut has pointed out, unfunded pension liabilities in excess of $50 billion are one key element driving the state toward ever more depressed bond ratings and possible bankruptcy.

    Under normal circumstances, Brown’s ties to the public sector, his fickle nature and his dubious accomplishments would spell political doom. But amazingly, Brown’s long, if mixed, record might actually prove an advantage against his most likely opponent, former eBay executive Meg Whitman, who is running as an outsider.

    The problem for Whitman or any GOP candidate lies with the miserable legacy of another nominally Republican outsider, Arnold Schwarzenegger. The Terminator’s record of ineptitude and empty blather stands as a mega-advertisement against inexperience. Compared to the former body builder’s amateurish blundering, Brown’s wealth of knowledge of government looks appealing.

    Whitman, or her main challenger Insurance Commissioner Steve Poizner, also must struggle with a Republican Party out of sync with an increasingly multi-racial and socially liberal state. As long-time political analyst Allan Hoffenblum notes, for the first time there is not one congressional, state senate or assembly district with a GOP majority.

    So in the end, California’s fate may end up resting on which Jerry Brown emerges after the election. If he continues on his inquisitorial assault on carbon-creators, you can pretty much expect California’s middle class to continue diminishing while the state’s aspirational appeal ebbs ever further. The state could end up resembling Kevin Starr’s description of his native San Francisco– “a cross between Carmel and Calcutta.”

    But given his history, Brown could still surprise us. Stuck with responsibility for a decaying economy and fiscally burdened by the voracious public unions, Brown could do a “Nixon in China,” imposing controls on pensions and salaries. He could recognize that “green jobs” can not save California from the abyss and that a new “era of limits” must apply to the public sector as well as the rest of us. With the passionate climate-change constituency shrinking, he might even decide to accept a modicum of carbon heresy as a necessary evil.

    Brown should heed Machiavelli’s advice for rulers to be “merciful and not cruel” and “proceed in a temperate manner with prudence and humanity.” If in his old age Brown adopts the Italian writer’s credo of tactical flexibility, reason and tolerance, the Golden State may yet revive itself, and with it restore the legacy of its most storied political family.

    This article originally appeared at Forbes.com.

    Joel Kotkin is executive editor of NewGeography.com and is a distinguished presidential fellow in urban futures at Chapman University. He is author of The City: A Global History. His newest book is The Next Hundred Million: America in 2050, released in Febuary, 2010.

    Photo: Troy Holden

  • High Tech Won’t Save California’s Economy

    Much has been made of California’s struggles, but some still say California’s best days are ahead of it. In this calculus, innovation in high tech, biotech, green tech, clean tech, any tech will ultimately pull the state out of its current funk and to even greater success tomorrow. Promoters of this view cite an impressive roster of statistics around venture capital, patents, new business formation, etc., along with obligatory anecdotes of ambitious new startups with world changing products (coming soon) and their slick, dynamic founders. This view reached its apotheosis in a Time magazine cover story called “Why California Is Still America’s Future”.

    This view of the world is correct – but incomplete in a fundamental way. These emerging industries are in many ways the future of America, and they all have their creative epicenter in California. But they aren’t generating many net new jobs there.

    Let’s consider the counties that make up the heart of these industries. Silicon Valley’s San Mateo and Santa Clara Counties both experienced slow job growth between 1990 and 2009. San Mateo County only added 30,000 net jobs, an average of less than 1,700 new jobs per year, or a compound annual growth rate of 0.5%.

    Santa Clara County added around 50,000 jobs over that 18 year period – about 2,700 jobs per year, but only a CAGR of only 0.3%.

    Both counties added significant new jobs in the late 90s, but these were lost when the dotcom bubble collapsed. The recovery from that decline only reached back to the levels just before the early 90s recession, continuing the long running Silicon Valley boom-bust cycle. Silicon Valley actually added jobs at a slower rate than California as a whole during this period.

    You can see the employment impacts just driving down the 101 freeway; there are more than 43 million square feet of unoccupied space, the equivalent of 15 Empire State Buildings. Twenty one percent of “Class A” space and low rise flex space – used for high-tech research and development – is empty. Unemployment overall in Santa Clara county hovers around 12%, substantially over the national average.

    San Diego County, one of the key centers of the biotech industry, did much better, adding 310,000 jobs over the same timeframe. This is over 17,000 jobs per year, or a CAGR of 1.53%, much better than Silicon Valley, but hardly enough to reflate California’s job market. For example, Los Angeles County added almost a million people during this time, but actually lost jobs.

    A critical consideration may well be that the future could be different from the past for these industries, and that over the next 20 years they will generate far more jobs than in the previous. But the evidence seems to be the other direction.

    California clearly has no shortage of dynamism in high-end economic sectors. There are still plenty of new innovative firms being founded in California or even moving there. And it seems likely these firms will continue to generate significant wealth for the state in the future. Given its current tax structure, the state treasury has significant “operational leverage” to the upside here. Another strong recovery cycle might even replenish the state’s coffers, though won’t offer solace for some time at least.

    But these industries won’t generate many net new jobs. And that is becoming the problem in both Silicon Valley and the state.

    Therein lies California’s dilemma. The ability to generate large amounts of wealth on a narrow job base isn’t enough to support a state of 37 million people. Brazil generates enormous wealth too, and supports lavish stores like Daslu, where you can’t walk in off the street, but there’s a helipad on the roof – and a favela just down the street. But Brazil doesn’t have a middle class economy.

    With innovation the watchword of the day, and no other realistic prospects available in the near term, it is easy to see why places from California to Michigan are placing their hopes on such high end information age jobs. Unlike most, California is already winning the war for the highest value jobs and talent in the space. The headquarters, R&D, core software development, design, and prototyping will be done in California. But it is unlikely to be where the manufacturing, customer support, sales, warehousing, back office support, and other core functions get done. And those are where the jobs are. The back of the iPhone says everything we need to know. “Designed by Apple in California. Assembled in China.”

    California is clearly right to make these industries a priority. The danger is that it comes to focus on them so exclusively that it implements policies that are overly favorable to those select functions, but hostile to everything else. California needs to make sure it has a strategy for middle class and working class jobs beyond the low end service sector. That’s a much harder problem than maintaining Silicon Valley’s dominance, but it’s clearly at least equally as important. The high end portion of various “tech” sectors alone are never going to provide enough jobs to secure a prosperous future for the vast majority of Californians.

    Aaron M. Renn is an independent writer on urban affairs based in the Midwest. His writings appear at The Urbanophile.