Tag: transit

  • Transportation Game-changers

    Here is the L.A. Times noting that LA Metro ridership is still falling — even though billions have been (mis)spent on extra capacity over the last 30+ years. By my count that’s the second time this year that the Times has broached this tender topic. As a member in good standing of the LA “good government” (googoo) establishment, the paper had for many years chosen to tip-toe around the bad news.

    Readers may know that some of us began flogging the dead horse in the mid-1970s. Go to the attached proceedings and read the contribution by the late UCLA Prof. George Hilton. He was among the first to write sensibly and clearly that LA is not NY — and trying to make it so would be a phenomenal waste. But even LA Times coverage will be for naught. Billions more will be spent. Pouring good money after bad is what the great and the good in city hall do for a living.

    We are in the the early years Uber/Lyft and all manner of ICT information sharing.  These are the game-changers. For the past two months, my wife and I have graduated from a two-car household to a one-car-plus-Uber-plus-walkable-neighborhood HH. The game-changers are here. Conventional transit was never a game-changer.

  • Portland Columnist Calls for Abandonment of the WES Commuter Rail Line

    Portland Tribune columnist (see "My View: WES is a Mess: Time to Pull the Plug") Bill MacKenzie took the occasion of a Tri-Met (transit agency for the Oregon side of the Portland, OR-WA metropolitan area) approval to purchase two used Budd Rail Diesel Cars (RDC) for the Wilsonville to Beaverton commuter rail line to call for its abandonment.Fconcl In addition to the $1.5 million purchase cost, $550,000 will be required for refurbishment. When then are ready for service, they will surely older than most Tri-Met employees, since the last Budd RDC’s were built in the early 1960s.

    He mocks the agency’s general manager, Neil MacFarlane, who justified the purchase as necessary to accomodate future passenger growth: "Oh sure, plan for massive ridership growth,"MacKenzie scoffs. He continues, In early 2009, TriMet predicted WES would have 2,400 daily riders its first year of operations and 3,000 by 2020." In 2015, the line carried fewer than 1,900 riders each weekday, and its cost per boarding was more than four times that of buses (not counting capital costs).

    He concluded that: "Even if WES reaches 3,000 average daily boardings, operating costs per boarding ride will remain much higher than for buses and MAX. The fact is, WES is a train wreck. It’s time to shut it down."

  • Expo Line Expansion Fails to Stem L.A. Transit Loss

    The long awaited and highly touted Santa Monica extension brought an approximately 50 percent increase in ridership of the Los Angeles Expo light rail line between June 2016 and June 2015. The extension opened in mid May 2016. In its first full month of operation, June 2016, the line carried approximately 45,900 weekday boardings (Note), up from 30,600 in June 2015, according to Los Angeles Metropolitan Transportation Authority (MTA) ridership statistics.

    However MTA ridership continued to decline, with a 51,900 loss overall. Bus and rail services other than the Expo line experienced a reduction of 67,300 boardings (Figure).

    Between June 2015 and June 2016, rail boardings rose 30,500, while bus boardings declined 82,400. In other words there was a loss of 2.7 bus riders for every new rail rider over the past year. Los Angeles transit riders have considerably lower median earnings than in the cities with higher ridership, and lower than the major metropolitan average (see the analysis by former Southern California Rapid Transit District Chief Financial Officer Tom Rubin and "Just How Much has Los Angeles Transit Ridership Fallen?" and ) here and here).

    Note: A passenger is counted as a boarding each time a transit vehicle is entered. Thus, if more than one transit vehicle is required to make a trip, there can be multiple boardings between the trip origin and destination. Because the addition of rail services, as in Los Angeles, can result in forcing bus riders to transfer because their services can be truncated at rail stations, the use of boardings as an indicator of ridership can result in exaggeration, as the number of boardings per passenger trip is increased. This may have produced a decline of as much as 30 percent in actual passenger trips since 1985, as a number of rail lines have been opened in Los Angeles. 

  • Honolulu Rail: It Just Keeps Getting Worse

    There seems to be no end to the difficulties facing Honolulu’s urban rail project. In an editorial, Honolulu’s Civil Beat noted that federal officials fear the project cost may reach $8.1 billion, which is more than 50 percent above the “original estimate” of $5.2 billion. The cost blowout of nearly $3 billion would be far more than state consultants suggested in a 2010 report. That report, by the Infrastructure Management Group (IMG) in conjunction with the Land Use and Economic Management Group of CB Richard Ellis and Thomas A. Rubin estimated a “most likely scenario” in which the rail cost overrun would have been $909 million (Note).

    This is, however, a particular concern to local citizens, since it has been suggested that no rail project has cost more in relation to its population base in US history. If the the project costs $8.1 billion, the IMG et al report estimate will have turned out to be far too conservative, less than one-third the overrun. At $2.9 billion this extra cost is nearly $3,000 for every man, woman and child in Honolulu. It is more than $8,500 per household.

    The Civil Beat editorial is here.

    Note: Thomas A. Rubin’s more recent analysis of rail and transit ridership in Los Angeles is here.

  • Feds Forced to Set Priorities for Washington Subway

    The Washington Metro passenger safety fiasco (see: America’s Subway: America’s Embarrassment?) has only gotten worse. On May 10 the Washington Post  reported the federal government has twice threatened to close the system if the Washington Area Metropolitan Transportation Authority (WMATA) failed to “take actions to keep passengers safe.” U.S. Secretary Anthony Foxx.

    According to the Post, “The most recent incident to illicit that threat came last Thursday after an arcing insulator exploded near a platform at Federal Center SW. The explosion, a fireball followed by a shower of sparks, was captured by Metro’s security cameras. On Tuesday, at a sit down with reporters, Transportation Secretary Anthony Foxx described his reaction to the video. ‘It was scary.’”

    But Foxx went on to say that “even more worrisome was Metro’s conduct following the incident.” Foxx indicated that Metro’s response had not been sufficient in view of the seriousness of the incident.”

    On the next day (May 11), Federal Transit Administration Acting Administrator Carolyn Flowers took the unusual action of a letter to WMATA General Manager Paul Wiedefeld, itemizing and prioritizing the necessary repairs: “I am therefore directing WMATA to take immediate action to give first priority to these repairs.” The letter is reproduced below.

    On the same day, the Post editorialized (“Metro’s Dangerous Complicity”): “An overhaul in Metro’s culture is what is needed; that begins with accountability.

    Not only is this an embarrassment for America’s Subway (as a previous Washington Post article suggested, see “Metro sank into crisis despite decades of warnings”), but the necessity for the nation’s second most patronized subway, in perhaps the nation’s most sophisticated metropolitan area, having to be directed (appropriately) by a federal agency is even more astounding.

    At the same time, it is important to note the extraordinary nature of this case. There are many Metro (heavy rail) systems in the nation, as well as many light rail and commuter rail systems. Nor should it be assumed that Metro’s burden is anything more than a result of its own failures. Somehow, for example, New York’s subway manages to safety carry more than 10 times as many riders. None of the many systems has ever required such intervention by the federal government on passenger safety, which is perhaps the most basic requirement of transportation systems. This is not “business as usual.”

  • More Criticism of the Mythical Shift to Transit

    There has been additional attention to the exaggeration of transit ridership trends claimed by the American Public Transit Association. Writing in The Washington Post, David King of Columbia University. Michael Manville of Cornell University and Michael Smart of Rutgers University said that the "association’s numbers are deceptive" and that the "interpretation is wrong.” Noting their strong support of public transportation, King, Manville and Smart said that "misguided optimism about transit’s resurgence helps neither transit users nor the larger traveling public." They further say that "there is no national transit boom."

    They examine the data by metropolitan area and find that "transit use outside New York declined in absolute terms last year, and conclude that this "fact shows how crucial public transportation is to our largest city and how small a role it plays in most other Americans’ lives.

    Also see: No Fundamental Shift, Not Even a Shift.

  • Election: “Stop Portland Creep” Resonates in Suburbs

    Election results from all three of Portland, Oregon’s largest suburban counties indicate a reaction against what has been called "Portland Creep," the expansion of the expansive light rail system without voter approval and the imposition of restrictive densification measures by Metro, the regional land-use agency.

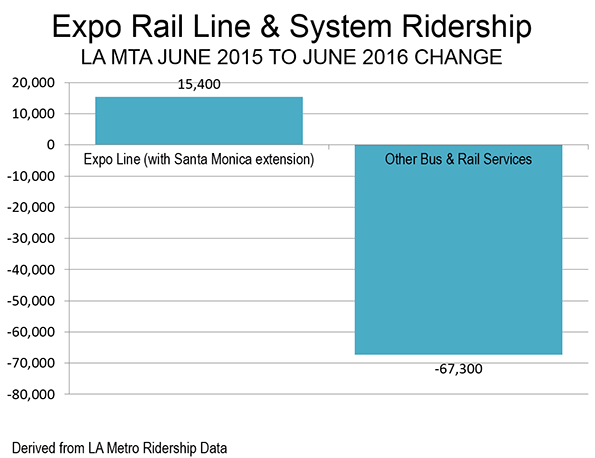
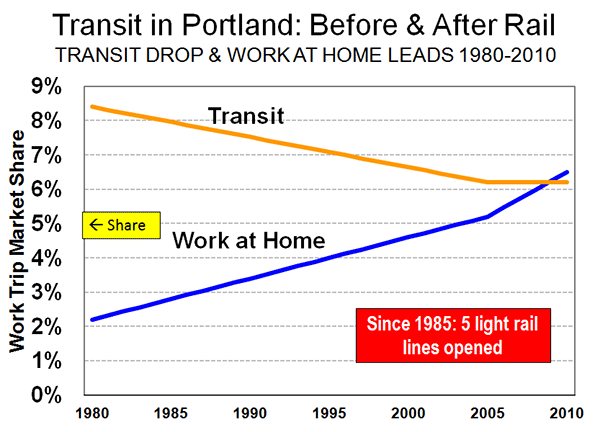
    Portlanders in the three largest Oregon counties (Multnomah, Washington and Clackamas) have previously voted against financing light rail extensions, however the transit agency has found ways to continue the expansion and now operates five lines, with a sixth under construction. While urban rail aficionados tout the success of the Portland system, transit use by commuters has fallen significantly in relative terms from before the opening of the first light rail line. At the same time, working at home, which does not need billions in taxpayer subsidies, has caught up to and passed transit (Figure).

    The electoral events of the past 60 days could severely limit future expansion.

    Clackamas County: Chicanery and its Price

    In a September 2012 election, voters in Clackamas County approved a measure by a 60% – 40% majority requiring that any commitment of funding to rail would require a vote of the people. Perhaps fearing a negative result in the election, the pro-rail Clackamas County commission hastily approved $20 million to support the under construction Portland to Milwaukie (Clackamas County) light rail line.

    Things were to become substantially more difficult for light rail in the November election. In Clackamas County, the two incumbent commissioners on the ballot, both of whom voted for the $20 million bond issue, lost their seats. Voters rewarded their chicanery by replacing them with anti-rail commissioners, leaving the Clackamas County commission with a 3 to 2 anti-rail majority. The Oregonian characterized the election as "a referendum on light rail."

    John Ludlow, who defeated Clackamas County commission chair Charlotte Lehan by a 52% to 48% margin, told The Oregonian:

    "I think the biggest boost my campaign got was when those commissioners agreed to pay that $20 million to TriMet" for Portland-Milwaukie light rail four days before the September election. I think that put Tootie and me over the top." 

    "Tootie" is Tootie Smith, a former state legislator who unseated commissioner Jamie Damon in the same election by a similar margin.

    Washington County, Oregon: Taxpayers Take Control

    Meanwhile, light rail has run into substantial difficulty in suburban Washington County. In September, voters in King City approved a measure to require all light rail funding to be approved by the voters. In the more recent November election, voters in Tigard, the 6th largest city (50,000 population) in the metropolitan area, voted 81%-19% to subject all light rail expenditures to a vote of the people.

    Clark County, Washington: Voters Say No

    Portland’s transit agency also had its eye on expanding light rail service across the state line and the Columbia River to Vancouver, in Clark County, Washington. The plan was to build a new "Interstate Bridge" (Interstate 5) across the river, which would include light rail. The voters of Clark County were asked in a referendum to approve funding for the light rail system and turned it down soundly according to the Columbian, by a 56% – 44% margin.

    But there was more. For some time, citizen activist and business leader David Madore has been working to stop both tolls on the new bridge and light rail service. Madore was elected to the board of commissioners of Clark County at the same time that the light rail referendum was being defeated. Madore, like the two other Clark County commissioners, also hold seats on the transit agency board.

    Tri-Met’s Death Spiral?

    Further, Tri-Met’s dire financial situation could be another barrier to future expansion. As John Charles of the Cascade Policy Institute has shown, Tri-Met’s fringe-benefit bill is astronomically high, at $1.63 for each $1.00 in wages. This is more than five times the average for public employers, according to US Department of Commerce Bureau of Economic Analysis data. Charles refers to Tri-Met as being in a "death spiral" and says that:  

    "The agency is steadily devolving from a transit district to a retirement and health-care center, with unsustainable fringe benefit costs that now far exceed the mere cost of wages."

  • Honolulu Rail Project Legal Problems Mount

    According to the Hawaii Reporter, Honolulu’s rail transit project has lost a major legal test in The Federal Ninth Circuit Court, as Judge Wallace Tashima ruled in  HonoluluTraffic.com v. Federal Transit Administration et al that the city of Honolulu had violated federal environmental law on three counts.

    The plaintiffs included are a coalition of environmental, civic, political and taxpayer interests, including former Governor and mayoral candidate Benjamin Cayetano, University of Hawaii Law professor Randall Roth, Retired Judge Walter Heen, retired businessman and transportation expert Cliff Slater, Dr. Michael Uechi, Hawaii’s Thousand Friends, Outdoor Circle and the Small Business Hawaii Entrepreneurial Education Foundation.

    The plaintiffs and defendants differ strongly on the impact of the ruling, and the defendants are to return to court in December seeking a permanent injunction against the project.

    University of Hawaii Engineering Professor Panos Prevedouros told the Hawaii Reporter that the decision would require environmental planning revisions that could take up to 2 years.

    This setback is in addition to a previous unanimous Hawaii Supreme Court ruling that had already required construction to be suspended and which could delay project for at least a year, according to the Hawaii Reporter. The Supreme Court in Kaleikini v. Yoshioka, ruled that the city of Honolulu failed to comply with the state’s historic preservation and burial protection laws when it did not complete an archeological inventory survey for the 20-mile route before starting construction.

  • BBC Monster Traffic Jam List Includes Lexington, Kentucky? Really?

    The British Broadcasting Corporation (BBC) has just published a list of 10 "monster commutes" around the world. Some are to be expected, and are usually found on any list of extreme traffic congestion, such as Jakarta, Bangkok, Manila, Mumbai, Seoul, Nairobi and Dhaka.

    Lexington? However, reading further it becomes clearer that the BBC story deserves its own exhibit in the "Ripley’s Don’t Believe It" Room at the British Museum. BBC lists Lexington, Kentucky as one of 10 with "monster traffic jams." At first I thought BBC might have listed the wrong "L" place, having intended to cite Lagos or Lima instead. Not so, however since BBC quotes a Lexington commuter who claims to have spent an hour commuting to work one morning.

    That, surely is not the experience of the average Lexington resident. According to the United States Census Bureau, the average work trip travel time, one way, in the Lexington metropolitan area is 21 minutes. This compares to the US national average of approximately 25 minutes. Researchers David Hartgen and M. Gregory Fields estimated the excess travel time during peak hour in Lexington at five percent in 2003 (traffic congestion has not become serious enough to warrant the attention of the long-standing Texas Transportation Institute’s congestion reporting system). A quick review of data supplied by INRIX suggests that about 150 out of more than 180 rated US, European and Canadian metropolitan areas have worse traffic congestion than Lexington.

    Austin? Perhaps a stronger case can be made for the inclusion of Austin, Texas on the list. But even so, Austin barely makes the most congested quarter of the INRIX international list. Austin’s worse than average traffic congestion is the result of its late development an express roadway system, as this metropolitan area of the nearly 2,000,000 population was the last in the nation to connect two freeways together.

    BBC’s Austin commuter is quoted as indicating that he commutes by car, for which "I castigate myself daily." He continues: “I see two things that make me feel both guilty and shocked. A vacant city bus inching along my route and an empty tram cutting across traffic at 5pm." He misses the point. If the city bus is a vacant and the tram is empty, it is because they do not meet the needs of a sufficient number of customers (needs, which by the way can only be defined by consumers, not planners).

    The proof is the crowded buses and trains that converge on six large downtown areas in the United States, where 40 percent to 75 percent of commuters use transit. This is not because the people who work south of 59th Street in Manhattan, in Chicago’s Loop, or the downtown areas of Philadelphia, Washington, Boston or San Francisco have more effectively managed their guilt than the Austin commuter. It is rather because transit meets their needs. Commuters are rational. They take the mode of transport that best suits their needs. Transit’s market shares around the country (many of them miniscule) speak volumes about how well transit meets the needs of potential customers.

    Finally, BBC’s Austin commuter claims that it takes 45 minutes to drive three kilometers (2 miles) to work (walking would be as fast for most people). It is hard to imagine a more unrepresentative commute in Austin. According to the United States Census Bureau, the average one way commute in Austin in 2011 was 26 minutes. Somehow 85 percent of Austin commuters get to work in less time than the Austin commuter, and they travel a lot farther.

  • A Summary of 2011 Commuting Data Released Today

    The Census Bureau’s American Community Survey released its annual one-year snapshot of demographic data in the United States. As usual, this included journey to work (commuting data), which is summarized in the table below.

    American Community Survey Commuting Data
    2011, 2010 & 2000
    ESTIMATES of Total Commuters 2000 2010 2011
    Drive Alone 97.10 104.86 105.64
    Car/Van Pool 15.63 13.27 13.39
    Transit 5.87 6.77 6.96
    Bicycle 0.49 0.73 0.78
    Walk 3.76 3.80 3.89
    Motorcyle, Taxi & Other 1.24 1.60 1.63
    Work at Home 4.18 5.92 5.99
    Total 128.28 136.94 138.27
    In Millions
    MARKET SHARE
    Drive Alone 75.70% 76.57% 76.40%
    Car/Van Pool 12.19% 9.69% 9.68%
    Transit 4.57% 4.94% 5.03%
    Bicycle 0.38% 0.53% 0.56%
    Walk 2.93% 2.77% 2.81%
    Motorcyle, Taxi & Other 0.97% 1.17% 1.18%
    Work at Home 3.26% 4.33% 4.34%
    Total 100.00% 100.00% 100.00%
    Sources: 2000, 2010 Census &  2011 American Community Survey


    Trends Since 2010

    As estimated employment improved from 137.9 million in 2010 to 138.3 from 2010 to 2011, there was an increase of 800,000 in the number of commuters driving alone, which, as usual, represented the vast majority of commuting (105.6 million daily one way trips), at 76.40 percent. This was not enough, however, to avoid a small (0.17 percentage point) decline in market share.

    Car pooling experienced a rare increase of 120,000 commuters, which translated into a 0.1 percentage point loss in market share, to 9.68 percent. Transit increased 190,000 commuters, and had a 0.09 percentage point increase in market share, to 5.03 percent. This brought transit’s market share to above its 2008 share of 5.01 percent and near its 1990 market share of 5.11 percent.

    Working at home increased by 70,000, with a modest 0.1 percentage point increase from 2010.

    Trends Since 2000

    Even with declining falling household incomes and rising gasoline prices, single-occupant commuting continued to rise between 2000 and 2011. Solo drivers increased nearly 8 million, more than the total transit commuting in 2011. Car pooling continued its long-term decline, falling 2.2 million. Transit did well (as would be expected with unfavorable economic conditions and unprecedented gasoline price increases), as we noted last year, having added 1.1 million commuters. This was spread thinly around the country, though with a 70 percent concentration in New York and Washington, DC. Over the period, working at home experienced an increase of 1.8 million, the largest increase outside solo driving.

    Media Attention

    For the most part the commuting data was ignored by the media — and for good reason. The one year changes were predictably modest. However, the exception was USA Today, with a top of the webpage "Fewer Americans Driving Solo" headline. In fact, as noted above, the short term and long term trends reflected an increase in solo driving. Moreover, reading the story it would be easy to get the impression that a sea change had occurred in how people get to work. To its credit, however, USA Today appropriately labeled the likely reasons for the mountains it made into molehills — the economy and gasoline prices.