Tag: transit

  • Transit in Los Angeles: Celebrating the Wrong Thing

    Los Angeles area transit officials celebrated 20 years of urban rail at a Staples Center event on July 23. Over the past 20 years, Los Angeles has opened 2 metro (subway) lines, 4 light rail lines and two exclusive busways (though apparently busways aren’t worth celebrating). Surely, there is no question but that Los Angeles has been successful in opening a lot of new transit infrastructure.

    At the same time, however, The Los Angeles Times reported that Professor James Moore of the University of Southern California, blames the disproportionate financial attention paid to rail projects reduced transit ridership by 1.5 billion (with a “b”) over the same period. The reason is, as Tom Rubin put it, is that many more people can be carried for the same money on buses, “Had they run a lot of buses at low fares, they could have doubled the number of riders.” Rubin was chief financial officer of the Southern California Rapid Transit District, one of the two predecessors of the present transit agency (MTA). The other was the Los Angeles County Transportation Commission, to which I was appointed to three terms.

    Transportation experts were also quoted to the effect that the rail system has done little to reduce traffic congestion or increase the use of mass transit much beyond the level in 1985, when planning for the Metro Blue Line began. Indeed. Traffic congestion has gotten much worse, and traffic volumes have increased materially. Our recent article showed that transit market shares had declined.

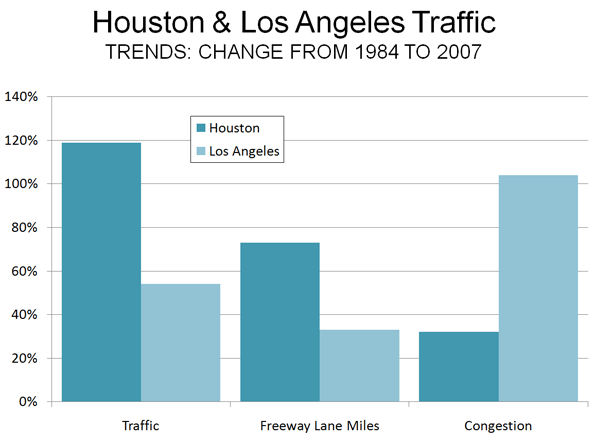
    These results are in stark contrast to Houston, which in 1984 had the worst traffic congestion in the nation. Houston set about to solve the problem by expanding its roadway capacity. Since 1984, Houston’s traffic grew twice as fast as that of Los Angeles, and population grew three times as fast (at least in part because many Californians were moving to Texas). Houston also added freeway mileage at double the percentage rate of Los Angeles. The reward was an increase in traffic congestion less than one-third that of Los Angeles (Figure). The most recent INRIX Scorecard shows Los Angeles traffic congestion to be more than 2.5 times as intense as Houston’s.

    Spending money on the right things makes a big difference. One can only wonder how different things might have been if Los Angeles had invested in the capacity people need (more roads) rather than in politically correct transit facilities that have no potential to reduce traffic congestion or to improve mobility and economic performance.

    There is a lesson from Los Angeles experience both for other areas and other government functions. The test of government performance is outputs, not inputs. Thus, it is appropriate to celebrate large transit market share increases or significant improvements in student achievement, not how many miles of rail are built or how much money is spent on education.

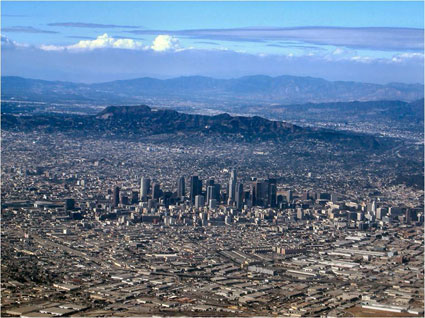
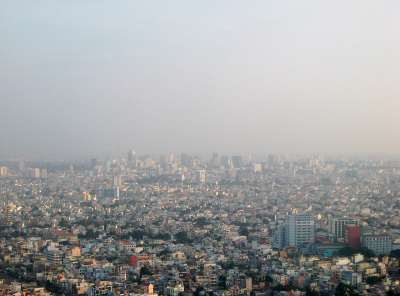
    Photograph: Los Angeles and the San Fernando Valley (by the author)

  • The Fifth Estate Clarifies US Driving and Transit Figures

    Late on July 26 (Washington time), The Fifth Estate corrected the attribution by Professor Peter Newman of Curtain University to the effect that driving was down 43% and transit up 65% in the United States. This issue had been the subject of my column on the same morning. It was a simple decimal error (in the reporting) and has now been corrected on the site. Driving is now reported as being down 4.3% and transit up 6.5%. Professor Newman provided slides with the data to Ms. Tina Perinotti, who forwarded them to me.

    While the new figures are less inconsistent with the official figures than the former, there are still material inconsistencies.

    Driving Trend: Official Data: The slides provided simply refer to the two figures as relating to the past year, without a source or specific period. The 4.3% driving decline is more than double the largest annual decline reported by the official source for such information, the Federal Highway Administration (Figure 1).

    Transit Trend: Official Data: We reviewed the data published from the official sources for transit data (the American Public Transportation Association and the Federal Transit Administration) and found no recent annual data indicating a 6.5% increase in ridership (either in boardings or in passenger miles). Much of the transit ridership gain from 2007 to the peak year of 2008 was lost in 2009, according to data posted by APTA in early March (Figure 2). A later first quarter report by APTA indicates further losses. Moreover, as we indicated in our article, the percentage decline in transit use since the peak year of 2008 is many times that of the decline in driving.

    Not All Percentages Are the Same: Care must also be used in comparing percentage changes between transit and driving, because so little travel is on transit. For example, a one percent increase in roadway urban travel converts to about one-third of a mile per person per day. A one percent increase in transit use converts to about 30 feet per person per day, about the same distance as walking from one side to the other of the average bedroom and back.


    Note: It is possible that the 4.3% driving decline was taken from an interim Federal Highway Administration report indicating that driving declined 4.3% in March 2008 compared to March 2007 (a monthly comparison, not a year on year comparison). This FHWA report, however, is subject to annual revision based upon the more comprehensive Highway Performance Monitoring System, which in 2009 revised the March 2008 such that the annual change became 2.7%.

  • BRT is ERP (or, Bus Rapid Transit is Enlightened Responsible Planning)

    Robert Sullivan’s recent article in New York magazine, “Subway on the Street”, marks a welcome addition to transportation discussions in New York City. New Yorkers are currently faced with seemingly paradoxical transportation plans that call for subway and bus service cuts, while relatively short and exceedingly expensive underground subways are being built (Sullivan discusses both).

    However, also at the same time, a monumental partnership between the city’s transit agency (MTA) and the DOT is taking root. The result is a new bus rapid transit line in the Bronx – Bx12 SBS, short for “select bus service” – the focus of Sullivan’s article.

    To be clear, bus rapid transit is not a New York innovation. Cities throughout the world, and in the United States, have experimented with bus rapid transit lines with general, albeit not absolute, success. But it is nonetheless refreshing to see the largest city in the United States accept buses as potential congestion relief tools.

    Jay Walder, a New Yorker named head of the MTA after holding a similar position in London, brought the same promise of a more fully integrated bus and rail system to his home city.
    Encouraging innovation, expanding applicability and increasing efficiency are not the exclusive domains of the private sector, even if it feels that way. New York is showing, as cities repeatedly do, the potential for public-sponsored reinvention as a result of resilience.

    Howard Kozloff is Manager of Development Strategies and Director of Operations at Hart Howerton, an international strategy, planning and design firm based in New York, San Francisco and London.

  • CA State Treasurer Skeptical of High-Speed Rail

    California High Speed Rail officials and the Governor’s office seem to be suffering from selective hearing. Lawmakers and experts at the University of California’s Institute of Transportation continue to challenge the high-speed rail project’s viability due to precarious statistical projections on ridership and cost. One wonders if developers will reconsider upon hearing California treasurer Bill Lockyer’s recent criticisms.

    Lockyer’s first major issue lies with the basics: the ability to raise enough capital from private sources needed to complete the project. The Rail Authority claims it would need $10 to $12 billion from private investment alone, although some analysts think that, like most of the monetary figures associated with the rail line, this number will ultimately grow. Investors are reluctant to fund such a risky venture, as nothing proposed in this project has proven stable or certain. If investors do indeed close their checkbooks, there is no way the Rail Authority will complete the project.

    Lockyer doesn’t think selling the idea in smaller chunks would work either. He questions the willingness of anyone to buy state bonds for the HSR, even though voters approved $9.95 billion worth in November 2008.

    Despite these reservations, Governor Schwarzenegger is protecting the funding promises made in the 2008 ballot measure. The Rail Authority is also ignoring the warnings of Lockyer and others. They are also trying to start building in the Bay Area in order to meet deadlines for federal funding. But the way things are going, it looks as if federal funding is all they will get. As more and more powerful people add their names to the list of skeptics, the high-speed rail line seems that much closer to complete failure.

    Rather than overriding their critics and spending money they may not get, the Rail Authority should invest in consumer confidence. They need more concrete plans and more promising statistics to create a market for this line because right now, most think the project will turn out to be nothing more than a huge budgetary debacle.

  • 60% of GDP Too Much for High Speed Rail: Vietnam National Assembly

    In a surprise move, the Vietnam National Assembly rejected plans proposed by the government to built a high speed rail line from Ho Chi Minh (Saigon) to Hanoi.

    Some opponents expressed concern that the line would not be competitive with air service. The 900 mile route, which was to operate at up to 186 miles per hour, would take between five and six hours to make the trip between Vietnam’s two principal cities. This compares to the current two hour trip by air. Concerns were expressed that this travel time, combined with fares that would need to be competitive with those of airlines would be insufficient to make the line a viable economically.

    But the strongest objections were expressed with respect to the context of such a large expenditure in a developing nation. The high speed rail line would have cost an amount equal to 60% of Vietnam’s gross domestic product,
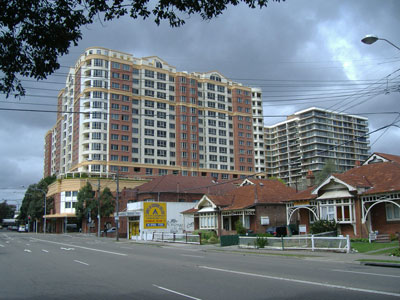
 even before the cost overruns that have typically plagued such projects. This is akin to spending $8.5 trillion on high speed rail in the United States (more than $25,000 per capita).

    National Assembly member Nguyen Minh Thuyet told the Agence France-Press that some children in the Central Highlands can only get to school by swinging on a cable across a river because they have no bridge, questioning the validity of such an expensive project in light of the nation’s low income.

    Photograph: Ho Chi Minh (Saigon)

  • Curbing Euro-Envy

    Times are tough in the newspaper business. For example, The New York Times used to have a robust fact-checking department. Either the staff has been laid off or maybe they can’t keep up with the errors, either of which could explain the op-ed piece “Europe Energized.”

    Hill’s piece is classic cheerleading. He would have us believe that Europe has significantly reduced its reliance on oil, as its governments have enticed the citizenry out of cars and into mass transit and planes. Starting with the contention that Europe has the same standard of living as the United States, he indicates that Europe has made much greater progress in reducing energy use and carbon emissions.

    In fact, Europe does not enjoy the same standard of living as the United States. In 2009, the gross domestic product (purchasing power parity) was approximately one-third less ($14,000 less). For most households in Europe and the United States, that is a not an inconsequential amount of money. One reason for Europe’s lower rates of energy consumption is its historically lower income levels.

    Hill claims substantial reductions in oil consumption relative to the United States. However, Europe has not sworn off oil. Indeed, according to International Energy Agency (IEA) data, Europe’s oil consumption per capita dropped only marginally more than that of the United States between 1980 and 2006. Nor has Europe done a better job of becoming more energy efficient. Measured in tons of oil equivalence, the United States has reduced its per capita energy consumption more than Europe since 1980, again based upon IEA data. It is, of course, easier to reduce oil consumption with near static population growth.

    EU data indicates that mass transit’s market share in Europe has been declining for decades (like in the United States). Further, despite all the new high speed rail lines, cars and airplanes have accounted for the greatest travel increases. In 1995, airplanes carried a slightly smaller volume (passenger kilometers) than passenger railways, including high speed rail. By 2008, airlines were carrying 37% more passenger kilometers than rail, despite a huge expansion of high speed rail. Since 1995, at least 15 passenger kilometers have been traveled by car for every additional passenger kilometer traveled by rail, high speed or not. Meanwhile, Europe’s truck dependent freight system is less fuel efficient than America’s, which relies to a greater degree on freight railroads.

    None of this is to suggest that Europe does not lead the United States in some fields. There is no question that cars get much better mileage in Europe. By 2020, new cars are scheduled to achieve more than 60 miles per gallon, which is near double the US expectation. Europe is leading the way in automobile fuel efficiency and is demonstrating the massive extent to which improved fuel efficiency can accomplish tough environmental goals.

    Yet, curiously, no interest has been expressed by the Euro-Envious to implement European highway speed limits. Recently, Italy raised maximum speeds on some roads to 93 miles per hour, France, Austria, Denmark, Slovenia and others have 81 mile per hour limits and there are no speed limits on much of the German autobahn system. No US speed limits are this high.

    Having happily lived both within the pre-1200 (AD) boundaries of Paris and the urban fringes of four major US urban areas, it seems that both sides of the Atlantic have their strengths and weaknesses. Detailing them requires getting the facts right.

  • Urban Economies: The Cost of Wasted Time

    Much has been written in recent years about the costs of congestion, with ground breaking research by academics such as Prud’homme & Chang-Wong and Hartgen & Fields showing that the more jobs that can be accessed in a particular period of time, the greater the economic output of a metropolitan area. Greater access to jobs not only improves economic growth, but it also opens greater opportunities for people and households to fulfill their aspirations for a better quality of living.

    Congestion costs are principally the cost of wasted time, which the most recent Texas Transportation Institute (TTI) Annual Mobility Report places at $15.47 per hour. It is important to understand that much of this cost is not because the car is not moving. It is rather because time that could be used more productively is being consumed.

    Steve Polzin of the University of South Florida has raised a related issue that has been virtually absent from urban planning discussions in a Planetizen blog entitled “The Cost of Slow Travel.” Noting that transit travel time is considerably slower than auto travel times, Polzin broadly estimates that slower travel on transit costs the nation $44 billion, which is two-thirds the $66 billion. Polzin does not suggest that this is a final, “take to the bank” lost productivity number, but does suggest attention to the issue.

    Such thinking is long overdue. Wasted time is wasted time. Most wasted time occurs with respect to travel during peak periods, when most people are commuting to or from work. The $66 billion in wasted time by automobile translates into $550 per commuter per year in the United States (Based upon 2007 commuting data from the American Community Survey). The cost of wasted time for transit is 12 times as high, at $6,500 per commuter, using Polzin’s estimate. Of course, as Polzin is quick to point out, these are not final figures. However, they are a starting point for important (and perhaps “inconvenient”) economic research that has been largely kept off the agenda up until now.

  • Rail Transit Expansion Reconsidered

    More than two years ago we suggested in these pages that the era of multi-billion dollar system-building investments in urban rail transit is coming to an end. We wrote: “The 30-year effort to retrofit American cities with rail infrastructure, begun back in the Nixon Administration, appears to be just about over. The New Starts program is running out of cities that can afford or justify cost-effective rail transit investment. To be sure, federal capital assistance to transit will continue, but its function will shift to incrementally expanding existing rail networks and commuter rail services rather than embarking on construction of brand new rail systems.” (“Urban Rail Transit and Freight Railroads: A Study in Contrast,” February 18 2008).

    Now comes a startling new revelation from a senior U.S. DOT official that even rail extensions may be at risk. Speaking at a National Summit on the Future of Transit before an audience of leading transit General Managers on May 18, Federal Transit Administrator Peter Rogoff questioned the wisdom of expanding rail networks when money is badly needed to maintain and modernize existing facilities:

    “At times like these, it’s more important than ever to have the courage to ask a hard question: if you can’t afford to operate the system you have, why does it make sense for us to partner in your expansion? If you can’t afford your current footprint, does expanding that underfunded footprint really advance the President’s goal for cutting oil use and greenhouse gases… Or are we at risk of just helping communities dig a deeper hole for our children and our grandchildren?”

    In Rogoff’s judgment, the first priority for the transit industry is to follow the precept “fix it first.” “Put down the glossy brochures, roll up our sleeves, and target our resources on repairing the system we have,” he told the assembled transit officials. Transit systems that don’t maintain their assets in a state of good repair risk losing riders, he warned. The Administrator cited the preliminary results of an FTA study of the financial needs of 690 public transit systems across America that show a $78 billion backlog of deferred maintenance. Fully 29 percent of all transit assets are “in poor or marginal condition.” The challenge facing transit managers is to resist the siren call of new construction and devote money to the “unglamorous but absolutely vital work of repairing and improving our current systems.”

    At first blush Rogoff’s position would appear to go counter to the Administration’s announced policy of favoring public transit. Hasn’t Transportation Secretary Ray LaHood repeatedly championed public transit as an alternative to highway expansion? Hasn’t the Administration’s proposed Fiscal Year 2011 budget include major commitments to funding new rail lines in Denver, Honolulu, Minneapolis and San Francisco? Hasn’t the Federal Transit Administration dropped the former emphasis on cost-effectiveness as an evaluation factor in rail project selection in favor of a broader range of factors? All true.

    But fiscal realities can do wonders to bring federal officials down to earth. The Transit Account of the Highway Trust Fund is barely solvent. The U.S. DOT budget will grow by only one percent in 2011. With commendable consistency and fairness, the Administration seems to have decided to apply the same investment standard to transit as it has preached and laid down for highways: Forget about massive capacity expansion; focus on getting the most out of the assets already in place by maintaining them in a state of good repair. To critics of the DOT’s new posture – and there will be some – a good answer could be: It’s just a different way of looking at what it means to be pro-transit.

  • Sydney: Choking in its Own Density

    The Daily Telegraph reports that air pollution is getting worse in Sydney, with one in ten days rating “poor” in 2009. Critics of the ruling Labor state government claim that increasing air pollution and the lack of public transport are the cause. They are half right.

    Sydney’s Densification is Intensifying Traffic Congestion: Sydney’s intensifying traffic congestion contributes substantially to rising air pollution.

    The increasing traffic congestion is an inevitable consequence of the state government’ s “metropolitan strategy” which is “jamming” high rise residential buildings into suburban detached housing neighborhoods. The mathematics of traffic and densification is that unless each additional resident drives minus kilometers and minus hours, there will be more traffic, even before considering the impacts of intensifying commercial and heavy vehicle traffic.

    The road system was not built for higher densities and neither was other infrastructure such as sewers or the water system, as Tony Recsei has noted in his preface to the 6th Annual Demographia International Housing Survey.

    The fact is that higher densities are strongly associated with more traffic, which means greater traffic congestion. The additional stop and go traffic produces greater pollution on the roads adjacent to which people and their children live. It also means more greenhouse gas emissions, because fuel consumption increases as traffic congestion intensifies.

    The association between higher densities and greater traffic congestion is also indicated by the ICLEI-Local Governments for Sustainability Density-VMT Calculator, based upon Sierra Club research. According to the Calculator, under the urban consolidation (“smart growth”) scenario, residential housing would be 37 housing units per hectare, as opposed to its “business as usual” scenario at a density of 10 housing units per hectare. The density of traffic (vehicle kilometers per square kilometer) under the higher density “urban consolidation” strategy would be 2.5 times as high as under the “business as usual” scenario.

    According to federal Bureau of Transport and Regional Economics, Sydney’s total traffic volume is projected to increase nearly 20% over the next decade. Nearly half of the increase will come from commercial and heavy vehicles. With little or no expansion of the urban footprint, there will be nowhere for the new traffic to go except onto the existing already over-crowded roadways.

    Stuck in Sydney’s Traffic: Already, the average one-way trip to work in Sydney is longer than in all but one of the 52 metropolitan areas in the United States with more than 1,000,000 population. Only New York takes as long as Sydney, because so many people use public transport, which is inherently slower for nearly all trips.

    Of Blind Faith: Public Transport: Public transport serves as an article of faith to which officials cling in the innocent or cynical hope that it can reduce traffic congestion. There is no doubt of the good that public transport can do to get people to the central city (CBD), with its highly concentrated employment. However, Sydney’s CBD oriented system is over-crowded. A succession of state governments have been incapable of providing sufficient service to make the trip comfortable for the less than 20% of Sydney employees who work there. Proposals to centralize more of Sydney’s employment in the CBD could not be more wrong-headed.

    Transit is about the CBD, whether in Sydney, Toronto, Portland or Atlanta. The public transport system capable of attracting a significant number of commuters to the smaller concentrated centers like Chatswood, Parramatta, or Norwest (much less the dispersed employment throughout the rest of the metropolitan area) has never been conceived, much less seriously proposed or built.

    Why We Regulate Air Pollution: Public health was the very justification for regulating air pollution. Air pollution’s negative impacts are principally local. The consequences are measured reduce the quality of life of people intimately exposed to the more intense air pollution from nearby roads.

    Higher densities come with a price. Higher densities are producing greater traffic congestion, higher levels of air pollution and greater public health risks. This is just the beginning.

    Photograph: Strathfied, Sydney: Densification of detached housing neighborhood.

  • Norfolk Light Rail: Expensive Rising Tide

    The Virginian Pilot reports that the cost of the Hampton Roads (Virginia Beach-Norfolk metropolitan area) “Tide” light rail line has now escalated to nearly $340 million. This is up nearly one-half from the estimates made when the project was approved by the Federal Transit Administration. According to federal documentation, the line will carry 7,100 daily passengers in 2030. This means that the capital cost alone will amount to an annual subsidy of approximately $6,500 per daily passenger (using Office of Management and Budget discount rates), plus an unknown additional operating subsidy. This is enough to lease every daily commuter a new Ford Taurus for the life of the project (assumes a new car every 5 years and includes future car price inflation).

    The light rail line cannot be expected to do much for transportation. Even if the line reaches its projected ridership (many do not) by 2030, it will carry only 0.1% of the travel in the metropolitan area (one out of every 1,000 trips).