Tag: Transportation

  • Anaheim Transit: Suck It Up

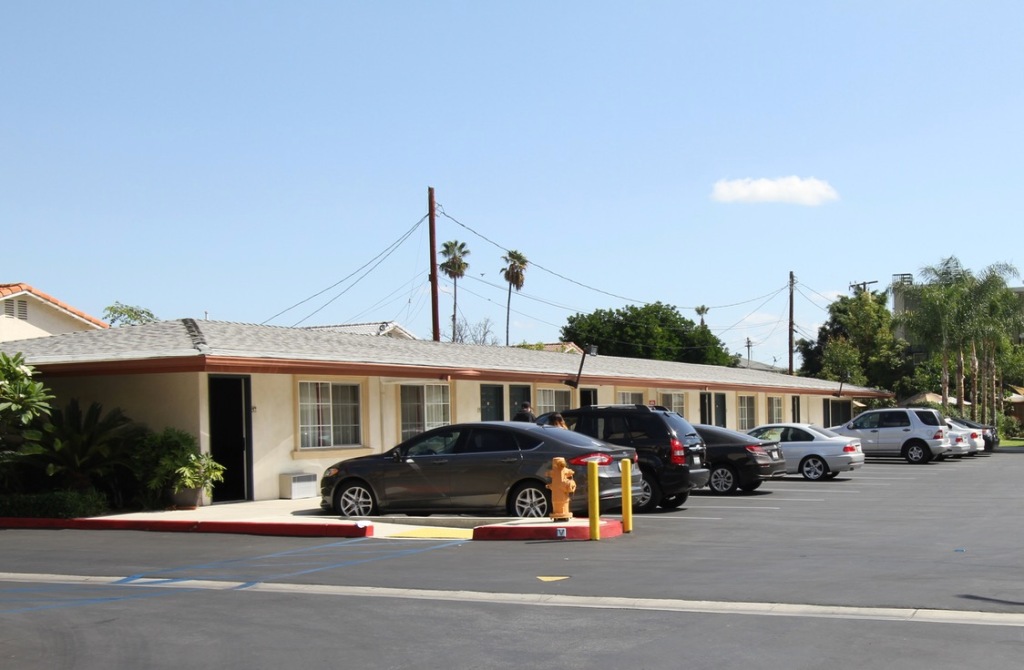
    When I was a kid back in 1971 I lived in Anaheim, California where my mom was a waitress at a local amusement park. Exploring Orange County as an adult recently it all felt more or less the same as I remembered – only more so. The primary adjective has always been beige. The last vestiges of orange groves that still lingered in my youth are long gone, but the tidy neighborhoods of modest tract homes, strip malls, and motels are all still there behind the shiny new stuff.

    I was asked to write about Orange County as part of a land use and transportation conference so I went straight to the new ARTIC intermodal transit center. The boosters for ARTIC use words like “iconic,” “transformative,” “unique,” “prestigious,” and “catalytic” to describe the transit hub. There’s a lot of talk about the cooperation of numerous agencies and private firms that all collaborated to make the $185 million project happen. The structure is about getting people excited about Anaheim. The nuts and bolts of transportation itself are peripheral.

    Cut to the poor bastard out there somewhere on an anonymous street in Orange County waiting (and waiting, and waiting) for a bus to arrive so he can catch his transfer and get from Point A to Point B. The really transformative thing that would get him excited about transit would be more frequent service and a trip that took twenty minutes instead of an hour and a half. ARTIC does nothing for him. But that was never the point. ARTIC isn’t about transit.

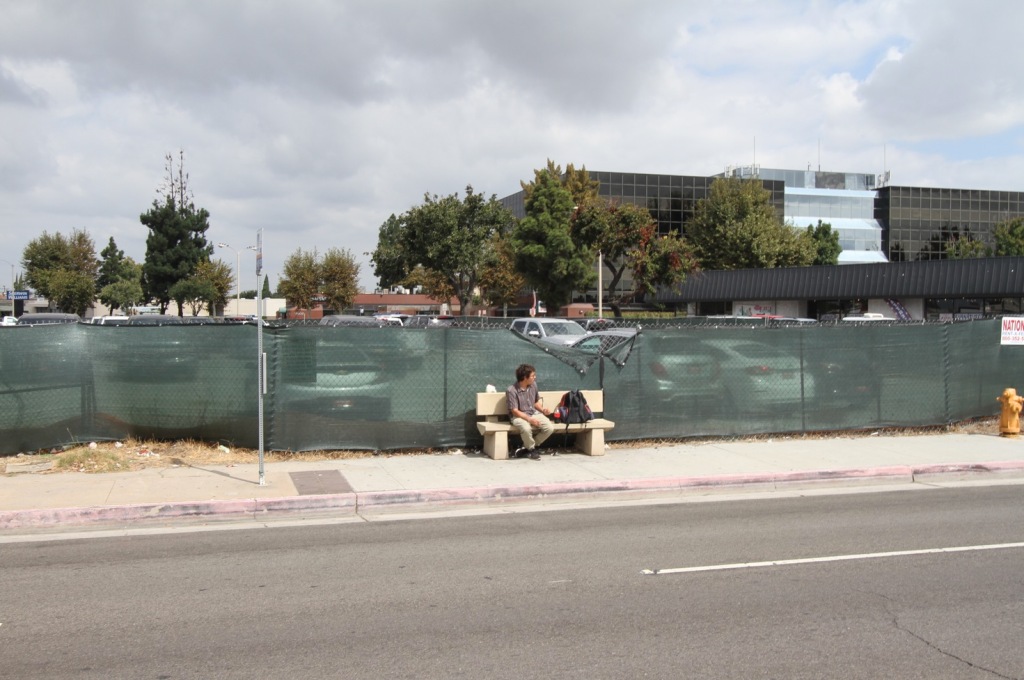
    I was staying in nearby Garden Grove six miles away from ARTIC and I decided to test the process of moving around Orange County by public transit. An internet query described a trip of an hour and five minutes by bus. I sat at a bus stop and waited with my fellow travelers and chatted with them about their daily experience. The bus got them where they needed to go, but it wasn’t great. After thirty minutes the bus appeared. I calculated the wait for the transfer along the way and then the trip back again and realized the bus would suck up three hours of my day. And I was going to be cutting it close for an appointment that afternoon.

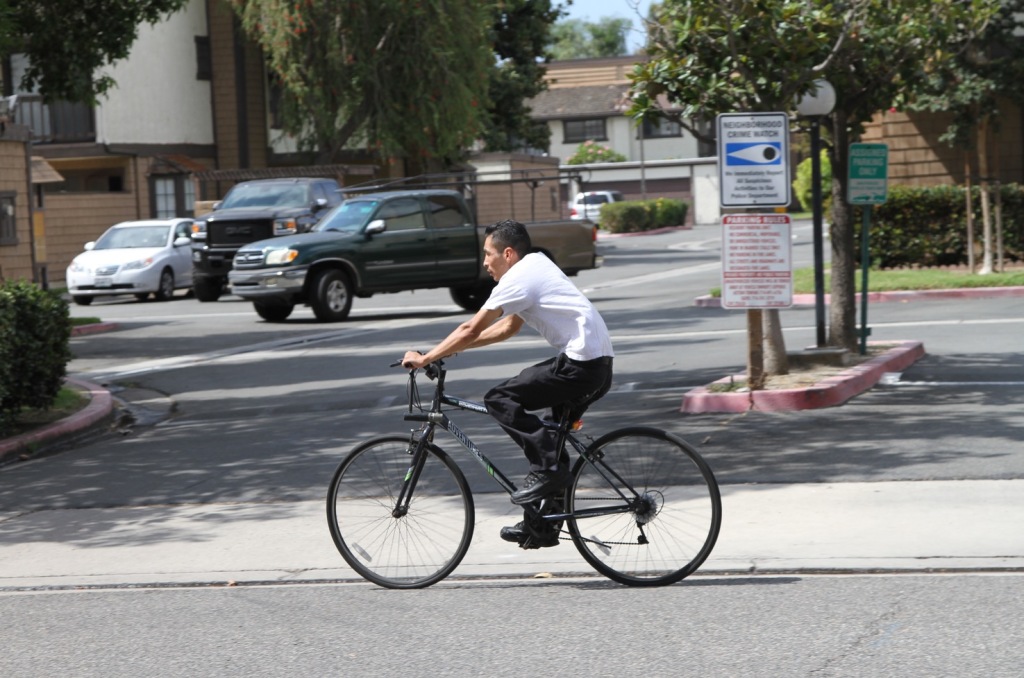
    Traveling by bike was going to take thirty seven minutes and it was all flat. I live in a transit rich neighborhood in San Francisco and I prefer my bike to transit most of the time. But as an out-of-town visitor I didn’t have a bike. I searched for bike rental facilities and there weren’t any near me. And there was the reality that most of the trip would be on the side of high speed eight lane arterials. It would have been doable, but not amazingly fun.

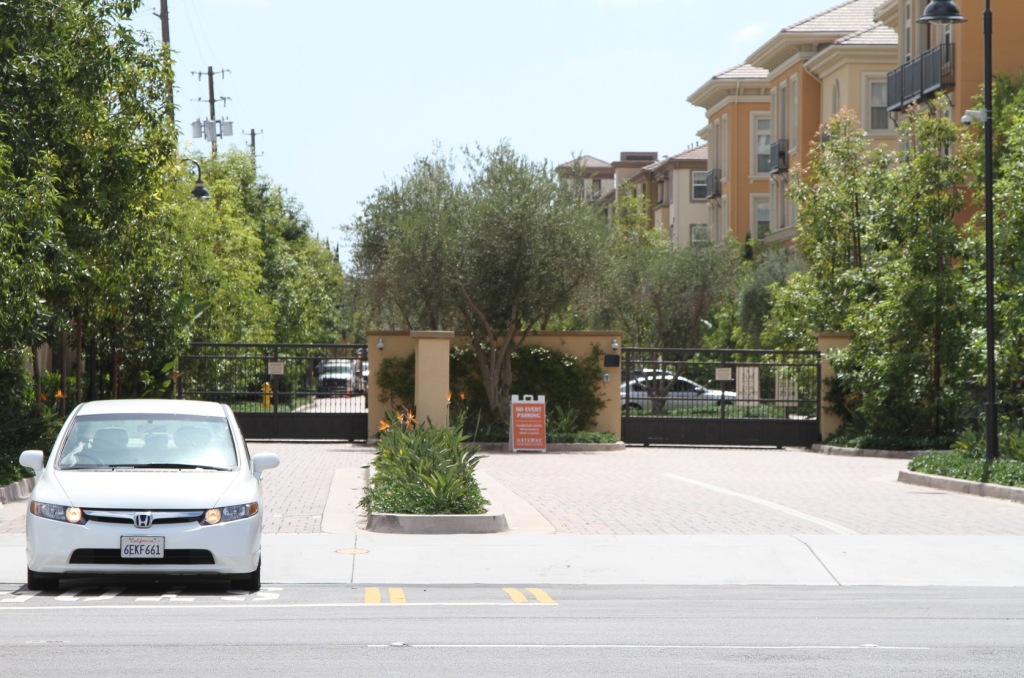
    Driving the six miles to ARTIC would take thirteen minutes so I walked back to my car. Here’s where I got a glimpse in to the prevailing culture of Orange County. I parked on a quiet residential side street and when I reached my car a note had been left on my wind shield. I was parked legally on a public street that had no restrictions. I wasn’t blocking anyone’s access and the street was mostly empty. The house in question had a two car garage and a driveway that could accommodate half a dozen vehicles. The parking problem wasn’t physical. It was emotional. Suburbanites don’t like their psychic space interfered with by interlopers. This goes a long way to explaining the transportation dynamics in the region.


    Google


    Google


    Google


    Google

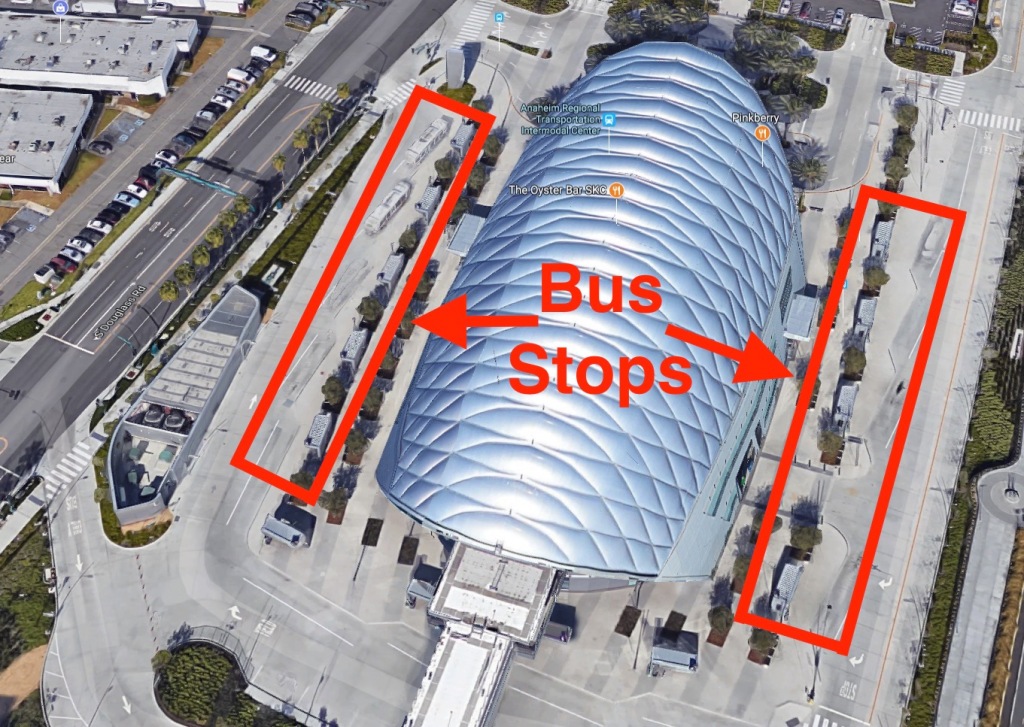
    ARTIC is so big that it’s easier to get a feel for the place on Google rather than on the ground. The train platform is at one end, the bus stops are on either side, there’s a bike path along one edge of the property, and parking is everywhere. You’ll notice that the elegant structure itself has no real function. It’s purely decorative and designed to make a statement on the skyline. It could be replaced by a few porta-potties and a food truck and the transit stuff would be totally unaffected.


    Google

    Notice the transit hub is in the middle of absolutely nothing. The site is bound by the Santa Ana River on one side, a giant freeway on the other, and massive parking lots for Angel’s Stadium and Honda Center. I dare anyone to walk from one of these buildings to another. Even if I had managed to take a bus or train to ARTIC the destination wouldn’t have rewarded the effort.


    Google

    During the boom of the early 2000s plans were drawn up to transform the aging industrial properties in the area to higher value residential, commercial, and professional uses. The authorities in Anaheim built ARTIC as a shiny temple to lever development of the nascent urban center called the Platinum Triangle. Those plans crashed with the 2008 financial crisis and are only now ramping back up.

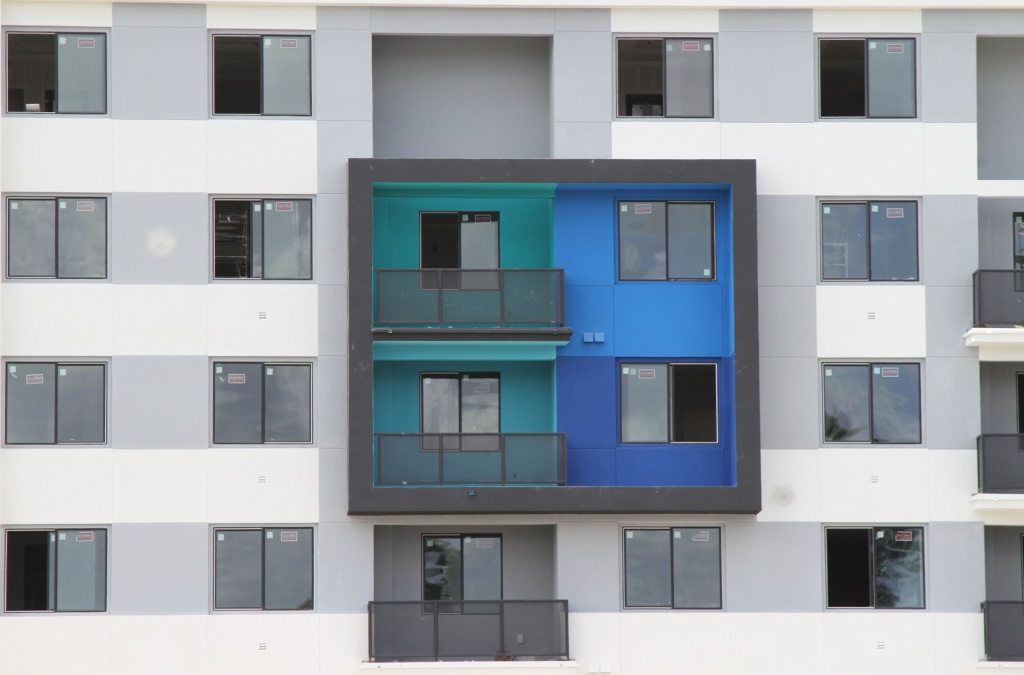
    The predominant design criteria for most of these new buildings involves suburban expectations. The interiors of the apartments as well as the private amenities within these complexes are quite nice and reflect the kinds of things affluent people have come to expect from single family homes in gated communities: greenery, swimming pools, convenient parking, privacy and security protocols. It’s all just been super sized at higher density. But when you’re outside of these buildings you stand between fortified shrubbery and ten lanes of traffic. People drive to the parking deck at the shopping mall or office park which is also hermetically sealed. It ain’t Paris.

    Ridership at ARTIC is considerably lower than anticipated for the simple reason that the physical environment is brutal for anyone who isn’t in a car – and that isn’t likely to change for a very long time. The density is coming. The urbanism isn’t. As I explored these new complexes I discovered that each of the lobbies and sales offices were accessed by the parking garage rather than the street. No one expects future residents to ever arrive on foot. This is Orange County… I talked to many of the low wage workers like the parking attendants. They all live in other more affordable cities at some distance. I asked them if they take transit. Not if they can possibly avoid it.

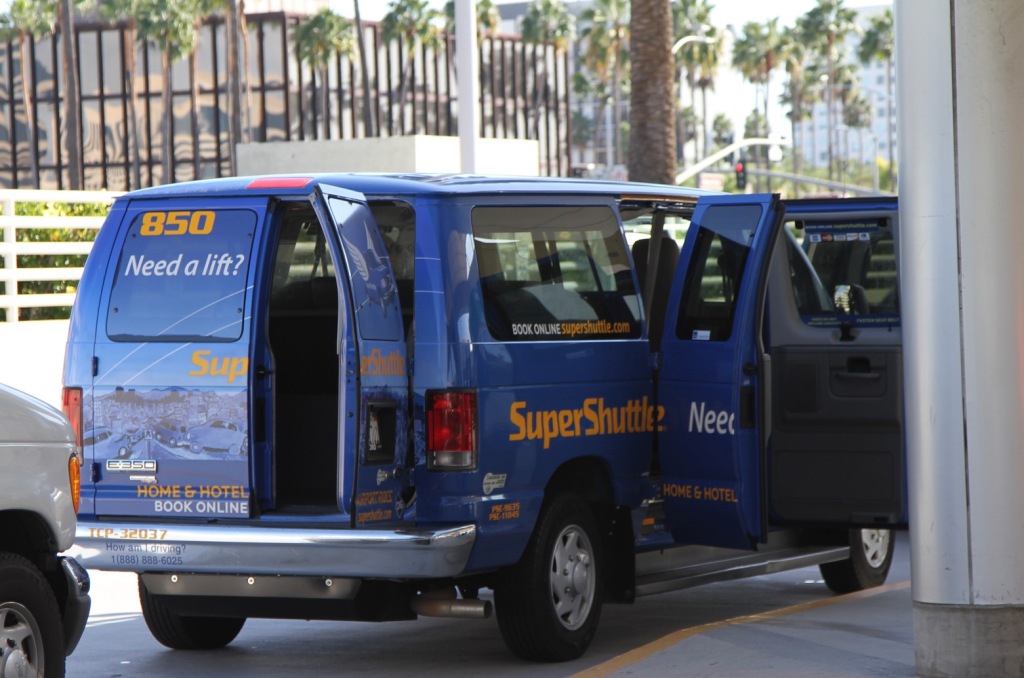
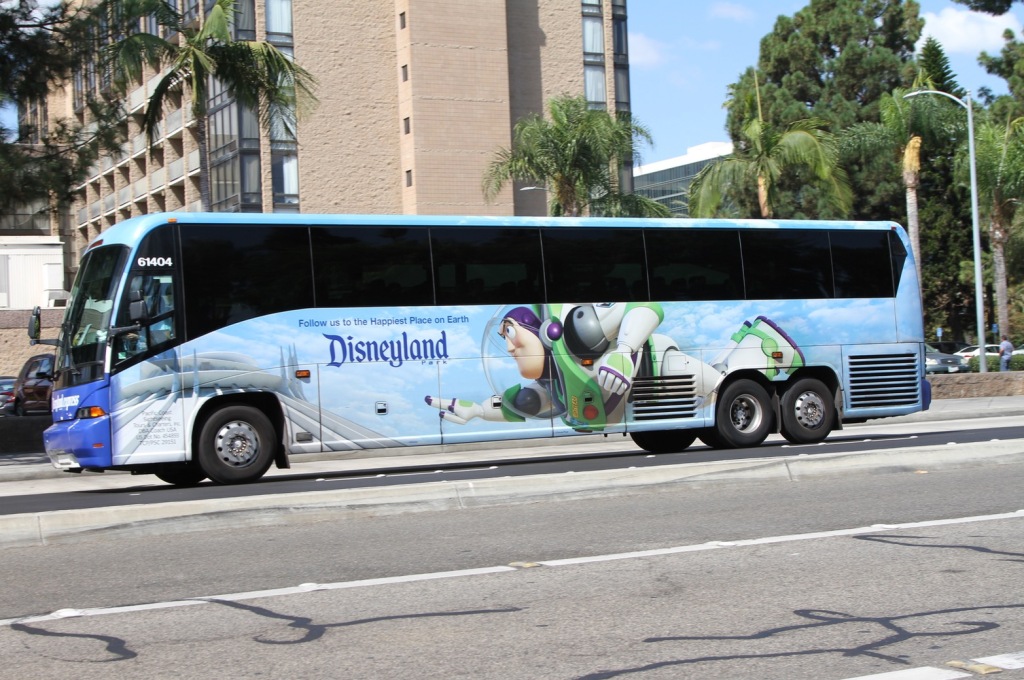
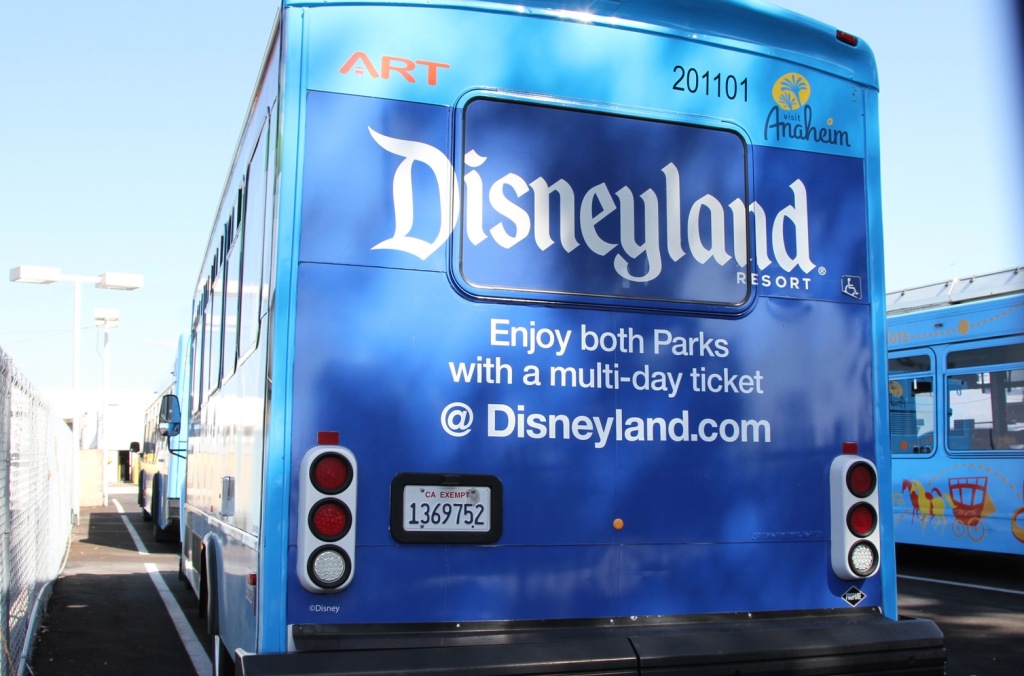
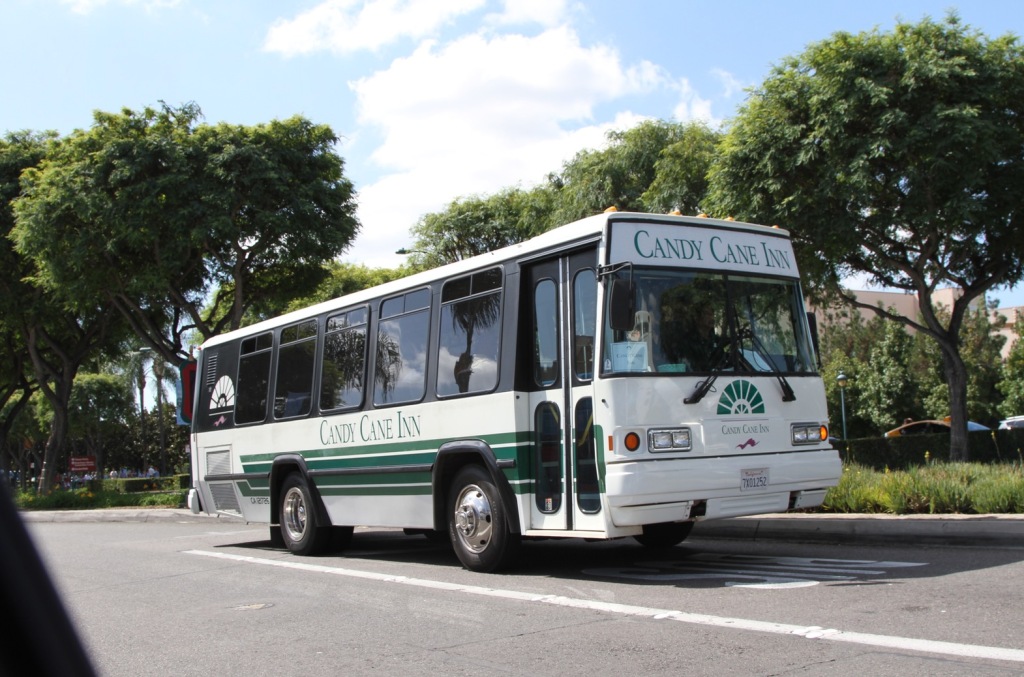
    Here’s how transit really works in Anaheim. Specific vehicle fleets take certain kinds of people to particular sorts of destinations. Both the populations and the destinations are cherry picked. The right kinds of people get to where they need to go quickly and efficiently. Everyone else… Suck it up.

    This piece first appeared on Granola Shotgun.

    John Sanphillippo lives in San Francisco and blogs about urbanism, adaptation, and resilience at granolashotgun.com. He’s a member of the Congress for New Urbanism, films videos for faircompanies.com, and is a regular contributor to Strongtowns.org. He earns his living by buying, renovating, and renting undervalued properties in places that have good long term prospects. He is a graduate of Rutgers University.

  • What Does the Future Hold for the Automobile?

    For a generation, the car has been reviled by city planners, greens and not too few commuters. In the past decade, some boldly predicted the onset of “peak car” and an auto-free future which would be dominated by new developments built around transit.

    Yet “peak car,” like the linked concept of “peak oil” has failed to materialize. Once the economy began to recover from the Great Recession, vehicle miles traveled, sales of cars, and particularly trucks, began to rise again, reaching a sales peak the last two year. Instead, it has been transit ridership that has stagnated, and even fallen in some places like Southern California.

    Demographics — notably the rise of the millennial generation — were once seen as the key to unlocking a post-car future. Yes, younger people have been slower to buy cars than their predecessors, much as they have been slow to get full-time jobs, marry or buy homes, but more are now driving, so to speak, the car market, representing the largest share of new automobile buyers.

    Convenience can’t be banned

    The persistence of personal transportation has little to do with the much hyped “love affair” with the automobile but convenience and access to work. Simply put, with a few notable exceptions, Americans live in increasingly “dispersed regions.” Transit works brilliantly, as Wendell Cox and I demonstrated recently in a paper for Chapman’s Center for Demographics, to downtown San Francisco and a few other “legacy” urban centers, notably New York which accounts for a remarkable 40 percent of all transit commuting in the United States.

    Yet, overall, 90 percent of Americans get to work in cars. Access to jobs represents a key factor. University of Minnesota research shows that the average employee in 49 of the nation’s 52 major metropolitan areas can reach barely 1 percent of the jobs in the area by transit within 30 minutes while cars offer upwards of 70 times more access. This practical concern does much to explain why up to 76 percent of all work trips remain people driving alone.

    Read the entire piece at The Orange County Register.

    Joel Kotkin is executive editor of NewGeography.com. He is the Roger Hobbs Distinguished Fellow in Urban Studies at Chapman University and executive director of the Houston-based Center for Opportunity Urbanism. His newest book is The Human City: Urbanism for the rest of us. He is also author of The New Class ConflictThe City: A Global History, and The Next Hundred Million: America in 2050. He lives in Orange County, CA.

    Photo: Nissan_LEAF_got_thirsty.jpg: evgonetwork (eVgo Network). Original image was trimmed and retouched (lighting and color tones) by User:Mariordoderivative work: Mariordo [CC BY 2.0], via Wikimedia Commons

  • Case Studies in Autonomous Vehicles, Part I: Shared Use Vehicles and the Challenge of Multiple, Intermediate Stops

    There has been a lot of discussion about the potential of autonomous vehicles to change our transportation landscape, in particular the potential for such cars to be shared, reducing car ownership, parking needs and congestion on our roads. A principle idea behind this concept is that since autonomous vehicles can be driven from stop to stop without a driver, they will be cheaper and more mobile, prompting current car owners to switch to mobility as a service (MaaS) where rides are purchased on an as needed basis.

    A recent report by the consulting firm McKinsey & Company notes that although ridesharing services are growing, they still represent only about one percent of the vehicles miles traveled in the United States each year. The development of autonomous vehicles by itself is unlikely to radically change this statistic. Why not? Viewed from the perspective of the consumer-passenger, the fact that autonomous vehicles can pick up passengers all day without a driver does not in itself present a compelling reason for a person to switch from ownership to sharing. Rather, a number of other considerations, including convenience, safety, speed, and overall cost, likely will shape consumer decisions about whether to own or share. So while autonomous vehicles may be a necessary condition for widespread ride sharing, they are not sufficient. In other words, automation alone will not be enough.

    Viewed from this lens, we need to think about how to design autonomous vehicles and our urban landscape to encourage MaaS (even if this consists only of single passenger rides in one “shared” vehicle). In so doing, we should acknowledge that sharing will not just happen. Rather, the experience of sharing vehicles and/or rides must be equal to or more compelling than owning in terms of convenience, reliability, cost and other factors.

    The Challenge of Multiple, Intermediate Stops

    One of the biggest challenges to shared use of autonomous vehicles lies in the need for individuals to make multiple, intermediate stops during the course of their trip and store goods along the way. A few examples are helpful to consider:

    Example 1 – Family Beach Day

    A family goes to the beach for the day, stopping first by car at the convenience store for 15 minutes to pick up some sunscreen and some snacks. They throw these items into their trunk and then go to the beach. When they arrive at the beach, they need a place to store their personal belongings such as keys, etc. so they hide them in their vehicle. When they are ready to head back home, they put their used beach towels and other equipment back in their trunk and ride home. Since they are making multiple stops and need to store belongings both during the interim stop and at their destination, the family may choose to drive their own car rather than using a ride hailing service. Also, they don’t want to be dropped off at their initial stop at the convenience store, have to wait a second time to get picked up to go to the beach, and then a third time to return home, incurring charges for each ride.

    Example 2 – Shopping Excursion

    A couple wants to visit three shops in three different neighborhoods. Like our beach going family, they may need to store any goods they purchase during the course of their journey. This could lead them to drive themselves rather than use a ride hailing service. Also, if they use a ride-hailing service, they will have to pay for three sets of rides. Autonomous vehicles may make these rides less expensive but they will not necessarily solve the logistical considerations.

    Multiple, intermediate stops raise two significant challenges for shared use vehicles: (1) the challenge of where passengers store belongings during multiple, intermediate stops; and (2) ride-hailing services become more expensive for passengers who need to pay for multiple-destination rides.

    Most individuals at some point need to make multiple, intermediate stops and to store possessions along the way. If such individuals have such needs even a handful of times, there may be a compelling case for them to continue owning a vehicle rather than using shared car services. To encourage ride sharing will require some creative thinking about how to structure this service and accommodate shifting logistical and storage needs. This might include new forms of personal and urban storage or amenities included in shared vehicles that make it easier to handle multiple stops. The key point is that automation alone will not solve all our problems. Rather, we will need to “work on it” just like most other endeavors.

    Conclusion

    Much has been said about the potential for autonomous vehicles to drive MaaS and convert vehicle owners to purchasers of trips on an as-needed basis. There is exciting potential in this idea and one that could transform our landscape in a positive manner. However, such thinking sometimes ignores the need for multiple, intermediate stops, and the accompanying “dwell” time that comes with them. These types of trips present a significant challenge to utilization of shared use vehicles. Ride hailing companies and anyone with an interest in expanding the market for MaaS should carefully think through exactly how trips can be engineered so as to make them equivalent or superior to the experience of owning a vehicle.

    Blair Schlecter is based in Los Angeles and writes about transportation policy and innovation. He can be reached at schlecterblair@gmail.com.

    Photo: Flckr user jurvetson (Steve Jurvetson). Trimmed and retouched with PS9 by Mariordo [CC BY-SA 2.0], via Wikimedia Commons

  • Transit Work Access in 2016: Working at Home Gains

    Working at home continues to grow as a preferred access mode to work, according to the recently released American Community Survey data for 2016. The latest data shows that 5.0 percent of the nation’s work force worked from home, nearly equaling that of transit’s 5.1 percent. In 2000, working at home comprised only 3.3 percent of the workforce, meaning over the past 16 years there has been an impressive 53 percent increase (note). Transit has also done well over that period, having increased approximately 10 percent from 4.6 percent.

    Automobiles continue to be the “work horse” of employment access, with 76.3 percent of the market driving alone and 9.0 percent car pooling or van pooling. By comparison, driving alone was the mode of access for 75.7 percent of workers in 2000 and car pooling or van pooling accounted for 12.2 percent Walking has a 2.7 percent market share, down from 3.3 percent in 2000. On a percentage basis, bicycles, although still a comparatively tiny share, have done about as well as working at home, increasing percent, from 0.4 percent to 0.6 percent between 2000 and 2016, a 43 percent increase (Figure 1).

    The market share in the “other” category has stayed constant, at 1.2 percent in both 2000 and 2016. This category includes other modes, including motorcycles, taxicabs and the more recently popular ride hailing services. Despite some thought that Uber and Lyft have begun to attract riders from transit, the work trip data contains no evidence of it. The “other” category market share in 2016 was the same as in 2010 (Figure 1 and Figure 2).

    Transit and Work at Home Market Share

    Transit has experienced by far its best work trip trend since World War II over the past 16 tears. The 4.6 percent share in 2000 was the nadir, in a fall from 12.1 percent in 1960, the earliest work trip data available. Transit’s share has continued to grow modestly since 2010, from 4.9 to 5.1 percent, though widespread overall transit ridership declines have been reported in the last year (here and here).

    The work at home share has, in contrast, risen strongly and nearly closed the gap with transit. In 2000, transit had an approximately 1.7 million advantage on working at home. By 2016, the difference had fallen below 60,000. Now, 43 of the 53 major metropolitan areas (over 1,000,000 population) — including the second largest metropolitan area Los Angeles — have more people working at home than riding transit to work.

    Comparing Working at Home with Transit in New Rail Metropolitan Areas

    Even huge expenditures of taxes have failed to keep transit more popular with workers than working at home in many metropolitan areas. This includes metropolitan areas that have built new rail systems:

         •  Austin, Charlotte, Dallas-Fort Worth, Nashville and Phoenix where nearly four or more times      as many work at home as commute by transit.

         •  Orlando and Sacramento where about three times as many people work at home as use      transit.

         •  Atlanta, Denver, Houston and Riverside-San Bernardino, St. Louis, San Diego and Virginia      Beach-Norfolk, where about twice as many people work at home as ride transit to work.

         •  The work at home advantage over transit is smaller in Miami, Minneapolis-St. Paul, Portland,      Salt Lake City and San Jose.

         •  The same is true of Los Angeles. Despite spending more than $15 billion (2016$) building and      opening an extensive urban rail and busway system, not only has working at home recently      passed transit, but ridership on the largest transit system has fallen from before opening the      first line.

    On the other hand, rail ridership is more than double the work at home share in other metropolitan areas that have opened new rail systems since the 1970s. In San Francisco and Washington, the transit share is more than double the work at home share. In Seattle it is more than 50 percent higher, and it is also higher in Baltimore.

    Where Working at Home is the Most

    As might be expected, high-tech hubs lead in working at home. Austin has the largest work at home share, at 8.7 percent. Austin is followed by other tech-heavy metropolitan areas Denver (8.1 percent) and Raleigh (7.8 percent). Tampa-St. Petersburg, San Diego, Portland, Sacramento and Atlanta have shares of 7.0 percent or more. Charlotte and San Francisco-Oakland round out the top 10 (Figure 2).

    The distribution of transit and work at home shares is much different. Among the 53 major metropolitan areas, the largest transit market share is in New York, at 31.2 percent, while the smallest is in Oklahoma City, at 0.4 percent, a spread of more than 80 times (8,000 percent). The median metropolitan area has a transit work trip market share of 2.6 percent.

    Leader Austin’s work at home market share is less than the transit shares in the six metropolitan areas with transit legacy cities (the core municipalities [not the metropolitan areas] of New York, Chicago, Philadelphia, San Francisco, Boston, Washington) as well as Seattle, in all of which more than nine percent of workers use transit. Nearly 60 percent of the transit work trips are to destinations in the core municipalities of these metropolitan areas, most of that in the downtown areas (central business districts). Thus, 60 percent of commuting is to areas having less than 7 percent of the nation’s employment and less than one percent of nation’s urban land area.

    Working at home is much more evenly spread around the nation. The market share range is from 8.7 percent in Austin to 2.9 percent in Buffalo. The middle value is 5.2 percent, double that of transit. Thirty of the 53 major metropolitan areas have smaller transit work trip market shares than last ranking Buffalo’s work at home market share (Table).

    Work Access Mode: Major Metropolitan Areas: 2016
      Drive Alone Car Pool Transit Bicycle Walk Other Work at Home
    Atlanta, GA 77.6% 9.2% 3.1% 0.3% 1.3% 1.5% 7.0%
    Austin, TX 76.0% 9.4% 2.2% 0.8% 1.7% 1.1% 8.7%
    Baltimore, MD 76.6% 8.3% 6.1% 0.3% 2.6% 1.1% 4.9%
    Birmingham, AL 85.6% 8.9% 0.5% 0.1% 1.1% 0.9% 2.9%
    Boston, MA-NH 66.6% 7.5% 13.1% 1.0% 5.2% 1.4% 5.2%
    Buffalo, NY 82.8% 7.4% 3.5% 0.4% 2.4% 0.6% 2.9%
    Charlotte, NC-SC 80.9% 9.2% 1.4% 0.0% 1.3% 1.0% 6.3%
    Chicago, IL-IN-WI 70.3% 7.6% 12.0% 0.7% 3.1% 1.2% 5.1%
    Cincinnati, OH-KY-IN 81.7% 7.8% 1.9% 0.2% 2.1% 0.7% 5.5%
    Cleveland, OH 81.3% 7.6% 3.1% 0.3% 2.3% 0.9% 4.5%
    Columbus, OH 82.5% 7.5% 1.6% 0.3% 2.2% 1.2% 4.7%
    Dallas-Fort Worth, TX 80.8% 9.7% 1.4% 0.1% 1.2% 1.1% 5.7%
    Denver, CO 75.2% 8.5% 4.0% 0.7% 2.3% 1.2% 8.1%
    Detroit,  MI 84.3% 8.2% 1.5% 0.3% 1.3% 0.8% 3.6%
    Grand Rapids, MI 81.5% 8.5% 1.8% 0.7% 2.4% 0.6% 4.4%
    Hartford, CT 80.4% 8.1% 3.1% 0.2% 2.5% 1.0% 4.8%
    Houston, TX 80.8% 10.2% 1.9% 0.2% 1.4% 1.3% 4.1%
    Indianapolis. IN 84.5% 7.4% 0.7% 0.3% 1.6% 0.8% 4.6%
    Jacksonville, FL 81.0% 7.7% 1.7% 0.6% 2.0% 1.4% 5.7%
    Kansas City, MO-KS 83.8% 7.9% 0.9% 0.2% 1.3% 0.8% 5.2%
    Las Vegas, NV 79.4% 9.9% 3.7% 0.3% 1.2% 1.5% 4.0%
    Los Angeles, CA 75.0% 9.6% 5.1% 0.8% 2.5% 1.4% 5.5%
    Louisville, KY-IN 82.5% 8.4% 1.8% 0.2% 1.5% 1.2% 4.4%
    Memphis, TN-MS-AR 83.2% 9.8% 1.1% 0.1% 1.1% 1.0% 3.6%
    Miami, FL 77.7% 9.3% 3.8% 0.5% 1.7% 1.4% 5.5%
    Milwaukee,WI 80.4% 8.2% 3.6% 0.5% 2.7% 0.7% 3.9%
    Minneapolis-St. Paul, MN-WI 77.7% 8.1% 4.7% 0.8% 2.1% 0.8% 5.7%
    Nashville, TN 81.8% 8.7% 0.9% 0.1% 1.3% 1.1% 6.1%
    New Orleans. LA 77.2% 11.0% 2.6% 1.1% 2.2% 1.4% 4.4%
    New York, NY-NJ-PA 49.5% 6.6% 31.4% 0.7% 5.8% 1.4% 4.5%
    Oklahoma City, OK 83.2% 9.2% 0.4% 0.4% 1.5% 1.1% 4.1%
    Orlando, FL 80.5% 9.1% 1.9% 0.4% 1.1% 1.3% 5.8%
    Philadelphia, PA-NJ-DE-MD 72.6% 7.9% 9.3% 0.6% 3.6% 1.0% 5.1%
    Phoenix, AZ 76.2% 11.2% 1.8% 0.7% 1.5% 1.7% 6.8%
    Pittsburgh, PA 76.7% 8.2% 6.0% 0.4% 3.2% 0.8% 4.8%
    Portland, OR-WA 70.9% 9.1% 6.4% 2.3% 3.2% 1.0% 7.1%
    Providence, RI-MA 80.9% 8.3% 2.5% 0.2% 3.4% 0.7% 3.9%
    Raleigh, NC 80.6% 8.1% 1.2% 0.3% 1.0% 0.9% 7.8%
    Richmond, VA 82.4% 8.1% 1.4% 0.5% 1.9% 1.0% 4.7%
    Riverside-San Bernardino, CA 78.4% 11.8% 1.3% 0.3% 1.5% 1.2% 5.5%
    Rochester, NY 80.8% 7.8% 2.6% 0.4% 3.5% 0.7% 4.2%
    Sacramento, CA 76.9% 9.5% 2.1% 1.6% 1.8% 1.1% 7.0%
    St. Louis,, MO-IL 82.6% 7.1% 2.6% 0.3% 1.6% 0.8% 5.0%
    Salt Lake City, UT 74.8% 10.7% 4.6% 0.7% 2.5% 1.0% 5.8%
    San Antonio, TX 79.0% 10.6% 2.3% 0.2% 1.9% 1.3% 4.8%
    San Diego, CA 75.7% 8.9% 2.9% 0.7% 3.2% 1.5% 7.1%
    San Francisco-Oakland, CA 58.1% 9.6% 17.2% 2.1% 4.5% 2.0% 6.7%
    San Jose, CA 74.5% 10.6% 4.3% 1.6% 2.3% 1.3% 5.3%
    Seattle, WA 68.3% 9.7% 9.5% 1.1% 4.1% 1.1% 6.1%
    Tampa-St. Petersburg, FL 78.9% 8.5% 1.4% 0.8% 1.5% 1.6% 7.4%
    Tucson, AZ 76.4% 10.5% 2.6% 1.6% 1.9% 1.5% 5.4%
    Virginia Beach-Norfolk, VA-NC 79.7% 9.3% 1.8% 0.4% 3.8% 1.6% 3.5%
    Washington, DC-VA-MD-WV 65.9% 9.3% 13.4% 0.9% 3.4% 1.4% 5.7%
    Major MSAs 73.4% 8.7% 7.9% 0.6% 2.7% 1.2% 5.4%
    United States 76.3% 9.0% 5.1% 0.6% 2.7% 1.2% 5.0%
    Outside Major MSAs 80.4% 9.4% 1.2% 0.5% 2.7% 1.2% 4.6%
    Source: American Community Survey, 2016


    The Future

    There is considerable potential for expanding the work at home share of work access, as is indicated by Global Workplace Analytics and Flexjobs in their report (The State of Telecommuting in the U.S. Employee Workforce). The advantages are great. Working at home is by far the most environmentally friendly mode of work access and requires virtually no public subsidies.

    Note: Calculated using two-digit data.

    Wendell Cox is principal of Demographia, an international public policy and demographics firm. He is a Senior Fellow of the Center for Opportunity Urbanism (US), Senior Fellow for Housing Affordability and Municipal Policy for the Frontier Centre for Public Policy (Canada), and a member of the Board of Advisors of the Center for Demographics and Policy at Chapman University (California). He is co-author of the “Demographia International Housing Affordability Survey” and author of “Demographia World Urban Areas” and “War on the Dream: How Anti-Sprawl Policy Threatens the Quality of Life.” He was appointed to three terms on the Los Angeles County Transportation Commission, where he served with the leading city and county leadership as the only non-elected member. He served as a visiting professor at the Conservatoire National des Arts et Metiers, a national university in Paris.

    Photograph: Texas State Capital, Austin (largest work at come work access mode).
    https://commons.wikimedia.org/wiki/File:Texas_State_Capitol_Night.jpg

  • Commuting Data for 2016

    Last week, the Census Bureau posted 2016 data from the American Community Survey, including population, income, housing, employment, and commuting data among many other categories. The survey is based on data from more than 3.5 million households. Today, the Antiplanner will look at commuting data: how people got to work in 2016 compared with previous years.

    To save you time, I’ve downloaded and posted 2016’s table B08301, “Means of Transportation to Work,” for the nation, states, counties, cities, and urbanized areas. I’ve also posted similar tables for 2006, 2010, and 2015.

    In columns Z through AE, I’ve calculated the shares of commuters (excluding people who work at home) who traveled to work by driving alone, carpooling, transit, rail transit, bicycling, and walking. (These won’t quite add up to 100 percent as are other categories such as taxi and motorcycle.) Only some cities, counties, and urban areas are included because others were too small for the sample size to be valid. Since the places that are included may vary from year to year, the rows of the various spreadsheets do not line up below the state level.

    The data show that, nationwide, transit’s share of travel grew from 5.03 percent in 2006 to 5.49 percent in 2015. This growth was at the expense of carpooling, as driving alone’s share also grew. In 2016, however, transit’s share fell to 5.36 percent while both driving alone and carpooling grew.

    Among major urban areas, transit’s share of commuting grew from 2015 to 2016 in Pittsburgh, Salt Lake City, Seattle, and–amazingly–San Jose. But it declined in far more regions: Austin, Boston, Charlotte, Dallas-Ft. Worth, Honolulu, Houston, Los Angeles, Orlando, Philadelphia, Phoenix, Portland, Sacramento, San Francisco-Oakland, and Washington DC. It was flat (changed by 0.05 percent or less) in Atlanta, Chicago, Denver, Miami, Minneapolis-St. Paul, and New York.

    Outside of Seattle, these numbers are not encouraging for those who think rail transit is good for transit riders. Although transit’s share also grew in the Salt Lake urban area, it declined in Ogden and Provo-Orem, which are connected with Salt Lake City by an expensive commuter train that is doing little to boost transit ridership. The growth in San Jose was in spite of the region’s rail transit system: although the bus share grew, rail’s share of commuting declined.

    Transit’s share grew in both Raleigh and Durham. If those cities want to keep transit healthy, they shouldn’t disrupt whatever is working now by building an expensive light-rail line. I’ll be presenting more 2016 data in future posts.

    This piece first appeared on The Antiplanner.

    Randal O’Toole is a senior fellow with the Cato Institute specializing in land use and transportation policy. He has written several books demonstrating the futility of government planning. Prior to working for Cato, he taught environmental economics at Yale, UC Berkeley, and Utah State University.

    Photo: [Public domain], via Wikimedia Commons

  • Spotlight on Infrastructure After Harvey

    The recent tragic events in Houston and across the Gulf Coast once again demonstrated the woeful inadequacy of our infrastructure. Hopefully, some good will come of Hurricane Harvey. Hopefully, it will jump-start the long-awaited Trump initiative on infrastructure, which may be the one issue that could unite this country.

    Northeastern University’s post-disaster resiliency expert Daniel Aldrich notes the need for better storm water drainage systems and for fortifying existing infrastructure — and not just in Houston. Helping promote such investments represents perhaps the last best chance for creating a significant Trump legacy.

    Once a leader in world infrastructure, the United States now ranks 11th in the overall quality of its infrastructure, according to the latest World Economic Forum Global Competitiveness Index. This decline has consequences. In California, for example, the lack of investment in water storage both worsened the recent drought and reduced the state’s ability to take advantage of heavy rains when they arrived.

    A concerted effort to restore our nation’s bridges, roads, harbors and other critical infrastructure would also mark a significant break from the Obama era stimulus which focused more on propping up renewable energy and often underused mass transit systems. Meanwhile, our overall infrastructure continued to deteriorate during the Great Recession, even with the stimulus, with spending in decline from over $300 billion in 2008 to under $250 billion in 2013.

    Spending Smartly

    “Efficiency is doing things right,” legendary management guru Peter F. Drucker once proclaimed. “Effectiveness is doing the right things.” In the context of infrastructure, being effective means placing our bets on things that are really needed, and could reward our society with greater productivity, wealth and new employment.

    At Newgeography.com, where I serve as executive editor, we recently carried a report from the Houston-based Center for Opportunity Urbanism,Doing the Right Things Right,” which lays out what an infrastructure strategy would look like given current budget constraints. The United States faces a national debt of $20 trillion, while the federal government deficit was projected to reach $693 billion for fiscal year 2017.

    A strong U.S. transportation infrastructure system facilitates economic growth, job creation, a better standard of living and less poverty by minimizing travel times and improving labor market efficiency. Yet, as “Doing the Right Things Right” makes clear, not all investments are the same, or should receive federal subsidies, whether for direct expenditures or to issue infrastructure bonds to support private investment. There have been too many examples of spending on lower priority infrastructure because politicians were more interested in securing pork, or votes, than accelerating economic growth or reducing constituents’ travel times.

    To be sure, America’s infrastructure has performed well enough to provide the highest standard of living for the largest number of people in the world. The legacy of earlier infrastructure decisions, such as the completion of the interstate highway system, is still evident. Overall, the amount of time America’s commuters spend in peak period traffic congestion is generally better than that of international competitors.

    Yet traffic problems are increasing in the nation’s largest metropolitan areas. A recent study found that traffic congestion imposed $132 billion in excess fuel and time costs for automobile drivers and $28 billion in freight costs annually — all ultimately absorbed by consumers.

    The key question is how we meet these challenges. One proposed solution is to increase spending on traditional mass transit. This works well largely in “legacy cities” such as Washington, Chicago, Boston, Philadelphia, San Francisco and New York. The city of New York alone represents a remarkable 36 percent of all U.S. transit commuting, yet has only 3 percent of the jobs. Outside of these cities, the new transit projects, principally rail lines, have done little or nothing, as a recent report on transit from Chapman University demonstrates, to slow congestion or attract significant ridership.

    Among 19 metropolitan areas that added high-capacity transit systems since 1980, both bus and rail, transit’s market share has fallen from 4.7 to 4.6 percent compared to the last data before the systems opened. Transit has not, on balance, reduced solo driving, which increased from an average of 73.0 percent to 76.6 percent.

    The cities with rail systems opening after the 1990 Census experienced a modest decline in transit work trip market share, from 3.8 percent in 1990 to 3.7 percent in 2013.

    Take the absurd example of Los Angeles, which has spent over $15 billion trying to become what some mass transit enthusiasts call the “next great transit city.” Yet, Los Angeles County Metropolitan Transportation Authority system ridership stands at least 15 percent below 1985 levels, when there was only bus service, at a time when the population of Los Angeles County was 20 percent lower. Since 1990, transit’s work trip market share in the Los Angeles metropolitan area has dropped from 5.6 percent to 5.1 percent. No surprise, then, that according to a recent USC study, the new lines have done little or nothing to lessen congestion.

    Doing Your Homework

    The irony is that billions are being spent on these ineffective systems, when the places that depend on transit, like New York and Washington, are seeing their systems become less reliable and even dangerous. We are dumping money in some locations that don’t work all that well, but can’t find funds to fix systems that remain essential to “legacy cities” with large downtowns ideal for transit ridership.

    With the expense and ineffectiveness of new rail systems, it seems that the time has arrived for transit services that focus on less expensive bus systems, including those run by private companies, which can carry so many more riders for so much less in taxpayer subsidies. There are also opportunities to make lightly used but highly subsidized services more cost-effective by adding ride-hailing systems, like Uber and Lyft, cited as a factor in recent ridership declines in Los Angeles and even New York. In suburban San Francisco, a local transit operator has established a pilot program to extend service through ride-hailing and cancelled a lightly patronized bus route, reducing costs while providing quicker door-to-door service.

    One of the most promising alternatives, virtually ignored by transit advocates, is to encourage options for working at home. In many metropolitan areas, more people already telecommute than take transit. Since 1980, the number of people working at home has grown three times that of transit riders. All this, at virtually no cost to taxpayers.

    In the future, rapidly evolving autonomous technologies could make our present transit systems archaic in most cities. Under any circumstance, these advances seem likely to further weaken conventional transit. Given these trends, why base our transit policy on 19th century technologies when we are about to enter the third decade of the 21st?

    Back to the Gulf: Resiliency, not Hysteria

    “Smart growth” advocates have been quick to argue that Hurricane Harvey’s unprecedented damage can be traced to Houston’s freewheeling, free-market approach to real estate development. Sure, the area got 50 inches of rain, but it fell both on communities that eschew strict zoning and those which embrace it. They somehow forget that a lesser storm, Hurricane Sandy, devastated the highly planned communities of greater New York just a few years ago, causing $19 billion in damage in the city alone – and with far less rain.

    Rather than imitate Portland or San Francisco, Houston and other Gulf communities need to maintain policies that have allowed it to avoid the kind of insane price hikes one sees on the West Coast and some Northeastern housing markets. To force Houston to act like San Francisco would kill its economy. If Texas real estate prices approach California’s, people will simply move elsewhere, where prices are lower.

    Some changes may be necessary, including “coastal restoration” efforts that limit the impact of storms like Harvey. Major engineering challenges, like building more water storage facilities and improved drainage, need to be imposed, as well.

    What Houston needs, and would naturally adopt, is a kind of enlightened free market approach. After the devastation of Galveston in 1900 hurricane, Houston famously built a ship channel while Galveston built an elaborate sea wall; Houston is no less a creation of private innovation and government than New York or Los Angeles. Like America itself, Houston thrives by combining good public investment with a maximum of economic flexibility.

    The more these decisions are made locally, by people who are directly impacted, the better. My colleague Tory Gattis, based in Houston, suggests that new developments and older ones “should be required to have adequate rainwater retention, either with ponds, tanks, or permeable surfaces.” There are already examples of some of this kind of planning, particularly in exurban communities such as the Woodlands. This may mitigate the ill effects of such storms, but not likely to prevent disasters like Harvey from inflicting huge damage.

    These policies could mean, over time, that Houston and other Gulf communities might build an infrastructure more reminiscent of Frank Lloyd Wright’s Broadacre City, scattered communities with ample open land around them. But the vision must be a localized one, not drawn from example of generally slower-growing, older regions facing very different natural challenges. The benefits to customizing local infrastructure is go beyond economic reality and even disaster mitigation. With enough focus on local needs, we need not wait for natural disasters to witness the heartwarming sights of multi-cultural first responders – and ordinary citizens – all pulling together. “Social networks and cohesion are an important part of recovery and survival,” professor Aldrich suggests. “Houston should be investing in bringing neighborhoods together.”

    This is the real secret sauce for resiliency, as Houston has been showing throughout this crisis. The more that people who are impacted control the till, whether repairing levees, imposing regulations or planning transit systems, the better. Rather than let Leviathan rule and impose conformity, we should let regions — whether in Texas or elsewhere — figure out how to meet infrastructure challenges that effect every community differently.

    This piece originally appeared on Real Clear Politics.com.

    Joel Kotkin is executive editor of NewGeography.com. He is the Roger Hobbs Distinguished Fellow in Urban Studies at Chapman University and executive director of the Houston-based Center for Opportunity Urbanism. His newest book is The Human City: Urbanism for the rest of us. He is also author of The New Class ConflictThe City: A Global History, and The Next Hundred Million: America in 2050. He lives in Orange County, CA.

    Wendell Cox is principal of Demographia, an international public policy and demographics firm. He is a Senior Fellow of the Center for Opportunity Urbanism (US), Senior Fellow for Housing Affordability and Municipal Policy for the Frontier Centre for Public Policy (Canada), and a member of the Board of Advisors of the Center for Demographics and Policy at Chapman University (California). He is co-author of the “Demographia International Housing Affordability Survey” and author of “Demographia World Urban Areas” and “War on the Dream: How Anti-Sprawl Policy Threatens the Quality of Life.” He was appointed to three terms on the Los Angeles County Transportation Commission, where he served with the leading city and county leadership as the only non-elected member. He served as a visiting professor at the Conservatoire National des Arts et Metiers, a national university in Paris.

    Photo: Hurricane Harvey flooding by Jill Carlson, via Flickr, using CC License.

  • The Changing World of Aviation

    Perhaps nothing more illustrates the shifts in the global economy than the geography of the largest airports. In 2000, world air passenger statistics were dominated by high income world economies. Among the 25 busiest passenger airports, 14 were in the United States, five in Europe and five in Asia and one in Canada, according to data from the Airports Council International and the Port Authority of New York and New Jersey.

    Among the largest airports in 2000, all but Bangkok were in a high income economies. Things have changed significantly. Today, only eight of the largest airports are in the United States, six in Europe, and five in China and six in Asia outside China. Airports in middle income countries — largely not on the list in 2000 — come from Beijing, Shanghai, Guangzhou and Chengdu in China, Kuala Lumpur in Malaysia, and Turkey’s Istanbul (Figure 1).

    The Largest Airports

    Since 1998, Hartsfield-Jackson International Airport has been the busiest passenger airport in the world, after it replaced Chicago’s O’Hare International. In 2016, the airport handled nearly 104.2 million annual passengers. This is quite an accomplishment for an urban area that is only the 81st largest in the world. Since 2000, Atlanta’s passenger count has increased 30 percent.

    Yet, Atlanta has been challenged in recent years by Beijing Capital City International Airport, which was substantially remodeled and enlarged for the 2008 Olympics. Beijing handled 94.4 million passengers in 2016. In 2000, Beijing Capital City International was not among the world’s 25 largest airports but has experienced a 335 percent increase in passenger use. Capital City could pass Atlanta in the next few years, but will soon thereafter split air traffic with the Beijing-Daxing International Airport, due to open in 2019, probably making any number one ranking temporary. In the long run, local officials expect Beijing-Daxing to be the busiest in the world.

    The new airport will be located south of the city and far better situated for access from the entire Jin-Jing-Ji megacity complex, around which many of the current functions of Beijing are being dispersed. Jin-Jing-Ji includes Beijing, Tianjin and much of the northern part of Hebei province. Construction progress can be viewed at this location on Google Earth: 39°30′52″N 116°24′25″E (copy into the Search box or a “’Google” search will bring up the location on Google maps).

    Dubai International Airport, the world’s third largest airport, has seen its passenger traffic growth much faster than even Beijing Capital City International. Dubai saw nearly 600 percent growth from 2000 to 85.7 million passengers. In 2000, Dubai International was not among the world’s 25 largest airports.

    Los Angeles International is the world’s fourth busiest airport. LAX handled 80.9 million annual passengers, up 22 percent from 2000.

    Tokyo’s centrally located Haneda International Airport ranked fifth, with 79.7 million annual passengers. Haneda has grown strongly, up 42 percent since 2000, when it ranked 6th. During that time, Japan’s regulators have allowed a considerable increase in international flights. Haneda’s overall volume is approximately twice that of far more remote Narita International Airport, which handles most international flights.

    Chicago’s O’Hare International Airport was the world’s busiest as late as 1997, but has fallen to sixth most patronized. O’Hare handled 78.3 million passengers in 2016, with its strong United Airlines and American Airlines hubs. However, O’Hare’s growth has been modest, adding only 8 percent to its 2000 volume, when it ranked 2nd to Atlanta (see photo above).

    London’s Heathrow Airport ranked 7th in the world, with 75.7 million annual passengers. Growth was also somewhat muted, Heathrow’s volume grew 17 percent from 2000 to 2016.

    Hong Kong has experienced considerable growth after having closed its obsolete Kai Tak airport in the late 1990s. Hong Kong International has experienced a 115 percent increase in passengers since 2000 and handled 70.6 million passengers in 2016. In 2000, Hong Kong was the 22nd busiest airport in the world, compared to its 8th ranking in 2016.

    Shanghai’s Pudong International Airport experienced the largest handled 66.0 million passengers in 2016 and was not among the top 25 in 2000. The world’s 9th ranked airport opened in 1999 and is served by the world’s fastest train, a Mag-Lev (magnetic levitation) that carries passengers 19 miles (30.4 kilometers) to the Longyang Road station at a top speed of 268 miles per hour (431 kilometers per hour) during weekday peak periods. By comparison, the fastest high speed rail trains in the world will operate at up to 218 miles per hour (350 kilometers per hour) between Shanghai Hongqiao Station and Beijing starting this month. From Longyang Road station travelers can transfer to taxis or Metro Line 2 to complete the final 7 miles (12 kilometers) to People’s Park in the central business district, or to other locations in the area.

    Charles de Gualle International Airport in Paris ranks 10th, handling slightly fewer passengers than Pudong International (65.95 million). CDG’s volume is up 37 percent since 2000, when it ranked 8th in the world.

    The 11th through 16th positions include Dallas-Fort Worth, Amsterdam, Frankfurt, Istanbul and Guangzhou. Istanbul has seen its passenger volume increase more than 300 percent since 2000, while Guangzhou has exceeded 360 percent.

    The next five (16th through 20th) include New York’s JFK, Singapore, Denver, Seoul’s new Incheon Airport, and Bangkok, also a relatively new facility. Singapore has had the greatest growth, at 105 percent.

    The final five of the top 25 include San Francisco, Kuala Lumpur, Madrid, Las Vegas and Chengdu. Kuala Lumpur’s growth was more than 250 percent, while Chengdu posted the largest gain, at more than 730 percent (Figure 2).

    A number of US airports that were among the top 25 in 2000 dropped out over the next 16 years. These include Seattle, Miami, Phoenix, New York La Guardia, Orlando, Houston, Newark, Minneapolis-St. Paul, Boston, Detroit and St. Louis. All of them experienced passenger increases, with the exception of St. Louis, where traffic was down more than 50 percent, with the demise of the American Airlines (former TWA) hub. Toronto’s Pearson International also dropped out of the top 25.

    More and More Flying

    The world is flying more and more, According to World Bank data, the volume of air passengers increased 120 percent between 2000 and 2016, with a nearly 7 percent increase between 2015 and 2016. As airline use increases, significant airport construction is underway. Istanbul is building an airport intended to have the highest passenger capacity in the world (41°15′39.97″N 28°44′32.54″E), claims mirrored by Beijing-Daxing and expanding Dubai World Central-Al Maktoum International (24°55′06″N 55°10′32″E). Mexico City will replace aging Benito Juarez International (19.5°N 98.9975°W construction not yet evident), while two cities in China are also building new airports. Dalian is constructing an off-shore facility (39°06′32″N 121°36′56″E) while Qingdao (36°21′43″N 120°5′18″E)is building one in the exurbs, which will be reached from the central business districts with a trip over the Jiaozhou Bay Bridge, the world’s longest over-water bridge (25 miles or 41 kilometers). Berlin’s notoriously behind schedule Brandenburg (Willy Brandt Airport) continues to struggle toward completion (52°22′00″N 013°30′12″E). Meanwhile, with the exploding volume of passengers in Chengdu, construction is starting on a new airport more than 30 miles (50 kilometers) away (30.319°N 104.445°E).

    The rise in air traffic suggests rising affluence, particularly in developing countries, as progress continues to be made in reducing poverty. It seems likely that by 2030, the list of the largest airports will include fewer from today’s most affluent economies and many more from emerging economies.

    Wendell Cox is principal of Demographia, an international public policy and demographics firm. He is a Senior Fellow of the Center for Opportunity Urbanism (US), Senior Fellow for Housing Affordability and Municipal Policy for the Frontier Centre for Public Policy (Canada), and a member of the Board of Advisors of the Center for Demographics and Policy at Chapman University (California). He is co-author of the “Demographia International Housing Affordability Survey” and author of “Demographia World Urban Areas” and “War on the Dream: How Anti-Sprawl Policy Threatens the Quality of Life.” He was appointed to three terms on the Los Angeles County Transportation Commission, where he served with the leading city and county leadership as the only non-elected member. He served as a visiting professor at the Conservatoire National des Arts et Metiers, a national university in Paris.

    Photograph: O’Hare International Airport, by Author

  • The Great Transit Rip-Off

    Over the past decade, there has been a growing fixation among planners and developers alike for a return to the last century’s monocentric cities served by large-scale train systems. And, to be sure, in a handful of older urban regions, mass transit continues to play an important — and even vital — role in getting commuters to downtown jobs. Overall, a remarkable 40 percent of all transit commuting in the United States takes place in the New York metropolitan area — and just six municipalities make up 55 percent of all transit commuting destinations.

    But here’s an overlooked fact: Transit now serves about the same number of riders as it did in 1907, when the urban population was barely 15 percent of what it is today. Most urban regions, such as Southern California, are nothing like New York — and they never will be. Downtown Los Angeles may be a better place in which to hang out and eat than in the past, but it sorely lacks the magnetic appeal of a place like Manhattan, or even downtown San Francisco. Manhattan, the world’s second-largest employment center, represents a little more than 20 percent of the New York metropolitan area’s employment. In Los Angeles, by contrast, the downtown area employs just 2 percent.

    Transit is failing in Southern California

    As we demonstrate in a new report for Chapman University, our urban form does not work well for conventional mass transit. Too many people go to too many locales to work, and, as housing prices have surged, many have moved farther way, which makes trains less practical, given the lack of a dominant job center. But in its desire to emulate places like New York, Los Angeles has spent some $15 billion trying to evolve into what some East Coast enthusiasts call the “next great transit city.”

    The rail lines have earned Mayor Eric Garcetti almost endless plaudits from places like the New York Times. Yet, since 1990, transit’s work trip market share has dropped from 5.6 percent to 5.1 percent. MTA system ridership stands at least 15 percent below 1985 levels, when there was only bus service, and the population of Los Angeles County was about 20 percent lower. In some places, like Orange County, the fall has been even more precipitous, down 30 percent since 2008. It is no surprise, then, that, according to a recent USC study, the new lines have done little or nothing to lessen congestion.

    This experience is not limited to L.A. Most of the 19 metropolitan areas with new mass transit rail systems — including big cities like Atlanta, Houston, Dallas and even Portland, Ore. — have experienced a decline in transit market share since the systems began operations.

    Read the entire piece at The Orange County Register.

    Joel Kotkin is executive editor of NewGeography.com. He is the Roger Hobbs Distinguished Fellow in Urban Studies at Chapman University and executive director of the Houston-based Center for Opportunity Urbanism. His newest book is The Human City: Urbanism for the rest of us. He is also author of The New Class ConflictThe City: A Global History, and The Next Hundred Million: America in 2050. He lives in Orange County, CA.

    Wendell Cox is principal of Demographia, an international public policy and demographics firm. He is a Senior Fellow of the Center for Opportunity Urbanism (US), Senior Fellow for Housing Affordability and Municipal Policy for the Frontier Centre for Public Policy (Canada), and a member of the Board of Advisors of the Center for Demographics and Policy at Chapman University (California). He is co-author of the “Demographia International Housing Affordability Survey” and author of “Demographia World Urban Areas” and “War on the Dream: How Anti-Sprawl Policy Threatens the Quality of Life.” He was appointed to three terms on the Los Angeles County Transportation Commission, where he served with the leading city and county leadership as the only non-elected member. He served as a visiting professor at the Conservatoire National des Arts et Metiers, a national university in Paris.

    Photo: Esirgen (Own work) [CC BY-SA 3.0], via Wikimedia Commons

  • A Roadmap to Job-Creating Transportation Infrastructure: Doing the Right Things Right

    There is broad public concern about the status of transportation infrastructure in the United States. On election night the future President said, “We are going to fix our inner cities and rebuild our highways, bridges, tunnels, airports, schools, hospitals.” This report (“A Roadmap to Job-Creating Transportation Infrastructure: Doing the Right Things Right”) examines the condition of the nation’s infrastructure and makes recommendations to improve federal efforts in supporting ground transport.

    Infrastructure is important to the accomplishment of such important public goals as increased economic growth, long-term job creation (beyond project employment benefits), a better standard of living, and the reduction of poverty. The United States used to lead the world in infrastructure, but has fallen behind some of its competitors. At the same time, past infrastructure policy in the United States created an inertia that prevented serious prioritization of federal resources.

    All of this is made more arduous by the nation’s strained finances. The national debt is now approximately $20 trillion while budget deficits continue and could increase without significant reforms. This means it will be difficult to commit additional resources to the nation’s highways and rail systems.

    Administration Proposals

    The Administration has proposed approaches that go beyond “business as usual”. They would focus federal resources on national and regional priorities, improving both the effectiveness and efficiency of federal programs.

    Perhaps the most significant federal program is the Highway Trust Fund, which uses highway user fees to support highway and transit. In recent years, general funds have also been added to the program because revenues have risen more slowly than needs, in part because of improved fuel economy and low gas prices. The Administration proposes no highway user fee increases and proposes to phase out general fund support.

    In addition, the Administration proposes to phase out funding for “new starts,” which are usually expensive urban rail transit programs, because these programs are not of sufficient national significance.

    The Administration has proposed increasing funding through programs that attract private infrastructure development and has proposed $200 billion over the next 10 years in infrastructure expenditures, including transportation.

    Because there are sufficient travel alternatives, the Administration proposes ending support for Amtrak’s long-distance trains.

    The Administration has referred to the necessity of regulatory reform and streamlining permitting requirements, both to reduce costs and speed up project delivery.

    Analysis and Recommendations

    It is expected that the Administration will propose further initiatives, consistent with the directions it has outlined. The proposals are analyzed below and additional recommendations are offered.

    Highways and Transit: The Highway Trust Fund provides most of the federal contribution to highways and transit from user fees from drivers and commercial vehicle operators, such as the trucking industry. As expenditures have risen faster than revenues, the Highway Trust Fund has received general fund support as well.

    The highway system is the country’s most comprehensive transportation system. Autos (including light trucks) using the highway and roadway system account for the overwhelming majority of ground passenger travel, both for commuting and other trips. These roads allow people to commute to jobs throughout metropolitan areas more quickly than any other mode. The employment opportunities available by auto dwarf those by any other mode. Perhaps surprisingly, autos provide by far the largest share of commuting by low income populations. Highways provide the infrastructure for much of the freight transport and service vehicles. In the long run, improving access to employment and reducing traffic congestion will be best accomplished by improvements that involve highways.

    By contrast, transit, which has received funding from the Highway Trust Fund for more than three decades, is intensely concentrated in just a few local areas. Only two percent of motorized trips are on transit. Even in the largest metropolitan areas, transit provides far less access to jobs than autos, while new transit rail projects and additional transit funding has failed to reduce traffic congestion.

    By virtually any measure, transit is less effective and efficient than highways for passenger travel. Transit moves no freight or other commercial traffic and does not provide emergency service access. Highway Trust Fund revenues should be used only on highways.

    Private Finance: The programs the Administration has proposed for attracting private infrastructure capital include the Transportation Infrastructure Finance and Innovation Act (TIFIA) program and US Department of Transportation authorized private activity bonds. As currently designed and operated, these programs do sufficiently prioritize transportation infrastructure. Process reforms are needed to ensure the limited funding available is used for the highest priority projects. Evaluation criteria should be adopted, with traffic congestion relief, critical bridge replacement and highway system maintenance being the highest priorities. Express toll lanes, added to existing roadways, are among the most promising approaches because of their additional capacity and ability to reduce traffic congestion.

    Further, the tax exempt financing and interest subsidies of these programs have a federal budgetary impact that increases deficits and the national debt. The Administration should seek to minimize these impacts by ensuring that only the most productive projects are approved.

    Another federal credit instrument, the Railroad Rehabilitation and Investment Financing program, could impose substantial losses on taxpayers. Despite its success to date, there are now indications that privately sponsored high-speed rail projects will seek large taxpayer guaranteed loans from RRIF. Private, at risk investment has not proven profitable in high-speed rail, which suggests a potential for default, such as what occurred with Solyndra. Program reforms are needed.

    Amtrak and High-Speed Rail: It will be important to eliminate unnecessary subsidies. For example, as an Administration document puts it: “communities are served by an expansive aviation, interstate highway and interstate bus network.” In this environment, Amtrak subsidies are unnecessary. Subsidies to high-speed rail are similarly unnecessary.

    Regulatory Reform and Streamlined Permitting: The Administration has also proposed regulatory reform and streamlined permitting. Among the most important opportunities are repeal of the Davis – Bacon labor requirements, prohibition of project labor agreements, and setting up a single point of contact in the federal government for project sponsors.

    Conclusion: Improving Efficiency and Effectiveness

    It will be important to better focus private funding programs on the highest infrastructure priorities, and to minimize serious risks to taxpayers and bond buyers that could emerge from insufficiently vetted projects. The recommendations suggest doing the right things by limiting federal support to genuine needs for programs for which there is no alternative, and doing them right by spending no more than necessary. The sooner the hard choices are made, the better for future generations.

    The above is the Executive Summary to ““A Roadmap to Job-Creating Transportation Infrastructure: Doing the Right Things Right,” published by the Center for Opportunity Urbanism (author, Wendell Cox, Senior Fellow).

    Wendell Cox is principal of Demographia, an international public policy and demographics firm. He is a Senior Fellow of the Center for Opportunity Urbanism (US), Senior Fellow for Housing Affordability and Municipal Policy for the Frontier Centre for Public Policy (Canada), and a member of the Board of Advisors of the Center for Demographics and Policy at Chapman University (California). He is co-author of the “Demographia International Housing Affordability Survey” and author of “Demographia World Urban Areas” and “War on the Dream: How Anti-Sprawl Policy Threatens the Quality of Life.” He was appointed to three terms on the Los Angeles County Transportation Commission, where he served with the leading city and county leadership as the only non-elected member. He served as a visiting professor at the Conservatoire National des Arts et Metiers, a national university in Paris.

    Photograph: Intercounty Connector, Montgomery County Maryland (a TIFIA project). Photograph by Ewillison (Own work) [CC BY-SA 4.0 (http://creativecommons.org/licenses/by-sa/4.0)], via Wikimedia Commons.

  • Why Rail Transit Doesn’t Work in Atlanta

    One of the more interesting presentations at the 2017 American Dream conference was by Alain Bertaud, a French demographer currently working at New York University. He has compared urban areas all over the world to see how transportation has influenced the layout of those areas.

    He started by comparing Atlanta with Barcelona, Spain. Although both have about the same number of people, Barcelona occupies about 63 square miles while Atlanta covers 1,650 square miles. Barcelona has about 62 miles of rail lines, while Atlanta had about 46 when Bertaud was making his comparison (it’s up to 52 today). In order for Atlanta’s rail system to provide the same level of service to its residents as Barcelona’s, the region would need to build another 2,350 miles of rail lines. At current construction prices, that would cost at least $700 billion.

    The above charts show population densities within 30 kilometers of urban centers, with the first kilometer on the left and the 30th kilometer on the right. The European cities, including Paris, Warsaw, and Barcelona, shown in the first column, are very dense in the center with densities falling to nothing after 22 miles from the center. Asian cities in the second column–Beijing, Jakarta, and Bangkok–are similar. But American cities in the third column–Atlanta, Los Angeles, and New York–look very different. Densities do taper off but the centers, even of New York, are nowhere near as dense as in Europe and Asia.

    Moreover, Atlanta’s population growth in the 1990s was mostly in the outlying areas. Only 2 percent of new Atlanta residents located within a half mile of a rail station and only 13 percent located within a half mile of a bus stop, while 85 percent located more than half mile from either.

    New job locations are even worse for transit, with jobs in four of the first five miles from the center actually declining. Only 1 percent of new jobs located within a half mile of a rail station, and 22 percent within a half mile of a bus stop, meaning 77 percent were not reached by transit. (The original chart said 32 percent, but that made the total add up to 110 percent. Dr. Bertaud updated and corrected the chart to read 22 percent.)

    Even as American urban planners, particularly on the West Coast, try to make our cities more like European ones, European and Asian cities are becoming more like American ones. In Seoul, for example, most population growth was in the bands between 20 and 40 kilometers from the center, while most job growth was in the bands between 9 and 35 kilometers from the center.

    The same is true for European cities. While the second chart shown above makes it appear that Paris and other cities are monocentric, in fact they have large numbers of suburban jobs. As Bertaud noted, “Even in metropolitan area like Paris, with an elaborate transit system, the majority of trips are made by cars from suburb to suburb.” Transit ridership in many European cities is flat or declining, while driving is rapidly growing.

    When new technologies like automobiles change the shape of cities, there is no going back. Cities can build rail lines, subsidize dense housing projects, and try to discourage driving, but driving will continue to grow even as transit ridership stagnates, at best, and per capita ridership falls.

    This piece first appeared on The Antiplanner.

    Randal O’Toole is a senior fellow with the Cato Institute specializing in land use and transportation policy. He has written several books demonstrating the futility of government planning. Prior to working for Cato, he taught environmental economics at Yale, UC Berkeley, and Utah State University.

    Photo by Nicolas Henderson, via Flickr, using CC License.