Tag: Transportation

  • Traffic: Rome’s Not-So-Smart Car Squeeze

    Who would have thought that city planners in Oklahoma City would be more bike and pedestrian friendly, and better at taming car traffic, than those in Rome? In Oklahoma City, Mayor Mick Cornett has reordered the city’s transportation priorities away from cars, and toward exercise and fitness. Speaking of OKC’s car-centric era, the mayor said “We had built an incredible quality of life, if you happen to be a car. But if you have to be a person, you are combatting the car seemingly at every turn.” By contrast, Rome remains wedded to the automobile, to the point that it’s turning into the Eternal Parking Lot.

    Cornett has added sidewalks and bike lanes, and even put in some kayak parks downtown, leading OKC residents through a collective weight loss campaign that he estimates to have totaled one million pounds. Rome, meanwhile, must rank with Moscow, Dubai, and Lagos as one of the most automobile-dominated cities in the world.

    What madness possessed me to take a bicycle into Rome? I had biked from Florence to Siena, across the heart of Tuscan wine country, and was simply continuing on two wheels. The reason I know: I went there on a bike.

    Outside the classical city I could skirt cobblestones and ride in bus lanes (Rome has a few bike paths, but they begin and end nowhere, a bit like the country’s politics).

    Once inside the famed city gates, slick cobblestones made biking feel like a ride on a roller-coaster off the rails. As I headed into central Rome I knew the cobblestones and the taxi drivers might make it a rough journey, but I had forgotten the extent to which Rome is the world capital of lane-changing, that frantic need to get around every slow or parked car.

    Knowing Rome fairly well I switched to back alleys and one-way streets, where I discovered that not only does the city’s traffic have aspects of colliding atoms, but that the emergence of economical Smart Cars and small electric vehicles has made it possible for many more Romans to squeeze their motorized vehicles into the city’s historic corners.

    No matter which historic piazza I crossed or which road I took I came face-to-face with one of the motorized creatures — some the size of golf carts — that Romans drive literally everywhere.

    If Caesar’s assassins were now to stalk him near the Forum, I am sure they would do so in tiny Fiats and, while stabbing him, park on the sidewalk with their emergency lights flashing.

    Everywhere I went in Rome, cars were littered. There were cars all around the Vatican, in the small squares of Trastevere, around the Colosseum, and up against the Forum.

    Not only is Rome the empire of errant cars, its sidewalks — perhaps laid out to confuse invading Huns — have to be the worst in Europe. Walking two abreast is impossible. Instead, between the cars careening around medieval piazzas or parked against doorways, pedestrians must walk single-file, like a retreating army.

    The solution to Rome’s clogged arteries is to ban (during the waking hours) cars, trucks, motor scooters, tour buses, four-by-fours, and Harleys from the historic downtown, and to return the small cobblestoned streets to their rightful owners: classical architecture and pedestrians.

    For traveling through and outside the original city center, Rome has an underground metro, trams, and many buses which could stick to the main avenues. It might inconvenience some, but for the majority, and that includes the global heirs of the Roman republic, the city would again be a delight.

    Venice solved the problem of burdensome traffic by filling its streets with water. Other European cities — the old town of Dubrovnik, Orleans in France, and Copenhagen come to mind — have successfully put pedestrians and bicycles first.

    If its cars were evicted, Rome would become one of the world’s great open air museums, on a par with the old city of Jerusalem, parts of Marrakech, and with some sidewalk areas in Paris, although I doubt Rome will ever break with the automobile.

    Rome is sinking under the weight of its exhaust pipes not only because of its traffic. The city shares the nation’s political problems: one hundred and fifty years after its independence, Italy is still best understood as a fragmented state, the Yugoslavia of the European Union, with a dysfunctional judiciary, parliament, executive branch, and treasury, and the fear that the center will not hold.

    To understand the level of executive and parliamentary incompetence, consider that, since the Fascist government was toppled in World War II, about forty-three men have served as prime minister, and the parliament has had more than sixty changes to its governing coalition. Only one government in this period has served out its five-year term.

    The biggest reason for Italy’s political stalemate is that the country’s north-south divide has remained unresolved, some would say since Garibaldi marched on Rome in 1862.

    Northern Italy has a prosperous manufacturing base, a balanced budget, low debt to its GDP, dynamic cities (Milan, Turin, Venice, Bologna), and strong tourist and export revenue. The south, which includes Naples and Sicily, is a huge consumer of government subsidies, heavily reliant on inefficient agricultural systems, and has less manufacturing than the North. Rome is a nether world between the two blocs.

    Youth unemployment in Naples is said to be 50 percent, and GDP per capita is some $40,000 less in the south than in the north. Sicily today may have less to fear from the mafia, but greater danger from joblessness.

    The specter of Italy dividing along its north-south seam — as if after an earthquake in the Apennines — is, I believe, the reason that no one wants a strong federal government in Rome. Little government is thought to be less offensive to most than at even some degree of functional government would be.

    Rome is the symbol of this fragmented state, with its allure of past and future greatness, and its present vanishing under a layer of soot, corruption, and waste.

    David Gilmour ends his excellent history, The Pursuit of Italy, with, “Yet the millennia of [the Italians] past and the vulnerability of their placement have made it impossible for them to create a successful nation-state.”

    In Oklahoma City, my favorite mayor can expand the sidewalks and lay down more bike lanes, much as he can argue for a balanced budget. In Rome, however, no one can take on the car lobby because no one, politically, is out strolling arm-in-arm. For one thing, the sidewalks don’t allow it.

    Matthew Stevenson, a contributing editor of Harper’s Magazine, is the author most recently of Remembering the Twentieth Century Limited, a collection of historical travel essays, and Whistle-Stopping America. His next book, Reading the Rails, will be published in 2016. He lives in Switzerland.

    Flickr photo by Andrew Moore: Parking, Italian Style — A Fiat 500 in Rome

  • 2014 Journey to Work Data: More of the Same

    The major metropolitan area journey to work data is out, reported in the American Community Survey ‘s 2014 one year edition. The news is that there is not much news. Little has changed since 2010 despite all the talk about “peak car” and a supposed massive shift towards transit. Single occupant driving remains by far the largest mode of transport to work in the 53 major metropolitan areas (with over 1,000,000 population), having moved from 73.5 percent of commutes to 73.6 percent. Little upward change in single occupant commuting can be expected, since it is probably already a virtual saturation rate.

    The only significant change is the most important trend that is occurred for decades in US commuting: the reduction in carpooling. Between 2010 and 2014, carpooling dropped from 9.8 percent to 8.8 percent in the major metropolitan areas.

    Transit continued to hold on to third place, with an increase from 7.9 percent to 8.1 percent in the major metropolitan areas. Working at home, including telecommuting, continued its more dramatic rise, from 4.4 percent in 2010 to 4.7 percent in 2014. Walking remained constant at 2.8 percent, while cycling continued its increase but from a small 0.5 percent to 0.7 percent. Other modes of transport, such as taxis and motorcycles remained constant at 1.2 percent (Figure 1).

    In the major metropolitan areas, transit continued to lead over working at home (8.1 percent compared to 4.7 percent), though at the national level the margin was much smaller (5.2 percent compared to 4.5 percent). Transit strength was far more concentrated principally in a few metropolitan areas with “legacy” cities and, as a result, working at home exceeded transit’s market share in 39 of the 53 markets.

    Should carpooling continue its downward trend, it would fall below transit before the end of the decade among the major metropolitan areas (now at 8.8 percent compared to transit 8.1 percent), though the carpooling lead is sufficient to retain second-place far longer at the national level (9.2 percent compared to 5.2 percent). As in working at home, however, transit’s strength is highly concentrated relative to carpooling. Transit leads carpooling only in the six metropolitan areas with transit legacy cities (New York, Chicago, Philadelphia, San Francisco, Boston, and Washington), while carpooling leads in 47 metropolitan areas.

    Commuting market share data for the major metropolitan areas is shown in Tables 1 and 2.

    Transit Gains and Losses

    With by far the most attractive urban environment for transit use in the United States and far and away the largest system, New York dominated the transit share of the  journey to work data, adding 240,000 daily transit commuters between 2010 and 2014 (out of a national total of 576,000). Six other metropolitan areas with the strongest transit gains were San Francisco at 66,000, Chicago with 41,000, Boston with 38,000, Seattle with 34,000 and Washington with 32,000. All of these were above the next highest, Philadelphia, with 16,000. Each of these metropolitan areas, with the exception of Seattle, has a transit legacy city at its core. Overall the other 45 metropolitan areas, with nearly 70 percent of the population, accounted for less than 20 percent of the transit increase.

    Los Angeles, which has been hailed as the becoming "next transit city," seems long on intentions and construction, but wanting in results.  The laggard transit performance of Los Angeles, despite one of the world’s most aggressive rail construction programs has been described in a recent Orange County Register commentary. In 2014-2015, ridership on the legacy MTA (former SCRTD) bus and rail system was almost 10 percent below the bus only system of 1985, despite an increase in the Los Angeles County population of approximately one-quarter (see: Los Angeles; Rail for Others).

    Thirteen metropolitan areas experienced modest transit commuting losses (less than 3,000). In addition to Los Angeles, these included rail metropolitan areas Virginia Beach-Norfolk, San Diego, Buffalo, Cleveland, and Pittsburgh.

    Working at Home Gains and Losses

    The largest working at home gain was also in New York, at 40,000 (out of 499,000 in the major metropolitan areas). The second largest gain was in Los Angeles at 32,000. San Diego added 27,000 people accessing work from home. Four metropolitan areas lost commuters who work at home, though the losses were modest (less than 1,000) in all but Virginia Beach-Norfolk, where the decline was more than 11,000.

    Driving Alone Gains, No Losses

    New York also led in the number of additional commuters driving alone to work, adding more than 420,000. The other largest gainers were in Los Angeles at 325,000 and Houston at 309,000. All of the 53 major metropolitan areas added single occupant commuters and in each single occupant commuting added more than any other mode, including transit. Rochester had the smallest increase, at 7,000.

    Carpool Gains and Losses

    Despite its continuing overall losses, carpooling made gains in some metropolitan areas. Detroit led with nearly 14,000 new carpoolers, followed closely by Orlando, Portland, and Dallas-Fort Worth both added more than 10,000 new carpoolers, adding more commuters than their rail oriented transit systems.

    However, the car pool losses were generally more severe. Chicago lost nearly 36,000 carpooling commuters. Los Angeles lost 30,000, New York lost 29,000 and Tampa-St. Petersburg lost 19,000. Losses of more than 10,000 were also sustained in Washington, St. Louis, San Diego, Pittsburgh, Phoenix, Memphis, Baltimore, and Boston.

    Cycling Gains and Losses

    New York also gained the most cycling commuters, at nearly 14,000, followed by San Francisco at 13,000, Los Angeles at 10,000. Eight metropolitan areas lost cycling commuters, but only two exceeded 250, Grand Rapids (800 loss) and Riverside-San Bernardino (700 loss).

    More of the Same

    U.S. commuters continue to travel to work using the modes that have dominated for decades, with the exceptions of substantial increases in working at home and big losses in car pooling. Though even in these modes, the changes are slight in view of the dominance of single-occupant commuting, as Figure 1 indicates. This is not surprising, commuters who drive alone reach virtually anywhere in the metropolitan area and nearly always at a faster speed than any other method of commuting, save working at home.

    Table 1
    Transit Work Trip Market Share: 2014
    Major Metropolitan Areas (53 over 1,000,000 Population)
    MARKET SHARE              
    MSA Drive Alone Car Pool Transit Bicycle Walk Other Work at Home
    Atlanta, GA 77.6% 10.3% 3.1% 0.2% 1.4% 1.4% 6.2%
    Austin, TX 76.6% 10.1% 2.5% 0.7% 1.7% 1.5% 6.9%
    Baltimore, MD 77.2% 8.2% 6.6% 0.3% 2.6% 1.1% 4.0%
    Birmingham, AL 85.2% 9.1% 0.5% 0.2% 1.1% 1.1% 2.9%
    Boston, MA-NH 67.6% 6.8% 12.9% 1.0% 5.3% 1.2% 5.1%
    Buffalo, NY 82.3% 7.7% 3.0% 0.4% 2.9% 0.9% 2.9%
    Charlotte, NC-SC 81.0% 9.4% 1.9% 0.2% 1.4% 1.1% 5.1%
    Chicago, IL-IN-WI 70.9% 7.7% 11.9% 0.7% 3.2% 1.2% 4.5%
    Cincinnati, OH-KY-IN 82.8% 7.9% 2.1% 0.3% 2.0% 0.8% 4.1%
    Cleveland, OH 82.3% 6.8% 3.2% 0.3% 2.6% 0.9% 3.9%
    Columbus, OH 83.0% 7.7% 1.8% 0.5% 2.1% 0.7% 4.4%
    Dallas-Fort Worth, TX 80.8% 9.9% 1.6% 0.2% 1.2% 1.7% 4.6%
    Denver, CO 76.3% 8.8% 4.5% 0.9% 2.0% 0.8% 6.6%
    Detroit,  MI 84.0% 9.0% 1.6% 0.3% 1.3% 0.8% 3.1%
    Grand Rapids, MI 81.6% 8.9% 1.7% 0.3% 2.2% 1.4% 4.0%
    Hartford, CT 81.4% 7.8% 2.7% 0.2% 2.6% 1.1% 4.2%
    Houston, TX 80.3% 10.7% 2.4% 0.3% 1.3% 1.6% 3.4%
    Indianapolis. IN 84.2% 8.5% 1.2% 0.3% 1.3% 0.7% 3.8%
    Jacksonville, FL 80.4% 9.7% 1.2% 0.6% 1.2% 1.7% 5.2%
    Kansas City, MO-KS 83.4% 8.5% 1.0% 0.2% 1.2% 1.0% 4.7%
    Las Vegas, NV 77.6% 10.2% 4.8% 0.5% 1.6% 2.3% 3.1%
    Los Angeles, CA 74.6% 9.7% 5.8% 1.0% 2.5% 1.3% 5.1%
    Louisville, KY-IN 81.8% 9.5% 2.0% 0.3% 1.7% 1.0% 3.7%
    Memphis, TN-MS-AR 84.9% 8.6% 1.0% 0.1% 1.1% 1.7% 2.6%
    Miami, FL 78.7% 8.9% 3.7% 0.6% 1.7% 1.4% 5.0%
    Milwaukee,WI 80.6% 8.4% 3.5% 0.5% 2.6% 0.8% 3.6%
    Minneapolis-St. Paul, MN-WI 77.3% 8.6% 4.8% 1.0% 2.4% 0.9% 4.9%
    Nashville, TN 81.7% 9.8% 1.3% 0.2% 1.6% 0.8% 4.6%
    New Orleans. LA 79.2% 9.7% 3.1% 1.3% 2.3% 1.5% 2.9%
    New York, NY-NJ-PA 50.2% 6.4% 31.1% 0.6% 6.0% 1.5% 4.2%
    Oklahoma City, OK 82.8% 10.1% 0.4% 0.4% 1.5% 1.1% 3.7%
    Orlando, FL 79.8% 9.9% 2.0% 0.6% 0.9% 1.2% 5.6%
    Philadelphia, PA-NJ-DE-MD 73.0% 7.8% 9.7% 0.6% 3.7% 0.8% 4.3%
    Phoenix, AZ 77.0% 10.5% 2.1% 0.9% 1.5% 1.9% 6.1%
    Pittsburgh, PA 77.5% 8.1% 5.6% 0.4% 3.4% 0.8% 4.1%
    Portland, OR-WA 70.0% 10.2% 6.5% 2.6% 3.3% 1.0% 6.4%
    Providence, RI-MA 81.1% 7.9% 2.8% 0.5% 3.4% 0.9% 3.5%
    Raleigh, NC 80.0% 9.0% 1.0% 0.2% 1.3% 1.1% 7.3%
    Richmond, VA 81.8% 9.1% 1.7% 0.4% 1.6% 1.2% 4.2%
    Riverside-San Bernardino, CA 77.4% 13.3% 1.6% 0.3% 1.7% 1.0% 4.7%
    Rochester, NY 82.5% 6.9% 2.5% 0.7% 3.1% 0.7% 3.7%
    Sacramento, CA 76.4% 10.2% 2.7% 1.8% 2.0% 1.3% 5.5%
    Salt Lake City, UT 74.9% 12.2% 3.8% 0.8% 2.1% 0.8% 5.3%
    San Antonio, TX 80.0% 10.8% 2.1% 0.2% 1.7% 0.9% 4.3%
    San Diego, CA 76.0% 8.6% 2.7% 0.8% 2.9% 1.4% 7.5%
    San Francisco-Oakland, CA 59.2% 9.4% 16.7% 2.2% 4.7% 1.6% 6.2%
    San Jose, CA 76.2% 10.4% 4.0% 1.6% 1.7% 1.2% 4.8%
    Seattle, WA 69.0% 9.8% 9.6% 1.2% 3.6% 1.1% 5.7%
    St. Louis,, MO-IL 82.7% 7.3% 2.9% 0.3% 1.8% 0.8% 4.1%
    Tampa-St. Petersburg, FL 81.1% 7.4% 1.5% 0.9% 1.5% 1.7% 5.9%
    Virginia Beach-Norfolk, VA-NC 82.4% 8.2% 1.6% 0.5% 3.0% 1.2% 3.1%
    Tucson, AZ 77.0% 9.1% 2.9% 2.1% 2.5% 2.0% 4.5%
    Washington, DC-VA-MD-WV 66.1% 9.7% 14.3% 0.8% 3.1% 1.0% 5.1%
    Major Metropolitan Areas 73.6% 8.8% 8.1% 0.7% 2.8% 1.2% 4.7%
    Outside Major Metropolitan Areas 80.4% 9.8% 1.2% 0.5% 2.7% 1.2% 4.1%
    United States 76.5% 9.2% 5.2% 0.6% 2.7% 1.2% 4.5%
    From American Community Survey: 2014 (1 Year)


    Table 2
    Transit Work Trip Market Share: 2010 (2008-2012 ACS)
    Major Metropolitan Areas (53 over 1,000,000 Population)
    MARKET SHARE              
    MSA Drive Alone Car Pool Transit Bicycle Walk Other Work at Home
    Atlanta, GA 77.6% 10.7% 3.2% 0.2% 1.3% 1.4% 5.6%
    Austin, TX 75.0% 11.3% 2.6% 0.8% 1.8% 1.9% 6.6%
    Baltimore, MD 76.3% 9.7% 6.3% 0.3% 2.7% 0.9% 3.9%
    Birmingham, AL 84.0% 10.6% 0.7% 0.1% 1.1% 0.6% 3.0%
    Boston, MA-NH 68.8% 7.9% 11.9% 0.9% 5.3% 0.9% 4.4%
    Buffalo, NY 81.8% 8.1% 3.5% 0.4% 3.0% 0.9% 2.4%
    Charlotte, NC-SC 80.5% 10.4% 1.8% 0.1% 1.4% 0.9% 4.9%
    Chicago, IL-IN-WI 70.9% 8.8% 11.3% 0.6% 3.1% 1.1% 4.2%
    Cincinnati, OH-KY-IN 82.6% 8.7% 2.2% 0.2% 2.1% 0.7% 3.6%
    Cleveland, OH 82.1% 7.8% 3.5% 0.3% 2.1% 0.8% 3.4%
    Columbus, OH 82.6% 8.2% 1.6% 0.4% 2.1% 0.8% 4.2%
    Dallas-Fort Worth, TX 80.9% 10.5% 1.5% 0.2% 1.2% 1.3% 4.5%
    Denver, CO 75.7% 9.5% 4.5% 0.9% 2.1% 1.2% 6.0%
    Detroit,  MI 84.2% 8.7% 1.6% 0.2% 1.4% 0.8% 3.1%
    Grand Rapids, MI 82.8% 8.9% 1.2% 0.5% 1.9% 0.7% 3.9%
    Hartford, CT 81.0% 8.2% 3.1% 0.2% 2.7% 1.0% 3.8%
    Houston, TX 79.2% 11.7% 2.4% 0.3% 1.4% 1.6% 3.4%
    Indianapolis. IN 83.6% 9.0% 1.1% 0.3% 1.7% 0.8% 3.6%
    Jacksonville, FL 81.1% 9.9% 1.3% 0.6% 1.4% 1.3% 4.4%
    Kansas City, MO-KS 82.9% 9.2% 1.2% 0.2% 1.3% 1.0% 4.1%
    Las Vegas, NV 78.5% 11.1% 3.7% 0.4% 1.8% 1.5% 3.0%
    Los Angeles, CA 73.6% 10.8% 6.1% 0.9% 2.7% 1.2% 4.9%
    Louisville, KY-IN 82.9% 9.3% 2.1% 0.3% 1.7% 0.8% 2.9%
    Memphis, TN-MS-AR 82.8% 10.7% 1.3% 0.1% 1.3% 1.0% 2.8%
    Miami, FL 78.2% 9.8% 3.7% 0.6% 1.8% 1.4% 4.5%
    Milwaukee,WI 79.9% 9.2% 3.6% 0.5% 2.8% 0.7% 3.2%
    Minneapolis-St. Paul, MN-WI 78.1% 8.6% 4.6% 0.9% 2.3% 0.8% 4.7%
    Nashville, TN 81.5% 10.4% 1.1% 0.2% 1.2% 0.9% 4.6%
    New Orleans. LA 79.0% 10.9% 2.6% 0.8% 2.4% 1.6% 2.6%
    New York, NY-NJ-PA 51.0% 7.1% 29.9% 0.5% 6.1% 1.6% 3.9%
    Oklahoma City, OK 82.9% 10.4% 0.5% 0.3% 1.6% 1.1% 3.3%
    Orlando, FL 81.1% 9.3% 1.9% 0.5% 1.1% 1.7% 4.5%
    Philadelphia, PA-NJ-DE-MD 73.4% 8.2% 9.4% 0.6% 3.7% 0.8% 3.8%
    Phoenix, AZ 76.4% 11.9% 2.1% 0.8% 1.6% 1.6% 5.6%
    Pittsburgh, PA 76.9% 9.3% 5.7% 0.2% 3.6% 0.9% 3.5%
    Portland, OR-WA 71.2% 9.7% 6.1% 2.2% 3.5% 1.0% 6.3%
    Providence, RI-MA 80.8% 8.8% 2.7% 0.3% 3.2% 0.9% 3.3%
    Raleigh, NC 80.6% 9.6% 1.0% 0.3% 1.4% 1.2% 5.9%
    Richmond, VA 81.3% 9.6% 2.0% 0.4% 1.4% 0.8% 4.5%
    Riverside-San Bernardino, CA 76.2% 14.4% 1.6% 0.4% 1.8% 1.1% 4.4%
    Rochester, NY 81.4% 8.4% 1.9% 0.5% 3.6% 0.7% 3.5%
    Sacramento, CA 75.1% 11.6% 2.7% 1.8% 2.0% 1.2% 5.6%
    Salt Lake City, UT 75.9% 12.0% 3.5% 0.8% 2.3% 1.2% 4.3%
    San Antonio, TX 79.1% 11.5% 2.2% 0.1% 1.9% 1.2% 3.9%
    San Diego, CA 75.9% 10.2% 3.1% 0.7% 2.7% 1.1% 6.3%
    San Francisco-Oakland, CA 61.5% 10.3% 14.7% 1.7% 4.3% 1.4% 6.0%
    San Jose, CA 76.5% 10.4% 3.2% 1.7% 2.1% 1.4% 4.7%
    Seattle, WA 69.7% 11.0% 8.3% 1.0% 3.6% 1.1% 5.3%
    St. Louis,, MO-IL 82.6% 8.4% 2.5% 0.3% 1.7% 0.8% 3.7%
    Tampa-St. Petersburg, FL 80.3% 9.5% 1.4% 0.7% 1.6% 1.4% 5.2%
    Virginia Beach-Norfolk, VA-NC 80.6% 9.0% 1.8% 0.4% 2.6% 1.1% 4.4%
    Tucson, AZ 76.5% 10.3% 2.4% 1.5% 2.5% 2.0% 4.8%
    Washington, DC-VA-MD-WV 66.0% 10.6% 14.0% 0.6% 3.2% 0.9% 4.7%
    Major Metropolitan Areas 73.5% 9.6% 7.9% 0.6% 2.8% 1.2% 4.4%
    Outside Major Metropolitan Areas 80.8% 9.8% 0.9% 0.5% 2.7% 1.2% 4.2%
    United States 76.6% 9.7% 4.9% 0.5% 2.8% 1.2% 4.3%
    From American Community Survey:2008-2012


    Wendell Cox is Chair, Housing Affordability and Municipal Policy for the Frontier Centre for Public Policy (Canada), is a Senior Fellow of the Center for Opportunity Urbanism (US), a member of the Board of Advisors of the Center for Demographics and Policy at Chapman University (California) and principal of Demographia, an international public policy and demographics firm.He is co-author of the “Demographia International Housing Affordability Survey” and author of “Demographia World Urban Areas” and “War on the Dream: How Anti-Sprawl Policy Threatens the Quality of Life.” He was appointed to three terms on the Los Angeles County Transportation Commission, where he served with the leading city and county leadership as the only non-elected member. He served as a visiting professor at the Conservatoire National des Arts et Metiers, a national university in Paris.

    Photo: Harbor Freeway (I-110), Los Angeles (by author)

  • Public Transport’s Biggest Problem: The Public (That’s Us)

    When’s the last time you heard some futurist or management guru suggest that in the future more of us will be working at the same desk doing routine tasks on a predictable working week schedule? No? That’s just one of many problems that advocates of limitless spending on public transport need to keep in mind in dealing with the issue of urban congestion.

    Increasing urban congestion is said to cost the economy dearly and if Infrastructure Australia is to be believed, it will cost even more in the future unless something is done now. They warn the current estimate of a $13.7 billion annual cost will balloon to $53 billion by 2031.

    Congestion is without dispute a handbrake on economic productivity but the range of solutions for reducing congestion range from the outright zany (see Elizabeth Farrelly’s suggestions  for Prime Minister Turnbull as one example) to milder versions of zany. They all tend to be very expensive and many impose unacceptable compromises on our basic freedoms (such as proposals to ban cars from cities).

    Increased investment in public transport is a feature of many proposed solutions for alleviating congestion. It is true that we have under-invested in public transport systems in past decades and it’s equally true that we’ve under-invested in private transport. Basically, we’ve cheered a rising population while passing the buck for funding and delivering the infrastructure needed to support that growth to future generations. Rising congestion levels are making it feel like crunch time now.

    But there are valid questions about the capacity of public transport to alleviate congestion which are rarely getting asked. Rather than a magical silver bullet, there are a few things to keep in mind before you climb aboard the merry bandwagon of limitless investment in public transport…

    The nature of work is changing. Public transport systems work best on a hub and spoke model of employment and commuting, built on predictable schedules designed around predictable commuter needs. Central business districts of very high employment concentrations, where people work in the same workplace from day to day and for the same hours each day, are ideal candidates for public transport.  But increasingly this is looking like a 20th century model of work. Technology has been the primary driver of change, allowing more workplace flexibility and providing for increased location diversity. ‘Standard hours’ of work are being diluted and at the same time companies increasingly realise the high costs of ‘paper factories’ for administrative staff in costly CBD locations makes little sense. With this, the centralised nature of work is also being diluted and this is working against the centralised economic model that makes fixed public transport systems (especially rail) effective.

    Society is changing. There was a time when commuting trips to work in central locations were mainly a case of getting there and getting home.  Much has changed. A rising proportion of women in the workforce and how this has changed family responsibilities means that commutes to and from work are also often tied in with other objectives: dropping off or picking up school kids or children in child care is only a part of this (but one which is said to contribute to 20% of private vehicle traffic on the roads in peak periods during school terms).  Add in to this the increasing propensity to shop less but more frequently (who owns a chest freezer anymore?) and to mix in pre and post work social or recreational appointments, and you have a very different pattern of commuting which public transport will struggle to service.

    The suburban economy. A telling reality for proponents of increased public transport investment is that employment remains – and in some cases is increasingly – suburban by nature. Between 8 and 9 out of 10 of all jobs in metropolitan regions are suburban by location, and when you consider that the same proportion of residents in any metropolitan location are also suburban by residence, the problem of servicing this reality through public transport is apparent. In the last inter censal period, the proportion of metropolitan wide jobs located in the CBD actually fell in Brisbane (to 12.5%), while in Melbourne it remain unchanged (at 10%) and Sydney recorded a small rise (to 13.5%). The raw numbers of jobs in suburban locations are growing faster, as a rule, than those in CBDs.  The cost of creating a public transport system designed around suburban home to suburban workplace commutes is beyond calculation. In Australia, we will be in flying cars like the Jetsons long before this happens.

    The new and emerging economy. The way cities were designed – with concentrations of white collar workers in CBDs and with discrete areas set aside for industrial, retail or other specified activities – is no longer as important for new or emerging economies. Technology in particular means that physical place is less essential for connectivity to markets. Communication is less dependent on physical proximity. This doesn’t mean CBDs will lose their higher order function but it does mean that disruptive or emerging businesses, for which new technologies are more than just a novelty but a foundation, will have less need for the types of places offered by centralised business districts. They can locate in lower cost areas of the metropolitan area, and make use of the central business districts on occasion, rather than routine. Attracting and retaining these emerging types of businesses will also put the onus on suburban business centres to lift their game, but in many cases this isn’t difficult. Just think of any number of start ups or tech based companies you’ve read of recently and think about how many of these have been in non-traditional locations. Even when these businesses mature, their lack of interest in a CBD style presence doesn’t seem to change. Witness the many technologically innovative businesses in the USA or Europe, by way of example.

    Where does this leave us with solutions for congestion? Ironically, increasing public transport investment designed to ferry people into and out of central business areas is unlikely to make much difference to metropolitan wide congestion. It can’t – simply because only a minority of jobs (between 10% and 15% in the case of Australia’s major cities) are in these locations. People with jobs in these locations may currently have relatively high rates of public transport usage already (often 40% plus) but imagine the cost of increasing this to 80%? The cost of getting there is incalculable for cities of our size, and in any way, it would only benefit 10% to 15% of the urban workforce. Ironically, the people most likely to benefit from this type of public transport prescription tend be much higher wage earners, living close to the inner city in highly valued real estate. (Have a look at this analysis from The Pulse a couple of years ago). Yet their higher capacity to pay is not reflected in most policy debate.

    The reality is that public transport can only go so far in alleviating congestion. Social and economic change to the nature of work is changing the shape of employment decisions and has forever changed the nature of the commute. Public policy officials, urbanists and politicians who pretend that all that’s needed to ‘solve congestion’ is massively increased investment in heavy rail, light rail or dedicated busway networks are deluded: this thinking is rooted in nostalgic notions of work, unrelated to the future of work.

    And as if to demonstrate the fact we should not expect better from our various governments, when a technological innovation comes along that promises to realize the long held dream of ride sharing and increased persons per vehicle – which if widely embracedwould go a long way to solving congestion at no cost to taxpayers –  governments stand in the way. It’s called Uber. Go figure.

    Ross Elliott has more than 20 years experience in property and public policy. His past roles have included stints in urban economics, national and state roles with the Property Council, and in destination marketing. He has written extensively on a range of public policy issues centering around urban issues, and continues to maintain his recreational interest in public policy through ongoing contributions such as this or via his monthly blog The Pulse.

  • How Commuters Get Railroaded by Cities

    With more than $10 billion already invested, and much more on the way, some now believe that Los Angeles and Southern California are on the way to becoming, in progressive blogger Matt Yglesias’ term, “the next great transit city.” But there’s also reality, something that rarely impinges on debates about public policy in these ideologically driven times.

    Let’s start with the numbers. If L.A. is supposedly becoming a more transit-oriented city, as boosters already suggest, a higher portion of people should be taking buses and trains. Yet, Los Angeles County – with its dense urbanization and ideal weather for walking and taking transit – has seen its share of transit commuting decline, as has the region overall.

    Since 1980, before the start of subway and light-rail construction, the percentage of Angelenos taking transit has actually dropped, from 7.0 percent to 6.9 percent, while the region (including the Inland Empire and Ventura County) has seen the transit share drop from 5.1 percent to 4.7 percent. These reductions in ridership have been experienced both on the rail and bus lines.

    The simple truth is that this region is just not structured to run largely on rails. We should not prioritize our transit dollars on trying to remake our region into something resembling New York, or even San Francisco, but in serving the needs, first and foremost, of those who remain dependent on public transit.

    Read the entire piece at The Orange County Register.

    Joel Kotkin is executive editor of NewGeography.com and Roger Hobbs Distinguished Fellow in Urban Studies at Chapman University, and a member of the editorial board of the Orange County Register. He is also executive director of the Houston-based Center for Opportunity Urbanism. His newest book, The New Class Conflict is now available at Amazon and Telos Press. He is also author of The City: A Global History and The Next Hundred Million: America in 2050. He lives in Orange County, CA.

  • Light Rail in the Sun Belt is a Poor Fit

    There is an effective lobby for building light rail, including in cities such as Houston. But why build light rail? To reduce car use? To improve mobility for low-income citizens? This certainly seems a worthwhile objective, with the thousands of core-city, low-income residents whose transit service cannot get them to most jobs in a reasonable period of time.

    ut rather than accept the flackery that accompanies these projects, maybe we should focus on effectiveness, judged by ridership, and the impact of such expensive projects on the transportation of the transit-dependent.

    Take the Dallas light rail system, which serves growing Dallas and Collin counties. The DART light rail system expanded its lines by approximately three quarters between 2000 and 2013, yet the number of transit commuters declined, and transit’s commuting market share dropped by one-quarter. More than twice as many Dallas workers are employed at home than ride transit, and do not require the massive capital and operating subsidies of light rail.

    Even the widely praised Denver system has barely moved the needle for transit ridership; before opening its massive light rail system in 1990, 4.3 percent of Denver commuters used transit to get to work.

    The share did rise – by a total of 0.1 percent to 4.4 percent. Even Portland, considered the Mecca of the “smart growth” strategy, actually has seen a decrease in its transit market share, from 7.9 percent before light rail to 6.4 percent in 2013. San Diego, arguably one of the more successful light rail systems, has seen its transit market share stagnate, from 3.3 percent in 1980 before light rail to 3.2 percent in 2013.

    And then there is Los Angeles, a city that was essentially built around the Pacific Electric “Red Car” system in the early 20th Century, and is the densest in the United States, more than twice as dense as Houston. Yet despite this, the regional MTA, which operates its large bus and rail system, as well as a subway, still struggles to reach its ridership record reached in 1985, when transit consisted of only buses. Despite spending over $10 billion in public funds, Los Angeles has seen ridership decline while the once-more thriving bus system has deteriorated. Nearly three quarters of all Angelenos still drive to work.

    No surprise then that Houston, where the light rail system opened in 2004, has not been notably successful.

    Between 2003 and 2014, Harris County’s population grew 23 percent, but transit ridership decreased 12 percent, according to American Public Transportation Association data. This means that the average Houstonian took 30 percent fewer trips on the combined bus and light rail system in 2014 than on the bus only system in 2003.

    Finally, in each of these cities, driving alone has increased and, with the exception of Los Angeles, more people now work at home than ride transit to work.

    These results reflect stubborn historical facts. Transit works well generally in older cities with historically large downtowns built largely before the ascendency of the car. These “legacy” cities, notably New York, are hard-wired for transit and have the largest downtowns; in New York the Manhattan business districts accounts for about 20 percent of the workforce. Together these legacy cities – New York, Boston, Chicago, Philadelphia, San Francisco and Washington – account for 55 percent of all transit work trip destinations in the nation.

    In contrast, most Sun Belt cities have far fewer downtown jobs. In Los Angeles, downtown amount for less than 3 percent of employment and Dallas’ downtown accounts for only 2 percent of metropolitan employment. In Houston the number is only 6.4 percent.

    With population and jobs concentrating in the periphery, light rail service ends up serving a geography to which relatively few commute. They have not materially increased transit’s share of travel, or reduced car travel. Worse still, their intense expense on single lines (routes) has precluded greater and less costly bus expansions that could have provided neglected communities – the young, the poor, the disabled, immigrants and minorities – with access to more jobs. The performance of light rail simply has not justified the expense.

    Houston and other metropolitan areas need to take advantage instead of an incipient transportation revolution. Working at home is likely to increase substantially and automated vehicles promise to increase mobility while reducing traffic congestion. Companies like Uber could offer other private-sector based solutions. Houstonians should address the needs of the 21st century city not as some wish it to be but based how things really work.

    This piece first appeared in the Houston Chronicle.

    Joel Kotkin is executive editor of NewGeography.com and Roger Hobbs Distinguished Fellow in Urban Studies at Chapman University, and a member of the editorial board of the Orange County Register. He is also executive director of the Houston-based Center for Opportunity Urbanism. His newest book, The New Class Conflict is now available at Amazon and Telos Press. He is also author of The City: A Global History and The Next Hundred Million: America in 2050. He lives in Orange County, CA.

    Wendell Cox is Chair, Housing Affordability and Municipal Policy for the Frontier Centre for Public Policy (Canada), is a Senior Fellow of the Center for Opportunity Urbanism (US), a member of the Board of Advisors of the Center for Demographics and Policy at Chapman University (California) and principal of Demographia, an international public policy and demographics firm.He is co-author of the “Demographia International Housing Affordability Survey” and author of “Demographia World Urban Areas” and “War on the Dream: How Anti-Sprawl Policy Threatens the Quality of Life.” He was appointed to three terms on the Los Angeles County Transportation Commission, where he served with the leading city and county leadership as the only non-elected member. He served as a visiting professor at the Conservatoire National des Arts et Metiers, a national university in Paris.

  • Who Should Pay for the Transportation Infrastructure?

    Urban regions are significantly more important than any one city located within them. Housing, transportation, economy, and politics help produce uneven local geographies that shape the individual identities of places and create the social landscapes we inherit and experience. As such, decisions made within one city can ripple through the entire urban region. When affordable housing is systematically ignored by one city, neighboring cities become destinations for those who cannot afford higher housing costs. Even when the minimum wage is adjusted in one city, others cannot ignore it.

    In fact, a differential wage structure can produce diverse economic and labor geographies. Affordable housing and uneven economic development, in their turn, impact the regional transportation and infrastructure: if the cost of living and wages in one city in a particular region are high (as in San Francisco and Seattle), then low and middle-income workers will move to a more affordable neighboring city and pay a higher price, particularly in time spent, for transportation. They also pay more in fuel, and hence taxes that fund infrastructure maintenance and expansion.

    In other words, while companies and the more affluent population benefit from the agglomeration economies of alpha cities, it is the lower-wage workers and the population at large that pay for these uneven development. Therefore, a company deciding to locate in Seattle or San Francisco, or any location, does not have to bear the cost their decision imposes on urban transportation and the infrastructure needed to support their operation. Instead it’s their employees, particularly those with lower earning power, who do.

    How many LEED certified buildings and downtown redevelopment projects does it take to make up for this inequity?  Should a city be considered green, if a significant portion of its low earners has to commute to neighboring cities to afford a home? Can a city be seen as sustainable, if in a style akin to medieval cities, serfs have to leave every evening and return in the morning to make sure that the ‘creative class’ is adequately served?

    As states such as Washington engage with the old “pay as you go” policy of increasing fuel taxes to pay for the infrastructure, the question of what forces created the emergent commuting patterns remains unanswered. Was it just the commuters, acting as informed participants in the market economy, who sought to optimize their housing and transportation trade offs? Or did the locational choices of employers contribute to the growing commuting problems in the region? If commuters are subjected to “pay as you go” policies, shouldn’t employers who locate in expensive housing markets, irrespective of their employees’ income profile, be subjected to “pay as you locate” policies?

    Perhaps no metro region will make a better case study for this inequity than the area that ‘serves’ Seattle. The Puget Sound Region consists of four counties; however, to make sure that no one county that might have an economic connection with Seattle is left behind, we can look at six counties: Snohomish, King (where Seattle is located), Pierce, Kitsap, Thurston, and Mason.

    The entire urban region is served by a small number of highways, including Interstate 5. According to 2013 economic data, these six counties housed nearly 62% of all firms in the state. Furthermore, a quarter of all businesses in these counties were located within half a mile of a freeway. In terms of total employees, the six counties contained 69% of the state employment, and workplaces within half a mile of a freeway employed 37% of all employees in the counties. The inequity in the regional economic distribution is further exacerbated by the fact that the small area in West King county bounded by I-405 houses 30% of workplaces and 47% of employment, and generates a significant portion of the sales/revenue in the six counties. This area relies on I-5, I-405 and I-90 for the delivery of its employees from near and far.   

    The economic calculus of the early days of Interstate construction may have suggested that the trucking industry would benefit from this transportation infrastructure, but 1960s economists might be surprised by the type of companies now located within half a mile of freeways. In the six counties in Western Washington, the economic sectors over-represented in these geographies are: services and finance, real estate, and insurance (FIRE). Anyone driving on I-5 and I-405 (where Microsoft and other corporations are visible) can see this.  None of these workplaces require trucking. While their well-paid employees can afford to live in well-to-do places, including Bellevue and Seattle, many others reside in less expensive places such as Auburn, Tukwila, Tacoma, and Federal Way.

    A map of the region clearly suggests that neighboring counties and cities are housing those who work in West King County. Mobility has been the answer to unaffordability in this and other similar urban regions. If a city is unaffordable, is it fair to ask those who search for affordability in ‘other’ geographies pay for their so-called choices? Is this truly a choice? Are employers, current and future, asked to pay for their locational ‘choices?’ 

    Surely, we can do better than asking employees to bear the burden of a regional economic imbalance. Freeways should not be freer to some than others.  If this nation is about people paying for choices they make, then everyone should do so: employers and employees alike.

    Ali Modarres is the Director of Urban Studies at University of Washington Tacoma.  He is a geographer and landscape architect, specializing in urban planning and policy. He has written extensively about social geography, transportation planning, and urban development issues in American cities.

    Seattle photo courtesy of BigStockPhoto.com.

  • The Green Urbanization Myth

    Once a fringe idea, the notion of using technology to allow humanity to “decouple” from nature is winning new attention, as a central element of what the Breakthrough Institute calls “ecomodernism.” The origins of the decoupling idea can be found in 20th century science fiction visions of domed or underground, climate-controlled, recycling-based cities separated by forests or deserts. A version of decoupling was promoted in the 1960s and 1970s by the British science writer Nigel Calder in The Environment Game (1967) and the radical ecologist Paul Shepard in The Tender Carnivore and the Sacred Game (1973). More recent champions of decoupling include Martin Lewis, Jesse Ausubel, Stewart Brand, and Linus Blomqvist.  

    Proponents of decoupling point out correctly that the greatest threat to wilderness is not urban sprawl, but agricultural sprawl. The amount of the earth’s surface devoted to the unnatural, simplified ecosystems of agriculture—that is, farms and ranches—dwarfs the small amount consumed by cities, including low-density suburbs. Industrial, energy- and fertilizer-intensive agriculture has permitted us to grow far more food on far less land—with costs, to be sure, including water pollution from fertilizer runoff. Genetically modified crops will make it possible to shrink the footprint of global agriculture altogether, and if human beings ever derive most of their diet from laboratory-synthesized foods like in vitro meat and vegetables created from stem cells, most of today’s farmland can be freed for other uses.

    The decouplers are right to predict that technology will free up vast amounts of land for purposes other than farming. But many of them go wrong, I believe, when they assume that the decline of agricultural sprawl will be accompanied by the decline of urban sprawl, for two reasons. First, as societies become richer, more and more people choose low-density housing and can afford it. Second, whatever may be the case in other countries, in the United States, the private market for land—including retired farmland—ensures that little if any of the land freed by technology from agriculture will be turned into public wilderness preserves.

    One of the great urban legends of our time is the claim, endlessly repeated by urban gentry journalists, that Americans are tired of the suburbs and are moving back into the city in the search of walkable neighborhoods. The data disprove the claim. As Wendell Cox points out at Newgeography:

    But the core municipalities now contain such a small share of major metropolitan area population that the suburbs have continued to add population at about three times the numbers of the core municipalities…Indeed, if the respective 2010-2013 annual growth rates were to prevail for the next century,  the core municipalities would house only 28.0 percent of the major metropolitan area population in 2113 (up from 26.4 percent in 2013).           

    Thanks to decoupling, the low-density metro areas will probably become even bigger and even less dense. As farmland on the periphery of metro areas is retired from agriculture, much of it will be converted into cheap housing, low-rent office parks and inexpensive production facilities.

    The rise of robocars may accelerate metro area decentralization. Congestion will be reduced, and the greater safety of driverless cars may permit higher speeds on metro area beltways and cross-town freeways. Once taxi drivers are replaced by robot taxis, the cost of taxis will plummet and the greater convenience of point-to-point personal travel anywhere in a sprawling metro area will make rail-based mass transit obsolete except in places like airports and tourist-haven downtowns.  As in the past, most working-class families with children will probably prefer a combination of a longer commute with a bigger single-family house and yard to a shorter commute and life in a cramped apartment or condo. 

    Nor will most working-class and middle-class retirees move to walkable downtowns. They won’t be able to afford to. And robocars plus in-home medical technology will make it much easier for the elderly to age in place in car-based suburbs. 

    As great numbers of middle- and low-income Americans move to bigger, cheaper homes on the former farmland that rings expanding metro areas, they will be leap-frogged by the rich. Absent a reversal of today’s top-heavy income concentration, much of America’s wealth will continue to be concentrated in the hands of a few people. And when farmland is retired, thanks to GM crops, in vitro food, or other new land-sparing technologies, a lot of the former farm acreage will be bought by One Percenters and turned into rural retreats.

    The decouplers hope that retired farmland will be “rewilded” and transformed into nature parks that everyone can enjoy. But how realistic is this hope? At least in the United States, it is impossible to imagine federal or state governments buying more than a negligible portion of retired farmland and turning it into public parks. What is more likely, that most retired Midwestern farmland will be turned into rewilded public prairie preserves—or that it will be divided into the vast baronial estates of super-rich bankers, tech oligarchs, and trust-fund heirs and heiresses, who commute from their downtown skyscraper penthouses to their high-tech Downtown Abbeys?

    A certain amount of the former farm acreage owned by the plutocracy may be rewilded, with the encouragement of tax incentives like conservation easement laws. But rewilding on the scale imagined by some environmentalists is unlikely. For one thing, the former farmland will still be chopped up by fences, roads, power lines, and other structures. And all but the greatest recreational ranches will be too small to support self-sustaining populations of bison and other megafauna. Nor are voters likely to smile on the restoration of predators like wolves, coyotes, bears, and mountain lions, even if a few of eccentric rich landowners fancied the idea.

    And then there is the aesthetic factor. The biologist E.O. Wilson has suggested that, because we are descended from hominids who evolved on African savannahs, we naturally prefer vistas with grassy expanses to forests, deserts, and other biomes. Some evidence for this comes from the work of the Russian artists Komar and Melamid, who polled members of different nationalities and then painted the “Most Wanted Paintings” based on the results. In most countries, if they are to be believed, the favorite sofa painting shows a grassy landscape with a river and some woods in the background. 

    As Paul Shepard pointed out, the country-house landscape of 18th century Britain was anything but natural. The natural landscape of most of Britain, as of most of Western Europe, is dense forest. But the British rural upper class cleared the forests to create grassy vistas—the ancestors of the modern British and American suburban lawn. Shepard blamed this on the influence of Renaissance Italian landscape painting, which showed once-forested Mediterranean coast land that had been denuded by goats and sheep. But the Wilson theory may provide another explanation.

    Whether for cultural or instinctive reasons, the rich who buy up most of the land spared by technology may wish to keep open spaces, even if the area would naturally be forest. The late architect Philip Johnson waged a constant war on the New England forest in order to maintain grassy lawns over which to view his Glass House and other iconic buildings on his 47-acre New Canaan, Connecticut, estate. In prairie biomes, conversely, the rural rich are likely to plant some trees, to make the land conform to conventional notions of the scenic.   

    If the American rich are given a free hand to shape the former farm acreage they have bought, the most likely result will be a park-like landscape, with open vistas and clumps of trees—regardless of what the natural environment of the area would look like. The rewilding would be limited chiefly to small animals and birds, like raccoons and turkeys. No bison herds and no wolf packs. And as acreage was converted from farmland to One Percenter parkland, the already excessive deer population, freed from natural predators and rural American hunters alike, would swell even more. 

    The decouplers are right, I believe, to predict that advances in food production technology will free enormous amounts of former farmland for other uses. But very little of that land will be converted into the public wilderness preserves envisioned by Calder and Shepard and others. A minority of the former farmland will be converted into single-family housing on the edges of major metro areas. Most of the land retired from farming, instead of being spared for nature, will become rural estates for the plutocracy, surrounded by signs reading PRIVATE PROPERTY: KEEP OUT and overrun by starving deer.

    Michael Lind is the Policy Director of the Economic Growth Program at the New America Foundation in Washington, D.C., editor of New American Contract and its blogValue Added, and a columnist forSalon magazine. He is also the author of Land of Promise: An Economic History of the United States. Lind was a guest lecturer at Harvard Law School and has taught at Johns Hopkins and Virginia Tech. He has been an editor or staff writer at the New YorkerHarper’s Magazine, the New Republic and the National Interest.

    Image from BigStockPhoto.com

  • Running The Numbers On Transport Options

    Households are offered a great deal of advice which seems intended to dissuade them from using private, motorised transportation — that is, cars. Information about the negative fallout of car ownership — environmental and otherwise — has often been coloured with ethical overtones. Yet, despite those exhortations and the many well-known and indisputable reasons to cut back, extensive reliance on personal motor transport remains unchanged, if not growing. For example, the rate of car ownership since 1962 has doubled in the US, Canada, Australia and New Zealand; quintupled in Switzerland, Norway and Belgium and tripled in Sweden. This persistent growth alone undermines the claim of a high cost of ownership.

    Other trends also back up the notion that cost is not a key issue, and does not belong among the arguments in favour of reducing driving.


    Chart 1. Source: Joyce Dargay, Dermot Gately and Martin Sommer: Vehicle Ownership and Income Growth, Worldwide: 1960-2030. Institute for Transport Studies, University of Leeds

    In the US, for example, the costs of buying and operating a car have been continuously dropping. An analogous trend can be seen in the UK (Chart 2), where car costs have risen more slowly than the general retail price index, and slower than rail and bus fares (Note: The UK sustains higher tax levels and gasoline prices than the US.) It stands to reason that lower purchase and operation costs increase the car’s affordability.


    Chart 2. Source: UK Department for Transport Statistics 1997-2011 report Table TSGB0123 Retail Prices Index: Transport Components.

    Since 1979, incomes in developed countries have been on a rising trend, despite transient periods of economic stagnation. Increased buying power has made numerous commodities — including cars — more accessible.

    The obvious affordability of personal motorized transport does not mean that it will or should obliterate other, more affordable transport options: public transit in all its forms, and bicycling or walking.

    Public transit’s drawbacks are inflexibility and tardiness. Its reach often excludes employment sites at peripheral locations; as a Brookings Institute report has noted, “…Among very large metro areas, the share of jobs accessible via transit ranges from 37 percent in Washington and New York to 16 percent in Miami.” This limits access to employment for those disadvantaged households that rely entirely on transit for transportation. Though this inflexibility is shared by subway systems, subways generally have a speed advantage over cars in central, congested districts.

    The almost no-cost options of walking and cycling are limited by their low maximum speed, and by the effort required. Commuting distances in large cities can often exceed 8 to 12 miles as their diameters range between 15 to 30 miles. Those distances, when undertaken by foot or bike, become untenable because they break the universal half-hour threshold and may require excessive effort. These modes are also ill-suited to trip chains, which involve multiple tasks and destinations on a single trip (e.g. combining work commuting with school drop off/pick-ups, shopping, etc). As with transit, biking and walking has a limited reach of employment destinations. Moreover, a percentage of households may also find it difficult to accommodate all their transportation needs based entirely on these two modes.

    For these and many more reasons, reliance on private vehicles is extensive. That fact is supported by statistics on mode choice among Europeans, who typically have large shares of walking and bicycle trips. The data shows that, when looking at the total kilometers traveled by mode, personal motorised transport takes the lion’s share.


    Chart 3. Source: Modal Split of Passenger Transport [tran_hv_psmod] – Eurostat, last update 2015

    New ideas in transport that include transit, biking, and new forms of car use are emerging. The innovative solutions that follow are consistent with city-building and environmental objectives. Here are a few possibilities, still in a nascent stage:

    Shared car enterprises have sprung up in many urban centers, and offer the convenience of a car without the financial burden of ownership. They reduce total personal driving, and therefore greenhouse gasses (GHGs), as their use is intermittent.

    Pay as you drive car insurance and, a recent entry, pay by how you drive insurance. Both provide an incentive to drive less and better. They could reduce car ownership costs, congestion and GHGs.

    Electric cars are more economical to operate than conventional vehicles, while reducing pollution and city noise—all positive attributes.

    Ride-share services, though controversial, have the potential of reducing the cost of transport by improving its economic efficiency and performance. Both the driver (car owner) and the passenger(s) lower their respective costs, as cars occupancy increases and chained trips become the norm.

    Bicycle parking at subway/rail stations increases the potential universe of a subway or rapid-transit bus line (BRT) to four times or more the area of pedestrians within easy reach. This combined personal and communal transport yields excellent affordability.

    Bike lane systems on existing streets and paths off the streets increases the perception of safety, which typically increases bike commuting.

    Enlarging and enhancing city core sidewalks increases the comfort, safety and pleasure of walking in the city by reducing or removing traffic and, in a similar vein, introducing lanes and passages in the middle of long city blocks reduces walking distances.

    Uni-tickets (e.g. London’s Oyster, or New York’s MetroCard) for all public transit services increase the convenience and affordability of public transit and lead to higher ridership.

    That’s a short, unsorted excerpt of a longer and growing list of opportunities for transportation planning initiatives. What is not growing — and needs to — is the extent and speed of implementation; a great, worthwhile challenge for planners.

    Fanis Grammenos heads Urban Pattern Associates (UPA), a planning consultancy. UPA researches and promotes sustainable planning practices including the implementation of the Fused Grid, a new urban network model. He is a regular columnist for the Canadian Home Builder magazine, and author of Remaking the City Street Grid: A model for urban and suburban development. Reach him at fanis.grammenos at gmail.com.

    After twenty-four years at Canada Mortgage and Housing Corporation, Tom Kerwin now leads an active volunteer life, including being the Science and Environment Coordinator for the Calgary Association of Lifelong Learners. He holds a Master’s degree in Environmental Studies from York University.

    Special thanks to Luis Rodriguez for collaborating in shaping this article.

    Flickr photo by Fraser Mummery; Golden Gate Traffic: Auto drivers, pedestrians and a bus on one of the most recognizable structures in the world… the Golden Gate Bridge in San Francisco, California.

  • Is Owning A Car Too Expensive?

    Many analysts—usually planners—have been regularly offering a wealth of exhortations concerning how uneconomical it is to purchase, operate and maintain a private car. Is this a valid assertion of a household economic burden? And what is the likelihood that the advice will ultimately prove useful? Household economic decision-making varies greatly, depending principally upon income levels, personal circumstances, and preferences. A single mother with children, or a part-time worker, will make transport choices for radically different reasons than a management executive. With their priorities already set, each of these individuals has little use for generic advice; it is either unhelpful or irrelevant to them.

    Such advice often crops up in planning-related journals or web sites. Given that laypeople are unlikely to read these sources, however, the efforts may be largely wasted.

    Underlying the production of advice is the presumption that households need it. In theory, consumers can be unaware of costs in certain cases, for example, if a product is relatively new or not universally used, such as e-cigarettes.

    This could hardly apply to households and the car market. There are 828 cars per 1000 people in the US; 620 in Canada. Even more telling is market participation by households, as shown by the blue bars in Chart 1, below. By 2012, only about 9% of households did not own a vehicle, compared to over 20% in 1960. These figures speak of a large majority of households in the car market. As for households that opted not to own a car, their absence from the market may be due, at least partly, to their knowledge of the costs.

    Chart 1 Source: Oak Ridge National Laboratory; Transportation Energy Data Book. Table 8.5.

    If knowledge is not at issue, the question becomes whether households manage their expenses on this item prudently, or if they could use expert advice to do so.

    Advice on how to manage household transportation expenses is, evidently, also unnecessary. Statistics on household expenditures leave little doubt that households manage their transportation budgets surprisingly well. Consumer surveys show that among all income quintiles, with total household expenditures ranging from about $31,000 to five times that ($155,000), the percentage allocated to transportation is fairly constant – around 15% (Chart 2). The only exception is found among the highest quintile, which may simply be indicative of higher disposable incomes. (We hope readers will be lenient about our use of statistics from multiple countries. The intent is to show trends, rather than report on the specifics of a chosen country.)

    Not only is the mid-teen figure constant across different income groups, it is also constant across countries. The European Union, for example, reports 13.0% and 13.2% all across the EU (excluding its newest members). It is hard to interpret this consistency as anything other than an ability to control transportation costs in a way that meets a household’s needs and budget, particularly when seen in juxtaposition to the expenditure on shelter.

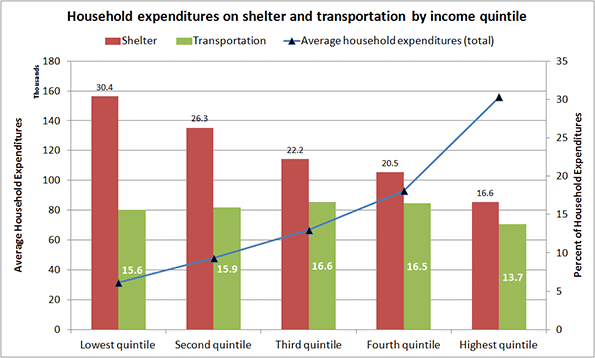
    Chart 2 Source: Statistics Canada, Survey of Household Spending. Table 2: Budget Shares Of Major Spending Categories By Income Quintile, 2012.

    This consistency of the transportation expense at all income levels is intriguing and instructive.Researchers have suggested that it represents a universal constant. Regardless of its universality, it indicates the adaptability people demonstrate in controlling this expense. This adaptability ranges from choosing the means of transport (foot, bike, transit, car or rail), their level of effort, the time they are willing to spend traveling, and their flexibility in reaching destinations.

    For example, public transport lowers costs, but is generally slower than a car (Chart 3). In 2005, 21% of drivers recorded a 90+ minute round trip as opposed to three times that (64%) reported by transit riders. As might be expected, public transport users are predominantly lower quintile households that trade cost for time (Chart 4).

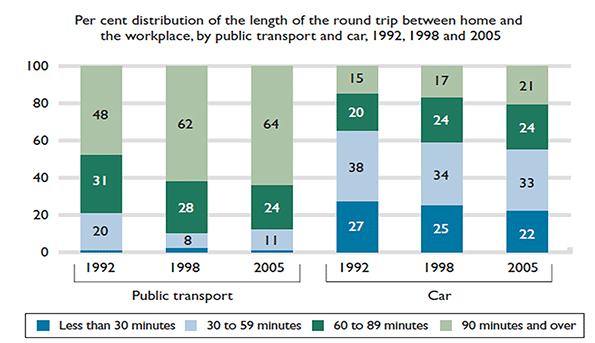
    Chart 3 Source: Statistics Canada, General Social Survey, Trip Duration, 1992, 1998, and 2005.

    Choosing the mode of transport is one path to controlling costs, and certain households are clearly doing so. As the chart below shows, about 75% of bus riders (adding the first three bars) earn up to $50,000 a year, a lower-rank quintile income. Riding the bus is a conscious choice, as percentages of riders of other income brackets suggest, but for the 75% it may also be an economic necessity.

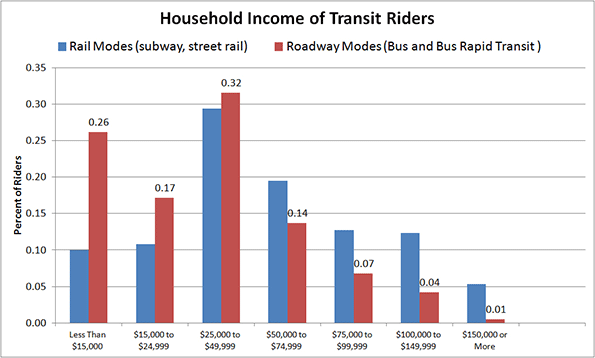
    Chart 4 Source: American Public Transportation Association, A Profile of Public Transportation Passenger Demographics and Travel Characteristics, 2007.

    Other options in controlling transportation costs include walking and bicycling where possible, accessing the second-hand car market, and choosing other motorized transport.

    One good example of ‘other’ motorized transport is motor scooter ownership in developing nations, and in certain industrialized countries. In Taiwan, for example, “….Scooter is the primary mode of transport on this densely populated island – there are about 15 million for 23 million citizens.” Such wide-spread dependence on scooter-based motorized mobility correlates well with its cost and the per capita GDP of its users. Italy, for example, tops the EU in scooter/motorbike ownership. It may not be pure coincidence that it also has one of the lowest GDPs per capita among EU nations.

    The resale market for cars in the US outstrips the new car market by about one to three (Chart 5). Not only is the market large but also, significantly the average cost of a pre-owned car is generally about half its original price.

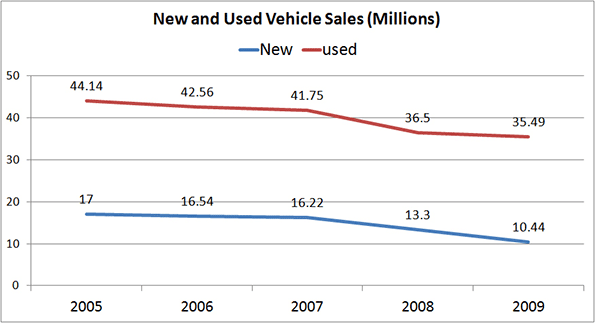
    Chart 5 Source: NIADA’s Used Car Sales Industry Report; Relative Size of Car Markets for New and Used Cars, 2010.

    The size of the resale market demonstrates yet another means by which consumers—particularly the lower quintile households— seek and grasp the opportunity to control car-related costs. As is evident from Chart 6, three of the five quintiles limit their new car purchases extensively; an overwhelming majority of consumers (averaging 77%) buy used cars. That figure reaches about 81% among the lowest quintile households.

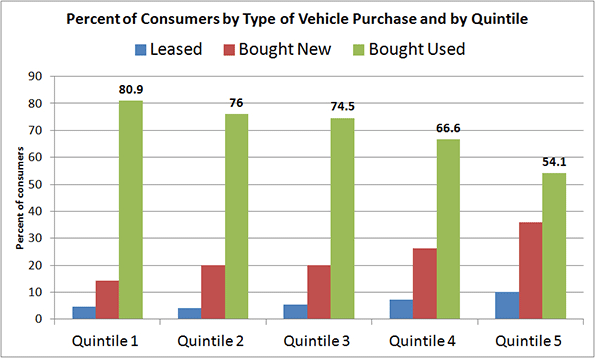
    Chart 6 Source: Laura Paszkiewicz, The Cost and Demographics of Vehicle Acquisition, Consumer Expenditure Survey Anthology, 2003 (61) Division of Consumer Expenditure Surveys, US Bureau of Labor Statistics.

    Not only does the resale market allow for control of a buyer’s initial investment, but segments within the market further enhance that ability. As Chart 7 shows, the price differential between a private sale and that from a franchised dealer can range from double to triple.

    Chart 7 Source: The Used Vehicle Market in Canada, DesRosiers Automotive Consultants Inc., 2000.

    The twentieth century saw momentous change and variety in the means of transport, both personal and collective. All new entries except bicycles are motorized, and were unimaginable a mere century earlier. The previous means of transportation — horse-dependent — lasted for at least forty centuries, during which collective transport was non-existent. Motorized personal transport is just one instance in a trend of displacing muscle-dependent activities with motor-driven ones (such as climbing stairs being supplanted by using elevators). The change has been astonishing, unusually fast, and, judging by the plethora of articles on the topic, a cause for concern to some.

    Statistics and examples so far allow us to draw at least one indisputable conclusion: Households do know their transportation costs, and adjust their expenditures according to their needs and budget by taking advantage of available opportunities. It would appear that there is little need for guidance on either front.

    Fanis Grammenos heads Urban Pattern Associates (UPA), a planning consultancy. UPA researches and promotes sustainable planning practices including the implementation of the Fused Grid, a new urban network model. He is a regular columnist for the Canadian Home Builder magazine, and author of Remaking the City Street Grid: A model for urban and suburban development. Reach him at fanis.grammenos at gmail.com.

    After twenty-four years at Canada Mortgage and Housing Corporation, Tom Kerwin now leads an active volunteer life, including being the Science and Environment Coordinator for the Calgary Association of Lifelong Learners. He holds a Master’s degree in Environmental Studies from York University.

    Special thanks to Luis Rodriguez for collaborating in shaping this article.

    Flickr photo by promich: Car Town, a used car lot in Chicago.

  • Traffic Congestion: The Latest Urban Mobility Report Ratings

    In recent years there has been a proliferation of traffic congestion rating reports. Tom Tom and Inrix are now making it possible to compare traffic congestion in Louisville or even Lexington to Moscow or Paris. The Castrol Magnatic Start-Stop Index adds places like Jakarta and Bangkok. But the granddaddy of them all is the Texas A&M Transportation Institute Urban Mobility Report, which has just been released with 2014 data.

    Los Angeles

    Los Angeles remains the most congested major urban area in the nation with an average 43 percent added to travel times during peak hours. This article discusses the largest urban areas in the 53 US metropolitan areas with more than 1 million population.

    Los Angeles is long been the champion of traffic congestion in the United States. Since Texas A&M began publishing a traffic congestion scorecard in 1982, Los Angeles has usually had the worst traffic congestion, though Houston was reported to have the worst congestion for a few years in the mid-1980s.

    It should not be surprising that Los Angeles has the worst traffic congestion. Los Angeles is the nation’s most densely populated larger urban area, with 7000 residents per square mile. This high density means that the demand for both car and truck travel is higher than it would be in a lower density city. The Los Angeles freeway system is extensive and its roadways tend to be very wide. Part of the problem is that much of the planned freeway system was not built, such as the Slauson Freeway, the Reseda Freeway, the Topanga Canyon Freeway, the Laurel Canyon Freeway, the Beverly Hills Freeway and the missing link northern extension of the Long Beach Freeway through South Pasadena. None of these freeway cancellations drove people to transit, as some might suggest, as traffic volumes just continued to increase. Despite billions that were spent on rail and busway systems, Southern California’s largest transit system continues to draw fewer riders than when there were only buses in 1985.

    Congested in Other Urban Areas

    The top 10 congested urban areas include two that share commuting sheds with larger urban areas. These are third-ranked San Jose and 10th ranked Riverside-San Bernardino, which can blame part of their traffic congestion on their larger neighbors, Los Angeles and San Francisco (Figure 1).

    San Francisco is the second most congested urban area in the nation. The three most congested urban areas are also the three densest urban areas, Los Angeles, San Francisco and San Jose. Seattle ranks fourth and Portland ranks fifth, despite their much lower densities. Seattle’s intense traffic congestion is understandable, given its long, narrow geographical shape and the fact that there are only two north to south freeway routes through the urban area. Moreover, things are likely to get worse, as Seattle seeks to implement urban containment (densification) policies that are likely to worsen traffic congestion (Greater  traffic congestion is associated with higher densities).

    Portland has obtained the worldwide praise of urban planners who like its densification and anti-automobile policies. Portland, however is paying the price for that with traffic congestion 80 percent as bad as Los Angeles, even with a population density barely half that of Los Angeles.

    Austin may also be surprising, because it has a relatively small population (about 2 million) compared to most of the 10 worst congested urban areas. Austin was not large enough to justify more than a single route when the interstate system was designed in the 1950s and was very slow to develop its freeway system. At the same time, in recent years Austin has been the fastest-growing major metropolitan area in the United States, which has also added to traffic pressures.

    The least traffic congestion is in Richmond, which has also been estimated to have the best composite traffic congestion among international scorecards. Most of the least congested urban areas have metropolitan population between 1 million and 2 million residents and are located in the East, South or Midwest (Figure 2).

    Wasted Fuel

    Driving in congested traffic reduces fuel economy and results in wasted fuel (each gallon of gasoline consumed produces the same amount in greenhouse gas emissions). New York and Washington have the largest amount of wasted fuel per commuter, followed by San Francisco, Boston and Portland (Figure 3). The least wasted fuel per peak period commuter is in San Diego, Raleigh, Richmond, Jacksonville and Birmingham (Figure 4).

    Changes Since 1982

    There have been major changes in traffic congestion indexes among the 53 urban areas since 1982. San Jose has experienced the worst percentage point increase in excess travel time, adding 27 percentage points to its excess peak period travel time. Riverside-San Bernardino, Austin, Portland and New Orleans round out the five urban areas with the greatest increases in traffic congestion (Figure 5). With less growth in recent decades, however, traffic congestion has not increased enough to place in the worst ten in trend.

    The urban areas best at controlling their traffic congestion include some surprises. Dallas-Fort Worth has been one of the three fastest growing metropolitan areas in the high income world over the period, but has managed to keep up with its traffic congestion as well as any other urban area (Figure 6).

    Similarly, Phoenix has been very rapidly growing and has tied Dallas-Fort Worth for first place in best traffic congestion trend. Phoenix undertook a substantial Freeway building program in the 1980s. Detroit also ties Dallas-Fort Worth and Phoenix, though this reflects its long term economic difficulties and shows that better traffic congestion that results from less growth and job creation is not a positive. Five urban areas tied for fourth best traffic congestion trend, Richmond, Tampa St. Petersburg, St. Louis, Indianapolis and Houston. Like Dallas-Fort Worth, Houston was among the three fastest growing metropolitan areas of more than 5 million people over the period. Like Phoenix, Houston began a major freeway and arterial street improvement program in the late 1980s (perhaps partially in response to the publicity about having the worst congestion).

    Four Other Cities

    Four urban areas rank in the worst ten in each of the categories of traffic congestion, wasted fuel and congestion trend. San Jose abuts San Francisco which has the second worst congestion in the nation. Among the four, Portland is the most consistent, ranking 5th worst in traffic congestion, tied for 5th worst in wasted fuel and ranked fourth worst in congestion trend. Portland also seems the most out of place, being smaller and not having a more congested, larger urban area abutting it. New York is not a surprise, being the nation’s largest urban area, and having many bridges and tunnels, which concentrates traffic. Seattle has long been one of the most congested urban areas and also has geographical challenges, with a number of water crossings, as well as its limited north-south freeway capacity.

    The Texas A&M Annual Mobility Report pioneered the way for important urban competitiveness information that allows comparisons by public official and companies that were not possible before. The latest edition advances that purpose.

    Wendell Cox is Chair, Housing Affordability and Municipal Policy for the Frontier Centre for Public Policy (Canada), is a Senior Fellow of the Center for Opportunity Urbanism (US), a member of the Board of Advisors of the Center for Demographics and Policy at Chapman University (California) and principal of Demographia, an international public policy and demographics firm.

    He is co-author of the "Demographia International Housing Affordability Survey" and author of "Demographia World Urban Areas" and "War on the Dream: How Anti-Sprawl Policy Threatens the Quality of Life." He was appointed to three terms on the Los Angeles County Transportation Commission, where he served with the leading city and county leadership as the only non-elected member. He served as a visiting professor at the Conservatoire National des Arts et Metiers, a national university in Paris.

    Top Image: Los Angeles Traffic Congestion: AM Peak, September 2, 2015 From: Google Traffic