Tag: Transportation

  • New Zealand Has Worst Traffic: International Data

    Three decades ago, the Texas Transportation Institute (TTI) at Texas A&M University began a ground-breaking project to quantify traffic congestion levels in the larger urban areas of the United States. The Urban Mobility Report project was begun under Tim Lomax and David Shrank, who have led the project over the first 30 annual editions. Perhaps the most important contribution of this work to the state of transportation knowledge is TTI’s "travel time index," which measures the extent to which peak period traffic congestion as to travel times.

    Of Highway Expansion and Maternity Wards

    The TTI data has been invaluable. One important contribution has exposed a fallacious interpretation of the “induced traffic” effect, which holds that there is no point in expanding roadways because they will only be filled up by new traffic. As if more maternity wards would increase the birth rate, the argument goes that we “can’t build our way out of congestion.” In fact the TTI data, which measures at the comprehensive urban area level (and the only reliable level), says we can.

    I recall a 1980s City Hall meeting with a Portland Commissioner, who admiringly cited Phoenix for not having built a Los Angeles style freeway system. I remarked that if there was anything worse than Los Angeles with its freeways, it would be Los Angeles without its freeways. Then, Phoenix was the 35th largest urban area in the nation, yet had the 10th worst traffic congestion. The situation soon was improved, after Phoenix voters authorized funding for the largest recent freeway expansion program and now Phoenix ranks 37th in traffic congestion, despite having more than doubled in population (now the 12th largest urban area).

    The lesson repeated itself in traffic clogged Houston, which led Los Angeles in traffic congestion in three of the first four years of the Annual Mobility Report. Under the leadership of visionary Mayor Robert Lanier, freeway and arterial expansions were built, and Houston dropped to rank 10th in traffic congestion despite having since added more residents than live in Portland. Meanwhile, Portland, with its densification and anti-automobile policies has been vaulted from the 47th worst traffic congestion in 1985 to 6th worst in 2012, which is notable for the an urban area ranking on only 23rd in population.

    Houston’s roadway expansions cleared the way for a Los Angeles run of 26 straight years as the nation’s most congested urban area, with little prospect of improvement.

    The Travel Time Index Goes International

    TTI’s traffic congestion ratings were adopted internationally. INRIX, a Seattle based automobile navigation services company was first, providing virtually the same measure for urban areas in North America and Western Europe. More recently, Tom Tom, an Amsterdam based automobile navigation services company issued its own Tom Tom Traffic Index, providing by far the most comprehensive international coverage, adding Australia, South Africa and New Zealand.

    Tom Tom has just produced its results for the second quarter of 2013. Looking globally, Los Angeles does not look so bad; it didn’t even make the top 10 most congested, outpaced (or perhaps better underpaced) by urban areas in Western Europe and Canada.  

    Higher Income World Urban Areas

    Tom Tom produced data for 122 urban areas in the higher income United States, Western Europe, Canada, Australia and New Zealand. This included nearly all urban areas with more than 1,000,000 population, and some smaller. It might be expected that the “sprawl” of US urban areas, and their virtual universality of automobile ownership, as well as the paucity of transit ridership in most metropolitan areas would set the US to to the nether world of worst traffic congestion. This is not so, and not by a long shot.  

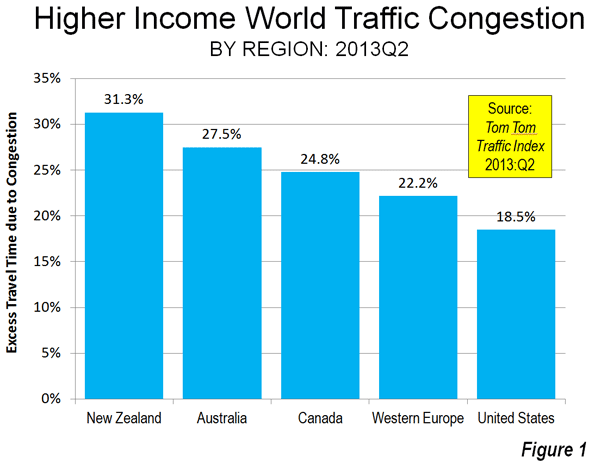
    1. New Zealand: The trophy goes to, of all places, New Zealand (Figure 1).  The average excess time spent in traffic in the three urban areas of New Zealand rated by Tom Tom was 31.3%. This means that the average trip that would take 30 minutes without congestion would take, on average, approximately 40 minutes in the three urban areas of New Zealand. This is stunning. New Zealand’s urban areas are very small. The largest, Auckland, has a population of approximately 1.3 million, which would rank it no higher than 25th in Western Europe, 35th in the United States and 4th in Canada and Australia. Christchurch and Wellington are among the smallest urban areas (less than 500,000 population) covered in the Tom Tom Traffic Index, but manage to rank among the 20 most congested (Figure 2). Christchurch and Wellington have little in freeway lengths.

    2. Australia: Second place is claimed by Australia. The average trip takes 27.5 percent longer in Australia because of traffic congestion. All five of Australia’s metropolitan areas with more than 1,000,000 population are among the 20 most congested urban areas in the higher income world. In the case of four urban areas (Sydney, Brisbane, Perth and Adelaide), every larger US urban area has less traffic congestion. Melbourne is the exception, but is still “punching well above its weight,” with worse traffic congestion than larger Chicago, Dallas-Fort Worth, Houston, Toronto, Philadelphia, Miami, Atlanta, Washington, Riverside-San Bernardino and Boston.

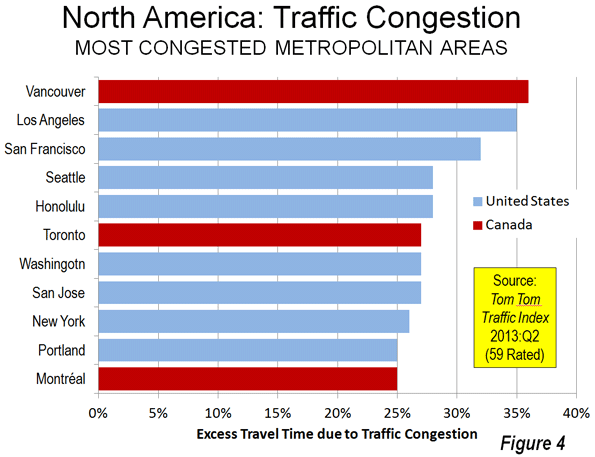
    3. Canada: Canada is the third most congested, with an excess travel time of 24.8 percent. Vancouver ranks as the third most congested urban area (36 percent excess travel time) in the higher income world, and has displaced Los Angeles as suffering the worst traffic congestion in North America. This is a notable accomplishment, since Los Angeles has more than five times the population, is more dense and only one-third as many of its commuters use transit to get to work. None of the other five largest urban areas in Canada (Toronto, Montréal, Ottawa, Edmonton and Calgary) is rated among the 20 most congested in the higher income world (Figure 3). Toronto is tied for 6th worst in North America with Washington (DC-VA-MD) and San Jose (Figure 4).

    4. Western Europe: Fourth position in the congestion sweepstakes is occupied by Western Europe, where the excess travel time averages 22.2 percent. Marseille (France) and Palermo (Italy) are tied with the worst traffic congestion in the higher income world, with excess travel times of 40 percent. Excluding Christchurch and Wellington, Marseille and Palermo are among the smallest urban areas among the most congested 20, though their large and dense historic cores complicate travel patterns. Rome, Paris, Stockholm and Rome, all with strong transit commute shares, are tied with Vancouver for the third worst traffic congestion (36 percent excess travel time). Other Western European entries to the most congested 20 rankings are London, Nice and Lyon in France and Stuttgart, Hamburg and Berlin in Germany. Western Europe contributes only 11 of its 54 rated urban areas to the most congested 20 list (the most 20 most congested list includes 24 urban areas because of a five way tie for 19th).

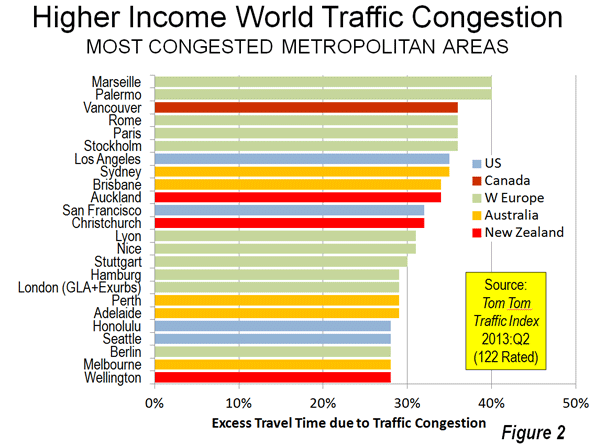
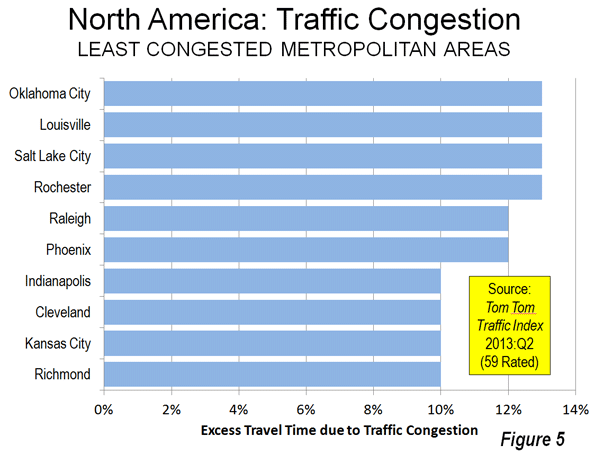
    Unlike New Zealand, Australia and Canada, Western Europe has representation in the 20 least congested urban areas (Figure 5), taking seven of the 22 positions (A three way tie at the top places increases the total to 22). The least congested urban area in Zaragoza in Spain (seven percent excess travel time), itself a small urban area of approximately 700,000, while similarly small Bern in Switzerland, Malaga in Spain and Malmo in Sweden are tied with four US urban areas in the second least congested position (10 percent excess travel time).

    5. United States: The United States is the least congested in these rankings with an excess travel time of 18.3 percent. Even after losing its top North American ranking to Vancouver, Los Angeles continues to be the most congested urban area in the United States, with an excess travel time of 35 percent. San Francisco (32 percent), Seattle, and much smaller Honolulu (tied at 28 percent) are also in the most congested 20. Only four of the 53 rated US urban areas is in the most congested 20.

    The US dominates the least congested 20 list, with 15 urban areas. Richmond, Kansas City, Cleveland and Indianapolis share the second least congested position with three Western European urban areas (10 percent excess travel time). Phoenix, which was formerly one of the most congested in the US, is also on the list, ranking as the 12th least congested in the higher income world and the 5th least congested urban area in North America.

    Less Traffic Congestion: Lower Densities and Less Employment Concentration

    The Tom Tom traffic congestion rankings are further indication of the association between higher population densities and more intense traffic congestion. But there is more to the story. Residents of the United States also benefit because employment is more dispersed, which tends to result in less urban core related traffic congestion. Lower density and employment dispersion are instrumental in the more modest traffic congestion of the United States, including such large urban areas as Dallas-Fort Worth (the fastest growing high income world metropolitan area with more than 5,000,000 population), Houston, Miami and even roadway deficient Atlanta.


    Wendell Cox is a Visiting Professor, Conservatoire National des Arts et Metiers, Paris and the author of “War on the Dream: How Anti-Sprawl Policy Threatens the Quality of Life.

    Photo: Freeway in Marseille (by author)

  • Bridges Boondoggle, Portland Edition

    A couple weeks ago I outlined how the Ohio River Bridges Project in Louisville had gone from tragedy to farce. Basically none of the traffic assumptions from the Environmental Impact Statements that got the project approved are true anymore. According to the investment grade toll study recently performed to set toll rates and sell bonds, total cross river traffic will be 78,000 cars (21.5%) less than projected in the original FEIS. What’s more, tolls badly distort the distribution of traffic that will come such that the I-65 downtown bridge, which is being doubled in capacity, will never carry just what the existing bridge carries right now anytime during the study period, and won’t exceed the design capacity even slightly until 2050. Meanwhile, the I-64 bridge that will remain free will grow in traffic by 55% by 2030, when it will be 34% over capacity.

    A nearly identical scenario is playing out in Portland with the $2.75 billion I-5 Columbia River Crossing. Joe Cortright of Impresa consulting unearthed the information through freedom of information requests looking into the investment grade toll study on that is being conducted for that bridge. You can see his report here (there’s also a summary available).

    I’ll highlight some of his truly eye-popping findings. Traffic forecasts are inflated, of course. The toll study is suggesting traffic increases of 1.1% to 1.2% per year when over the last decade traffic has actually declined by 0.2% per year on average even though there are no tolls. But it’s the addition of tolls that badly distort cross-river traffic and make a mockery out of the EIS. Here’s the money chart for the I-5 bridge itself:


    How is it possible that after building a gigantic multi-billion dollar bridge traffic declines? For the same reason as Louisville: tolling will cause huge amounts of traffic to divert to the I-205 free bridge. By 2016 traffic on I-205 would rise from 140,000 per day to 188,000 – and up to 210,000 by 2022 (full capacity).

    This is so eerily similar to the Louisville situation, that someone suggested, only half in jest I suspect, that they must be having “how to” training sessions on this stuff over at AASHTO HQ.

    Unlike Louisville, where a docile press is basically in cahoots with the state DOTs pushing the project, Portland’s media started asking questions. And one local paper even caught a civil engineering professor from Georgia serving on the independent review board for the project labeling the tolling scheme “stupid.” (Louisvillians take note).

    Oregon DOT director Matt Garrett released a letter in response in which he says, “This work is fundamentally different than the traffic analysis completed for the Final Environmental Impact Statement, and with very different goals in mind.” I agree. The FEIS was performed with the goal of getting this bridge the DOT wanted built approved. The toll study was designed to withstand financial scrutiny on Wall Street and be relied on in selling securities. I’ll let you be the judge of which is more likely to be closer to the truth. What’s more, Cortright addresses this very issue by saying in his report, “Neither federal highway regulations nor federal environmental regulations authorize or direct using multiple, conflicting forecasts for a single project, or using one set of traffic numbers for one purpose, and a different set for another.” I might also add that the DOTs in Louisville have not to the best of my knowledge made similar claims to explain away an identical discrepancy there. Nevertheless, the rest of Garrett’s letter acknowledges that I-5 will see a big traffic drop and there will be diversion from tolling. So he appears to just be doing the bureaucratic equivalent of “pay no attention to that man behind the curtain.”

    Again, want to know how it is that we spend so much money on transport infrastructure and get so little value? It’s because far too many of our highway dollars go into boondoggle mega-projects ginned up through political pressure (watch this space as I have another example coming soon) instead of into projects that make transportation sense. It may well be that there are legitimate problems with the existing I-5 river crossing, but these numbers give no confidence that the Oregon DOT has come up with a good or cost-effective plan for dealing with them. Unlike some, I do think we need to build more roads in America. Unfortunately our system is set up to ensure the survival of the unfittest instead of projects that make actual transportation and economic sense.

    Aaron M. Renn is an independent writer on urban affairs and the founder of Telestrian, a data analysis and mapping tool. He writes at The Urbanophile, where this piece originally appeared.

    Photo of current Columbia River crossing by Jonathan Caves.

  • Driving Alone Dominates 2007-2012 Commuting Trend

    New data from the American Community Survey makes it possible to review the trend in mode of access to employment in the United States over the past five years. This year, 2012, represents the fifth annual installment of complete American Community Survey data. This is also a significant period, because the 2007 was a year before the Lehman Brothers collapse that triggered the Great Financial crisis, while gasoline prices increased about a third between 2007 and 2012.

    National Trends

    The work trip access data is shown in Tables 1 and 2. Driving alone continued to dominate commuting, as it has since data was first reported in the 1960 census. In 2007, 76.1 percent of employment access was by driving alone, a figure that rose to 76.3 percent in 2012. Between 2007 and 2012, driving alone accounted for 94 percent of the employment access increase, capturing 1.55 million out of the additional 1.60 million daily one-way trips (Figure 1). The other 50,000 new transit commutes were the final result of increases in working at home, transit and bicycles, minus losses in car pooling and other modes.

    Carpools continued to their long decline, losing share in 43 of the 52 major metropolitan areas. Approximately 810,000 fewer people travel to work by carpools in 2012, which reduced its share from 10.7 percent to 9.7 percent.

    Transit did better, rising from 4.9 percent of work access in 2007 to 5.0 percent in 2012. There was an overall increase of approximately 250,000 transit riders. This increase, however, may be less than might have anticipated in view of the much higher gasoline prices and the imperative for commuters to save money in a more difficult economy.

    Bicycling also did well, rising from a 0.5 percent share in 2007 to a 0.6 percent share in 2012. Approximately 200,000 more people commuted by bicycle by 2012.

    Walking retained its 2.8 percent share, with only a modest 15,000 increase over the period. The largest increase in employment access outside single occupant driving was working at home, which rose from 4.1 percent to 4.4 percent. This translated into an increase of approximately 470,000.

    Metropolitan Area Highlights

    Among the 52 metropolitan areas with more than 1 million population (major metropolitan areas), 47 had drive alone market shares of 70 percent or more. Birmingham was the highest, at 85.6 percent. Surprisingly, this grouping included metropolitan areas with reputations for strong transit ridership, such as Chicago, Philadelphia, and Portland. Four metropolitan areas had drive alone shares of between 60 percent and 70 percent: Seattle, Washington, Boston, and San Francisco, which had the second lowest in the nation at 60.8 percent. As would be expected, New York had by far the lowest drive alone market share at 50.0 percent.

    Consistent with its low drive alone market share, New York led by a large margin the other metropolitan areas in its transit work trip market share. Transit carried 31.1 percent of New York commuters, up nearly a full percentage point from the 30.2 percent in 2007. New York alone accounted for nearly one-half of the growth in transit commuting over the period.

    San Francisco continued to hold onto second place, with a 15.1 percent transit market share, up a full percentage point from 2007. Washington rose to 14.0 percent, up from 13.2 percent in 2007. Boston (11.9 percent) and Chicago (11.0 percent) were the only other major metropolitan areas to achieve a transit work trip market share of more than 10 percent, and were little changed from 2007.

    Working at home continued to increase at a larger percentage rate than any other mode of work access. Four metropolitan areas were tied for the top position in 2012, at 6.4 percent. These included Raleigh, Austin, San Diego, and Portland, all metropolitan areas with a strong high-tech orientation. In San Diego and Portland, where large light rail systems have been developed, working at home is now more popular as a mode of access to work than transit.

    According to 2012 US Census Bureau estimates, the major metropolitan areas comprised 55.2 percent of the national population. These metropolitan areas represented a slightly larger share of total employment, at 57.3 percent. The combined major metropolitan areas also had similar shares to their national population share in each of the employment access modes, ranging from a low of 55.3 percent of communters driving alone to 59.9 percent of walkers. The one exception was transit, where the major metropolitan areas constituted nearly all of commuters, at 90.7 percent, well above their 55.2 percent share of US population (Table 1).

    Table 1
    Distribution of Employment Access (Commuting) by Employment Location: 2012
    SHARE OF WORK ACCESS BY MODE (2012)
      All Employment Drive Alone Car Pool Transit Bike Walk Other Work at Home
    MAJOR METROPOLITAN AREAS 57.3% 55.3% 55.4% 90.7% 59.9% 56.0% 55.6% 59.3%
    Metropolitan Areas with Legacy Cities 17.1% 13.8% 14.4% 65.4% 21.5% 27.8% 18.3% 17.1%
      6 Legacy Cities (see below) 6.0% 2.7% 4.1% 55.1% 12.7% 16.3% 7.8% 4.6%
      Suburban 11.1% 11.1% 10.3% 10.3% 8.8% 11.5% 10.5% 12.6%
      New York Metropolitan Area 6.4% 4.2% 4.5% 39.6% 5.8% 13.6% 8.5% 5.9%
        Legacy City: New York 3.1% 1.0% 1.5% 35.4% 4.2% 9.5% 4.2% 2.5%
        Suburban 3.3% 3.2% 3.0% 4.2% 1.7% 4.1% 4.3% 3.5%
      5 Other Metropolitan Areas with Legacy Cities 10.7% 9.6% 9.9% 25.8% 15.7% 14.2% 9.8% 11.2%
        5 Legacy Cities (CHI, PHI, SF, BOS, WDC) 2.9% 1.7% 2.6% 19.7% 8.5% 6.8% 3.6% 2.1%
        Suburban 7.8% 7.9% 7.3% 6.1% 7.1% 7.5% 6.2% 9.1%
    46 Other Major Metropolitan Areas 40.2% 41.5% 41.0% 25.3% 38.4% 28.2% 37.3% 42.2%
    OUTSIDE MAJOR METROPOLITAN AREAS 42.7% 44.7% 44.6% 9.3% 40.1% 44.0% 44.4% 40.7%
    United States 100% 100% 100% 100% 100% 100% 100% 100%
    Calculated from American Community Survey: 2012 (one year)

    Follow this link to a table containing data for the nation’s major metropolitan areas.

    Commuting Becomes More Concentrated in Legacy Cities

    This concentration of transit commuting was most evident to the six large "transit legacy cities," (the core cities of New York, Chicago, Philadelphia, San Francisco, Boston, and Washington), which still exhibit sufficient remnants of their pre-automobile urban cores that support extraordinarily high transit market shares. The transit legacy cities accounted for 55 percent of all transit commuting destinations in the United States, yet have only six percent of the nation’s jobs. Between 2007 and 2012, the concentration increased, with transit legacy cities accounting 68 percent of the additional transit commutes were between 2007 and 2012. Outside the legacy cities, there was relatively little difference in the share of transit commutes within metropolitan areas with legacy cities and in the other major metropolitan areas (Figure 2)

    The key to the intensive use of transit in the legacy cities is the small pockets of development that are particularly amenable to high transit market shares – the six largest downtown areas (central business districts) in the United States. Most of the commuting to transit legacy cities is to these downtown areas, Yet, the geographical areas of these downtowns is very small. Combined, the six downtown areas are only one-half larger than the land area of Chicago’s O’Hare International Airport. This yields employment per square mile densities of from 40 to 150 times densities of employee residences throughout their respective urban areas.  

    Not surprisingly, transit has very strong market shares to work locations in the transit legacy cities, at 45.8 percent. At the same time, transit commuting to locations outside the transit legacy cities is generally well below the national average. The exception is New York, where transit commuting to suburban locations is 6.4 percent, above the overall national average of 5.0 percent. In the five other metropolitan areas with transit legacy cities, transit commuting to suburban locations is 3.9 percent. This drops to 3.1 percent, overall, in the 46 other major metropolitan areas and 1.1 percent in the rest of the nation (Table 2 and Figure).

    Table 2
    Employment Access (Commuting) by Employment Location: 2012
      Drive Alone Car Pool Transit Bike Walk Other Work at Home
    MAJOR METROPOLITAN AREAS 73.6% 9.4% 7.9% 0.6% 2.8% 1.2% 4.5%
    Metropolitan Areas with Legacy Cities 61.7% 8.2% 19.2% 0.8% 4.6% 1.3% 4.4%
      6 Legacy Cities (see below) 33.9% 6.5% 45.8% 1.3% 7.6% 1.6% 3.3%
      Suburban 76.8% 9.1% 4.7% 0.5% 2.9% 1.1% 5.0%
      New York Metropolitan Area 50.0% 6.8% 31.1% 0.6% 6.0% 1.6% 4.1%
        Legacy City: New York 23.7% 4.6% 57.1% 0.8% 8.6% 1.6% 3.5%
        Suburban 74.8% 8.9% 6.4% 0.3% 3.5% 1.6% 4.6%
      5 Other Metropolitan Areas with Legacy Cities 68.6% 9.0% 12.1% 0.9% 3.7% 1.1% 4.6%
        5 Legacy Cities (CHI, PHI, SF, BOS, WDC) 44.8% 8.6% 33.7% 1.8% 6.5% 1.5% 3.1%
        Suburban 77.6% 9.1% 3.9% 0.6% 2.7% 1.0% 5.1%
    46 Other Major Metropolitan Areas 78.7% 9.9% 3.1% 0.6% 2.0% 1.1% 4.6%
    OUTSIDE MAJOR METROPOLITAN AREAS 79.9% 10.1% 1.1% 0.6% 2.9% 1.3% 4.2%
    United States 76.3% 9.7% 5.0% 0.6% 2.8% 1.2% 4.4%
    Transit legacy cities include the municipalities of New York, Chicago, Philadelphia, San Francisco, Boston & Washington

    Staying the Same

    The big news in the last five years of commuting data is that virtually nothing has changed. This is remarkable, given the greatest economic reversal in 75 years and continuing gasoline price increases that might have been expected to discourage driving alone. Yet, driving alone continues to increase, while the most cost effective mode of car pooling continued to suffer huge losses, while working at home continued to increase strongly.

    Wendell Cox is a Visiting Professor, Conservatoire National des Arts et Metiers, Paris and the author of “War on the Dream: How Anti-Sprawl Policy Threatens the Quality of Life.

    Photograph: DART light rail train in downtown Dallas (by author)

  • Thinking Outside the Rails on Transit

    To many in the transit business – that is, people who seek to profit from the development and growth of buses, trains and streetcars – Southern California is often seen as a paradise lost, a former bastion of streetcar lines that crossed the region and sparked much of its early development. Today, billions are being spent to revive the region’s transit legacy.

    Like many old ideas that attract fashionable support, this idea, on its surface, is appealing. Yet, in reality, the focus on mass transit, however fashionable, represents part of an expensive, largely misguided and likely doomed attempt to re-engineer the region away from its long-established dispersed, multipolar and auto-dependent form.

    Traditional transit works best when a large number of commuters work in a central district easily accessible by trains or buses. New York and Washington, D.C., where up to 20 percent of the regional workforces labor downtown (the central business district), are ideal for transit. Even in those metropolitan areas, however, the auto is king.

    In contrast, less than 3 percent of Southern Californians work in downtown Los Angeles. Overall, despite all the money sunk into new rail lines around the country, Americans’ transit commuting is overwhelmingly concentrated in a few older “legacy” cities. Altogether, 55 percent of transit work trips are to six core cities: New York, Chicago, Philadelphia, San Francisco, Boston and Washington, and 60 percent of those commutes are to downtown.

    In contrast, in the Los Angeles-Orange County region, barely 6 percent of workers take transit, one-fifth the rate in New York. Yet we’re a bunch of committed strap-hangers compared with Phoenix, Atlanta, Charlotte, N.C., and Dallas-Fort Worth, where, despite surfeits of new trains and streetcars, 2 percent or less of commuters use public transit. Even in Portland, Ore., widely proclaimed the exemplar of new urbanism and transit investment, the percentage of commuters taking transit is less today than in 1980. Portland is now contemplating cutbacks that could eventually eliminate up to 70 percent of its transit service.

    Imposing Past on Future

    This miserable record reflects how trains, a largely 19th century technology, have limited utility in a contemporary setting. Indeed, the only way to make it work, planners insist, is if the population is moved from their low-density neighborhoods to high-density “pack and stack” areas near transit stops, while suburban businesses are dragooned to denser downtown locations. This is the essence of the recently approved Bay Area Plan.

    Although these kinds of strategies have never materially reduced automobile use – the Bay Area Plan itself says automobile use will still increase by 18 percent over 30 years – the bureaucratic logic here is almost Stalinesque in the scope of its social-engineering ambitions. As Bay Area journalist and plan advocate John Wildermuth puts it, people know they should take transit but don’t because it’s very inconvenient. But by forcing three quarters of new residents into dense housing, some with no parking, he reasons, it then will be “easier for them to either give up their cars or, at least, use them a lot less.”

    Yet getting people to change their way of life, as many central planners have discovered, is not as easy as it seems. The highly dispersed San Jose-Silicon Valley area, the economic epicenter of the Bay Area and worldwide information technology, has a commute trip market share barely a third of major metropolitan area average… . Building “one of the longest” light rail systems in the United States in 50 years has barely moved the percentage of transit commuters over the past three decades.

    What the Bay Area Plan will probably accomplish is to boost housing prices ever further out of reach, both in urban areas and in the suburbs. With new single-family development effectively all but banned, prices of homes in the Bay Area already are again rising far faster than the national average and now are approaching two and half times higher, based on income, than in competitor regions such as Salt Lake City, Phoenix, Dallas-Fort Worth, Austin, Tex., Houston or Raleigh, N.C.

    Environmental Imperative?

    Greens and their allies in the high-density housing lobby long have suggested that “peak oil” and rising prices will inevitably drive suburbanites out their cars. But, clearly, recent advances in U.S. oil and natural gas production may have already made this moot. Transit activists increasingly have focused on climate change to justify massive spending on expanding transit and forcing recalcitrant suburbanites from their cars.

    This logic is largely based on the notion that suburbanites must travel greater distances to work. Yet, a study by McKinsey & Co. and the Conference Board found that – largely because of the impact of higher energy standards for cars forecast by the Department of Energy – sufficient greenhouse gas emission reductions can be achieved without reducing driving or necessitate “a shift to denser urban housing.”

    The fundamental limitations of transit in dispersed cities further weakens environmentalists’ claim. Ridership on some transit systems is so sparse that cars are more energy efficient. Then, there’s the oft-mistaken assumption that higher-density housing will reduce congestion and travel. But in multipolar areas like Southern California, traffic congestion and resultant pollution generally becomes worse with higher density.

    There may be other, more technologically savvy ways to reduce emissions and energy use. People have cut automobile use the past three years but their reduced travel is not showing up so much in transit usage, but, rather, is driven by other factors such as unemployment and the high price of gasoline.

    But, arguably the biggest reduction can be traced to the rise of telecommuting. Over the past decade, the country added some 1.7 million telecommuters, almost twice the much-ballyhooed increase of 900,000 transit riders. In Southern California, the number of home-based workers grew 35 percent, three times the increase for transit usage. By 2020, according to projections from demographer Wendell Cox, telecommuting should pass transit, both nationally and in this region, in total numbers.

    What About the Poor?

    Perhaps the most compelling argument for transit stems from serving those populations – the poor, students, minorities – who often lack access to a private car. Yet, for workers in newer cities, public transit often is not an effective alternative. Brookings Institution research indicates that less than 5 percent of the jobs in the Los Angeles and Riverside-San Bernardino areas are within reach of the average employee within 45 minutes, using transit. The figure is less than 10 percent in the San Jose metropolitan area, the same percentage as for cities nationwide. Moreover, 36 percent of entry-level jobs are completely inaccessible by public transit.

    Not surprisingly, roughly three in four poorer workers use cars to get to work. Recent work by University of Southern California researcher Jeff Khau finds that car ownership is positively correlated with job opportunities; no such relationship can be proven with access to transit.

    At the same time, we should look at more-flexible systems, notably, expanded bus and bus rapid transit, which work better in dispersed areas and are less costly. Most rail systems tend to cannibalize most of their riders from existing bus lines, which explains the small net increases in total transit ridership.

    Transit too expensive

    Costs matter, and will become more important as cities and counties face the looming threat of fiscal defaults. In this respect, rail systems essentially steal from other transit – notably, the buses used mostly by the poor – and from hard-pressed city and county general-fund budgets. Gov. Jerry Brown’s outrageously expensive high-speed rail, which will principally serve the affluent, takes this unfairness to an extreme.

    Instead, we should push far more cost-effective ways to provide transportation options, including those from the private sector, such as the successful Megabus, which provides efficient, quicker and far-less expensive transport between cities than either existing rail or short-haul airline flights. USC’s Khau suggests the private sector also could enhance solutions for lower-income commuters through car loans and car-sharing services such as ZipCar and and Lyft, a mobile app that links riders with drivers.

    As we attempt to figure out ways to improve both the environment and people’s economic prospects, innovative 21st century solutions – from telecommuting to car-sharing – may prove more effective than relying on the 19th century technology of rail. We should not blindly follow transit ideology but focus on how to improve people’s mobility in ways other than the overpriced, inefficient and often far-less-equitable solutions being bandied about today.

    Joel Kotkin is executive editor of NewGeography.com and Distinguished Presidential Fellow in Urban Futures at Chapman University, and a member of the editorial board of the Orange County Register. He is author of The City: A Global History and The Next Hundred Million: America in 2050. His most recent study, The Rise of Postfamilialism, has been widely discussed and distributed internationally. He lives in Los Angeles, CA.

    This piece originally appeared at The Orange County Register.

    Photo by biofriendly, Metro Bus Campaign, Los Angeles

  • History, Landscape, Beauty on the American Freeway

    Freeways, particularly urban freeways, have had a bad press for several decades now.  They are accused of despoiling scenery, destroying habitat and causing urban sprawl.  Many observers report with glee on the latest news of a small segment of urban freeway being dismantled.

    This blanket condemnation makes it easy to overlook the remarkable contribution that these freeways have made to the American economy and to American culture.  It is hard to imagine the growth in productivity in the country during the postwar years without these roads, which vastly increased the mobility of goods and people and connected parts of the country together in ways that were unprecedented.

    The constant criticism also makes it difficult to appreciate these roads as cultural artifacts and a wonderful way to see the country.  This is all the more surprising since Americans in recent years have been discovering the rich legacy of our nation’s highways. There has been spate of books that celebrate travel on America’s pre-freeway-era highways. Many authors wax eloquent over the remaining motels, fast food restaurants and drive in theatres along US 66 or advise motorists on finding abandoned segments of roadway by passed by later highway alignments.   There has also been a remarkable surge of interest in America’s parkways, from the earliest parkways like the Bronx River Parkway in Westchester County New York, started in 1907, to parkways at the end of the parkway era in the years immediately before and after World War II when they gradually became more like freeways, for example the Arroyo Seco Parkway in Los Angeles, or the later segments of Lake Shore Drive in Chicago, the Taconic Parkway in New York State or the George Washington Parkway outside Washington.   

    America’s postwar freeways merit a similar rediscovery.   I think that one of the biggest obstacles to appreciating them has been a question of scale.  Driving along a two-lane roadway it is possible to pull off the pavement and look at an historic courthouse or a particularly interesting agricultural landscape or early gasoline station. That is not possible on a freeway. It is also true that the engineers who designed the nation’s postwar freeways were probably less conscious of the aesthetic dimensions of the roadways than the designers of the German autobahn, who set a standard for integration of landscape and roadway  never surpassed, or American designers like landscape architect Gilmore Clarke who played important role in designing the parkways of metropolitan New York.   There is, moreover, no doubt that the push to accommodate increasing traffic loads and to make freeways safer in this country has led to a certain uniformity of standards that some people find boring.  Finally, the proliferation of sound walls over the last few decades all too often makes driving through urban areas like driving through a tunnel. 

    Still, there is no better way to get a good view of the larger features of the American landscape or cityscape than looking through the windshield of an automobile rolling along a freeway at 65 miles per hour. At that speed it is often easier than on a slower road to appreciate the changes that occur in plant species as the highway climbs a steep ridge or to appreciate the way massive cuts to lower the grades on the climb over a hill that provide a graphic illustration of the underlying geology.  It might be difficult for many people to appreciate long stretches of flat country but, if a driver can put herself into the proper frame of mind, this experience can have its own rewards because of the way it accentuates the scale of the landscape. Even the billboards, which many drivers consider simply objectionable intrusions into the natural landscape, can, by their style and content, illustrate a great many regional differences.

    And fortunately, there has been over the last two decades a growing recognition of the aesthetic dimensions of freeways.   In some ways this marks a reversion to ideas that were common in the parkway era when there was almost always a conscious attempt to integrate road and landscape into a successful composition reflecting  the landscape and culture of the region through which it passed. 

    A pioneer postwar example of this push to bring conscious aesthetic design to the freeway can be seen in I-280, the Junipero Serra freeway, which runs between San Francisco and San Jose.  Here the engineers worked with Lawrence Halprin, the landscape architect, and architect Mario Ciampi to create a road that was widely considered the “most beautiful freeway in the world” when the initial segment was opened in the 1960s.  This highway, with its careful alignment, minimizing cut and fill, and the bold, sculptural concrete overpasses does little to diminish the spectacular landscape of the San Francisco Peninsula.  In fact it affords a wonderful way to experience the golden hills on one side of the roadway and the coastal range on the other, often seen in the morning or late afternoon with fog pouring over the crest.

    In recent years the highway departments in an increasing number of American states have attempted to be more attuned to the aesthetic dimensions of freeways and of the places through which the roads run.   Wildflowers now bloom in medians and margins of a great many American freeways.   In arid landscapes engineers and landscape architects have worked to preserve native plants and use them as elements in a kind of idealized desert landscape in the median and along the berms.    In one of the most impressive achievements, a twelve mile stretch of I-70 passing through the tortuously narrow Glenwood Canyon west of Denver, opened in 1992, the designers went to great length to fit the roadway into the landscape in the least obtrusive way possible.  They accomplished this by splitting the roadway alignments, reducing the section of the roadway structure to a minimum, cantilevering both alignments from the canyon walls to reduce their bulk, pushing tunnels through the most difficult spurs of land and even treating the rocks that were scarred by excavation so they would not produce jarring juxtapositions.

    Even the urban freeway, target of the most vociferous criticism, offers interesting perspectives for those willing to look.  Unlike the case in much of Europe, where planners have often attempted to create a parkway-like driving experience by providing a wide buffer between the roadway and nearby urban areas and tightly restricting new development along the highways, American freeways have become the new main streets of many cities.  Driving along the ring roads around American’s large cities can offer some of the most compelling views of these metropolitan areas. For the motorist driving along I-80, the Ohio Turnpike, there is the view from the giant viaduct crossing the Cuyahoga River.  There, 20 miles to the north, up the heavily wooded deep gash created by the river, the gleaming tip of the Key Bank Building peaks out  above the intervening ridges in clear weather, unfortunately all too rare in Northeast Ohio.  Likewise, very few urban views can compare with the panorama that suddenly unfolds for motorists as, emerging from I-376’s Fort Pitt Tunnel under Mount Washington, they suddenly burst out onto a bridge over the Monongahela River and a view of the Golden Triangle and the entire skyline of Pittsburgh. 

    A drive along a city’s freeways is often the best way to get a good grasp of a region’s economic geography.   It would be hard to miss the contrast between the view from the Indiana Toll Road across the grimy industrial landscape of steel mills and refineries just east of Chicago, on the one hand, with the landscape of heavily planted berms and expensive new houses along the Tri-State Expressway in the north suburbs.

    Many of the earliest freeways have crossed the 50 year threshold and deserve a closer look as some of the country’s most important historical and cultural artifacts.  And they provide a wonderful way to observe America’s landscape and cityscape.


    Taconic State Parkway north of New York City.  The New York area had the first and largest set of parkways in the nation.  The Taconic, running along the Taconic Mountains from the Kensico Dam in Westchester County to Chatham near Albany, was not finished until 1960, but it maintains the earlier parkway standards rather than those of the later freeway era.   Because of its careful alignment and roadway design by landscape architect Gilmore Clarke and the beauty of the rugged countryside which it runs, it remains one of the country’s great driving experiences.


    I-280, Junipero Serra freeway, south of San Francisco.  Although a much wider highway than the prewar parkways, this road, constructed in the 1960s, maintains much of the feel of the earlier parkways though the use of alignments carefully fitted into the rolling hills, integrating the road beautifully into the spectacular landscape of the San Francisco peninsula.    


    I-20 east of Birmingham Alabama.  The undulating line that marks the edge of the pine forest and the beginning of the mowed grass in the freeway margins recalls the long curving vistas of English 18th century picturesque landscape tradition. On an overcast morning the resemblance to the British landscape tradition is particularly striking.


    I-10 and I-215 at Colton, California.   No place in the United States is so associated with freeways as the Los Angeles region, but actually this region has fewer lane miles of freeway than most large American metropolitan areas.  Because freeway construction pretty much stopped in the 1970s but the population continued to grow and the density rose, this region has some of the most congested roads in the country.  If there is any consolation, they offer some remarkable displays of engineering bravado and urban intensity.


    I-70 west of Denver, Colorado.  The construction of this roadway through the Glenwood Canyon in the Rockies is both an engineering feat and an aesthetic tour de force.  By separating the alignments and cantilevering the roadway from the canyon wall, the designers were able to minimize the visual impact of the road and provide spectacular vistas for travelers.

    US 75 approaching downtown Dallas.  This short piece of roadway completes a loop around downtown Dallas that allows two interstate roads to bypass downtown.  A drive around the loop provides a kaleidoscopic sequence of views of tall buildings and a highly effective orientation to downtown Dallas.


    I-10 east of Blythe Arizona.  Perhaps even more than in the East, the great distances of the American West make the freeway a lifeline for residents who live far from population centers.  The smooth roadway makes a striking contrast with the great rock outcrops and vast stretches of scrubland.


    I-80 and I-94 Pennsylvania Turnpike north of Pittsburgh.  The era of the parkway ended at about the time of the second world war as a new generation of freeways started to emerge.  One of the interesting features of the interstate system today is the way it provides testimony to the shifting ideals of roadway design.  Although large stretches of the Pennsylvania turnpike, whose initial segment opened in 1940, have been upgraded, the narrow right of ways and steep gradients of the older portions of the road as well as the streamlined design of the overpasses recall the transition from one age to the next.


    I-20 between Covington and Augusta Georgia.  A classic piece of interstate road with the smooth ribbon of pavement gliding effortlessly through a landscape of low hills and dense forest.


    I-10 west of downtown Phoenix.  The state of Arizona has been particularly active in trying to create an appropriate landscape for the state’s highways.   They have pioneered techniques for saving cacti and other native species in the path of the roadway and then re-installing them alongside the new roads to create an idealized desert landscape.


    I-10 approaching downtown Los Angeles, California.  The advent of sound walls has changed the driving experience in some profound ways.  In places it has severed the visual connection between the roadway and the city around it.  On the other hand, in some places, as here, when vines and other plants grow up over the walls and trees overtop them, the result is a curious but not entirely unpleasant sensation of floating through a city without being part of it.  Until the traffic backs up, of course.


    I-27 between Amarillo and Lubbock, Texas.  The long flat stretches of the Llano Estacado of northwest Texas produce an almost hypnotic effect.  Even highway signs and telephone poles take on a monumental character, and train elevators loom up in the distance like the skyline of a great city.


    I-70 in eastern Utah.   Although freeways can seem intrusive and over-scaled in the city, they are often dwarfed by the huge open spaces in states like Utah or Nevada.


    I-5 south of Longview, Washington.   A trip across the country on the interstate roadway system allows for a panoramic view of the regional differences between, for example, the flat, semi-tropical landscape of central Florida and the deep green evergreen forests of the Pacific Northwest.


    State route 99, the Alaskan Way Viaduct, downtown Seattle.   Completed in 1953, this roadway, this roadway like a number of freeways built in the heart of American cities, created a barrier in the city.  Some of these highways, for example the Central Artery in Boston have been relocated underground. In other cases, like the Embarcadero Freeway in San Francisco the replacement was a surface boulevard.  In this case, after a considerable debate, officials made the decision to create a massive tunnel.  It is difficult to argue that a road like this should be preserved, given its structural problems and the way it cuts off Seattle from its waterfront.  Still, it is almost inevitable that some of the drivers navigating the new tunnel will keenly miss the spectacular urban spectacle that unfolds today as they sweep along the viaduct.

    Robert Bruegmann is professor emeritus of Art history, Architecture and Urban Planning at the University of Illinois at Chicago.

  • Plan Bay Area: Telling People What to Do

    The San Francisco area’s recently adopted Plan Bay Area may set a new standard for urban planning excess. Plan Bay Area, which covers nearly all of the San Francisco, San Jose, Santa Rosa, Vallejo and Napa metropolitan areas, was recently adopted by the Metropolitan Transportation Commission (MTC) and the Association of Bay Area Governments (ABAG). This article summarizes the difficulties with Plan Bay Area, which are described more fully in my policy report prepared for the Pacific Research Institute (Evaluation of Plan Bay Area).

    Plan Bay Area would produce only modest greenhouse gas emissions reductions, while imposing substantial economic costs and intruding in an unprecedented manner into the lives of residents. The Plan would require more than three quarters of new residences and one third of net additional employment to be located in confined "priority development areas." These measures have been referred to as “pack and stack” by critics. The net effect would be to virtually ban development on the urban fringe, where the organic expansion of cities has occurred since the beginning of time.

    Irrational Planning

    Violating perhaps the most fundamental requirement of a rational plan, Plan Bay Area begins with a situation that no longer exists. Further, it is based on exaggeration, systematic disregard of official federal government projections and overly optimistic planning assumptions.

    Exaggerated Population Projection: The Plan assumes that the Bay Area will grow 55 percent more rapidly between 2010 and 2040 than official California state Department of Finance population projections indicate. These state-produced estimates have tended themselves to be on the high side (Figure 1). The planners scurried about to resolve these differences, but there is no indication that the state will be revising its projections. Plan Bay Area’s population projection would require growth in the Bay Area to increase by more than one-half from the 2000-2010 annual rate. The exaggeration of population growth has its uses: it leads to a higher greenhouse gas emissions projection for 2040, providing a rationale for stronger policy interventions.

    Ignoring Current Greenhouse Gas Emissions Projections: The Plan also ignores the new, more favorable DOE fuel economy projections (Figure 2). These projections were issued in December, well before the publication of the draft plan in April and the adoption of the final plan in July. Indeed, if the new DOE projections had been published the day before, Plan Bay Area should have been placed on hold and revised. In short, Plan Bay Area was out of date when adopted.

    Overly Optimistic Planning Assumptions: The Plan assumes that travel by light vehicle (automobiles, sport utility vehicles and pickups) would be reduced by substantial increases in transit ridership. Plan Bay Area presumes that expanding transit service 27 percent over the next 30 years will lead to a near doubling of transit ridership. This is stupefying, since over the last 30 years, transit ridership remained virtually the same, while service was expanded nearly twice as much as would be planned from 2010 to 2040.

    The plan also assumes that residents forced into the priority development areas will use transit and walking much more, materially reducing their use of light vehicles. This research behind this assumption is skewed toward transit oriented developments located on rail lines with good access to downtown. But nearly nine out of 10 employees in the Bay Area work outside the downtowns of San Francisco and Oakland, and that number is increasing (according to Plan Bay Area).

    Given recent history, it seems wishful thinking to believe that small transit service expansions and downtown oriented transit development can do much to attract drivers from cars. The modest gains greenhouse gas emissions reductions projected in Plan Bay Area are likely exaggerations.

    Plan Bay Area’s “pack and stack” densification is likely to produce even less than the modest substitution of transit and walking for driving (see The Transit-Density Disconnect). Traffic congestion, in this already highly congested area, is likely to be worsened, which could nullify part or all of the greenhouse gas emission reductions expected from reduced vehicle use.

    Correcting Plan Bay Area Forecasts

    Plan Bay Area would only modestly reduce light vehicle travel and greenhouse gas emissions. This is illustrated in Figure 3, which shows that the “pack and stack” strategies that would force most new residents and jobs into priority development areas, Plan Bay Area would reduce greenhouse gas emissions by 2 percent (“Plan Bay Area” line compared to the “Trend” or “doing nothing” line).

    By contrast, correcting the Plan Bay Area 2040 population estimates to reflect the state population projections would reduce greenhouse gas emissions more than eight times as much (17 percent), without the “pack and stack” strategies. A further correction of the Plan Bay Area 2040 estimates to reflect the latest DOE fuel economy projections, would reduce greenhouse gas emissions 22 percent, 11 times as much as the “pack and stack” strategies.

    Heavy Costs for Households and Businesses

    The Plan’s “pack and stack” strategies seem likely to exacerbate the Bay Area’s already high cost of living. Currently, the San Francisco and San Jose metropolitan areas have the worst housing affordability among the nation’s 52 metropolitan areas with more than 1 million residents. San Jose’s median house price relative to its median household income was 7.9 last year, according to the Demographia International Housing Affordability Survey. San Francisco’s median multiple was 7.8. This severely unaffordable housing results from recent decades of urban containment or smart growth policies, which have severely restricted the land on which development can occur. This drives up prices (other things being equal), consistent with economic principle. This has been made worse by house and apartment impact fees imposed on developers that are far above the national average.

    By comparison, in major metropolitan areas that have not implemented strong urban containment policies, the median multiple has typically been 3.0 or less since World War II, including the Bay Area before its adoption (Figure 4). The “pack and stack” strategies would largely limit new development to small parts of the Bay Area, an even more draconian prohibition than the long standing restrictions on urban fringe development. This further rationing of land could be expected to drive land prices even higher, making it even more difficult for households and businesses to live within their means.

    The problem is already acute. The new US Census Bureau housing cost adjusted data shows California to have the highest poverty rate among the states and the District of Columbia (metropolitan area data is not available). An early 2000s Public Policy Institute of California report showed Bay Area poverty to be nearly double the official rate, adjusted for the cost of living. Ultra pricey San Francisco had among the ten highest poverty rates – over twenty percent – of any urban county in the country.

    Unaffordable housing has also fueled an exodus to the San Joaquin Valley (Central Valley). Now more than 15 percent of the workers in the Stockton metropolitan area commute to the Bay Area, which led the Federal Office of Management and Budget adding Stockton to the San Jose-San Francisco combined metropolitan area (combined statistical area). In addition, the greater traffic congestion is likely to lengthen work trip travel times. This is likely to further increase emission while also burdening job creation and economic growth (see Traffic Congestion, Time and Money).

    Ignoring the Economy and Poverty

    Plan Bay Area effectively ignores these costs (despite rhetoric to the contrary), by failing to subject its strategies to a cost per ton metric. According to the United Nation’s Intergovernment Panel on Climate Change (IPCC), sufficient greenhouse gas emissions reductions can be achieved at a cost between a range of $20 to $50 per ton. The previous regional plan (through 2035) included such estimates. Only highway strategies achieved the IPCC range. Transit and land use strategies cost from four to more than 100 times the top of the IPCC range. Even those estimates did not include the prohibitively higher housing costs that result from urban containment policies. The cost metric is crucial, because spending more than necessary to reduce greenhouse gas emissions limits job creation and economic growth, which leads to reduced household affluence and greater poverty. This is the very opposite of the economic objectives of public policy. Virtually all political jurisdictions around the world seek greater prosperity for their residents and less poverty. A legitimate regional plan requires subjecting its strategies to economic metrics.

    Opposition

    There is opposition to Plan Bay Area. A citizen movement worked for rejection and has now filed suit claiming that the Plan violates the California Environmental Quality Act. The suit also alleges that MTC and ABAG used a questionable interpretation of state law and regulation to justify the irrational Plan outcomes.

    Recorded Votes

    Opponents were also successful in obtaining a rare recorded vote at ABAG. The governing board (General Assembly) is composed of selected elected officials from cities and counties who are not elected to their ABAG positions. ABAG adopts virtually all of its actions by consensus, rather by recorded votes, as occurs in many of the nation’s regional planning boards.

    Consensus decision making seem especially odd in California, where inability to obtain sufficient votes in the legislature for the state budget required a constitutional amendment. Neither do city councils and county commissions operate on a consensus basis on controversial issues.

    There is no shortage of controversial issues, at ABAG or other regional planning agencies. A good first reform would be for recorded votes to be the rule, rather than the exception. Consensus decision making may be appropriate for clubs, but it is not for representative bodies in a democracy.

    Impeding the Quality of Life

    Plan Bay Area was outdated when approved and reflects a world that no longer exists. Drafters have insisted on extravagantly expensive and intrusive policies that produce only minimal greenhouse gas reductions, and at great cost, using, among other things, unreasonably bloated population forecasts to bolster their approach. Unless changed, the Plan will likely be more successful in driving up housing prices, limiting options for households, and further congesting traffic than meeting its stated goal of reducing   greenhouse gas emissions.

    Wendell Cox is a Visiting Professor, Conservatoire National des Arts et Metiers, Paris and the author of “War on the Dream: How Anti-Sprawl Policy Threatens the Quality of Life.

    Photo: San Francisco (by author)

  • Mobility for the Poor: Car-Sharing, Car Loans, and the Limits of Public Transit

    Public transit systems intend to enhance local economies by linking people to their occupations. This presents problems for many  low-income families  dependent on transit for commuting. With rising prices at the gas pump, much hope has been placed on an influx of investment into public transit to help low-income households. But does public transit really help the poor? While the effect of transit access on job attainment is murky, several alternatives such as car loans and car-sharing programs have seen real results in closing the income gap. For Christina Hubbert, emancipation from public transit has been a change for the better. NBC News reports:

    A car means Hubbert no longer spends two hours each way to and from work in suburban Atlanta. It means spending more time with her 3-year-old daughter — and no longer having to wake her up at 5 every morning so she can be in the office by 8. It also means saving hundreds of dollars each week in day care late fees she incurred when she couldn’t get to the center before its 6:30 p.m. closing time.

    Research finds that car-ownership is positively correlated with job opportunities while no such relationship exists with access to transit stations. Furthermore, increased transit mobility has been proven to have no effect on employment outcomes for welfare recipients. The notion that newer and nearer public transit creates benefits for all is inaccurate; it only creates opportunities for those who live near the transit stations, and those opportunities are limited. A study by the Brookings Institute finds that, among the ten leading metropolitan areas in the US, less than 10% of jobs in a metropolitan area are within 45 minutes of travel by transit modes. Moreover, 36% of the entry-level jobs are completely inaccessible by public transit. This is not surprising given the fact that suburbia houses two-thirds of all new jobs.

    The mismatch between people and jobs can be reconciled in two ways: car loans and car-sharing services. Basic car-sharing involves several people using the same car or a fleet of cars, as with the ZipCar. The concept has branched out to on-demand car sharing services, such as Lyft, mobile apps which link riders with drivers.

    Car loans on the other hand have been around for a while and offer affordable financing for a car without a required down payment. Ways to Work, one of the largest loan providers in the U.S., includes courses on personal finance and credit counseling. By making vehicle travel more attractive, these two disruptive innovations threaten the expansion of public transit – and its powerful associated lobbies – in three ways:

    1. It’s more cost-efficient and time-efficient.

    To improve the way we move people, transit developments must save both time and money. Sadly, transit lines are notorious for their extraordinary costs and long delays. Data from the 2010 Census reveals that people living in central cities with a higher proportion of transit riders experience longer commutes. And since transit riders have more cumbersome commutes, they are much more likely to be tardy or absent from work.

    The hefty price tag of transit projects also triggers concern. For example, the cost per new passenger of the Washington Metro line to Dulles Airport was estimated at $15,000 annually. That’s about the same as the current poverty threshold for a household of two.

    Car-loan programs on the other hand are largely cost-efficient, producing real fiscal benefits to borrowers, employers, and taxpayers. A survey of 4,771 borrowers and their employers finds that borrowers have greater job security as a result of access to vehicles. With access to credit, borrowers increase their purchasing power by an average of $2,900 each year and save about $250 by avoiding payday loans and checks-for-cash outlets. Employers gain as well through cost savings due to increase retention and reduced absenteeism and tardiness, which amount to $817 and $1130 per borrower respectively. In large part, providing vehicle financing is a smart investment since it reduces the number of low-income families on social welfare – an annual cost savings of $2,900 for each borrower coming off public assistance.

    Given its clear advantages, car sharing is increasing. Recent reports find that shared-use vehicle organizations have been lucrative. Between August 2012 and July 2013, car-sharing ridership grew by 112 percent and the number of vehicles increased by 52 percent. And although car-sharing is not typically used to transport the poor, having on-demand car service makes it so that door-to-door access is more available and affordable. If car-sharing continues to grow at its current rate, it’s reasonable then to assume that these pseudo-taxi services will be eventually be affordable enough so that people would choose to be chauffeured rather than drive their own vehicles.

    2. Vehicle ownership provides greater access to jobs and economic opportunities.

    Instead of being limited to a few areas that are transit-oriented, families with cars have access to more jobs and economic opportunities. Public transit lines are limited in their geographical coverage and take time to make often numerous stops.  Transfers are inefficient and time-consuming, making much of that coverage impractical. Also regular transit riders have limited employment options since they’re only able to consider jobs in the vicinity of transit stops and stations.

    3. Travel by car  is responsive to current travel patterns

  • A common misperception is that low-income people do not have cars. In reality, 86% of the poor have cars, compared to 95% of the entire population. The high percentage of poor families with cars reveals how automobile culture has become fixed into American ideals of economic well-being and prosperity. And contrary to stereotypes, the poor and the rich similarly spend about 94% of their transportation costs on vehicle travel versus public transit, challenging the notion that low-income travel behavior is unlike that of the rest of the population. As such, providing the poor with cars dramatically levels the playing field as they are the ones who would gain the most from increased access to employment destinations and education facilities.

    A strong argument posited by public transit advocates is that as more cars use the road, congestion and pollution will intensify. And to be sure, public transit is more environmentally friendly than motor vehicles. The Amalgamated Transit Union (ATU), the largest union representing transit workers in North America, reports that one full bus eases the road of thirty-five cars, and that existing transit usage cuts national gasoline consumption by 1.4 billion gallons annually. Yet, on average, this result can only   be achieved if buses were always full, which they are not – authorities from the Los Angeles Metro estimate that their buses run at an average of 42% capacity.

    But is it equitable to ask the poor to forgo mobility and economic gain for the environment? Considering that most Americans experience some degree of social mobility via vehicle ownership, it’s far more reasonable to allow  low-income families greater access to opportunity. In addition, new fuel efficiency standards for cars set by the Obama administration will decrease overall GHG emissions substantially; according to forecasts by the Department of Energy, carbon emissions from light-duty vehicles will drop 21% between 2010 and 2040 in spite of a 40% increase in driving. This shows that, even with more cars on the road, environmental goals can be accomplished.

    Although the eligibility requirements are stricter in some areas than others, every state in the U.S. has a program for low-income residents to have access to car loans. Car-sharing is also rapidly expanding, but  marketing now is geared towards millennials on a budget rather than low-income families. Both innovations, however, respond to new demands faced by future workers, who are likely to find employment in dispersed locations and may make more trips per workday since many may have multiple part-time jobs. With more efficient ways of getting people to work, it’s time to challenge the assumption that the expansion of public transit is the best way to meet the needs of America’s hard-pressed working class.

    Jeff Khau graduated from Chapman University with a degree in business entrepreneurship. Currently, he resides in Los Angeles where he is pursuing his dual-masters in urban planning and public policy at the University of Southern California.

    Photo by Romana Klee, #113 zipcar.

  • Portland’s Transit Halcyon Days?

    For more than a quarter century, the leaders in the Oregon portion of the Portland metropolitan area have sought to transfer demand for urban travel from automobiles to transit. Six rail lines have been built, five of which are light rail and bus service has been expanded. If their vision were legitimate, transit’s market share should have risen substantially and automobile travel should have declined. Neither happened.

    The results have been modest, to say the least. Since 1980, before the first rail line was opened, transit’s share of work trip travel in the metropolitan area has declined by one-quarter, from 8.4 percent to 6.3 percent. Overall, the share of travel by car remains about the same as before the first light rail line opened (based upon data from the Texas Transportation Institute and the Federal Transit Administration).

    Transit access to destinations outside downtown Portland remains scant. Despite the huge expenditures on transit, only 8 percent of the jobs in the metropolitan area can be reached by the average employee in 45 minutes, despite the fact that nearly 85 percent of workers are within walking distance of the transit stops or stations. Portland’s transit access is better than the national major metropolitan average of six percent. But Portland trails a number of other metropolitan areas and is well behind the best, Milwaukee, Wisconsin, which has a transit access figure of only 14 percent. This makes a mockery of the “transit access” measure used by many planning agencies. Being close to a transit stop or station is of little help if service to the desired destination is not available or takes too much time.

    According to the latest American Community Survey data, the average work trip by people driving alone in Portland is 23.6 minutes, while the average transit commute trip is 43.8 minutes.

    Further, Portland transit users could face draconian service reductions. Tri-Met, which operates light rail and most Oregon services, has warned that it may be required eventually to cut 70 percent of its service. This results from the failure to control labor costs, particularly pension costs, which is detailed in an Oregonian article. John Charles, president of the Cascade Policy Institute found that $1.63 all the benefits were being paid out for every dollar of wages, a claim confirmed by PolitiFact. The concern extends to the state capital, where the legislature has overwhelmingly approved a bill requiring an audit of Tri-Met by the Secretary of State.

    Tri-Met continues to expand light rail, but with some “pushback.” An under-construction line to Milwaukie evoked such controversy in Clackamas County, that voters elected an anti-light rail majority to the county commission. Voters have banned light rail expenditures without a public vote in the suburban municipalities of Tigard and King City. Clark County (Washington), voters rejected funding for a light rail connection to the Portland system. This opposition was at the heart of defunding a replacement Interstate 5 bridge over the Columbia River. The project recently closed after spending $175 million (see Project Closing Notice).

    With the investment and expansions, these should have been the halcyon days of transit in Portland. The future could be even more challenging.

  • XpressWest Las Vegas Train: Where are the Venture Capitalists?

    Recently, the US Department of Transportation indefinitely suspended a federal loan application for the XpressWest high-speed rail train from Victorville California to Las Vegas. The only public rationale for the decision was contained in a letter from former Secretary of Transportation Ray LaHood, who cited “buy-America provisions.” Important contents of the letter were not made public (presumably to protect confidential commercial information), but Secretary LaHood indicated that “serious issues” and “significant uncertainties” surrounding the project forced him to suspend “further consideration” of the loan request.

    US Senate Majority Leader Harry Reid of Nevada hopes to resurrect the loan application. However even he is reported to have noted that the White House is “worried about XpressWest obtaining the remaining $1.5-billion in private financing needed to get the train running.”

    That’s just the beginning of the private investment concern. Current reports indicate that the Victorville to Las Vegas line will cost $7 billion to construct, $5.5 billion of which would be provided through a low interest 35 year loan from federal taxpayers, the initial payment on which would be deferred for six years.

    Based upon the experience of high-speed rail programs around the world, it seems virtually inevitable that the Victorville to Las Vegas high-speed rail line would cost much more than $7 billion. All of those additional funds would be the responsibility of private investors, not federal taxpayers.

    International Record of Cost Escalation

    The problem is amply illustrated by   European research on world infrastructure costs.  Oxford professor Bent Flyvbjerg, along with Nils Bruzelius (a Swedish transport consultant) and Werner Rottenberg (University of Karlsruhe and former president of the prestigious World Conference on Transport Research) reviewed 80 years of infrastructure projects and found initial cost estimates to routinely be low (Megaprojects and Risk: An Anatomy of Ambition). They estimated that rail project costs escalation an average 40 percent and that 80 percent cost overruns are not unusual in passenger only rail (Note 1).

    If the Victorville to Los Angeles high-speed rail train would escalate in costs at the average indicated by the research, the cost would rise to $9.8 billion, increasing the private investment share required from $1.5 billion to $4.3 billion. If the cost escalation were to be at the 80% level, the Victorville to Los Angeles high-speed rail train would cost $12.6 billion to build, raising the private investment requirement to $7.1 billion.

    Britain’s Escalating Costs

    The British, who continue to debate building a high speed rail line from London to just north of Birmingham already seen costs rise by nearly 1/3, while experts are predicting the cost will eventually escalate 120 percent or more.

    Obviously, cost escalation at these levels would require additional private capital.

    Nearby California’s Unprecedented High Speed Rail Cost Escalation

    The actual experience of the nearby California high-speed rail line indicates that the results could be substantially worse than indicated in the academic research. Before the California High Speed Rail Authority abandoned plans to build a genuine high-speed rail line from Los Angeles to San Francisco, costs approximately tripled from the original estimates (Note 2).

    A similar tripling of cost escalation on the Victorville to Las Vegas line would take the cost to $21 billion. This would require private capital of $22.5 billion – 15 times as much money as the current $1.5 billion that is apparently difficult to raise.

    Serious Issues and Significant Uncertainties

    Meanwhile, editorialists are raising “serious issues” and “significant uncertainties” about the project.

    The Washington Post: The editorial board of the Washington Post said in a July 18 editorial (entitled “Good riddance to XpressWest, the high-speed boondoogle”) of the XpressWest project: “We’ve seen some bad policy ideas but not many more awful …” The Post continued “What XpressWest struggled to explain was why taxpayers should bet on a proposition that private investors apparently found too risky: hordes of travelers driving to Victorville, parking their cars and then boarding the train for an 80-minute ride to Vegas — as opposed to driving the whole way, flying or taking “My Party Ride,” a limo-like bus trip for up to 30 passengers at $99 each, including food and drinks.” The Post expressed relief that “common sense has prevailed,” though bemoaned the fact that “multiple federal and state agencies had given environmental and regulatory approvals.”

    Las Vegas Review-Journal: The hometown metropolitan daily expressed similar concerns. In a July 18 editorial, the Review-Journal said: “Like most recent rail projects, XpressWest ridership projections were overly optimistic. The train certainly appeared capable of meeting its operational costs, but the idea that it could make good on repaying $5.5 billion in debt on top of that was a stretch. Las Vegas Monorail, anyone?” (Note 3).

    The editorial continued: “The prospect of default on a train loan is too much to ask from a federal government already $17 trillion in debt,” adding, if the federal government “ is serious about “investing” those billions, spend them on improvements to the nation’s interstate system, which carries both passenger and commercial traffic and is in constant use, 24-7. Interstate 15, which runs between Los Angeles and Las Vegas and is heavily congested, could use the money. So could the planned Interstate 11 between Las Vegas and Phoenix.”

    In addition, echoing my, “taxpayer risk assessment,” published by the Reason Foundation, had shown that the cost of expanding Interstate 15 to six lanes between Victorville and the California border would have been a fraction of the high speed rail costs, and would have been largely paid by highway user fees paid by drivers and truckers, and would reduce both traffic congestion, greenhouse gas emissions and energy consumption.

    The editorial concluded: “Improved interstates would speed commerce, create permanent jobs and have billions upon billions of dollars in long-term economic impact across many states. That would be a return on investment. A tourist train on a high-speed trip to bankruptcy? No so much.”

    Where are the Venture Capitalists?

    There is no shortage of venture capital in the United States.The apparently difficulty being encountered in raising sufficient private capital for the project demonstrates that it is even more risky than the standard venture capital projects. The risks for private investors are huge at the $1.5 billion. The risks are even greater at double that number, which has to be considered among the more optimistic potential outcomes.

    Wendell Cox is a Visiting Professor, Conservatoire National des Arts et Metiers, Paris and the author of “War on the Dream: How Anti-Sprawl Policy Threatens the Quality of Life.

    ——

    Note 1: Flyvbjerg et al reviewed 80 years of infrastructure projects found consistent low-balling of cost estimates. They characterize the process as "strategic misrepresentation," which they shorten to "lying," in unusually frank language.

    Note 2: In response to the public outcry, the California High Speed Rail Authority substituted a somewhat less expensive plan that requires high-speed rail to mix with conventional commuter rail trains in San Francisco and Los Angeles operations.

    Note 3: The Las Vegas Monorail was similarly promoted as sufficiently viable to pay its operating and capital costs in the early 2000s. My 2000 analysis projected that ridership would be well below forecast and that the Las Vegas Monorail would eventually default on its debt. That occurred.

  • New Data on Commuting in Canada

    New data from the National Household Survey indicates that driving to work continues to surge in Canada. In addition to providing work access market shares, the National Household Survey provides one-way work trip travel time estimates for all metropolitan areas.

    The National Data

    Between the 2006 census and the 2011 National Household Survey indicates an increase of nearly 750,000 additional work-bound cars on the road. The increase in driving exceeded the overall increase of 585,000 in employment (Figure 1). Transit also experienced a strong increase, adding nearly 230,000 one-way work trip riders. At the same time, there were declines in car pool passengers (266,100), walking and cycling (52,200), and working at home (87,700).

    Driving (whether alone or in a car pool) reached a share of 68.9%, up 2.1 percentage points over the 66.8% registered in the 2006 census. Transit also increased, with its share rising from 10.2% in 2006 to 11.2% in 2011. The big loss was in carpool passengers which dropped from 7.1% to 5.9%. This declining carpool share mirrors the experience in the United States. There were also losses in the combined walking and cycling share, from 7.1% to 6.5% and in the work at home share from 7.7% to 6.9%.

    Overall, the average one-way work trip travel time was 25.4 minutes, not much different than the US average of 25.5 minutes. However, among the major metropolitan areas, travel times generally exceeded those of similarly sized US metropolitan areas (below).

    Major Metropolitan Areas

    The story was similar among the major metropolitan areas (over 1,000,000 population).

    Toronto: In Toronto, now Canada’s dominant metropolitan area, driving (alone or in car pools) increased from 59.4% to 60.2% between 2006 and 2011. Transit also experienced a full one percentage point increase to 21.7%. This transit work trip market share is higher than any other metropolitan area in Canada or the United States, with the exception of New York, at 31.1%). Toronto’s transit market share trails that of Sydney slightly (22.2%), though is much higher than that in Melbourne. Driving and transit took virtually all of their increase from a 1.9 percentage point loss in carpool passengers.

    Toronto’s one way work trip travel time was 32.8 minutes, which is longer than all other major metropolitan areas and exceeded in the New World only by Melbourne (36 minutes), New York (34.9 minutes), Washington (34.5 minutes), and Sydney (34 minutes). Toronto’s work trip travel time is longer than that of larger Los Angeles (28.6 minutes), as well as similarly-sized Dallas-Fort Worth (26.6 minutes) and Houston (27.7 minutes).

    Montréal: Montréal, the nation’s second-largest metropolitan area experienced a 1.2 percentage point increase in driving, while transit rose 0.7 percentage points. Montréal had the largest decline in carpool passengers among major metropolitan areas, falling from 4.7% in 2006 to 3.2% in 2011.

    Montréal’s average one-way work trip travel time was 29.7 minutes, also longer than the Los Angeles metropolitan area, which has more than three times as many residents. Among the 12 US metropolitan areas between 2,500,000 and 5,000,000 population, only Baltimore (30.3) and Riverside-San Bernardino (31.0) have longer work trip travel times than Montréal.

    Vancouver:Vancouver was the only major metropolitan area with the decline in driving, from 61.7% to 60.9%. Vancouver also had the highest transit market share increase, from 15.1% to 18.2%. Vancouver experienced a huge (1.9 percentage point) loss in carpool passengers and a strong loss in working at home (0.8 percentage points).

    The average work trip travel time in Vancouver was 28.4 minutes. This is nearly equal to that of Los Angeles (28.6 minutes), despite the fact that Los Angeles is nearly five times as large. Vancouver, with a population of 2.3 million has a longer work trip travel time than any US major metropolitan area under 2,500,000 population.

    Ottawa:Ottawa, which includes suburbs in Quebec (across the Ottawa River), experienced the 1.4 percentage point increase in driving and a 0.7% increase in transit use. Ottawa’s transit market share ranks third in the nation. The driving and transit gains were also largely at the expense of carpool passenger and working at home losses. The one-way work trip travel time was 26.3 minutes.

    Calgary:Among the major metropolitan areas, Calgary experienced the largest increase in driving, a 2.7 percentage point increase, from 64.2% to 66.9%. This is the second largest driver market share among the major metropolitan areas. Transit was up a modest 0.4 percentage points, while the share of carpool passengers dropped 1.9 percentage points. Working at home declined by 0.9 percentage points. The one-way work trip travel time was 27.0 minutes, longer than any US metropolitan area in the 1,000,000 to 2,500,000 population category.

    Edmonton:Driving increased 2.1 percentage points from 2006 to 2011 in Edmonton, from 70.5% to 72.6%. Edmonton had the highest driver market share in the nation. Transit was up 1.6 percentage points. Car pool passengers declined 2.2 percentage points and working at home declined 0.7 percentage points. Edmonton’s one-way work trip travel time was 25.6 minutes, the shortest among the major metropolitan areas. Work trip travel in Edmonton takes somewhat longer than the average of 24.5 minutes for US metropolitan areas with from 1,000,000 to 2,500,000 million residents

    Medium Sized Metropolitan Areas

    Five of Canada’s metropolitan areas have between 400,000 and 1,000,000 residents (Quebec, Winnipeg, Hamilton, Kitchener and London). Overall, these areas experienced a 1.9 percentage point increase in driver market share, to 72.4%. Transit was up 0.6%age points to 9.3%. Driving and transit experienced market share gains in each of the five metropolitan areas. As among the major metropolitan areas, the driver and transit gains were principally from losses in car pool passengers. Work trip travel times were below the national average in all but Hamilton.

    Travel Time by Mode

    At the national level, automobile drivers had an average work trip of 23.2 minutes, while transit commuters spent nearly 20 minutes more (42.2 minutes). Transit’s relative travel times were better in the major metropolitan areas, all of which have rapid transit or light rail lines to downtown (25.6 minutes for solo drivers and 41.6 minutes for transit). Even so, the average transit commuter spends nearly two-thirds more time on the way to work than solo automobile commuters (Figure 2)

    Transit’s Market Share

    Among the six major metropolitan areas, five (Toronto, Montréal, Vancouver, Ottawa, and Calgary) have transit market shares greater than all other New World (Australia, Canada, New Zealand, and the United States) major metropolitan areas with the exception of New York and Sydney (Figure 3).

    Policy Implications

    Major metropolitan areas in Canada have made substantial transit investments (see: Improving the Competitiveness of Metropolitan Areas) in recent years and have seen a strong escalation of operating subsidies (Figure 4). These expenditures did not prevent the substantial increase in driving. Transit’s increase was less than the decrease in car pool passengers. It is possible that many car pool passengers switched to transit, however any such diversion would not have had any impact on the number of cars on the road, but would have only reduced the number of passengers. Driving was up in all the major metropolitan areas, even Vancouver. This seems likely to have increased traffic congestion, which is already substantially worse in Canada than in the United States, though better than in Australia and New Zealand (Note).

    A principal reason for the increased transit investment has been to reduce greenhouse gas emissions (GHG emissions). However, that impetus is weakening. Canada is adopting strong vehicle emissions standards, virtually identical to the US regulations projected to lead to a huge GHG emissions reduction, even as driving volumes continue to increase (Figure 5). Similar progress seems likely in Canada (projections for Canada are not yet available).

    Table
    Canada: Commuting Market Share: 2006-2011
    2011: National Household Survey Driver Car Pool Passenger Transit Bike Or Walk Other Work at Home
    Major Metropolitan Areas
    Toronto, ON 60.2% 5.1% 21.7% 5.3% 1.0% 6.7%
    Montréal, QC 62.5% 3.2% 20.9% 6.7% 0.8% 6.0%
    Vancouver, BC 60.9% 4.6% 18.2% 7.5% 1.3% 7.6%
    Ottawa, ON-QC 60.0% 6.3% 18.9% 8.0% 0.9% 5.8%
    Calgary, AB 66.9% 5.1% 14.9% 5.7% 1.3% 6.2%
    Edmonton, AB 72.6% 5.2% 10.7% 4.9% 1.3% 5.3%
    Metropolitan Areas: 400,000-1M
    Quebec, QC 72.7% 3.9% 10.8% 7.1% 0.7% 4.8%
    Winnipeg, MB 67.9% 6.9% 12.8% 6.8% 1.3% 4.3%
    Hamilton, ON  73.0% 6.2% 8.7% 5.0% 0.9% 6.2%
    Kitchener, ON 77.0% 6.4% 5.1% 5.2% 0.9% 5.5%
    London, ON 73.4% 6.3% 6.4% 6.4% 0.8% 6.6%
    Major Metropolitan Areas 62.5% 4.6% 19.3% 6.2% 1.0% 6.4%
    Metropolitan Areas: 400,000-1M 72.4% 5.8% 9.3% 6.2% 0.9% 5.3%
    Balance of Canada 75.3% 5.8% 2.8% 7.0% 1.4% 7.8%
    National Total 68.9% 5.2% 11.2% 6.5% 1.2% 6.9%
    2006: Census Driver Car Pool Passenger Transit Bike Or Walk Other Work at Home
    Major Metropolitan Areas
    Toronto, ON 59.2% 7.0% 20.7% 5.4% 0.9% 6.9%
    Montréal, QC 61.3% 4.7% 20.1% 6.9% 0.8% 6.2%
    Vancouver, BC 61.7% 6.5% 15.1% 7.3% 1.1% 8.4%
    Ottawa, ON-QC 58.6% 7.5% 18.2% 8.3% 0.8% 6.6%
    Calgary, AB 64.2% 7.0% 14.5% 6.2% 1.0% 7.1%
    Edmonton, AB 70.5% 7.4% 9.1% 5.9% 1.1% 6.0%
    Metropolitan Areas: 400,000-1M
    Quebec, QC 70.7% 5.1% 9.7% 8.2% 0.7% 5.5%
    Winnipeg, MB 66.2% 8.4% 12.3% 7.1% 0.8% 5.1%
    Hamilton, ON  71.4% 8.0% 8.2% 5.5% 0.8% 6.2%
    Kitchener, ON 73.9% 8.9% 4.5% 6.3% 0.7% 5.7%
    London, ON 70.7% 8.5% 6.3% 7.2% 0.9% 6.4%
    Major Metropolitan Areas 61.4% 6.4% 18.1% 6.4% 0.9% 6.8%
    Metropolitan Areas: 400,000-1M 70.3% 7.6% 8.7% 6.9% 0.8% 5.7%
    Balance of Canada 71.6% 7.7% 2.3% 7.9% 1.4% 9.1%
    National Total 66.8% 7.1% 10.2% 7.1% 1.1% 7.7%
    From Statistics Canada data


    Wendell Cox is a Visiting Professor, Conservatoire National des Arts et Metiers, Paris and the author of “War on the Dream: How Anti-Sprawl Policy Threatens the Quality of Life.

    ——————–
    Note: The INRIX Traffic Scorecard indicates that the average time lost in Canada’s traffic congestion was more than double the US rate (average delay of 15.6%, compared to 6.6% in the United States) in 2012. New data from Tom Tom indicates that traffic congestion is worse in Australia and New Zealand than in Canada.

    Photo: Montreal Centre-Ville (downtown)